

Abstract
In west Eugene (Oregon), community research indicates residents are disproportionately exposed to industrial air pollution and exhibit increased asthma incidence. In Carroll County (Ohio), recent increases in unconventional natural gas drilling sparked air quality concerns. These community concerns led to the development of a prototype mobile device to measure personal chemical exposure, location, and respiratory function. Working directly with the environmental justice (EJ) communities, the prototype was developed to 1) meet the needs of the community and 2) evaluate the use in EJ communities. The prototype was evaluated in three community focus groups (n = 25) to obtain feedback on the prototype and feasibility study design to evaluate the efficacy of the device to address community concerns. Focus groups were recorded and qualitatively analyzed with discrete feedback tabulated for further refinement. The prototype was improved by community feedback resulting in eight alterations/additions to software and instructional materials. Overall, focus group participants were supportive of the device and believed it would be a useful environmental health tool. The use of focus groups ensured that community members were engaged in the research design and development of a novel environmental health tool. We found that community-based research strategies resulted in a refined device as well as relevant research questions, specific to the EJ community needs and concerns.
Introduction
Environmental hazards are often identified by communities based on anecdotal evidence and grass-roots work.1 Partnerships between communities and universities are mutually beneficial, and can advance environmental health research by collecting empirical data to expand existing anecdotal evidence. Multiple factors enhance university-community partnerships. Key amongst these are trust and considerations of access into the community,1 which can be accomplished with the identification of key community contacts.
Beyond Toxics (BT), a 501(c)(3) environmental justice (EJ) community organization, has identified west Eugene as an EJ community, based on diminished access to educational materials and public decision-making processes, an increased percentage of minority and low-income residents, and exposure to disproportionate levels of air pollution relative to other areas of the City of Eugene.2 Relative to the 7.7% of Hispanic/Latino individuals living in Eugene, 12.7% live in west Eugene, where the median household income is $38,414 versus $42,167 for all of Eugene.3,4 Of the air toxics emitted in Eugene, 99% are sourced in the 97402 zip code, the borders of which define west Eugene.2 Initial work by BT was completed with an Environmental Protection Agency Environmental Justice grant where community surveys identified air pollution from industrial and transportation sources as a predominant environmental health concern.2 Additional preliminary analyses compared self-reported asthma in schoolchildren and found elevated rates in west Eugene.2,5 Prior research has shown a correlation between exposure to industrial air pollution and asthma.6 Specifically exposure to phenanthrene, a volatile organic chemical (VOC), was correlated with increased wheezing amongst children.7 To further this research, the community partnered with Oregon State University (OSU).
Communities in Carroll County, Ohio are experiencing the rapid expansion of unconventional natural gas drilling (UNGD). As of January 10, 2015, over 1,822 permits have been issued for horizontal drilling in Ohio.8 Of those, over 450 are located in Carroll County.6 Carroll County is a rural, low-income community with a median household income of $43,779 versus $48,308 across Ohio.3 Carroll Concerned Citizens (CCC), a 501(c)(3) community organization, formed in response to concerns regarding UNGD and water quality. CCC and the University of Cincinnati (UC) were jointly developing a research agenda for the community. Water and air quality were leading issues of concern. Air quality is a concern shared by other communities similarly impacted by UNGD.9,10 Preliminary research indicates that a wide range of VOCs are emitted from UNGD sources9,11,12 and health studies indicate increased respiratory conditions.13 Therefore, to evaluate the potential impacts of UNGD on air quality, CCC and UC collaborated with OSU.
Both communities supported the development of a device that could be used to evaluate exposure to air pollution, location, and lung function. Exposure assessments can be difficult and often rely on bulky, heavy active samplers or discrete measurement of biologic samples, which are often combined with questionnaires and secondary data to reconstruct exposure probabilities.14–17 There is a need for portable devices that can be used by communities to easily and accurately capture time-integrated exposures in tandem with location and health measures.18 Within this study, the goal was to work with communities to develop a device that would address concerns while also providing robust, accurate data regarding air pollution and respiratory health.
An interdisciplinary team of OSU researchers in the Environmental Health Sciences Center (EHSC) developed a device (Figure 1) designed to perform the following three functions while remaining small and portable: 1) quantitatively evaluate exposure to semi-volatile organic compounds (SVOC), 2) record spatial location, and 3) assess respiratory function.
FIG. 1.
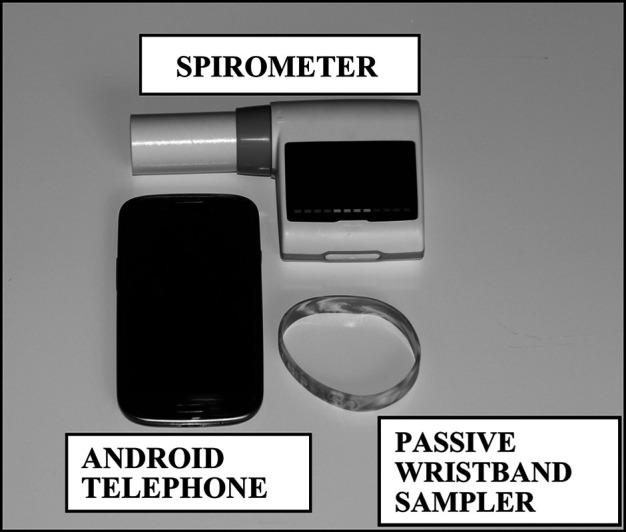
The ELF (exposure, location, lung function) device is comprised of passive wristband sampler, an Android mobile phone with the ELF Tracker app and a portable spirometer.
The ELF device (exposure, location, lung function) was evaluated during focus groups moderated by the OSU EHSC in west Eugene and, with UC, in Carroll County. Focus group methodology has been previously used in EJ communities to gather information about perceptions of environmental health.19–22 Focus groups ensure research is community-driven and culturally appropriate and that results are disseminated in useful terms. These are all integral principles of community-based participatory research (CBPR).23 Feedback from these focus groups resulted in an improved device and refined research questions, which have influenced future research using this technology.
Methods
Study population
Participants were recruited from west Eugene, OR (97402 zip code) and Carroll County, OH. Participation was limited to adults over age 18 who were residents of west Eugene or Carroll County. Participants represented a range of age, employment, and ethnicity (Table 1).
Table 1.
Demographic Profile of Focus Group Participants
| West Eugene OR | Carroll County, OH | |
|---|---|---|
| Number of participants | 18 | 7 |
| Average age (years) | 46.3 | 57.7 |
| Median age | 48 | 58.5 |
| Minimum age | 23 | 50 |
| Maximum age | 76 | 64 |
| Gender | ||
| Number male participants | 6 | 3 |
| Number female participants | 12 | 4 |
| % participants employed | 58.8% | 71.4% |
| Race | ||
| White | 12 | 7 |
| Black/African American | 1 | 0 |
| Native American/Other Pacific Islander | 1 | 0 |
| Multiracial | 1 | 0 |
| No response | 3 | 0 |
| Ethnicity | ||
| Hispanic or Latino | 3 | 0 |
| Not Hispanic or Latino | 10 | 1 |
| No response | 5 | 6 |
All work was approved by the Institutional Review Boards at OSU and UC. Participants filled out informed consent prior to participation, available in English and Spanish (OR only). No identifying information was collected.
The OSU and UC research teams communicated regularly with BT and CCC via telephone, e-mail and in-person meetings to revise and finalize research proposals related to this study. Additionally, research staff attended BT and CCC board and community meetings to discuss the study design and request input regarding the proposed work.
Focus group procedures
Recruitment was performed through our community partners, using a purposive sampling technique. As our goal was to develop a device designed to address existing environmental justice issues in the community, we desired participants with prior knowledge of the air quality and health concerns.
Recruitment in west Eugene was a three-part process, with fliers available online at the BT website, an OSU and BT radio interview, and in-person recruitment by BT. BT recruiters were paid an hourly rate in recognition of their time. Recruitment materials were available in both Spanish and English, and one focus group was bilingual. Recruitment for the focus group held in Carroll County, OH was conducted by the president of the CCC via word of mouth and the CCC list serve.
Focus groups were held in easily accessible public forums, refreshments were provided, and sessions lasted no longer than 90 minutes. Moderators used a discussion guide patterned after recommended best practices.24–27 Participants were considered eligible if they arrived at the publicized meeting place and indicated their eligibility (west Eugene, n = 20; Carroll Co., n = 7). Of those considered eligible, two participants chose not to consent (west Eugene), and did not participate in the focus groups. Two focus groups were held in west Eugene, OR in November 2013 (n = 18). The moderator for the bilingual focus group was a native Spanish speaker, as was the team member performing translations. The translator used “meaning–based translation” to accommodate differences in grammar and cultural context.28 A third focus group was held in Carroll County, OH in May 2014 (n = 7).
Moderators asked open-ended questions (Table 2) supplemented with Likert scales (Table 3). Participants were able to wear and use the ELF and ELF Tracker before rating it. Participants also evaluated a proposed feasibility project, wherein two community members would use the device in their daily lives. Revisions to the ELF and ELF Tracker were iterative, with revisions made following the Oregon focus groups and prior to the Ohio focus groups.
Table 2.
Questions Posed by the Moderator During Structured Discussion
| Questions regarding design of the ELF and ELF Tracker |
|---|
| Are there any questions about the wristbands/mobile phone/spirometer? |
| - Wristbands? |
| - Android phone? |
| - Spirometer? |
| Do you have any suggestions about the look and usability of the app? |
| Questions regarding the proposed feasibility study |
|---|
| What do you think about this plan? |
| What would you do differently? |
| What do you think we will find? |
Table 3.
Results of Rating the Passive Wristband Sampler, Mobile Spirometer, and Cellular Phone
| West Eugene, OR | Average (range) | n |
|---|---|---|
| Please rate how comfortable it is to wear the wristband | 8.6 (3–10) | 17 |
| Rate the ease of use of the spirometer | 7.7 (3–10) | 16 |
| Yes/No | n | |
| Would you wear a wristband for a week? | 16/1 | 17 |
| Would you carry this phone for a week? | 15/2 | 17 |
| Carroll County, OH | Average (range) | n |
|---|---|---|
| Please rate how comfortable it is to wear the wristband | 8.9 (8–10) | 7 |
| Rate the ease of use of the spirometer | 7.0 (5–8) | 7 |
| Yes/No | n | |
| Would you wear a wristband for a week? | 7/0 | 7 |
| Would you carry this phone for a week? | 6/0 | 6 |
Focus group participants were asked to rate the passive wristband sampler (PWS) and the mobile spirometer using a Likert scale. When asked to rate the comfort of the wristband, 1 = very uncomfortable, while 10 = very comfortable. When rating the ease of use of the spirometer, 1 = very difficult, 10 = very easy. Participants were also asked to assess the use of the ELF and ELF Tracker in their daily lives, answering if they would wear/carry the wristband and cell phone continuously, as discussed in the pilot project.
The mobile device
The ELF combines a passive wristband sampler (PWS) developed by environmental chemists (KAA),29 an Android phone with a specialized application (ELF Tracker; C.S.), data management systems at the Pacific Northwest National Laboratory (PNNL; KMW) and a portable spirometer. Combined, it weighs less than 0.6 pounds and is stored in a convenient carrying case.
ELF Tracker app
The Android phone measures 5¼×2¾×¾ inches and weighs 4.7 ounces. The ELF Tracker app was developed to be installed on any Android device with Bluetooth and global system for mobile communication (GSM) networking capabilities. The app has three main functions: 1) recording spatial location, 2) obtaining spirometry data, and 3) transmitting data to the cloud. The app monitors physical location (latitude and longitude) using global positioning system (GPS) data and switching to network-based tracking when a GPS signal is unavailable. To obtain spirometry data, the phone is securely paired with the spirometer via Bluetooth. The app provides user instructions for using the spirometer. After a spirometry reading, the user touches a button in the app to trigger data retrieval from the spirometer, which is stored with location data in files on the Android in stable flash memory. When network access is available, the app transmits the data via https to PNNL servers, simultaneously removing the data from the local files on the Android. No personally identifiable data are retained on PNNL servers. To protect privacy, locations (GPS- or network-based) are rounded to an approximate 0.1 mile precision.
Portable spirometer
The Spirotel® spirometer (Medical International Research; eHealth mini-Lab, v1) measures 3½ × 3½ × 1½ inches, uses a rechargeable battery, and weighs 4.9 ounces. Each spirometer was calibrated prior to the feasibility study and upon return with a 3-liter volume calibration syringe (Hans Rudolph Inc.; Kansas City, MO). Repeated measures demonstrated values were within 5%.
The Spirotel® can be used as a spirometer or oximeter. For the spirometer function, users insert a disposable mouthpiece and follow on-screen prompts to concurrently measure the forced expiratory volume in the first second (FEV1), force vital capacity (FVC), and peak expiratory flow (PEF). The date and time of the test is logged. If a Bluetooth connection is unavailable, the spirometer has the capacity to store the data from thousands of tests which can be uploaded via USB 2.0 at a later date.
Passive wristband sampler (PWS)
The PWS has been previously described.29 Worn like a bracelet, the silicone wristband passively absorbs VOCs and SVOCs, including polycyclic aromatic hydrocarbons, semi-volatile pesticides, and personal care products, producing a time-weighted, vapor-phase concentration.29
Feasibility study
As presented at focus groups, it was proposed that two participants from each community would test the ELF for one week. Participants would wear a different PWS each day, plus one continuously (Figure 2). The mobile phone and spirometer would be carried at all times, using the spirometer to take three readings a day (morning, afternoon, night) to capture daily fluctuations of lung function. It was proposed that each spirometry reading be taken in triplicate to assess reliability of the device and capture the best measurement of lung function. Details and results from this study are presented elsewhere.
FIG. 2.

Study protocol for the feasibility study. Focus group participants evaluated and provided feedback on the proposed study design, wherein two members from each community would use the ELF for seven days, wearing a different passive wristband sampler (PWS) each day, plus one continuously. In addition, the user would carry the mobile phone and the spirometer with them at all times, using the spirometer to take three readings (morning, afternoon and night) each day.
Data analysis
Focus groups were audio-recorded and transcribed. All identifying information was removed from documents and audio transcriptions. A native Spanish-speaker transcribed and translated the Spanish audio recordings, using meaning-based translation.23 Participant ratings were tabulated. Descriptive statistics are presented in table form.
Results
As the themes followed specific questions and prompts from the script (Table 2), qualitative data is presented under subheadings related to the subject matter.
Feedback on the mobile device
Both the PWS and spirometer were highly rated for comfort and ease of use (Table 3). Feedback on the ELF Tracker app was compiled and a complete list of suggestions to improve the app, as well as the changes made in response to those concerns, is detailed in Figure 3 and Table 4. Feedback from the west Eugene focus groups was used to develop a second iteration of the device, which was then evaluated in Carroll County.
FIG. 3.

ELF Tracker app developed by Oregon State University. (A) Initial prototype. On the top left, a screenshot from the opening page of the ELF Tracker app, detailing the recent global positioning system (GPS) coordinates and data transmissions. The instruction page could be accessed by tapping the [+] button at the top right of the first screen. (B) Secondary prototype following west Eugene focus groups. Sequential screenshots before, during and after successful data transmission from the spirometer to the phone. (C) Third prototype following Carroll County focus groups. Sequential screenshots before, during and after successful data transmission from the spirometer to the phone. Note changes to the color of the buttons, and the text in the transmission sequences. A progress bar was added to track the number of spirometry replicates recorded.
Table 4.
Community Feedback on the Design of the ELF device and ELF Tracker app
| West Eugene Focus Groups (n = 18) | ||
|---|---|---|
| Issue | Suggestion(s) if applicable | Changes to the application |
| Application interface: | ||
| How do you trigger the test from the opening page? | Add a label … something like “click here to start” | The instruction page opens first |
| The log of data is confusing | Keep the data log, but it should not be the opening page | The instruction page is now the main page |
| Why does it say “asthma”? | This makes it seem like only asthmatics can use the device. | Replaced with “Spirometer Transmission Status” |
| Data transmission: | ||
| How do you know your data was successfully transmitted? | It would be helpful if the grey button changed to green. | Grey button changed to a red button. When the test is completed the user clicks the red button, which turns yellow as data is transmitted and then green when data is successfully sent. |
| Usability of the device: | ||
| The text is not in Spanish | Include a Spanish version of the app | Spanish text is included alongside the English text |
| Push notifications are too passive | Notifications programmed into the cell phone alarm | |
| Keeping track of spirometry tests | Include a counter on the cell phone | |
| How to use the spirometer | Put an instructional video on the phone | Written instructions currently available |
| [In Eugene] you simply don't wear orange (wristband; color of rival school) | Have different colors | Wristbands now available in 5 colors |
| Carroll County focus group (n = 7) | ||
|---|---|---|
| Issue | Suggestion(s) if applicable | Changes made |
| Application interface: | ||
| The button stays green when you are done. I was going to sit here and wait for it to go back to red. | It should go back to red, since that means the test is done. | The starting button is now blue, which changes to yellow (transmission), then green (successful transmission), and changes back to blue when test is complete. |
| Why is the text on the colored buttons the same? | The wording for the yellow button should say “transmitting” and the wording for the green button should say “test complete” | The text has been updated to state the progress of the data transmission. |
| How do I contact [the study coordinator] if I need help? | Include the study coordinator's phone number on the instruction page | The phone number for the study coordinator is now listed as an icon on the cell phone home page (and identified in an user's guide), as well as in all instructions. |
| Data transmission: | ||
| Cell phone reception out here is not good. | You have to have [specific cell provider] out here! | Note: The phones were using the local provider that had the best coverage but should be considered for studies in different regions. |
| When you're out of service the phone will shut down to preserve battery life and transmit data later? | Provide a car charger | Future studies will include optional car chargers |
| It took a long time for the spirometer to display results | Write in the instructions that it can take up to 10 seconds for the spirometer to display data | Instructions updated to clarify that there may be a lag time between when the test finishes, and when results are displayed |
| Usability of the device: | ||
| How do you reset the spirometer to take another test? | On the app, add “Step 5: click the right arrow on the spirometer to reset.” | See below for changes to written instructions |
| Simplify terminology | Change the instructions to read “breath in (inspire) and breath out (expire)” | See below for changes to written instructions |
| Tracking spirometry tests | Include a progress bar | A progress bar was added to show how many tests have been completed. |
| ELF Tracker instructions: | ||
| Terminology not consistent, not sure what to do if a mistake is made | Include a trouble-shooting guide, and an instruction sheet to show how to use the cell-phone, geared towards new cell-phone users. | “The ELF Tracker: A Users Guide” was created showing step-by-step instructions on how to navigate the cell phone, as well as how to use the app and how to set and change the scheduled spirometry reminders. |
West Eugene participants found the log of events difficult to interpret (Figure 3A), and could not determine if spirometry data had been appropriately transmitted. Additionally, instructions were not available in Spanish (Table 4).
When asked to view the ELF as a tool to capture and analyze chemical exposure with lung function, participants responded favorably.
“If you can actually track what is going on from parts of the city to other parts I think it's going to give us a whole lot more insight into what's being dumped into the west side.” [West Eugene]
“The interesting thing about this particular combination seems to be you get a chance to track the individuality of it. You get a chance to get a little more personal.” [West Eugene]
The second iteration of the ELF prototype was evaluated in Carroll County, OH, with participants finding it easy to use (Table 3). The revised transmission sequence (Figure 3B) received positive feedback, supplemented with suggestions to make it more intuitive regarding successful completion of tests (Figure 3C). The majority of the feedback concerned consistent, useful instructional materials to make the ELF Tracker more user-friendly and intuitive, such as including a counter to track the spirometry replicates (Table 4).
In summary, participants were intrigued by the possibility of the ELF to expand their knowledge of air quality in a region with heavy UNGD, and potential effects on respiratory health.
“One of the things you're going to find out, if this bracelet has the capacity to absorb all these different chemicals, you are going to get a pretty good idea of what's passing through the community.” [Carroll County]
Feedback on the feasibility project
The moderator requested input and feedback on the feasibility study design, wherein two individuals from each community would use the ELF for seven days.
“Would there also be a sample group taken, say, in other parts of Eugene that aren't around industrial areas as a comparison?” [West Eugene]
“Does it matter if someone for instance goes to the beach for a day to a different city?” [translated, West Eugene]
“Right now with the air kind of socked in we get kind of different air quality here now as opposed to the summer. It might be a good opportunity for you to try something in the summer as well or in those months when it's clear because it is different.” [West Eugene]
“Go to a community that is not experiencing this kind of development. Carroll County is a unique county that doesn't have any four-lane highways … you can find a lot of townships that aren't exposed to four-lane highways … that can be used as an offset, you know what we are experiencing compared to them.” [Carroll County]
Overall, participants were supportive of using the ELF to measure location, respiratory health, and exposure to air pollution, believing it would address their environmental health concerns.
“I think you could go beyond a week, you're talking about someone who is motivated, who's saying ‘I believe in [the project], I want to do it.’” [Carroll County]
Discussion
The National Institute of Environmental Health Sciences (NIEHS) established the CBPR program to create partnerships between universities and communities to promote participation in environmental health research design and implementation.30 Here, focus groups incorporated community concerns into the development of a community tool and associated feasibility study to advance environmental health science.
Air pollution monitoring technologies are beginning to shift towards technologies that can be used by or with communities to both raise awareness and advance scientific research.9,21,31 Several air sampling devices have been developed for community use, but are often limited by their need for power, connectivity, or offer limited analysis and are not tailored to the needs of the community.32 Furthermore, these devices are not linked to concurrent measures of health, relying instead on questionnaires or log sheets.9,13 It was our goal here to provide a device prototype that was tailored to the community and to then facilitate mechanisms for the community to refine the device to improve functionality and usability.
Working with BT and CCC provided a unique insight into the use of the ELF as a tool for communities with different environmental health concerns (industrial versus UNGD). The focus groups allowed researchers to initiate discussions in a structured manner. This was important, as community members wanted to discuss additional concerns unrelated to the proposed project. One of the challenges faced by the research team was keeping conversations relevant while also serving as an environmental health resource.
Here, both communities found the ELF to be a useful tool to address their air pollution and health concerns. Overall, feedback centered on clear communication of completion and transmission of location and spirometry data. This was important to participants as they were invested in the purpose of the study, and wanted to ensure that appropriate, useable data were collected. This desire to obtain useable data is often a strong motivating factor for participation in community-engaged studies, especially when it is a study wherein results would be returned to participants.33 This motivation may also underlie the request for improved instructional materials. The participants' interest in the purpose of the study and associated data could signal the potential to drive more extensive user involvement by providing community members with access to some of the data collected. It is important to note that the participants in this study were recruited through an active community partner and most likely had prior knowledge of existing environmental justice issues in their community, and were therefore additionally motivated to participate in studies designed to address these issues.
Partnering with communities not only refines the scientific robustness of a monitoring tool such as the ELF, it can also ensure research is appropriate to the community and refine proposed study designs.10,34 For example, the west Eugene community raised a concern regarding the wristbands, which were representative of OSU school colors. Several participants remarked that they would prefer wristbands with their school colors, as they are involved with their school through sports or employment. This seemingly trivial issue was determined to influence participation and compliance. The wristbands are now available in five colors. Aligning the goals of the research study within the specific cultural environment of the partner community is a valuable benefit for CBPR studies.34
The ultimate benefit of using focus group methodology was increasing the relevance of the ELF and identifying pertinent research questions.23 For example, community members expressed their concern that air pollution varied seasonally. This variable has been included in future research.
Conclusions
In sum, CBPR approaches resulted in tangible accomplishments via improvements to the ELF and ELF Tracker and increased relevance and scope of environmental health research. This approach led to the successful recruitment for a feasibility study, wherein two members from each community tested the ELF (manuscript in preparation). Importantly, both communities remain invested in the project and open to continued collaborations.
Acknowledgments
The authors would like to acknowledge Eric Coker for his work with Beyond Toxics to identify community needs. We would like to thank Katalina Herrera, Andrés Cardenas, Gabriela Escutia, Sarah Elam, and Blair Paulik for their contributions to the engagement of communities and the ELF development focus groups.
Furthermore, the authors acknowledge the services of the Integrated Health Sciences Core Facility, Community Outreach and Engagement Core, and the Pilot Projects of the Environmental Health Sciences Center, Oregon State University, grant number P30ES000210, National Institute of Environmental Health Sciences, National Institutes of Health, as well as the Community Outreach and Engagement Core of the Center for Environmental Genetics, University of Cincinnati, grant number P30ES006096, National Institute of Environmental Health Sciences, National Institutes of Health. Pacific Northwest National Laboratory is a multi-program national laboratory operated by Battelle for the U.S. Department of Energy under Contract DE-AC05-76RL01830.
Author Disclosure Statement
Kim Anderson, Kevin Hobbie, and Diana Rohlman disclose a financial interest in MyExposome, Inc., which is marketing products related to the research being reported. The terms of this arrangement have been reviewed and approved by Oregon State University in accordance with its policy on research conflicts of interest. The other authors have no conflicts of interest or financial ties to disclose.
References
- 1.Brown P., “Qualitative Methods in Environmental Health Research.” Environ Health Perspect, 2003. 111: 1789–1798 [DOI] [PMC free article] [PubMed] [Google Scholar]
- 2.Guzman A. and Arkin L., Environmental Justice in West Eugene: Families, Health and Air Pollution. 2013 [Google Scholar]
- 3.United States Census Bureau, “2009–2013 American Community Survey 5-Year Estimates, Table DP03,” in American Community Survey
- 4.United States Census Bureau, “2009–2013 American Community Survey 5-Year Estimates, Table DP05,” in American Community Survey
- 5.Coker E., et al. “Using Public School Enrollment Records for Examining Asthma in School Children in Eugene, OR.” in Environmental Health Disparities and Environmental Justice. 2013. Research Triangle Park, NC: National Institute of Environmental Health Sciences [Google Scholar]
- 6.Karimi P., Peters K.O., Bidad K., and Strickland P.T., “Polycyclic Aromatic Hydrocarbons and Childhood Asthma.” Eur J Epidemiol, 2015. 30(2): 91–101 [DOI] [PubMed] [Google Scholar]
- 7.Gale S.L., et al. , “Polycyclic Aromatic Hydrocarbon Exposure and Wheeze in a Cohort of Children with Asthma in Fresno, CA.” Journal Expo Sci Environ Epidemiol, 2012. 22(4): 386–92 [DOI] [PMC free article] [PubMed] [Google Scholar]
- 8.Oil and Gas Resources. Shale Well Drilling & Permitting. 2014. <http://oilandgas.ohiodnr.gov/shale#SHALE>. (Last accessed January23, 2015)
- 9.Macey G.P., et al. , “Air Concentrations of Volatile Compounds Near Oil and Gas Production: A Community-based Exploratory Study.” Environ Health, 2014. 13: 82. [DOI] [PMC free article] [PubMed] [Google Scholar]
- 10.Korfmacher K.S., Elam S., Gray K.M., Haynes E., and Hughes M.H., “Unconventional Natural Gas Development and Public Health: Toward a Community-informed Research Agenda,” Rev Environ Health, 2014. 29(4): 293–306 [DOI] [PMC free article] [PubMed] [Google Scholar]
- 11.Brown D.R., Lewis C., and Weinberger B.I., “Human Exposure to Unconventional Natural Gas Development: A Public Health Demonstration of Periodic High Exposure to Chemical Mixtures in Ambient Air.” J Environ Sci Health A Tox Hazard Subst Environ Eng, 2015. 50(5): 460–72 [DOI] [PubMed] [Google Scholar]
- 12.Paulik L.B., et al. , “Impact of Natural Gas Extraction on PAH Levels in Ambient Air.” Environ Sci Technol, 2015. 49(8): 5203–10 [DOI] [PMC free article] [PubMed] [Google Scholar] [Retracted]
- 13.Rabinowitz P.M., et al. , “Proximity to Natural Gas Wells and Reported Health Status: Results of a Household Survey in Washington County, Pennsylvania.” Environ Health Perspect, 2015. 123(1): 21–6 [DOI] [PMC free article] [PubMed] [Google Scholar]
- 14.Allan I.J., et al. , “A ‘Toolbox’ for Biological and Chemical Monitoring Requirements for the European Union's Water Framework Directive.” Talanta, 2006. 69(2): 302–322 [DOI] [PubMed] [Google Scholar]
- 15.Anderson K.A. and Hillwalker W.E., “Bioavailability,” in Jorgensen S.E. and Fath B.D., eds. Encyclopedia of Ecology. 2008, Oxford: Elsevier. 348–357 [Google Scholar]
- 16.Alexander M., “Aging, Bioavailability, and Overestimation of Risk from Environmental Pollutants.” Environ Sci Technol, 2000. 34(20): 4259–4265 [Google Scholar]
- 17.Walker C.H., et al. , “The Fate of Organic Pollutants in Individuals and in Ecosystems,” in Principles of Ecotoxicology. 2001, New York, NY: Taylor & Francis Inc. 59–89 [Google Scholar]
- 18.Loose C., “NIEHS and Partners Issue Challenge to Innovators,” Environmental Factor, July 2012. Bethesda, MD: National Institutes of Environmental Health Sciences [Google Scholar]
- 19.Scammell M.K., et al. , “Tangible Evidence, Trust and Power: Public Perceptions of Community Environmental Health Studies.” Soc Sci Med, 2009. 68(1): 143–153 [DOI] [PMC free article] [PubMed] [Google Scholar]
- 20.Downs T.J., et al. , “Participatory Testing and Reporting in an Environmental-Justice Community of Worcester, Massachusetts: A Pilot Project.” Environ Health, 2010. 9: 34. doi: 10.1186/1476-069X-9-34 [DOI] [PMC free article] [PubMed] [Google Scholar]
- 21.Haynes E.N., et al. , “Developing a Bidirectional Academic-Community Partnership with an Appalachian-American Community for Environmental Health Research and Risk Communication.” Environ Health Perspect, 2011. 119(10): 1364–1372 [DOI] [PMC free article] [PubMed] [Google Scholar]
- 22.Schure M.B., et al. , “Perceptions of the Environment and Health Among Members of the Confederated Tribes of the Umatilla Indian Reservation.” Environmental Justice, 2013. 6(3): 115–120 [DOI] [PMC free article] [PubMed] [Google Scholar]
- 23.O'Fallon L.R. and Dearry A., “Community-Based Participatory Research as a Tool to Advance Environmental Health Sciences.” Environ Health Perspect, 2002. 110(suppl 2): 155–159 [DOI] [PMC free article] [PubMed] [Google Scholar]
- 24.Teufel-Shone N. and Williams S., “Focus Groups in Small Communities.” Prev Chronic Dis, 2010. 7(3): A67. <http://www.cdc/pcd/issues/2010/may/09_0164.htm> [PMC free article] [PubMed]
- 25.Fern E.F., Advanced Focus Group Research. 2001, Thousand Oaks, CA: Sage Publications, Inc. 264 [Google Scholar]
- 26.Krueger R.A. and King J.A., Involving Community Members in Focus Groups. 1998, Thousand Oaks, CA: Sage Publications, Inc. [Google Scholar]
- 27.Greenbaum T.L., Moderating Focus Groups: A Practical Guide for Group Facilitation. 2000, Thousand Oaks, CA: Sage Publications, Inc. [Google Scholar]
- 28.Esposito N., “From Meaning to Meaning: The Influence of Translation Techniques on Non-English Focus Group Research.” Qualitative Health Research, 2001. 11(4): 568–579 [DOI] [PubMed] [Google Scholar]
- 29.O'Connell S.G., Kincl L.D., and Anderson K.A., “Silicone Wristbands as Personal Passive Samplers.” Environ Sci Technol, 2014. 18(6): 3327–3335 [DOI] [PMC free article] [PubMed] [Google Scholar]
- 30.National Institute of Environmental Health Science. Environmental Justice and Community-Based Participatory Research. 2010. <http://www.niehs.nih.gov/research/supported/dert/programs/justice/>
- 31.Snyder E.G., et al. , “The Changing Paradigm of Air Pollution Monitoring.” Environ Sci Technol, 2013. 47(20): p. 11369–77 [DOI] [PubMed] [Google Scholar]
- 32.United States Environmental Protection Agency. EPA's Air Sensor Toolbox for Citizen Scientists. 2015. <http://www.epa.gov/heasd/airsensortoolbox/>. (Last accessed on March16, 2015)
- 33.Morello-Frosch R., et al. , “Toxic ignorance and right-to-know in biomonitoring results communication: a survey of scientists and study participants.” Environ Health, 2009. 8: 6. [DOI] [PMC free article] [PubMed] [Google Scholar]
- 34.Michener L., et al. , “Aligning the Goals of Community-Engaged Research: Why and How Academic Health Centers Can Successfully Engage with Communities to Improve Health.” Academic Medicine, 2012. 87(3): 285–291 [DOI] [PMC free article] [PubMed] [Google Scholar]