

Abstract
Multimodal T cell profiling can enable more precise characterization of elusive cell states underlying disease. Here, we integrated single-cell RNA and surface protein data from 500,089 memory T cells to define 31 cell states from 259 individuals in a Peruvian tuberculosis (TB) progression cohort. At immune steady state >4 years after infection and disease resolution, we found that, after accounting for significant effects of age, sex, season, and genetic ancestry on T cell composition, a polyfunctional Th17-like effector state was reduced in abundance and function in individuals who previously progressed from Mycobacterium tuberculosis (M.tb) infection to active TB disease. These cells are capable of responding to M.tb peptides. Deconvoluting this state—uniquely identifiable with multimodal analysis—from public data demonstrated that its depletion may precede and persist beyond active disease. Our study demonstrates the power of integrative multimodal single-cell profiling to define cell states relevant to disease and other traits.
T cells occupy a complex landscape of functional states characterized by combinations of mRNA, surface proteins, transcription factors, and cytokines. These modalities individually lend limited insight into cellular function, but jointly they recapitulate the breadth of T cell states. However, profiling strategies frequently assay a single modality, average across heterogeneous states (e.g., bulk RNA-seq), have limited detection efficiency for key markers (e.g., single-cell RNA-seq1), or only target predefined phenotypes of interest (e.g., flow cytometry, mass cytometry2). Recent technologies incorporate oligonucleotide-labeled antibodies into droplet-based single-cell sequencing to simultaneously measure surface markers alongside intracellular mRNA transcripts3,4, enabling comprehensive characterization of T cell states.
Interindividual differences in T cell state abundance and function can correlate with demographics (e.g., age, sex) or environment5. Moreover, they may underlie divergent disease outcomes6, such as response to pathogens like M.tb—a leading infectious cause of death. Nearly a quarter of the world’s population is estimated to be infected with M.tb, but only 5–15% of infected individuals develop TB disease, causing an estimated 1.5 million annual deaths7,8. Given the prevalence of infection and mortality upon progression to active disease, there is an urgent need to understand the immune correlates of progression risk. For example, people who previously progressed to active TB tend to have higher progression risk than others9, which may indicate that persistent baseline immune differences reduce capacity to control M.tb infection.
Previous studies implicate key memory T cell states in TB disease progression10–17. However, T cell immunoprofiling studies often have key limitations: (1) insufficient clinical and demographic data to mitigate confounding, and (2) profiling donors during disease, when disease-induced inflammation cannot be disentangled from inherent immune differences. Similarly, studies limited to antigen-specific cells may miss broader immune context. Here, we use Cellular Indexing of Transcriptomes and Epitopes by Sequencing (CITE-seq) to profile >500,000 memory T cells from a TB progression cohort at post-disease immune steady state (i.e., after treatment and TB disease resolution) and multimodally define cell states associated with demographics, environment, and TB progression. We utilize this powerful resource to identify a T cell state associated with TB progression that responds to ex vivo M.tb peptide stimulation.
Results
CITE-seq produces 500K multimodal T cell profiles
We re-recruited 264 individuals from a larger epidemiological study (n=14,044) in Lima, Peru that identified patients with active TB disease and followed their M.tb-infected household contacts for one year to monitor progression to active disease (Fig. 1a)18. We re-recruited donors 4.72–6.60 years after initial recruitment and classified those who had originally been diagnosed with TB as cases. By time of sample collection, cases had been treated for TB, which has an estimated cure rate >95%, so we expected they had returned to immune steady state without disease-driven perturbation19. This facilitates discovery of states associated with disease outcomes, not merely activation during disease. Household contacts who had originally been tuberculin skin test (TST)-positive and didn’t develop TB disease by time of re-recruitment were controls. The cohort has comprehensive documentation of environmental (e.g., socioeconomic status, nutrition, smoking) and demographic (e.g., age, sex, weight) traits. Consistent with the larger epidemiological study18, TB progression was associated with host traits such as age, height, weight, sex, and body mass index (Supplementary Table 1).
Figure 1. Study design and quality control.
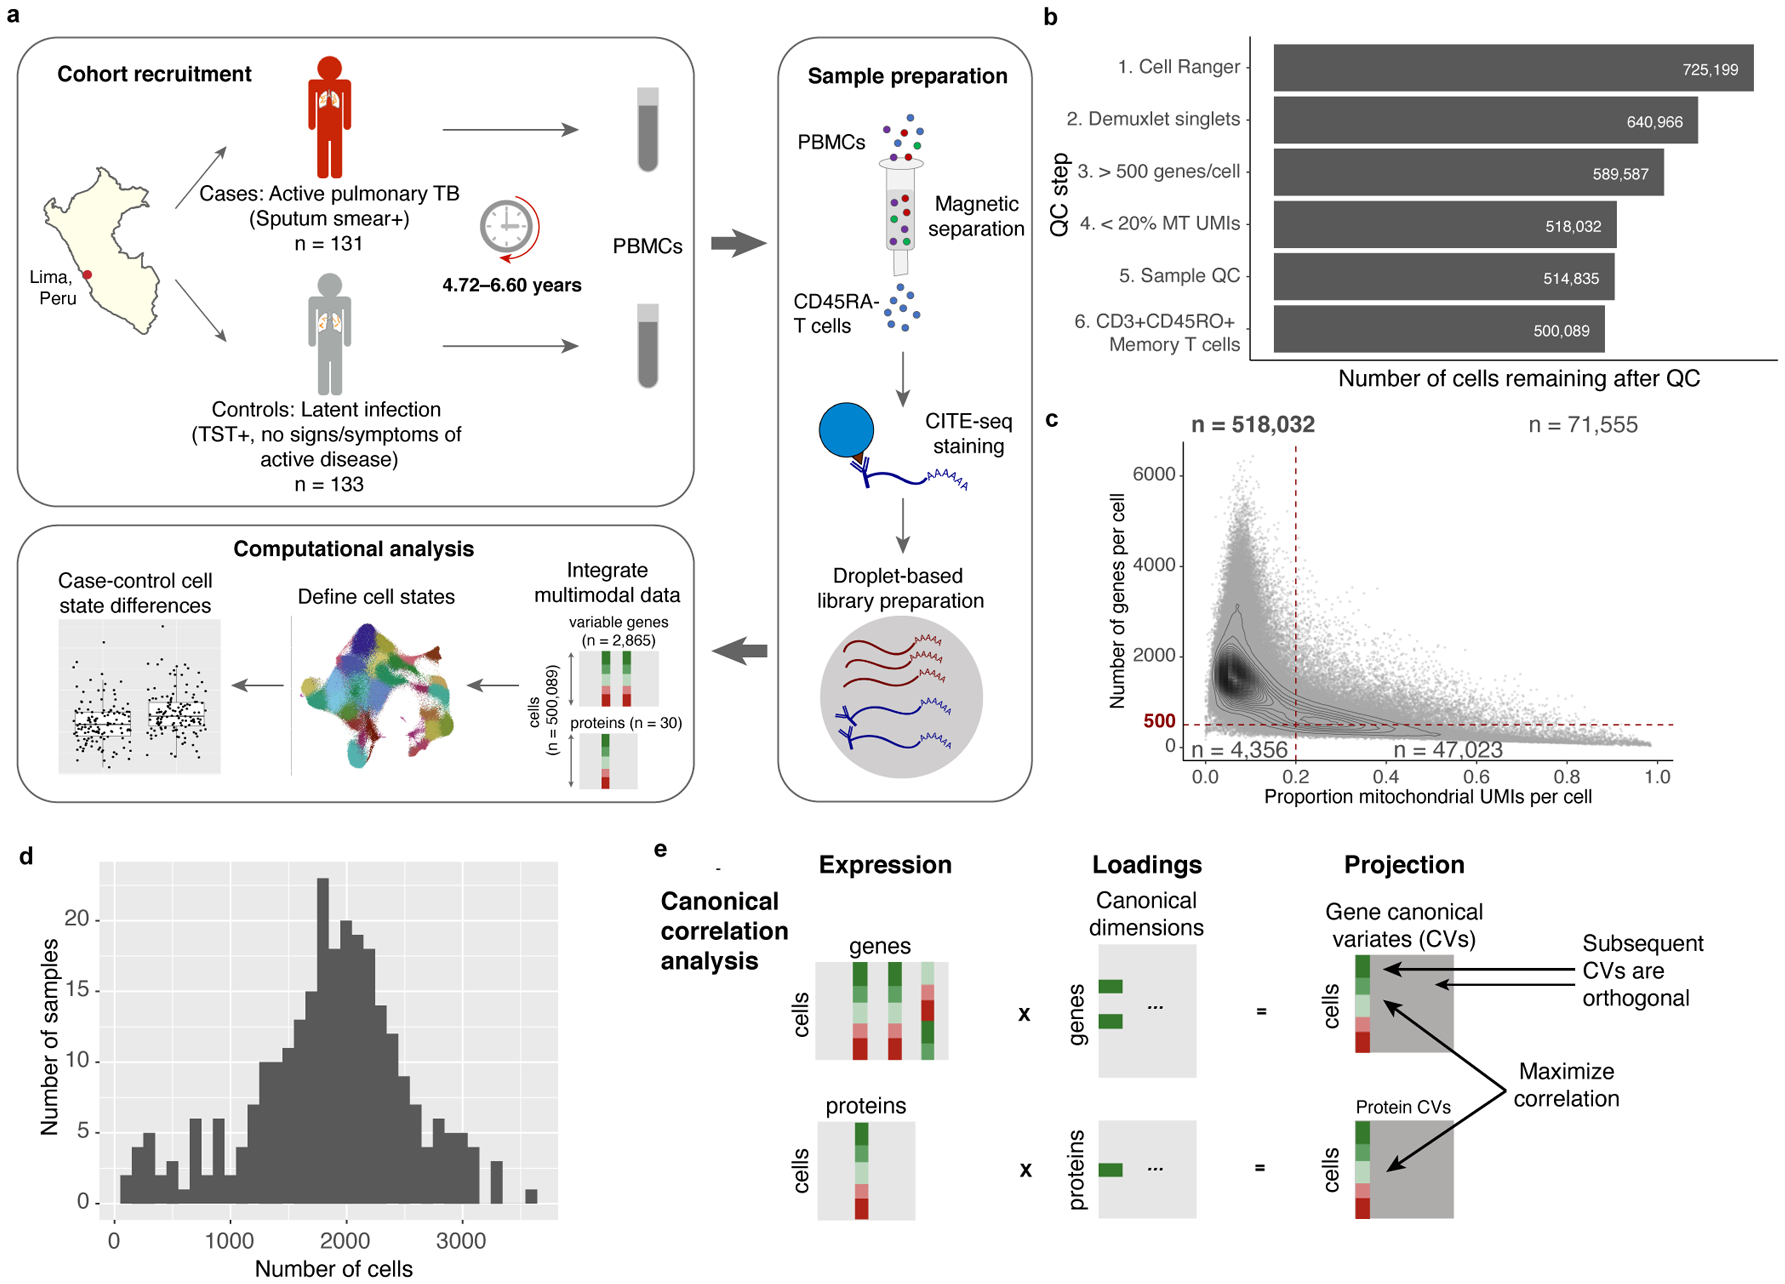
a, We obtained PBMCs from a Peruvian TB cohort (n=264 donors and 12 technical replicates, over 46 independent experiments), profiled memory T cells with CITE-seq, and integrated multimodal single-cell profiles to define cell states and case-control differences. b, Cell counts over six quality control steps. c, Single-cell quality metrics. Each cell is plotted according to the proportion of MT UMIs and the number of genes expressed. QC thresholds are demarcated with dashed lines. Counts indicate the number of cells in each quadrant. d, Distribution of post-QC cell yields for 259 samples. e, Schematic of canonical correlation analysis.
We used magnetic sorting to negatively select CD45RA- memory T cells from peripheral blood mononuclear cells (PBMCs) from 131 cases and 133 controls (~98.4% purity, Fig. 1a). Using CITE-seq, we profiled single-cell RNA alongside an optimized panel of 31 oligonucleotide-tagged antibodies for surface proteins (Supplementary Table 2), including markers of lineage (e.g., CD4, CD8), activation (e.g., CD25, HLA-DR), migration (e.g., CCR6, CXCR3), and mouse immunoglobulin G as a control4. After cell- and sample-level quality control (Fig. 1b,c, Extended Data Fig. 1a–c), the final data set contained 500,089 memory T cells from 259 individuals (mean: 1,845 cells/sample, 95% confidence interval [CI]: 518–3,172, Fig. 1d). By sorting equal numbers of cells where possible, we observed no significant difference in cell count per sample between progressors and non-progressors (two-sided t test p=0.33; Extended Data Fig. 1d).
Consistent with previous observations, mRNA-protein correlations were positive but modest (Extended Data Fig. 1e,f)3,4. We evaluated surface marker measurements with flow cytometry of 13 proteins in the same 259 donors (Supplementary Table 3). For 8 surface-marker-defined populations gated with both CITE-seq and flow cytometry (Supplementary Fig. 1), average frequencies correlated between platforms (Pearson r=0.99; Extended Data Fig. 2a), as did per-donor frequencies of each population (Pearson r=0.73–0.94; Extended Data Fig. 2b).
Multimodal integration defines 31 memory T cell states
As suggested by previous T cell phenotyping efforts1, we assume that biologically relevant states have both mRNA and surface protein signatures. To integratively define high-resolution memory T cell states, we used canonical correlation analysis (CCA) to project each cell into a low-dimensional space defined by correlated modules of mRNA transcripts and proteins (Fig. 1e). This leverages modality-specific signatures; for example, regulatory T cells (Tregs) have high surface expression of CD25 and absence of CD127 but also express FOXP3 transcripts, so we expect to find one or more dimensions driven by correlated variation in CD25, CD127, and FOXP3 that delineate Tregs20,21. We selected the top 20 canonical variates (CVs) with highest mRNA-protein correlations (Extended Data Fig. 3a,b). The first CV—capturing the most shared variation—correlated with a previously defined gene expression signature of effector potential (Pearson r=0.90) (Extended Data Fig. 3c,d)22.
Batch correction and graph-based clustering of the top 20 CVs defined 31 putative cell states with gene and protein markers (Fig. 2, Extended Data Fig. 4; Supplementary Table 4)23. Based on surface protein, the majority (23/31) were CD4+, five were CD8+, and one (C-24) was a mixture. Two clusters (C-30 and C-31) were CD4-CD8-, likely containing mostly γδ T cells that expressed TRDC, the constant region of the T cell receptor (TCR) delta chain, but not the αβ TCR surface protein. Despite limited resolution of unconventional T cells with 3’ mRNA and these surface markers, one cluster (C-20) contained a subset of CD4-CD8- and CD8+ cells expressing innate-like T cell markers, including ZBTB16 and CD161 and CD26 surface protein24,25.
Figure 2. Landscape of memory T cell states.
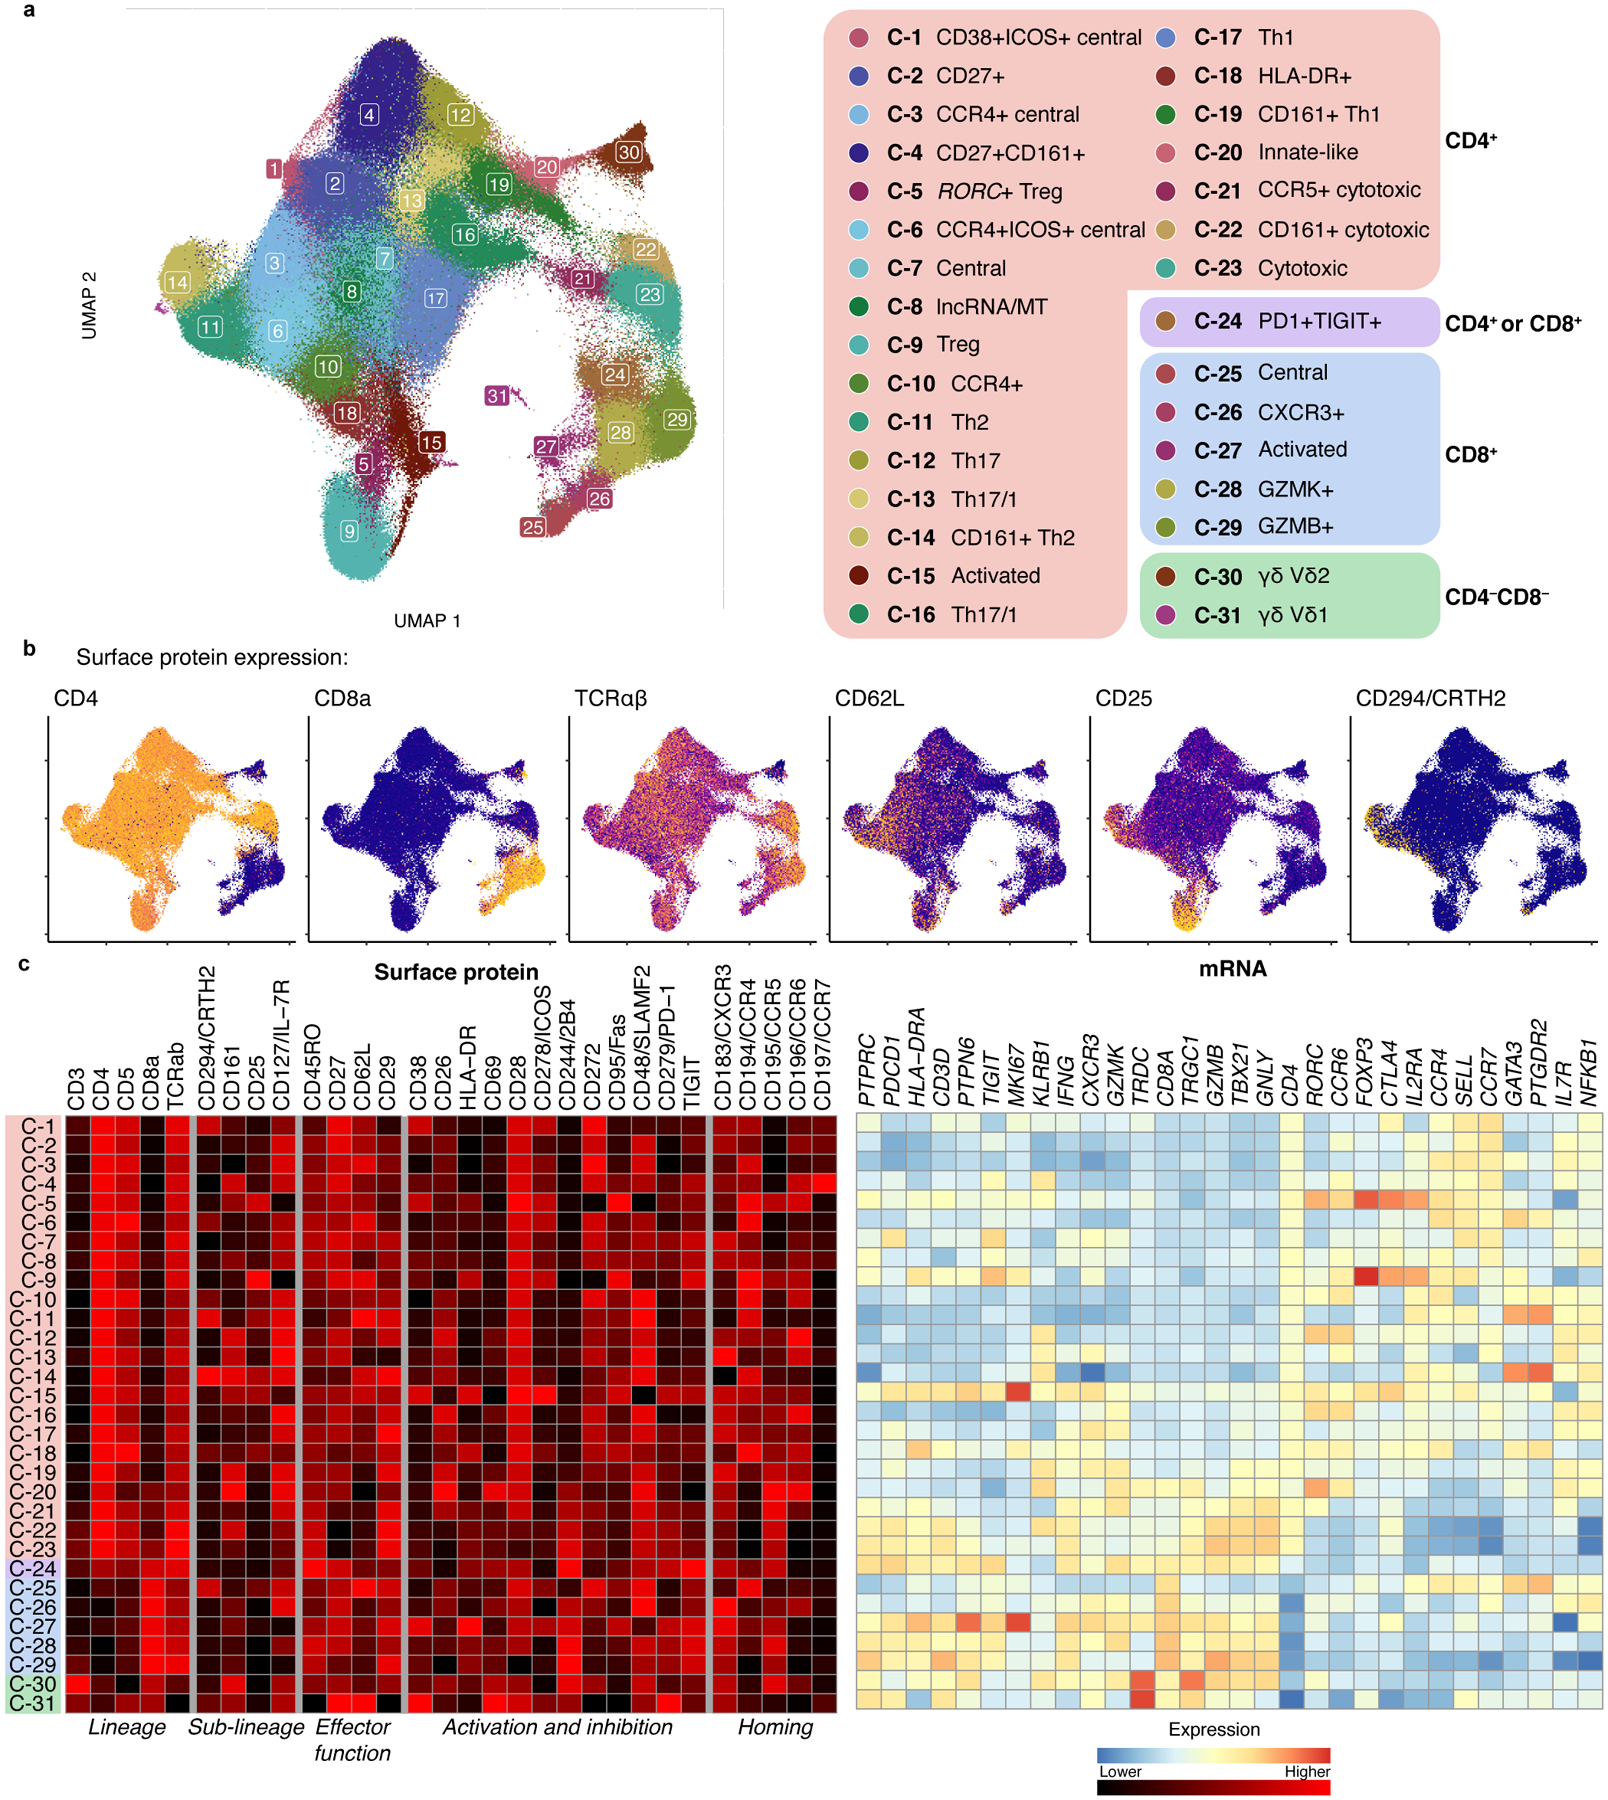
a, UMAP colored by 31 multimodal clusters. Cluster annotations are based on top differentially expressed genes and surface proteins. Clusters boxed in red are CD4+, purple are mixed CD4+ and CD8+, blue are CD8+, and green are CD4−CD8−. b, Expression of major lineage-defining surface proteins measured through CITE-seq. Colors are scaled independently for each marker from minimum (blue) to maximum (yellow) expression. c, Heatmap of selected marker genes. Surface protein heatmap colors are uniformly scaled for each protein. mRNA heatmap colors reflect z-scores for each gene.
Some CD4+ clusters resembled known T cell phenotypes, such as central memory (CD62L+)26 and Tregs (C-5 and C-9, CD25+CD127- and expressing FOXP3)20,21. Among CD8+ clusters, we identified one central memory cluster (C-25) and distinct GZMK+ (C-28) and GZMB+ (C-29) effector subsets, reflecting different cytotoxicities27. Clusters with high expression of HLA-DR and CD38 surface protein and proliferation-associated MKI67 (C-15, C-27) represent chronically activated cells28.
In addition to Th17 (C-12, CCR6+ and RORC) and Th1 (C-17, CXCR3+ and IFNG and TBX21)29,30, we identified a heterogeneous continuum of intermediate Th1/17 states (C-13, C-16, C-19) with varying degrees of CXCR3, CCR6, CCR5, and CD161 surface protein and RORC and TBX21 expression31.
We also identified disease-associated subsets of broader states. For example, we identified a CD161+ subset of Th2 cells (C-14), previously described as pathogenic, with higher expression of allergy-associated HPGDS and IL17RB32. We found a subset of FOXP3+ Tregs (C-5) expressing higher CCR6 surface protein and CTLA4 and RORC than other Tregs, resembling Tregs found in tumors and autoimmune diseases33,34. As previous studies in blood have shown, CCR6+ memory Tregs have higher CD161 surface protein and lower TIGIT surface protein and IKZF2 expression. We also find reduced HLA Class II mRNA and surface protein expression, as well as decreased expression of RTKN2, CCR10, and TNFRSF9 and higher CD38 surface protein compared to other memory Tregs (C-9). These subsets have not been well-defined previously due to limited ability to align definitions between assays.
Memory T cell states vary with demographics and environment
Cell state abundance varied across donors but was correlated between technical replicates (Pearson r=0.44–1.00) (Fig. 3a, Extended Data Fig. 5), indicating that T cell states may be associated with other donor traits. We tested 38 demographic, socioeconomic, and genetic ancestry covariates (Supplementary Table 5) for association with T cell states with Mixed-effects modeling of Associations of Single Cells (MASC)35, a single-cell cluster association model that accounts for cell- and donor-level confounders. We corrected for donor, batch, and total unique molecular identifiers (UMIs) and percent mitochondrial (MT) UMIs per cell, which all influence a cell’s cluster membership.
Figure 3. Memory T cell state associations with demographic and environmental factors.
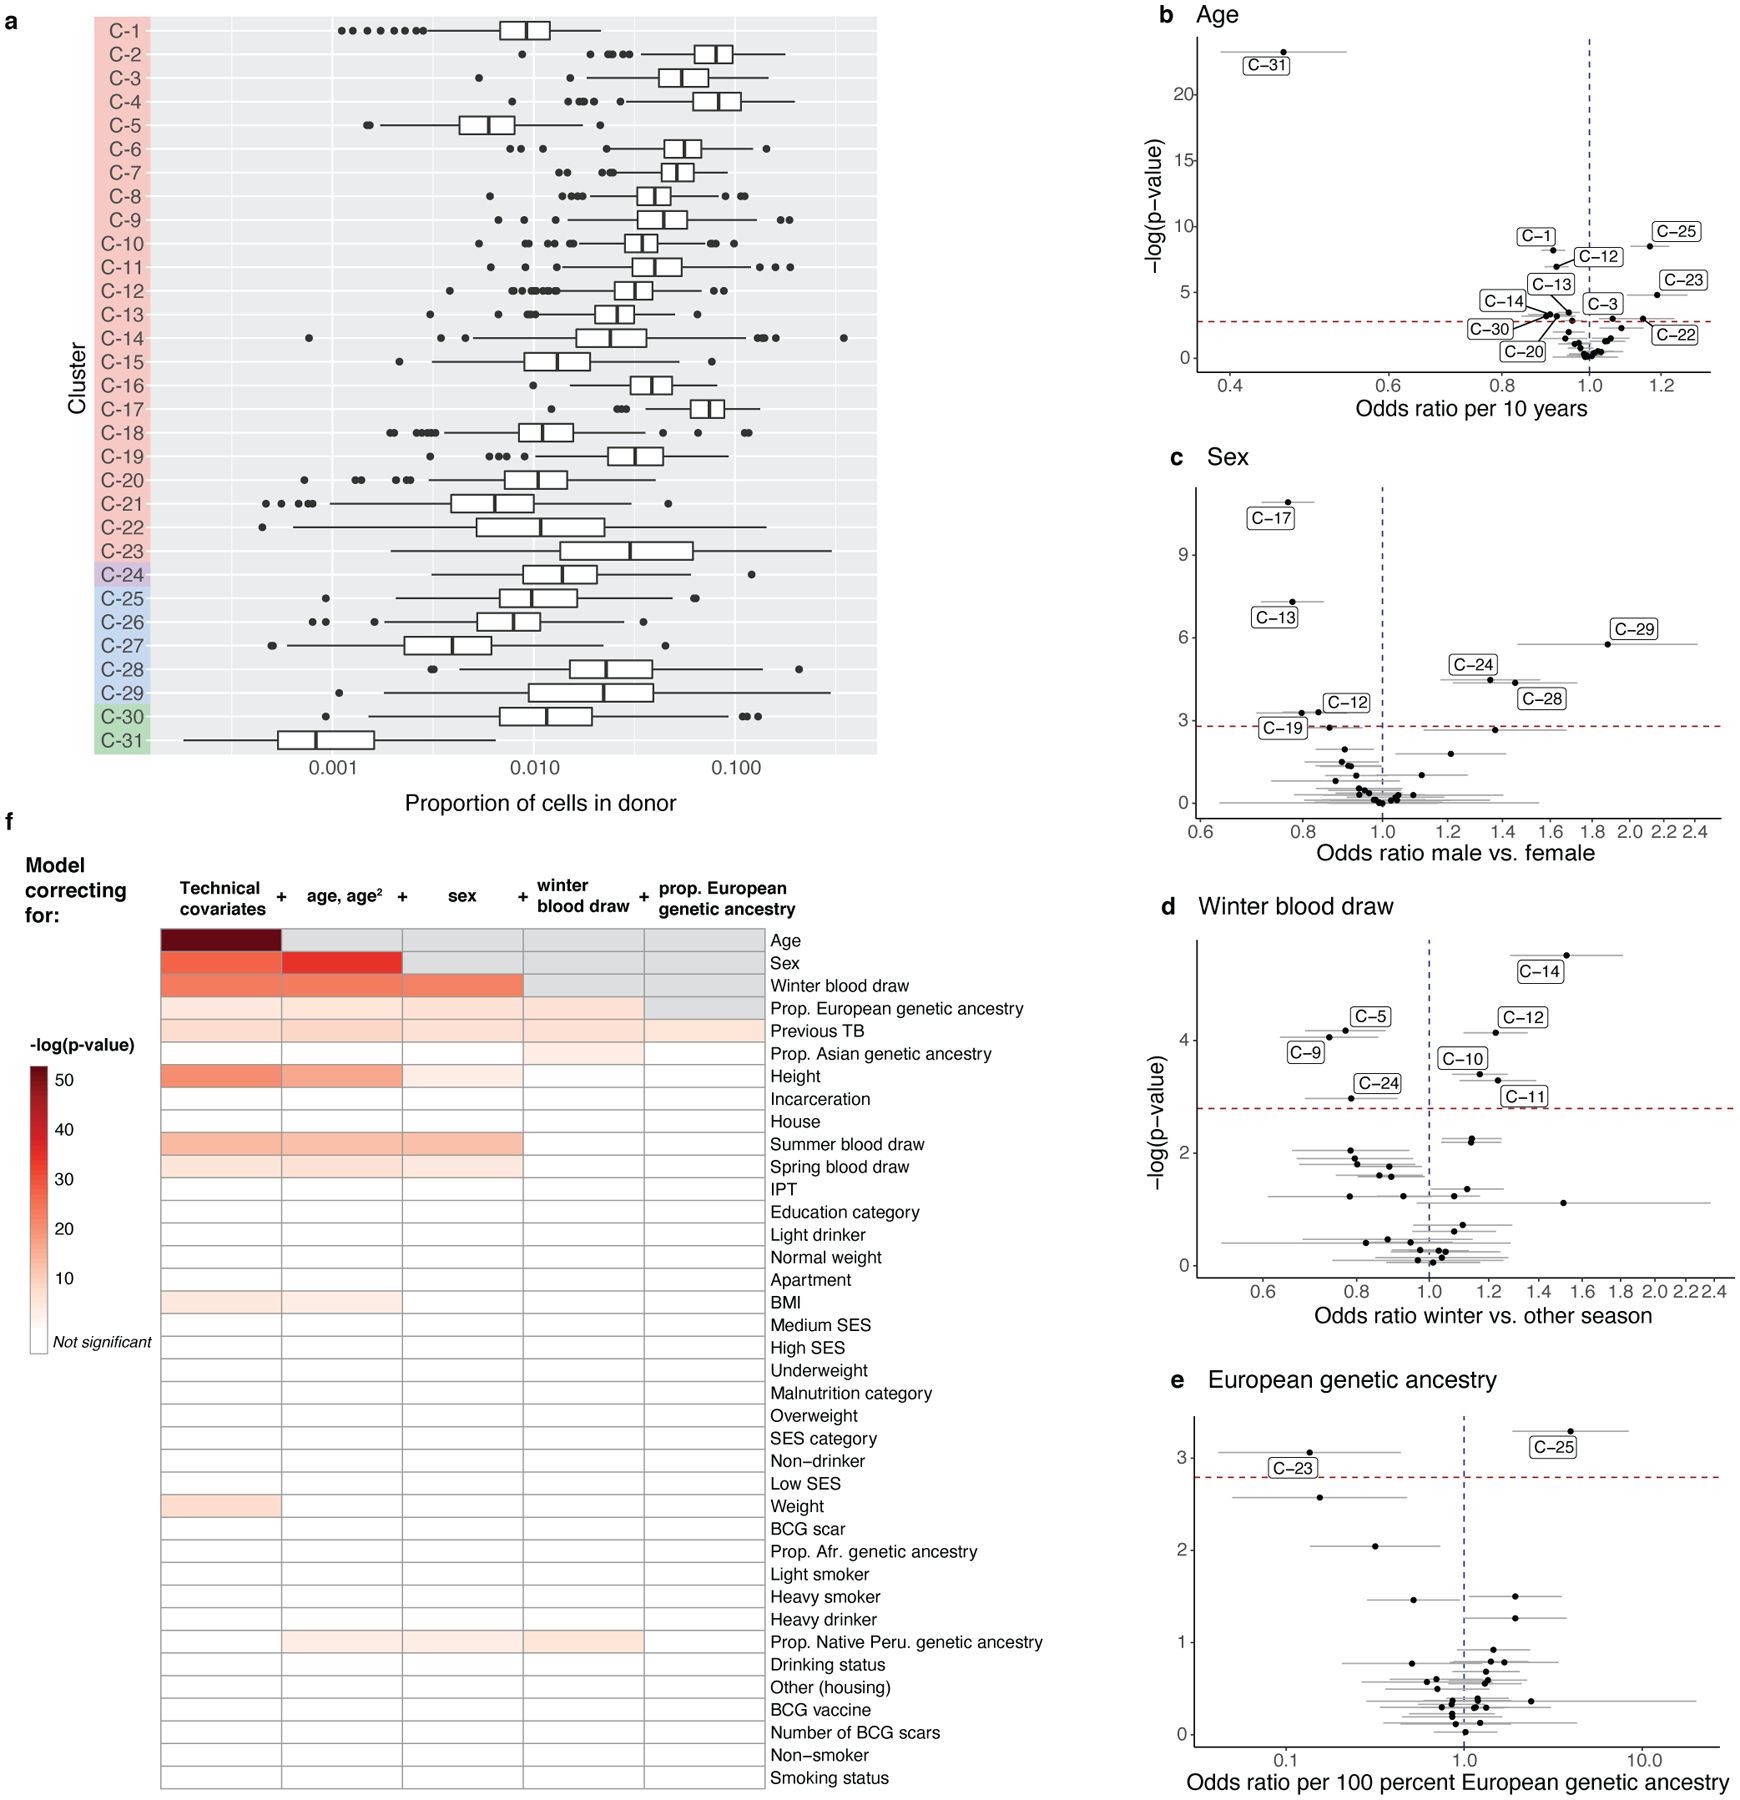
a, Distribution of cluster proportions across donors (n = 259). Boxplots show the median (vertical bar), 25th and 75th percentiles (lower and upper bounds of box, respectively), and 1.5xinterquartile range (IQR) (or minimum/maximum if they lie within that range; end of whiskers). Only non-zero proportions are plotted. b–e, Effects of age, sex, winter blood draw, and proportion of European genetic ancestry in univariate model correcting for technical covariates (# UMIs/cell, % MT UMIs/cell), donor, and batch. Error bars show the 95% confidence interval. f, Associations of covariates with T cell composition. Each column represents associations from a MASC model fit with the indicated covariate (row) as the contrast, and correcting for the indicated covariates (cumulative column headings, from left) as fixed effects and donor and batch as random effects. Heatmap colors correspond to gamma test p-values, white indicates that the covariate is not significant after multiple testing correction (p>.05/38), and gray indicates that the covariate has already been added to the model. Age and age2 are linear and quadratic terms of age at blood draw. Technical effects are # UMIs/cell and % MT UMIs/cell. IPT = isoniazid preventative therapy. BMI = body mass index. SES = socioeconomic status. BCG = Bacillus Calmette-Guérin. For all, n=271 samples from 259 independent donors.
For each covariate, we quantified its association with memory T cell composition by aggregating independent cluster association p values into a gamma-distributed test statistic (Methods; Supplementary Fig. 2). Age, sex, winter blood draw, and proportion of European genetic ancestry were significantly and independently associated with T cell state composition (Fig. 3b–e). As previous studies suggest5,36, age had the strongest influence (gamma p=2.24×10−53), associated with 12/31 states (univariate LRT p<1.6×10−3 = 0.05/31). Similar to prior findings37, cytotoxic CD4+ T cells (C-23) were expanded ~20% per decade of age (odds ratio [OR]=1.19, 95% CI: 1.10–1.28, p=1.59×10⁻⁵). We also observed that Vδ1 T cells (C-31) were reduced >50% per decade (OR=0.46, 95% CI: 0.39–0.54, p=5.72×10⁻²⁴; Fig. 3b; Supplementary Table 5).
Sex was also strongly associated with T cell states (gamma p=8.40×10⁻²⁸), and we further dissected published trends, such as lower CD4:CD8 ratio in males and the inhibitory effect of male hormones on Th1 differentiation38,39. We observed expansion of GZMB+ CD8+ T cells in males (C-29: OR=1.88 M vs. F, 95% CI: 1.46–2.42, p=1.72×10⁻⁶) and Th1s in females (e.g., C-17: OR=0.77 M vs. F, 95% CI: 0.71–0.83, p=1.20×10⁻¹¹) (Fig. 3c; Supplementary Table 5).
We observed surprising expansion of Th2 states in samples collected in winter (gamma p=4.40×10⁻²⁴; e.g., C-11: OR=1.24, 95% CI: 1.10–1.39, p=5.13×10⁻⁴) (Fig. 3d; Supplementary Table 5). To our knowledge, this has not been reported previously, beyond general seasonality of cytokine responses40.
Immune function is thought to vary with genetic ancestry41, and in our cohort, all three cytotoxic CD4+ clusters were nominally depleted in individuals with higher European genetic ancestry (gamma p=2.21×10⁻⁵, e.g., C-23: OR=0.14 per 100% European genetic ancestry, 95% CI: 0.05–0.48, p=8.70×10⁻⁴) (Fig. 3e; Supplementary Table 5).
These associations were significant independently of each other and TB progression status (Extended Data Fig. 6a,b; Supplementary Table 6,7). Other covariates did not have significant associations with memory T cell composition after adjusting for age, sex, season, and genetic ancestry (Fig. 3f).
An RORC+ effector state is reduced in TB progressors
Next, we sought to identify memory T cell states associated with M.tb infection outcome. We used MASC to test associations between each cell state and TB disease progression, adjusting for potentially confounding covariates (age, sex, winter blood draw, proportion of European genetic ancestry) and batch and single-cell technical factors (Methods).
We observed a significant 20% reduction in cluster C-12 in individuals who had progressed to active TB disease (OR=0.80, 95% CI: 0.73–0.87, p=1.21×10⁻⁶ < 0.05/31) (Fig. 4a; Supplementary Table 7). Notably, C-12 was independently reduced with age (OR=0.82, p=2.69×10⁻³) and in males (OR=0.85, p=4.30×10⁻⁴) and expanded in winter (OR=1.16, p=1.30×10⁻³) (Fig. 4b). This covariate-aware, multimodal strategy detects even a modest case-control difference in C-12 frequency (mean: 3.0% in cases, 3.6% in controls; Fig. 4c).
Figure 4. Identification and isolation of a depleted memory T cell state in TB cases.
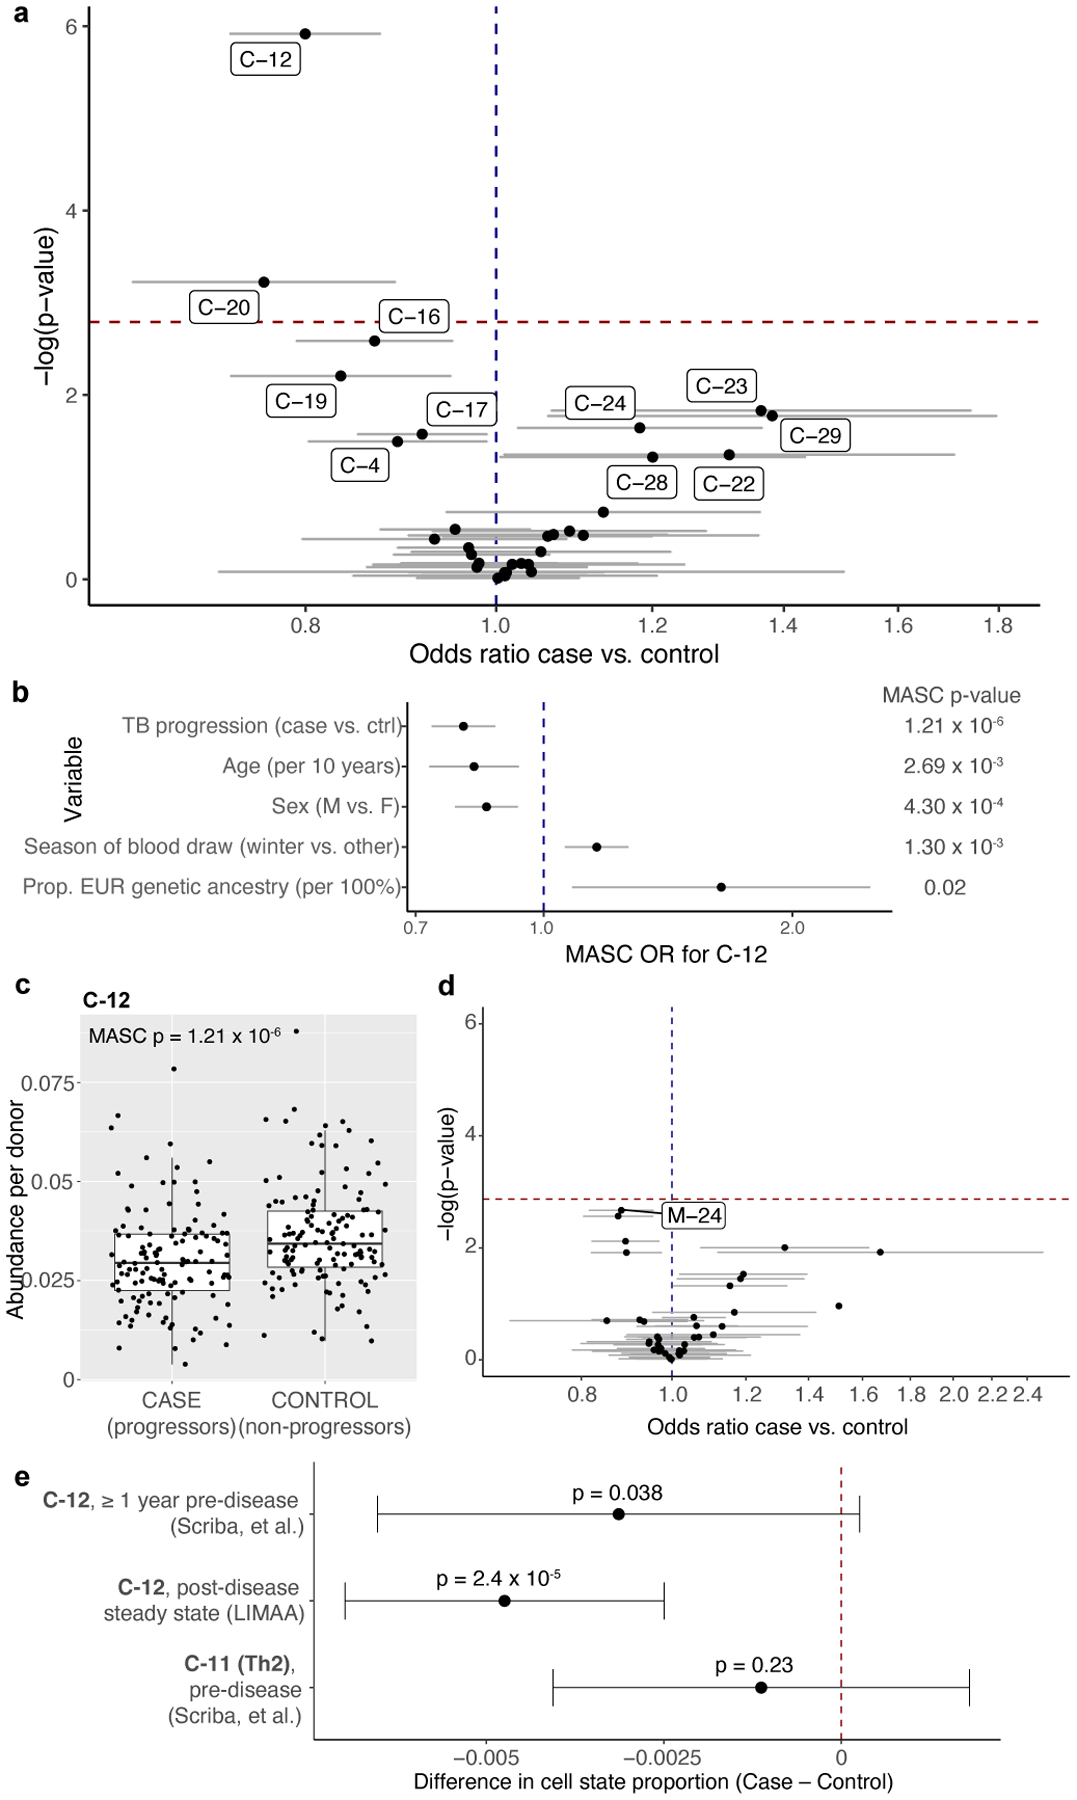
a, Associations between TB disease status and memory T cell states. Data are presented as the MASC odds ratio (OR) of a cell being in each multimodal cluster for cases vs. controls (95% confidence interval [CI] error bars), and the −log(LRT p-value) of the association. The dashed horizontal line corresponds to a Bonferroni p-value threshold of 0.05/31. Labeled clusters are significant at a nominal threshold of p<0.05. b, C-12’s association with each covariate in the full model. Data are presented as the MASC OR of a cell being in C-12 based on each covariate (95% CI error bars). P values are from an LRT with 1 degree of freedom (d.f.) c, Abundance of C-12 in 128 cases and 131 controls. Boxplots show the median (horizontal bar), 25th and 75th percentiles (lower and upper bounds of box, respectively), and 1.5xIQR (or minimum/maximum if they lie within that range; end of whiskers). P values are from an LRT with 1 d.f. d, Associations between TB disease status and unimodal mRNA clusters. Data are presented as the MASC OR of a cell being in that cluster for cases vs. controls (95% CI error bars), and the −log(LRT p value) of the association. The dashed horizontal line corresponds to a Bonferroni p value threshold of 0.05/37. e, Difference in C-12 or C-11 proportion (case-control) in pre- or post-disease cohorts, estimated by linear mixed model correcting for age, sex, sequencing technology, and donor. Pre-disease data are aggregated across 2 time points (n=98 samples from 54 independent donors. Data are presented as the beta estimate for TB progression status in each data set/cell state (95% confidence interval error bars) and corresponding p values from a one-sided t-test (Satterthwaite’s d.f. method). For LIMAA (a-e), n=271 samples from 259 independent donors.
Cells in C-12 have a CD4+ effector surface phenotype (CD62L: Expression fold change C-12 vs. other [FC]=0.66, p=2.99×10⁻⁷, CCR7: FC=0.85, p=9.72×10⁻³) and lack surface markers of activation (HLA-DR: FC=0.39, p=1.86×10⁻¹⁸) or exhaustion (PD-1: FC=0.76, p=7.23×10⁻⁶). The top surface proteins were CD26, CCR6, and CD161 and the top transcripts were CCR6, CTSH, and KLRB1 (Supplementary Table 4), with elevated expression of Th17 lineage-defining transcription factor RORC (FC=5.70, p=2.37×10−187) compared to all other memory T cells. We also noted reduced expression of Th1 lineage-defining TBX21 (FC=0.52, p=1.01×10⁻¹⁰) and IFNG (FC=0.30, p=7.23×10⁻³⁴), although absence of transcription-factor- or cytokine-encoding transcripts may reflect (1) poor detection, or (2) paucity of pre-formed mRNA22. There were no differentially expressed genes between cases and controls in this cluster. This combination of markers suggests that C-12 is a Th17 subset29.
When clustering on single modalities—either mRNA or protein—we were unable to precisely capture C-12 (Extended Data Fig. 7a–f). Accordingly, no mRNA-based clusters were significantly associated with TB progression (Fig. 4d; Supplementary Table 8). Two protein-based clusters partially overlapping C-12 were reduced in cases, but less significantly (Extended Data Fig. 7f,g; Supplementary Table 8). Another multimodal cluster (C-20, innate-like T cells) was also reduced in cases but with modest significance (mean: 1.1% in cases, and 1.2% in controls; OR=0.76, 95% CI: 0.65–0.89, p=5.95×10⁻⁴; Extended Data Fig. 7h).
Because our cohort was profiled years after TB diagnosis and treatment, we expected minimal differences in activation states. Using MASC, we found no differences in CD4+ HLA-DR+ memory T cells (OR=1.02, 95% CI: 0.86–1.22, p=0.79). Additionally, because we profiled all memory T cells, progression-associated differences identified in previous studies of M.tb antigen-specific T cells were only marginally significant (Supplementary Table 9).
Latency and treatment are unlikely to drive C-12 association
To assess whether reduced C-12 abundance is a steady-state correlate of progression risk, we considered the alternatives that C-12 is increased by latent TB or decreased by active TB. We defined a gene expression score based on sorted T cells and bulk PBMCs that estimates C-12 frequency with high cross-validation accuracy (T cell Pearson r=0.78, PBMC r=0.74, Extended Data Fig. 8a) and used it to estimate the C-12 proportion in public bulk expression data from studies of latent infection or disease (Methods). The highest-weighted genes were C-12 markers, including CCR6 and KLRB1 (Supplementary Data). As a negative control, we defined a score for C-11 (Th2, cross-validation r=0.73), which was not associated with disease progression.
We applied the C-12 score to a cohort from the United Kingdom including healthy (uninfected), latently infected, and active disease donors assayed with whole blood RNA microarray42. We observed no significant difference in predicted C-12 abundance between latent and BCG-vaccinated healthy donors (latent: mean=0.036; BCG+ healthy: mean=0.038; two-sided t test p=0.54, Extended Data Fig. 8b). This suggests that C-12 abundance is not increased by latency, although we recognize potential estimation error due to inter-study differences in tissue type, processing, and RNA assay.
In contrast, untreated donors with active TB disease had significantly lower estimated C-12 abundance than BCG-vaccinated healthy donors (active: mean=0.025; two-sided t-test p=3.63×10⁻³, Extended Data Fig. 8b). We observed no significant differences in C-11 (latent: mean=0.047; BCG+ healthy: mean=0.048; active: mean=0.039; two-sided t test [latent vs. BCG+ healthy] p=0.91, [active vs. BCG+ healthy] p=0.32, Extended Data Fig. 8c).
In a small subset of donors (n=7) followed through treatment, C-12 frequencies are initially significantly lower than in BCG-vaccinated healthy donors (pre-treatment: mean=0.023; BCG+ healthy: mean=0.040; two-sided t test [BCG+ healthy vs. 0 months] p=8.76×10⁻⁶, Extended Data Fig. 8d). However, during 12 months of anti-mycobacterial treatment, estimated C-12 frequencies increase (12 months: mean=0.037; two-sided t test [0 months vs. 12 months] p=7.27×10⁻³), contrary to the reduction in progressors observed at post-disease steady state, which this data set was underpowered to detect (n=7 post-treatment cases vs. 12 controls, Extended Data Fig. 8e). This demonstrates that C-12 reduction observed in progressors after 4–7 years and anti-mycobacterial treatment is likely not due to treatment, which instead counters transient C-12 depletion during disease.
Public data show C-12 depletion may precede TB progression
Next, we considered whether the C-12 reduction seen at post-disease steady state is an antecedent or consequence of disease. Using the C-12 score trained on T cells and PBMCs, we estimated C-12 abundance in bulk RNA-seq of sorted T cells from a South African cohort of M.tb-infected adolescents ≥1 year prior to disease progression in cases (avoiding effects of pre-clinical disease) or controls with continued latent infection (n=54 donors at 1–2 time points, Extended Data Fig. 8f)43. Using a mixed effects linear model correcting for age, sex, sequencing platform, and donor, we found that predicted C-12 abundance is 9% lower in cases prior to progression compared to latent controls (Δfrequencycase-control=−0.0031, one-sided t test of βcase-control p=0.038). This effect is comparable to the 13% decrease in C-12 proportion computed with the same predictor in former progressors at post-disease steady state in the Peruvian CITE-seq (LIMAA) cohort (Δfrequencycase-control=−0.0047, Fig. 4e, Extended Data Fig. 8g). Thus, differences in C-12 abundance likely pre-date disease progression.
We found no difference in the C-11 score prior to disease progression (Δfrequencycase-control= −0.0011, one-sided t test of βcase-control p=0.23, Fig. 4e), demonstrating that the reduction is not in all T cell states. We also assessed if the C-12 score is spuriously correlated with other clusters and observed that it is most correlated with C-12 abundance. The score’s correlation with other clusters’ abundances corresponds to those clusters’ correlations with true C-12 proportion (Extended Data Fig. 8h). For example, the proportion of C-23 (cytotoxic CD4+) is negatively correlated with both C-12 proportion and score, while the proportion of C-9 (Treg) has approximately 0 correlation with C-12 proportion or score.
CD4+CD26+CD161+CCR6+ captures a TB-associated T cell state
Functional characterization of C-12 required ex vivo sorting based on surface markers of the multimodally defined cluster. In addition to observed surface expression of TCRαβ and CD4, we built a classification tree and used stepwise backward selection to identify a minimal set of candidate markers: CD26+, CD161+, and CCR6+ (sensitivity=54.8%, specificity=95.5%; Fig. 5a–d; Methods). While these markers capture not just C-12 cells, C-12 comprised the plurality of cells and likely makes the most significant functional contributions. The majority of non-C-12 cells in the gate come from the C-4 cluster, with high CD27 and CCR7 surface protein and lacking RORC and TBX21 expression, suggesting lower differentiation and effector potential44,45.
Figure 5. Identifying sortable markers of C-12 for ex vivo isolation.
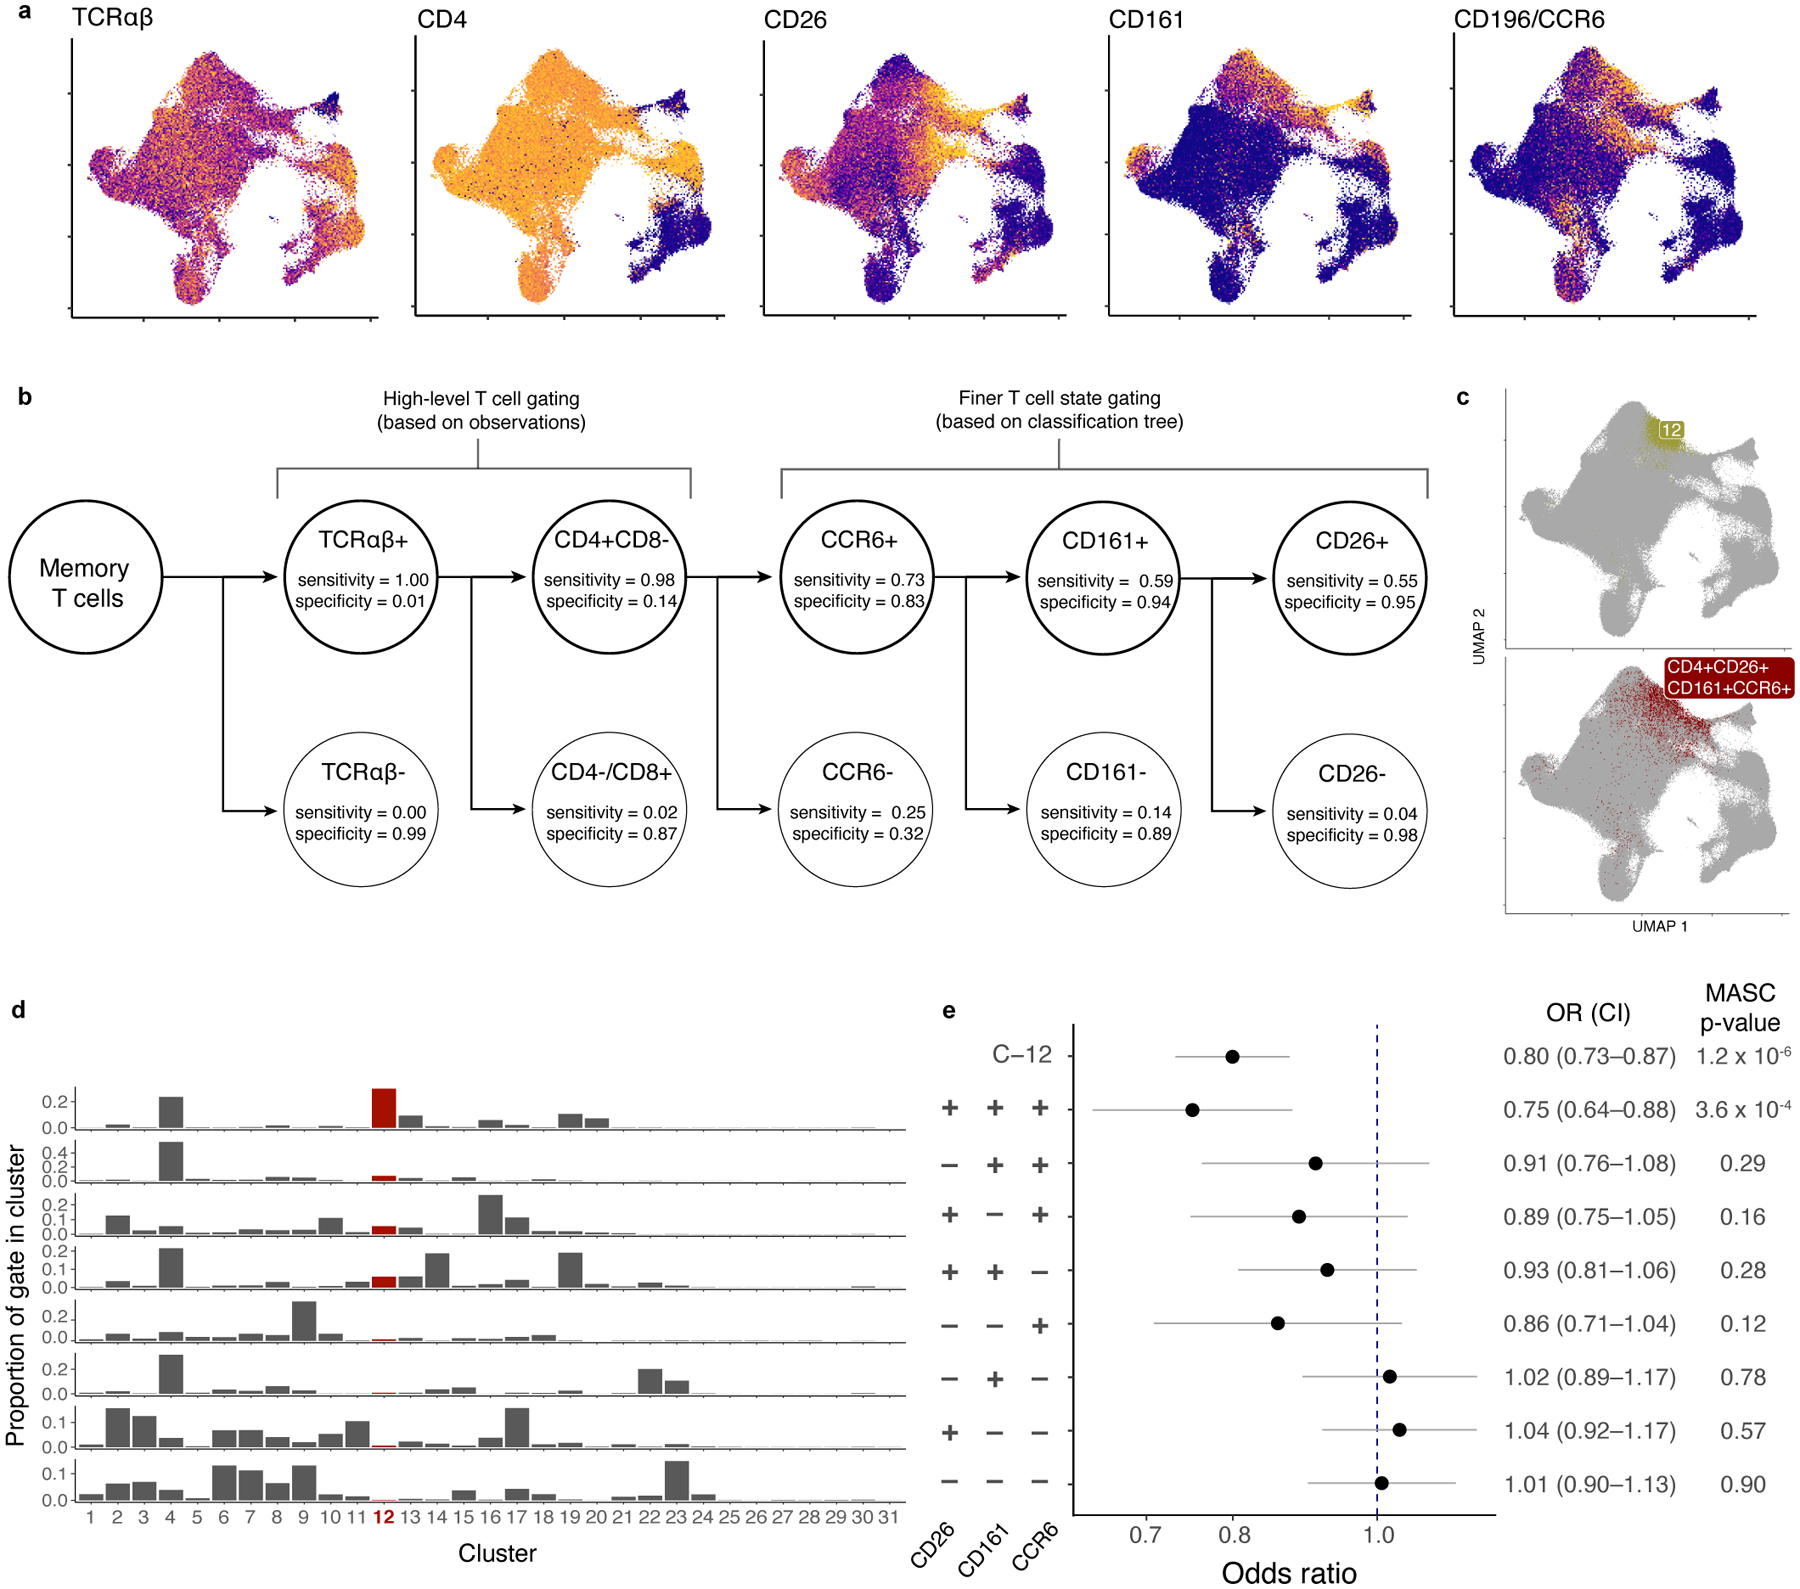
a, Surface protein markers of C-12. Colors are scaled independently for each marker from minimum (blue) to maximum (yellow) expression. b, Classification tree to gate C-12 in CITE-seq data. Each level of the tree represents an additional gate. True positives (TP) are cells in C-12 that are in the gate. False positives (FP) are cells not in C-12 that are in the gate. True negatives (TN) are cells not in C-12 that are not in the gate. False negatives are cells in C-12 that are not in the gate. Sensitivity =TP/(TP + FN). Specificity = TN/(TN + FP). c, Comparison of C-12 and gated population in UMAP space. d, Distribution of each gate across clusters. e, Association of gated populations with TB progression status. For each gated population, data are presented as the MASC OR of a cell having that phenotype for cases vs. controls (95% CI error bars; n=271 samples from 259 independent donors). P values are from an LRT with 1 d.f.
As expected, MASC modeling demonstrated reduction of this population in TB progressors when gated from CITE-seq data (OR=0.75, p=3.56×10⁻⁴; Fig. 5e, Supplementary Fig. 3a). Removing any individual gate weakens the association. Therefore, these C-12 surface markers define a disease-associated population that is a sortable proxy for ex vivo investigation.
TB-associated state makes IL-17 and IL-22 upon stimulation
To define the cytokine profile of C-12, we isolated CD4+ T cells from three Boston-based donors—likely M.tb infection-naïve given the low TB burden there—and sorted CD45RO+CD26+CD161+CCR6+ cells (Supplementary Fig. 3b; Supplementary Table 10a)46. For comparison, we sorted naive CD4+, other memory CD4+, and Tregs (Methods).
We stimulated each population with CD3/CD28 beads for pan-TCR activation and measured T helper cytokines in the supernatant. Compared to other memory CD4+ T cells, the target population produced more IL-17A, IL-17F, and IL-22 and less IL-4 and IL-13 (two-sided t test, IL-17A: t=5.07, p=0.04; IL-17F: t=6.34, p=0.02; IL-22: t=8.00, p=0.012; IL-4: t=−6.96 p=0.02; IL-13: t=−4.44, p=0.02; Fig. 6a). To determine if this was robust to stimulation condition and assay, we stimulated cells from five Boston donors with phorbol 12-myristate 13-acetate (PMA) and ionomycin. With intracellular staining, we again found that our target population was more likely to produce IL-17A, IL-17F, and IL-22 than other CD4+ memory T cells (Cochran-Mantel-Haenszel [CMH] OR, IL-17A:12.6, IL-17F:18.1, IL-22:6.0, all p<0.001; Fig. 6b–d, Extended Data Fig. 9). Inverting any surface marker (CD26, CD161, CCR6) reduced the proportion of cells expressing IL-17A, IL-17F, and IL-22 (Fig. 6e,f, Extended Data Fig. 9). This indicated a Th17-like phenotype. Furthermore, the target population was polyfunctional: Although it produced IFNγ and TNF at rates similar to CD4+ memory T cells overall (CMH OR, IFNγ:0.72, TNF:1.59, all p<0.001), it had >3 times as many IFNγ-producing cells as the rest of the Th17 compartment (two-sided t test vs. CD26-CD161+CCR6+, p=2.23×10⁻⁵; Fig. 6g).
Figure 6. Defining C-12’s cytokine profile in a Boston donor.
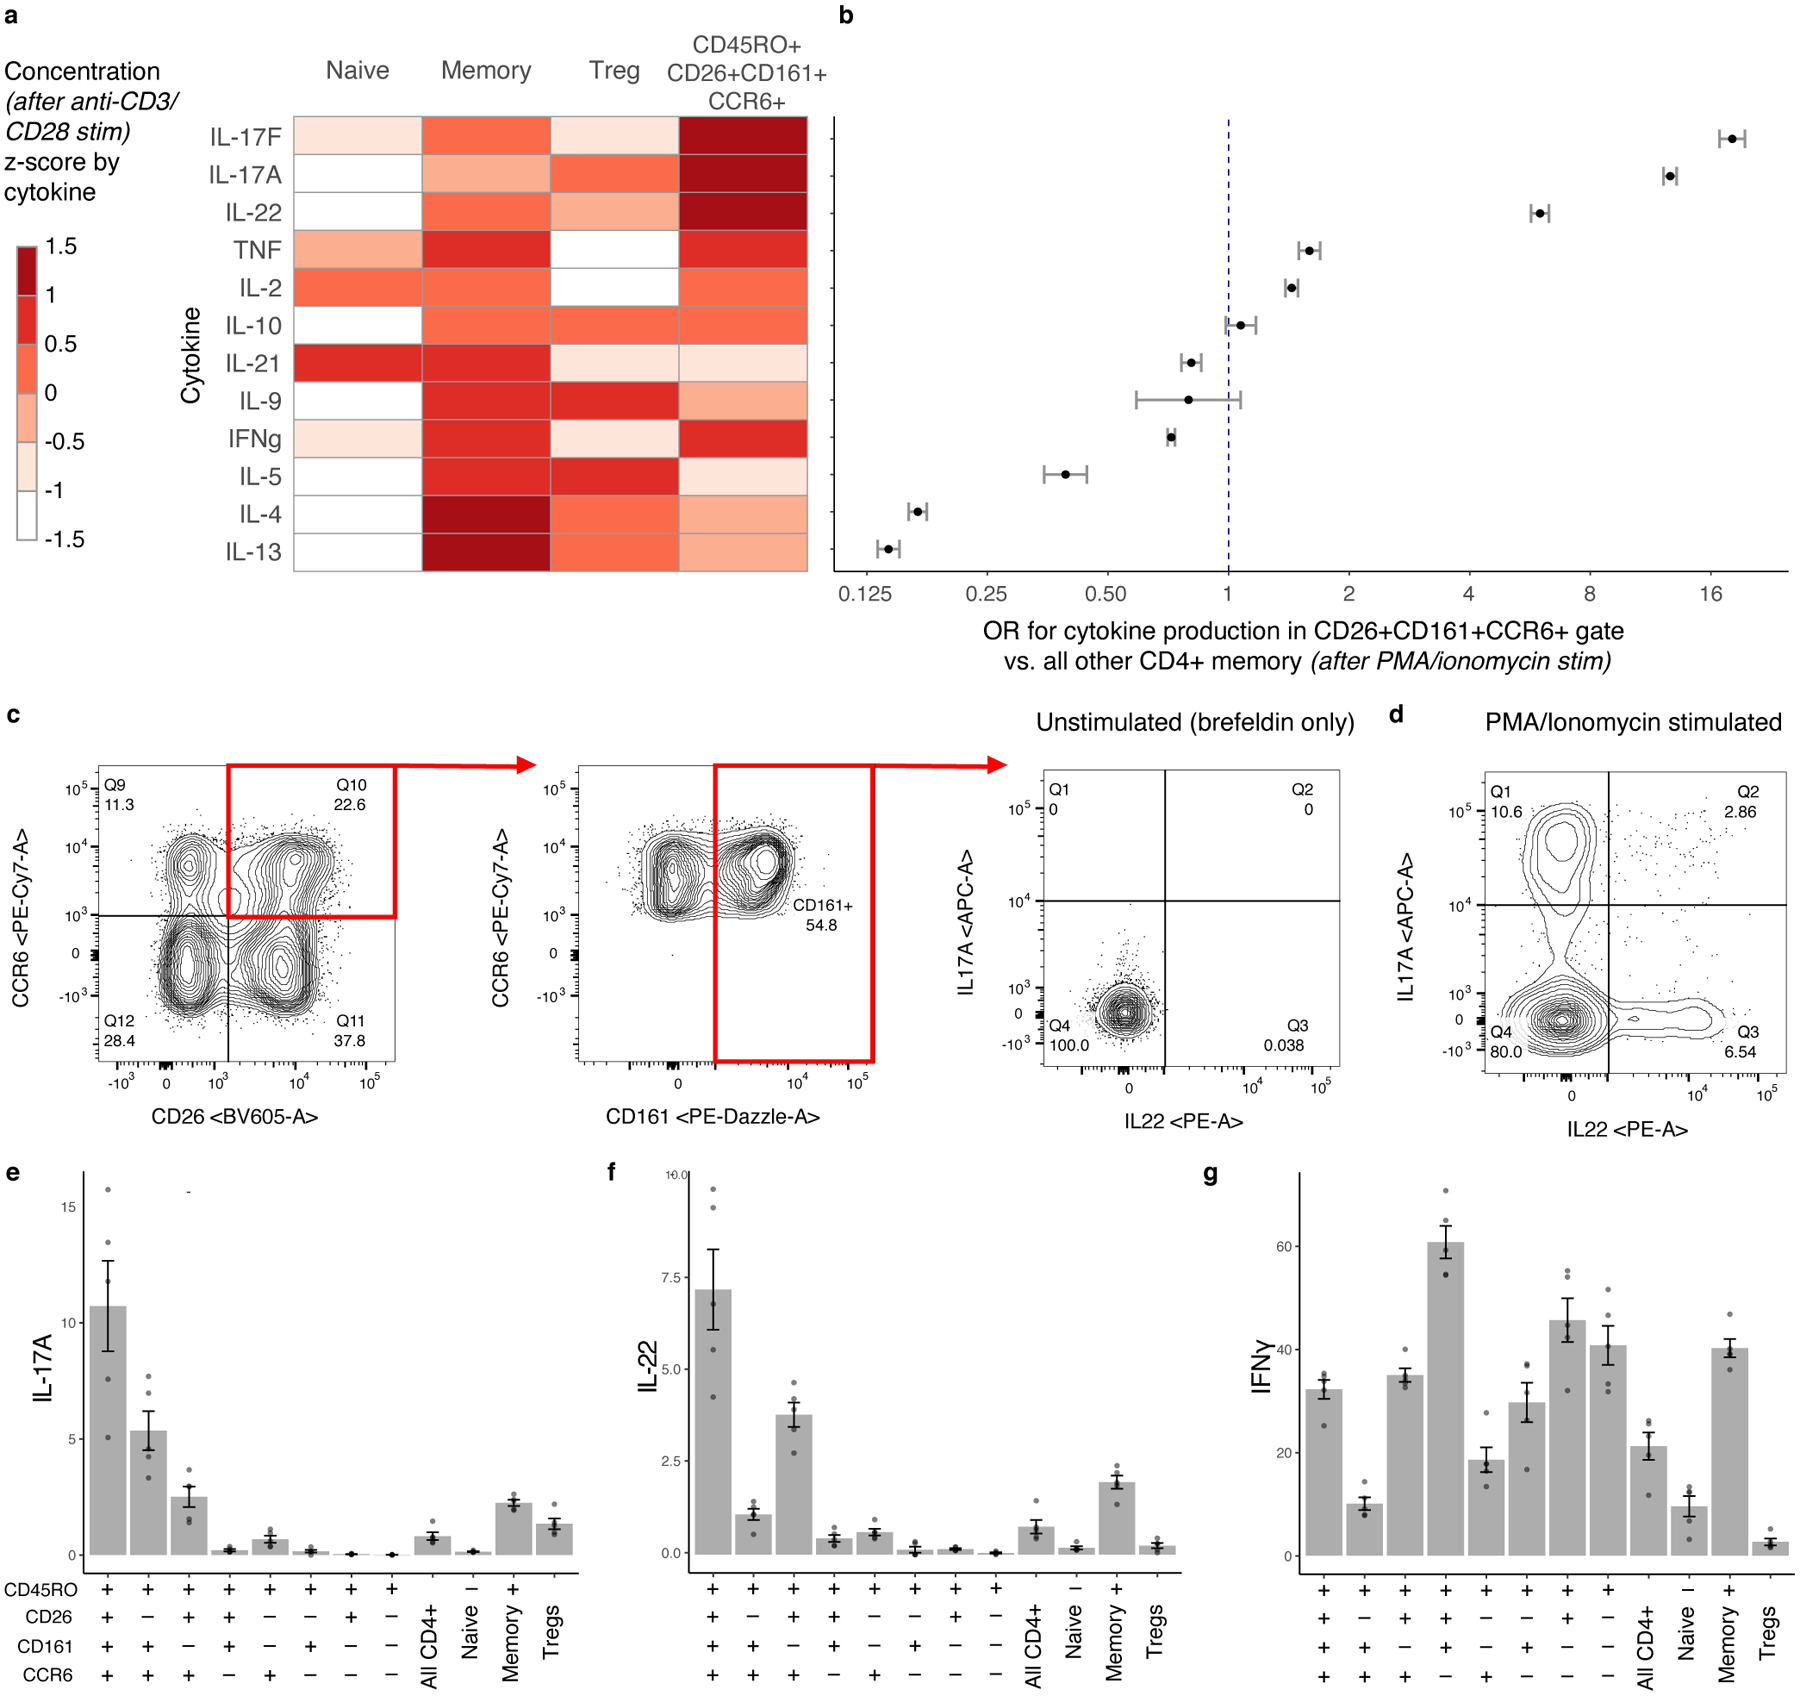
a, Cytokine expression in supernatant for four CD4+ T cell subsets after CD3/CD28 bead stimulation. We estimated cytokine concentrations and averaged across donors (n = 3), scaled by cytokine, and binned into sextiles. b, Cytokine expression in gated population based on ICS (n = 5). Data are presented as Cochran-Mantel-Haenszel ORs of cytokine production inside vs. outside the gate (95% CI error bars). c, Gating strategy to isolate CD26+CD161+CCR6+ memory CD4+ T cells. Intracellular staining for IL-17A and IL-22 is shown without stimulation and d, after stimulation with PMA/ionomycin. e–g, Per-donor percent of cells producing (e) IL-17A, (f) IL-22, and (g) IFNγ in gated populations. Bars represent the mean and error bars show standard error of the mean across 5 Boston donors unascertained for TB.
TB-associated state makes IL-17 at lower rates in progressors
Because IL-17 and IL-22 best characterized this population’s functional phenotype in non-Peruvian donors, we next measured these cytokines in Peruvian donors with a history of M.tb infection. We selected eight pairs of cases and controls from our original CITE-seq cohort—matched for age, sex, season of blood draw, and proportion of European genetic ancestry—and isolated CD4+ T cells. The target population’s (CD45RO+CD26+CD161+CCR6+) frequency correlated well with per-donor abundance of cluster C-12 (r=0.61; Fig. 7a) and gated proportions (r=0.62; Fig. 7b) in CITE-seq data.
Figure 7. Characterizing C-12 as an IL-17+ state with reduced function in Peruvian TB cases.
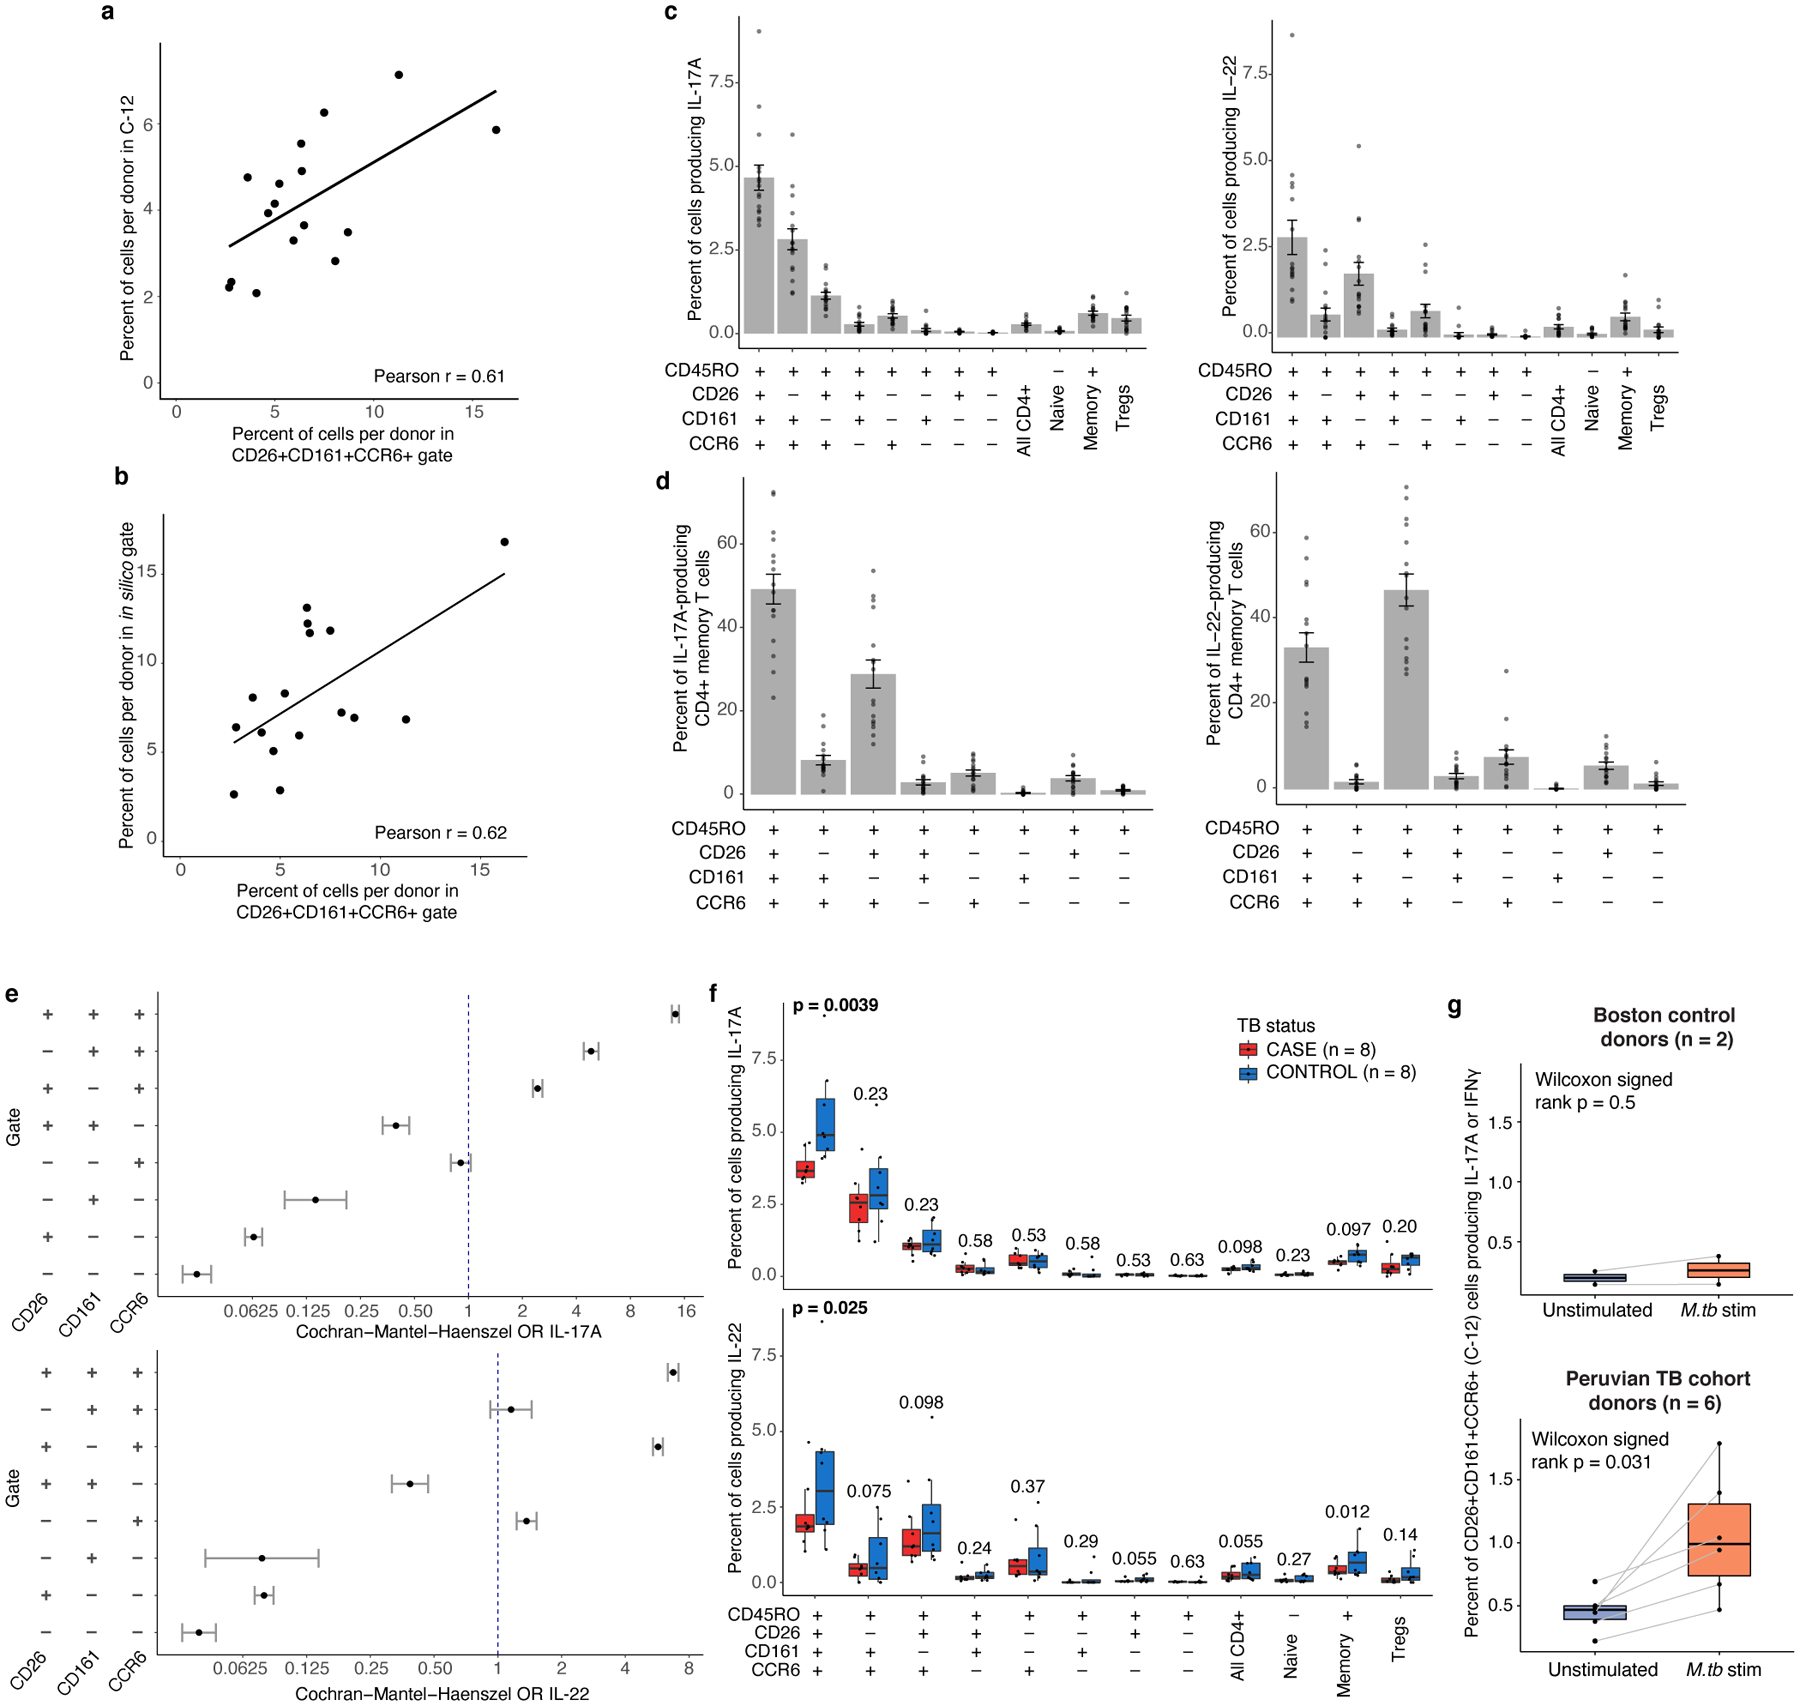
a, Correlation between abundance of flow-gated population (CD4+CD45RO+CD26+CD161+CCR6+) and C-12, per donor. b, Correlation between abundance of flow-gated population (CD4+CD45RO+CD26+CD161+CCR6+) and in silico-gated population, per donor. In, (a) and (b), we calculated a linear best fit line and Pearson correlation coefficient (r) across 16 donors. c, Per-donor percent of cells producing IL-17A (left) and IL-22 (right) in populations gated in Peruvian TB cohort donors. d, Percent of IL-17A (left) or IL-22 (right)-producing cells in gated populations. In (c) and (d), bars represent the mean and error bars show standard error of the mean across 16 donors. e, IL-17A or IL-22 production in gated populations. Data are presented as Cochran-Mantel-Haenszel ORs of cytokine production inside vs. outside the gate (95% CI error bars; n=16 independent samples). f, Case-control comparison of per-donor percent of cells in indicated gates producing IL-17A (top) or IL- 22 (bottom). Paired samples were matched for age, sex, season of blood draw, and proportion of European ancestry. P values are from a one-sided Wilcoxon signed-rank test. g, M.tb-specific IL-17A or IFNγ response to MTB300 stimulation in CD4+ CD26+CD161+CCR6+ memory T cells from either Boston control donors (n = 2) or Peruvian TB cohort donors (n = 6). Each point corresponds to the percent of cells producing IL-17A or IFNγ from one donor, measured with intracellular cytokine staining. Lines connect measurements from the same donor before and after stimulation with MTB300 peptide megapool. P values are from a two-sided Wilcoxon signed-rank test comparing donors before and after antigen stimulation. In (f) and (g), Boxplots show the median (vertical bar), 25th and 75th percentiles (lower and upper bounds of box, respectively), and 1.5×IQR (or minimum/maximum if they lie within that range; end of whiskers).
We stimulated samples with PMA and ionomycin and measured IL-17A and IL-22 in target and control populations. Similar to Boston samples, in Peruvians the target population contained more cells that produced IL-17A (mean=4.7±1.5% of cells in gate) or IL-22 (mean=2.9±2.0%) than any other Boolean combination of the three gates (Fig. 7c). In fact, despite making up on average only 6.6% of CD4+ memory T cells, the target population comprised over one-third of total IL-17A or IL-22-producing CD4+ memory T cells (IL-17A:49.2%, IL-22:33.2%) (Fig. 7d) and was 14.3 and 6.7 times as likely to produce IL-17A or IL-22, respectively (CMH OR, p<0.001; Fig. 7e).
We hypothesized that in individuals who progress to TB disease, C-12 may also have reduced function. To test this, we compared cytokine production in the target population between matched cases and controls. In response to PMA and ionomycin, only 3.8% of CD4+CD26+CD161+CCR6+ memory T cells in cases produced IL-17A, compared to 5.5% in controls (one-sided paired Wilcoxon signed-rank test p=0.0039; Fig. 7f). This functional deficiency was specific to our target population compared to broader populations, including CD4+ memory T cells (p=0.097). IL-22 production was also lower in cases than controls in CD4+CD26+CD161+CCR6+ memory T cells, but with weaker difference (p=0.025; Fig. 7f). IL-22 production was also significantly lower in cases among all CD4+ memory T cells.
TB-associated state has IL-17/IFNγ response to M.tb peptide
We investigated whether C-12 contains cells that respond to M.tb antigens. We stimulated PBMCs from six additional Peruvian donors with prior M.tb infection ≥4 years earlier (3 progressors, 3 non-progressors) with an M.tb peptide megapool (“MTB300”, Methods)47. Given its Th17-like phenotype with IFNγ production capacity, we measured IL-17A and IFNγ in the target population defined by C-12’s surface markers (CD4+CD45RO+CD26+CD161+CCR6+; Extended Data Fig. 10a,b). We assayed two Boston-based control donors who were likely M.tb-naïve, given lack of IL-17A or IFNγ T-cell response to M.tb stimulation (Extended Data Fig. 10c). We observed a response to MTB300 in the C-12 cells from formerly infected Peruvian donors: An average of 1.05% of cells per donor in the target population produced IL-17A or IFNγ with antigen stimulation, 2.3-fold higher than without antigen (Wilcoxon signed-rank p=0.031, Fig. 7g). In comparison, only 0.26% of target cells in controls produced IL-17A or IFNγ upon megapool stimulation (one-sided Wilcoxon rank-sum [TB cohort vs. control, with M.tb stim] p=0.036).
Discussion
In immunoprofiling studies, T cells repeatedly emerge as a likely contributor to disease48–50, but further investigation has been limited by the complexity of cell states and their interactions with non-immune factors. Here, we present an atlas of >500,000 memory T cells with unbiased multimodal single-cell measurements from a TB progression cohort with extensive demographic and environmental data. After defining cell states with a novel integrative approach, we identified associations between state frequencies and demographic and environmental factors, particularly age, sex, season, and genetic ancestry. Understanding how these factors influence T cells can inform the design of more robust T cell profiling experiments, for example by ensuring experimental groups are unbiased by these confounders or adjusting for them post hoc during analysis.
In this study, we leveraged the unique technical and analytical advances of this memory T cell dataset to identify states associated with TB disease progression. We focused on memory T cells because of previous studies that found immune10,14,51,52 and genetic53–55 evidence that TB progression is influenced by host memory T cells but did not comprehensively illuminate the landscape of progression-associated memory T cell differences outside disease-induced inflammation. Memory T cells are also involved in long-term immunity upon pathogen exposure. One practical limitation of our approach is excluding naïve and CD45RA+ TEMRA cells. This large dataset captures even rare memory subsets, defined through multimodal single-cell data. Moreover, by profiling donors in the absence of active disease, this resource is suitable for further investigation of unperturbed memory T cell phenotypes.
We found that the most significant steady-state differences between progressors and non-progressors reside in a rare (3% of memory T cells) multimodally defined Th17 subset (C-12) marked by a CD4+CD45RO+CD26+CD161+CCR6+ surface phenotype. These markers have each previously been associated with the IL-17-producing Th17 state31,56,57 and other functions: CD26 is a costimulatory molecule that promotes cytotoxicity57,58, CD161 is associated with innate-like function59, and CCR6 is a homing marker that directs migration to inflamed sites60.
We assayed donors who recovered from TB, suggesting that observed differences in C-12’s abundance and function may either be a long-term consequence of prior TB disease or predispose individuals to TB disease progression. Previous immunoprofiling studies have shown that changes in the T cell compartment persist immediately after TB disease and wane with time61,62. Although our study design limits our ability to conclusively disentangle disease sequelae from baseline differences, there is evidence suggesting that reduction in C-12 may precede disease.
First, we demonstrate in previously published cohorts that despite modulation during ongoing TB disease or treatment, C-12’s gene expression signature is elevated in latently infected controls compared to active TB cases even one year prior to progression. We trained a linear model on memory T cell and PBMC data and used it to estimate C-12 frequencies in a large public dataset from a closely matched cell type (sorted T cells) assayed pre-disease, motivating confidence in these inferences.
Second, mutations in RORC—the Th17 lineage-defining transcription factor that is highly expressed in C-12—increase susceptibility to mycobacterial diseases54. Mutations in IL17A and IL17F have also been associated with TB susceptibility, and blocking IL-17 in mice reduces capacity for anti-M.tb immunity after vaccination63,64.
Third, we show that C-12 cells respond to M.tb peptide antigens with IL-17A or IFNγ production. Previous studies in latent infection have mapped the bulk of M.tb antigen-specific cells to a Th1/17 CCR6+CXCR3+ state (distinct from C-12) that is expanded in latent compared to uninfected individuals29,65. Although these cells produced only IFNγ upon ex vivo M.tb antigen stimulation in those studies, in non-human primates they also produce IL-17 in bronchoalveolar lavage and expand in the lungs during latent infection compared to TB disease66 and upon intravenous Bacillus Calmette-Gueérin (BCG) vaccination67. IL-17 and IL-22 production and other aspects of the C-12 phenotype have also been previously identified in M.tb antigen-specific cells during active TB disease14,15,43. Considering previously described TB vaccine-induced Th1-polarization of lung-homing memory Th17s in mice68, C-12’s polyfunctional response to M.tb peptides may reflect anti-mycobacterial potential and this state may be a worthwhile target in vaccine design.
C-12’s potential to be a baseline correlate of TB progression risk is further supported by its depletion with increased age, in males, and outside of winter, all of which have been associated with TB risk8,69. These host variables may in part increase TB risk by reducing C-12 frequencies. Additionally, C-12 does not have an activated or exhausted phenotype, arguing that it is not the consequence of chronic stimulation. Further prospective studies profiling the immune system prior to infection are required in order to conclusively link baseline C-12 with response to M.tb infection.
Our results demonstrate the power of high-dimensional multimodal T cell profiling to identify steady-state immune differences between divergent disease outcomes. With consistent results across multiple modalities and datasets, we offer evidence supporting a hypothesis for how differences in memory T cell composition may reflect inadequate host response to M.tb. We also provide a resource to enable further robust study of numerous memory T cell phenotypes.
Methods
Clinical cohort
Our cohort is a subset of 14,044 individuals from a large epidemiological parent study of risk factors for TB infection and disease conducted between 2008–2012 (protocol approved by the Harvard University Institutional Review Board [ref. #19332] and the Research Ethics Committee of the National Institute of Health of Peru)18. All study participants were recruited from 106 district health centers in Lima, Peru and provided written informed consent. We enrolled index patients aged 16 or older with microbiologically confirmed pulmonary TB. Within two weeks of enrolling an index patient, we enrolled their household contacts who were assessed for co-prevalent TB disease by clinical evaluation and for M.tb infection by a tuberculin skin test (TST). Household contacts were reassessed at 2, 6, and 12 months for evidence of new M.tb infection or TB disease.
At time of enrollment, we collected demographic, health, and socioeconomic data from both index patients and household contacts, including age, sex, height, weight, alcohol use, smoking, prior incarceration, Bacillus Calmette-Guérin (BCG) vaccination scars, isoniazid preventative therapy, and previous TB diagnosis (Supplementary Table 1). Nutritional status was determined for children (age ≤ 19) based on the World Health Organization BMI z-score tables and for adults based on BMI thresholds: underweight (children: z-score ≤ −2; adults: BMI < 18.5), normal weight (children: −2 < z-score ≤ 2; adults: 18.5 ≤ BMI < 25), or overweight (children: z-score > 2; adults: BMI ≥ 25). Alcohol use was categorized as non-drinker (0 alcoholic drinks per day), light (< 40 grams or < 3 alcoholic drinks per day), or heavy (≥ 40 grams or ≥ 3 alcoholic drinks per day). Smoking was categorized as non-smoker (0 cigarettes per day), light (1 cigarette per day), or heavy (> 1 cigarette per day). BCG vaccination status was self-reported. Number of BCG scars was based on physician’s observation. Socioeconomic status (SES) was categorized into tertiles based on a principal component analysis (PCA) that included type of housing, access to a water supply, and sanitation. Season of blood draw was classified based on local temperatures: winter (June-September), spring (October-December), summer (January-May)
For this study, we re-consented and enrolled a subset of 264 participants whom we visited to obtain information on their TB history subsequent to the completion of the parent study and to obtain PBMCs. We considered index patients and household contacts who develop TB disease during follow up as cases, and TST-positive household contacts who did not develop TB disease as controls. We excluded participants if they did not consent to re-enrollment or were HIV-positive. We collected blood a median of 5.7 years after enrollment in the parent study (range 4.72–6.60). All cases had been infected with drug-sensitive strains and received treatment before re-recruitment. Controls were excluded if they were first-degree relatives of their index patient.
We calculated associations between each covariate and TB disease status with either a two-sided t test (continuous covariates) or a chi-squared test (categorical covariates). For significantly associated covariates, we re-estimated associations in a multivariate logistic regression model and determined significance based on coefficient p values.
Sample Processing
PBMC Sample Preparation.
Within 6–8 hours of obtaining blood samples, we purified PBMCs using Ficoll-Hypaque as described70, followed by cryopreservation at a concentration of 5 million cells/mL for shipping to Boston.
We quickly thawed cryopreserved PBMCs (10 million cells) and added each sample dropwise to pre-warmed complete RPMI (cRPMI) (RPMI 1640 supplemented with 10% heat inactivated fetal bovine serum (Gemini), nonessential amino acids (Gibco), 2-mercaptoethanol (Gibco), penicillin/streptomycin (Gibco), L-glutamine (Gibco)). We washed and resuspended cells in 1 mL of cRPMI and saved an aliquot of each sample (5% of total cells) at 4° C for flow cytometry staining.
Flow cytometry of total PBMCs.
We processed 12 samples per day on 23 days over a 15-week period. In total, we collected flow cytometric data on 276 samples (264 unique donors, with 12 technical replicates run in separate batches on consecutive weeks). We washed PBMCs in PBS and stained with blue fluorescent Live/Dead fixable dead cell stain (1:1000) (Invitrogen). We covered each sample in foil, and incubated for 20 minutes at room temperature. After centrifugation, we stained samples with an antibody master mix (Supplementary Table 3) in Brilliant Stain buffer (BD Bioscience, Cat #566349). We covered in foil and incubated for 25 min at 4° C. We washed samples with MACS buffer (pH 7.4 PBS, 2 mM EDTA , 2% FBS) and filtered through 40 um mesh prior to flow cytometry using a BD LSRFortessa™ and analysis with FACSDivva (version 8.0.1) and FlowJo (version 10.6.2). We used the gating strategy shown in Supplementary Fig. 2b to identify lymphocytes and memory subpopulations.
CITE-seq of isolated memory T cells.
We applied an optimized version of CITE-seq to memory T cells from 276 samples (264 unique donors, with 12 technical replicates)4. We processed 12 samples per day on 23 days over a 15-week period. We ran technical replicates in separate batches on consecutive weeks.
To isolate memory T cells, we modified the Pan T cell negative Isolation magnetic-activated cell sorting (MACSR) kit (Miltenyi Biotec, Cat #130-096-535) by adding anti-CD45RA biotin (Miltenyi Biotec, Clone REA1047, 2 uL per stain) to the antibody cocktail. For expected input of 10 million cells, we used 2x reagents to achieve high purity. After isolating memory T cells, we stained up to 300,000 memory T cells per donor. Then we centrifuged and stained each sample with FcX True Stain (BioLegend) with 0.2 ug/uL dextran sulfate sodium (Sigma-Aldrich, Cat #RES2029D-A707X) in labeling buffer (PBS 7.4 with 1% UltraPure Bovine Serum Albumin (BSA)) for 10 min at 4° C.
We then added a TotalSeq™-A (BioLegend) oligonucleotide-labeled antibody mix (anti-CCR6 suspended in 10 uL of labeling buffer) and incubated all samples at room temperature for 25 min. Next, we stained with the remaining 30 TotalSeq™-A antibodies (Supplementary Table 2) for 25 min at 4° C and washed cells three times with 2 mL, 1 mL, and 1 mL of labeling buffer sequentially. Each sample was passed through a 40 um filter and kept on ice prior to sorting on a BD FACSAria™ Fusion cell sorter.
We sorted up to 10,000 live cells from each sample based on forward and side scatter gating to remove non-lymphocytes, dead cells, and other impurities. We then pooled cells into batches of six donors. Batch assignments were randomized, requiring that no two donors in the same batch had a relatedness estimation in admixed populations (REAP) kinship score greater than 0.125 (at most, second cousins) based on genotype to facilitate post hoc demultiplexing71. Pools of 6 samples were sorted into one Eppendorf tube prepared with 200 uL of 0.04% BSA in PBS and each pool was processed as one scRNA-seq sample.
We prepared mRNA and surface marker libraries for each batch at the Brigham and Women’s Hospital Single Cell Genomics Core using the Chromium Single Cell 3’ v3 kit (10x Genomics). Pairs of libraries prepared on the same day were pooled and sequenced to a depth of 400 million reads per lane on an Illumina HiSeq X with paired-end 150 base-pair reads. In total, we sequenced 276 samples across 46 pooled libraries in 6 sequencing runs.
Bulk RNA sequencing.
PBMCs were thawed in warm cVIVO15 (X-VIVO™ 15 Media (Lonza) supplemented with 5% FBS (Gemini Bio), 55 uM 2-mercaptoethanol (Sigma), and 10 mM N-acetyl-L cysteine (Sigma)). We washed cells twice with cVIVO15, resuspended in PBS and spun down. Cell pellets were resuspended in RLT+ buffer (Qiagen) and flash frozen on dry ice. For RNA isolation, we thawed, vortexed, and incubated samples for 5 minutes at room temperature before RNA isolation using the Qiagen RNeasy extraction kit. After isolation, libraries were generated at the Molecular Biology Core Facilities at the Dana-Farber Cancer Institute and sequenced on an Illumina NovaSeq.
Genotyping and genetic data processing.
We genotyped all individuals on the LIMAArray, a previously described custom Affymetrix array designed based on whole-exome sequencing from 116 Peruvian individuals with active TB55. Genotypes were called for all 4002 individuals in the original genetic study with the apt-genotype-axiom program. We excluded individuals with high genotype missingness (≥ 5% of loci) or high heterozygosity rate (±3 standard deviations). We excluded loci with significant association with batch (p < 1 × 10⁻⁵), low call rate (< 95%), large difference in per-single nucleotide polymorphism (SNP) missingness rate between cases and controls (> 10−5), Hardy-Weinberg (HWE) p-value below 10−5 in controls, and duplicated position markers. After individual and SNP-level quality control, there were 263 donors and 677,385 SNPs remaining.
To measure global genetic ancestry proportions for each donor, we joined our cohort with previously published genotypes from the 1000 Genomes Project phase 3 (2,054 individuals from 26 populations)72, Siberians (245 individuals from 17 populations, and Native Americans (493 individuals from 57 populations) based on variant-level matching73. After removing variants with minor allele frequency (MAF) < 1%, 34,936 variants remained. We performed PCA and pruned for linkage disequilibrium (LD, r2 > 0.1 between any pair of markers within a sliding window of 50 markers with 10-marker offset) with PLINK (version 1.90b3w)74. We used the 22,266 remaining variants to measure global genetic ancestry with ADMIXTURE (version 1.3) at K = 475. Because of the admixed nature of the cohort, we calculated an admixture-aware genetic relatedness matrix with the REAP kinship score to account for linkage disequilibrium differences71.
We pre-phased genotypes with SHAPEIT2 and imputed genotypes at untyped autosomal loci with IMPUTE2, using the 1000 Genomes Project Phase 3 dataset as a reference panel76,77. After removing SNPs with INFO scores less than 1, 738,194 SNPs remained.
Statistical Analysis of Genomic Data
Aligning single-cell data and quantifying features.
We used Cell Ranger (version 3.1.0) to conduct all alignment and feature quantification of multimodal single-cell sequencing data. For mRNA, we aligned reads to the human genome (GRCh38 for transcriptomic analysis and hg19 for genotype-based demultiplexing). We aligned surface protein reads to a dictionary of feature tags. We collapsed reads mapping to the same gene or surface marker in the same cell to a single unique molecular identifier (UMI).
Single-cell sample demultiplexing.
We demultiplexed the six samples within each pooled batch based on genotypes at 738,194 SNPs. We used Demuxlet with default parameters, removed cells with ambiguous or doublet assignments78, and verified the accuracy by correlating the number of cells demultiplexed per sample with the number of live cells sorted after memory T cell isolation.
Single-cell sequencing data quality control.
We removed cells that expressed fewer than 500 genes or had more than 20% of their UMIs mapping to MT genes. Gene expression UMI counts were normalized per cell for library size and log-transformed:
For samples with high live cell counts but low numbers of demultiplexed cells, we merged single-cell sequencing reads assigned to each donor and called variants from merged data using bcftools (v1.9)79. We quantified the concordance between sequencing-based genotypes and array-based genotypes and corrected the donor labels for 4 samples. We identified and removed an additional 4 mislabeled samples. One more sample was removed for high genotype missingness and heterozygosity rate.
We normalized the surface marker UMI counts using a centered log ratio transformation for each cell. We used an in silico gating strategy to identify and remove contaminating non-memory T cells: We biaxially plotted cells based on their normalized expression of CD3 and CD45RO, manually determined thresholds of each marker’s expression to separate discrete subpopulations, and removed cells with expression of either marker below those thresholds. We additionally removed cells that were in clusters dominated by non-memory T cells.
Unimodal pipeline for dimensionality reduction.
For each modality, we selected the union of the top 1000 features with highest variance in each library preparation pool, and scaled the expression of each feature across all cells to have mean = 0 and variance = 1. For the mRNA expression, we also cosine normalized the scaled expression values. We used truncated PCA (irlba R package) to reduce the data into 20 dimensions and then corrected these PCs for donor and library preparation batch effects using Harmony23. With uniform manifold approximation and projection (UMAP), we reduced the batch-corrected embeddings into two dimensions for visualization80.
Multimodal pipeline for dimensionality reduction.
For each modality, we selected the union of the top 1000 features with highest variance in each library preparation pool and scaled the normalized expression of each feature across all cells to have mean = 0 and variance = 1. We excluded T cell receptor genes because of potential mapping errors due to recombination and sequence similarity. Then, we used CCA as implemented in the cc function (CCA R package) to calculate canonical dimensions81. This method finds maximally correlated linear combinations of features from each modality, i.e., calculates vectors a and b for mRNA matrix X and surface protein matrix Y to maximize cor(Xa, Yb) subject to the constraint that var(Xa) = var(Yb) = 1. We defined canonical variates by projecting cells onto each canonical dimension in the mRNA space (CV1 = Xa1) and selecting the top 20 dimensions defined by highest canonical correlations cor(Xai, Ybi) between mRNA and protein. We corrected donor and batch effects with Harmony and reduced the batch-corrected embeddings into two dimensions with UMAP.
Clustering and annotating cell states.
Cells were clustered based on low dimensional embeddings (PCs or CVs). We constructed a shared nearest neighbor graph (Seurat R package) and conducted Louvain modularity clustering at a range of resolutions. Results are shown at a resolution of 2.00, which yielded 31 CCA-based clusters with at least 10 cells from more than five donors.
To annotate clusters as cell states, we identified pseudo-bulk differentially expressed mRNA and surface protein features between cells inside and outside of each cluster. We collapsed single-cell expression profiles for each modality into pseudo-bulk profiles by summing the raw UMI counts for each gene or surface protein across all cells from the same donor, batch, and cluster. For mRNA, we limited differential expression analysis to genes that had at least 30 UMIs detected in at least 120 pseudo-bulk samples (n = 4,540), and for both modalities, we normalized counts for each feature in each pseudo-bulk sample into counts per million (CPM). We used separate linear models to estimate the effect of each cluster on pseudo-bulk expression of each gene, accounting for donor, batch, and the number of UMIs assigned to each pseudo-bulk sample. P values were obtained through a likelihood ratio test (LRT) between the models with and without the cluster term. We considered a gene or surface protein to be a marker of a cluster if it had a p<0.05/(4,540 genes × 31 clusters) = 3.6×10⁻⁷ and a fold-change>2. We manually annotated each cell state based on literature.
Aligning bulk RNA-seq data and quantifying features.
We used STAR (version 2.7.6a) to conduct all alignment of bulk RNA-seq data82. Paired-end reads were aligned to the human transcriptome (GRCh38), and we quantified gene-level expression with RSEM (version 1.3.1)83. We normalized gene expression within each sample to log2(transcripts per million [TPM]).
Testing cell populations for association with TB disease progression
We tested the association of each cell state with TB disease status with MASC35. We specified the number of UMIs and percent MT UMIs as cell-level covariates, and donor and library preparation batch as random effects, and fit the following logistic model for each cluster j:
where Yi,j is the odds of cell i being in cluster j, θj is the intercept for cluster j, βcase is the effect estimate (log(OR)) for case-control status, βcov is a vector of effect estimates for each donor-level covariate, βtech is a vector of effect estimates for each technical cell-level covariate, and Xs are the corresponding values for either cell i or donor d, as appropriate. (ϕd | d) is a random effect for cell i from donor d, and (κb | b) is a random effect for cell i from batch b.
With stepwise forward selection, we identified donor-level covariates that significantly influence cell state abundance. We used MASC to test for differentially abundant clusters associated with each covariate individually (univariate model), after correcting for the cell-level and batch covariates. For each covariate, this test yielded 31 cluster-specific LRT p values. Under a null hypothesis—where the covariate is not significantly associated with cell state abundance—and when clusters are independent, the test statistic computed from these cluster p-values follows a gamma distribution parametrized by rate=31 (the number of clusters) and scale=1. To assess independence, we ran 1,000 trials of a MASC model testing the association of cluster abundances with permuted TB disease status, adjusting for age, sex, donor, batch, percent MT UMIs per cell and number of UMIs per cell. We binned percent MT UMIs and number of UMIs into quintiles. We then measured the Pearson correlation between −ln(p values) under this null hypothesis for each pair of clusters. Furthermore, to determine if the test statistics produced under the null hypothesis followed the gamma distribution, we computed the p value for each of the 1,000 trials under the Gamma(31,1) distribution, and compared the observed −ln(p values) to uniformly distributed quantiles.
We then calculated a gamma test statistic and p value quantifying how much the distribution of p values for each of the 38 donor-level covariates deviates from the null, and selected the most significant covariate to add to the model. Then, we repeated this process for each remaining covariate with the expanded model, for a total of 5 iterations.
Based on this model selection process, we specified age, sex, winter blood draw, and percentage of European genetic ancestry as donor-level fixed effects, number of UMIs and percent MT UMIs as cell-level fixed effects, and donor and library preparation batch as random effects in our full MASC model:
Age was included as both a linear and a quadratic effect to capture non-linear effects. We used Bonferroni adjustment to account for multiple hypothesis testing. To verify that MASC has a well-controlled type 1 error, we ran 1,000 trials of a MASC model testing the association of cluster abundances with permuted TB disease status, described above. To measure case-control associations with populations from previous TB disease progression studies (Supplementary Table 9), we gated these populations based on normalized surface protein expression measured in CITE-seq, and used the same MASC model specified above to estimate the OR.
Constructing a linear predictor of C-12 abundance
We trained a linear model on pseudo-bulk T cell and bulk PBMC training data from our cohort to estimate the abundance of C-12 based on bulk RNA expression profiling data. For T cells, we computed pseudo-bulk expression of each gene in each sample (n = 271, including 12 technical replicates) by summing the gene’s counts across all cells from that sample, removed genes with <30 counts in any sample, and normalized these measurements within each sample to log2(CPM). For each sample, we computed the proportion of cells in C-12 out of all memory T cells passing QC in the CITE-seq dataset, and we measured bulk gene expression in PBMCs from a subset (n=15) of the T cell samples chosen to maximize variation of measured C-12 proportions. Genes with average expression<2 were removed and we normalized each gene to log2(TPM).
The predictor was a linear model with a ridge regularization term to avoid overfitting. We used 10-fold cross-validation to compute the optimal value of the ridge parameter (λ = 0.0020). We used the glmnet R package to train a ridge regression model with this parameter to predict the proportion of C-12 cells in each sample based on gene expression84. Features were limited to the 2,355 genes at the intersection of most variable genes and genes measured in the training and target dataset for prediction. To evaluate accuracy, we used 10-fold cross validation to train the model on 90% of samples and predict C-12 abundance in the remaining 10% of samples, and computed the Pearson correlation (r) between predicted and actual abundance. These predicted abundances in LIMAA samples were later used for comparison with predicted abundances in other cohorts.
We obtained RNA microarray data from Berry, et al. from the Gene Expression Omnibus (GSE19439 and GSE19435)42. These samples were collected as part of a multi-ethnic adult cohort recruited in the United Kingdom. Active cases were diagnosed by culture of sputum of bronchoalveolar lavage, latently infected donors were asymptomatic and positive by TST and interferon gamma release assay (IGRA), and healthy controls had no exposure to TB and were negative by TST and IGRA. Data were pre-processed as described in the original paper, and we used the trained linear predictor to estimate the abundance of C-12 in each donor. One dataset contained 3 groups of donors: BCG-vaccinated healthy uninfected, active TB, and latent infection. The other contained a subset of active TB donors followed longitudinally during anti-mycobacterial treatment (0, 2, and 12 months), and BCG-vaccinated healthy controls. We compared C-12 proportions between pairs of donor groups within each dataset with a two-sided t test.
To compute our power to detect the 20% case-control difference from LIMAA in C-12 in Berry, et al.’s sample, we repeatedly downsampled the LIMAA memory T cell data set to 7 cases (progressors) and 12 controls (non-progressors) 1,000 times. In each trial, we computed a p value for the difference between the average C-12 proportion in cases vs. controls with a two-sided t test. Then, we calculated power at significance level α=0.05 as the proportion of trials with p<α.
We also obtained RNA-seq data from Scriba, et al.43 from the Gene Expression Omnibus (GSE79362 and GSE103147) and selected unstimulated T cell samples from two pre-disease progression time points. These samples were nested from a prospective longitudinal cohort of asymptomatic M.tb-infected South African adolescents (age 12–18), monitored for 2 years for incident TB disease. All donors (n=54) were infected with M.tb prior to sample collection and either progressed to active TB at time point 0 (microbiologically confirmed, n=25) or remained latently infected (IGRA and/or TST-positive controls, n = 29). Controls were matched for age and sex. Each donor was sampled at 1–2 time points for a total of 98 samples. Data were normalized in each sample to log2(CPM), and we used the trained linear predictor to estimate the C-12 proportion in each sample. To compute the difference in C-12 frequency between cases and controls, accounting for repeated measures, we used a linear mixed model correcting for age, sex, sequencing technology, and donor (random effect) to regress predicted C-12 abundance on TB status. We obtained p values through two methods: (1) t test of the beta calculated for the TB progression term, using Satterthwaite’s method to approximate degrees of freedom as implemented in the lmerTest R package85, (2) comparison to a null distribution constructed through permutation of TB progression status across donors (10,000 iterations, p = 0.050).
To assess the specificity of the C-12 score for estimating the C-12 abundance, we used the C-12 ridge-regularized linear model trained on pseudobulk T cell and bulk PBMC expression data and computed a C-12 score for each of the 271 memory T cell samples in this study through 10-fold cross-validation (described above). We measured the Pearson correlation of these estimates with the proportion of each of the 31 clusters across the 271 samples and also correlated the proportion of C-12 with the proportion each of the 31 clusters across the 271 samples.
Defining sortable surface markers in silico
We used the single-cell surface marker expression to define flow-cytometry gates to isolate the CCA-defined cluster shown to be expanded in latent controls. We started with TCRαβ+, CD4+, and CD8− gates based on observed protein markers in the CITE-seq data. Then, using a classification and regression tree (CART) model implemented with the rpart R package, we defined a classification tree trained on the normalized expression of individual surface markers to partition the cells into subsets with the goal of isolating the cells in the cluster of interest. Gates were set manually based on discrete separation in the normalized expression distributions. We sequentially added gates until including another gate would reduce our sensitivity below 50%. We defined eight populations from Boolean combinations of these three gates: CD26+CD161+CCR6+, CD26−CD161+CCR6+, CD26+CD161−CCR6+, CD26+CD161+CCR6−, CD26−CD161−CCR6+, CD26−CD161+CCR6−, CD26+CD161−CCR6−, CD26−CD161−CCR6−.
Processing Boston donor samples
PBMCs were isolated from <6hr leukoreduction collars from the Specimen Bank at Brigham and Women’s Hospital using Ficoll-Hypaque as described above. All were discarded samples, collected under IRB protocol 2002P00127, and cryopreserved at 100 million or 50 million cells/mL in 50% FBS, cRPMI, and 5% DMSO in a Freezer buddy.
Bead-based quantification of cytokine production
We thawed aliquots of 150–200 million PBMCs from 3 Boston donors as described above. Samples were washed twice and resuspended in MACS buffer. We magnetically isolated all CD4+ T cells from each sample using a human CD4+ T cell negative isolation kit (Miltenyi biotec, Cat #130-096-533) per manufacturer instructions. We counted CD4+ T cells in each sample after isolation using a Countess™ II Automated Cell Counter and plated each in cRPMI at a concentration of 12.5 million/mL in a 96-well round bottom plate. Cells were incubated overnight at 37°C. After resting the cells, we combined all wells per donor and aliquoted 20 million cells from each donor for flow cytometry staining.
We centrifuged the samples and resuspended each in 1 mL of an antibody master mix consisting of Brilliant Buffer (BD Biosciences) and anti-CCR6 - PECy7 (BioLegend, Clone G03409). We covered in foil and incubated for 25 min at room temperature. Then we added 1 mL of a second antibody master mix consisting of Brilliant Buffer (BD Biosciences) and 9 markers for four-way sorting (Supplementary Table 10a). We incubated the samples for 25 minutes at 4°C. After staining, we washed the samples twice in 5 mL of MACS buffer, filtered through a 40um mesh filter, resuspended each in 1 mL MACS buffer, and kept all samples on ice in preparation for cell sorting.
We sorted each sample into 4 populations using a BD FACSAria™ Fusion cell sorter. Cells were collected in FACS tubes containing 50% FBS and 50% MACS buffer. Each population was gated on lymphocytes using forward and side scatter and further sorted: 1) Naïve CD4 T cells: CD3+CD4+CD45RO−CD62L+, 2) Other memory CD4 T cells: CD3+CD4+CD45RO+CCR6−/+CD26−/+CD161−/+, 3) Tregs: CD3+CD4+CD25+CD127low, 4) Target population: CD3+CD4+CD45RO+CCR6+CD26+CD161+.
After sorting, we resuspended each sample in cRPMI, counted using a Countess™ II Automated Cell Counter, and plated each sample population at 125,000–250,000 cells per well in a 96-well round bottom plate. We stimulated one well per population per sample with an equal volume of cRPMI containing a 1:1 ratio of washed CD3/CD28 Dynabeads™ (Thermofisher, Cat #11131D) or with cRPMI for non-stimulated controls. All conditions were incubated overnight at 37°C.
After incubation, we transferred the supernatant from each well into a new 96-well round bottom plate and froze the plate at −20°C. We followed manufacturer instructions for the LEGENDplex™ Human Th Panel (13-plex) kit (BioLegend, Cat #740722) in a 96-well V bottom plate. We tested for IL-2, IL-4, IL-5, IL-6, IL-9, IL-10, IL-13, IL-17A, IL-17F, IL-21, IL-22, IFNγ, and TNF. After thawing the supernatants, we diluted our samples 1:10 using Assay Buffer and collected data on a BD LSRFortessa™. We analyzed data using LEGENDplex™ Data Analysis Software. To estimate cytokine concentration in each sorted population, we averaged measurements across 2 technical replicates for each of 3 donors. We compared estimated cytokine concentration between populations with a two-sided t test.
Intracellular flow cytometry staining
In two experiments, we thawed aliquots of 50–200 million PBMCs from 5 Boston donors and magnetically isolated CD4+ T cells as described previously. We counted the remaining CD4+ T cells in each sample using Trypan blue and a hemocytometer. Then we plated each in cRPMI at a concentration of 10–12.5 million/mL in a 96-well round bottom plate and incubated samples overnight at 37°C. After resting the cells, we recombined all wells per donor and aliquoted 800,000 – 1,000,000 cells into new wells for stimulation. We stimulated cells with an equal volume of 2X PIM (81 nM PMA, 1.34uM ionomycin, and 5 ug/mL brefeldin), and kept the remaining wells unstimulated by adding only an equal volume of 2X brefeldin (5 ug/mL, BioLegend). We incubated plates at 37°C for 4 hours.
After stimulation, we transferred the samples to FACS tubes and washed twice with 500 uL cRPMI. We resuspended the samples in 500 uL of blue fluorescent Live/Dead fixable dead cell stain with PBS (1:1000) (Invitrogen) for 20 min at room temperature. After washing, we resuspended in 50 uL of the first antibody master mix consisting of Brilliant Stain Buffer (BD Biosciences) and CCR6 - PE/Cy7 (BioLegend, Clone G03409). We covered each in foil and incubated for 25 min at room temperature. Then we added 50 uL of a second antibody master mix consisting of Brilliant Stain Buffer (BD Biosciences) and 11 surface markers (Supplementary Table 10b). We incubated the samples for 25 minutes at 4°C. After staining, we washed the samples once in MACS buffer.
Next, we followed manufacturer instructions to fix and permeabilize the samples using a Cyto-Fast™ Fix/Perm Buffer Set from BioLegend (Cat #426803). We divided the unstimulated cells per donor in half and stained one tube of unstimulated cells and one tube of stimulated cells per donor with an intracellular antibody master mix consisting of anti-IL17A – APC (BioLegend, Clone BL168) and PE conjugated to either anti-IL-4, anti-IFNy, anti-IL2, anti-IL5, anti-IL9, anti-IL10, anti-IL13, anti-IL17F, anti-IL21, anti-IL22, or anti-TNF in the provided wash buffer (Supplementary Table 10c). Samples were covered in foil and incubated for 20 min at room temperature. Samples were washed twice in 1 mL of wash buffer and run on a BD LSRFortessa™. Data were analyzed using FlowJo version 10.6.2. The gating structure is shown in Supplementary Fig. 3.
In two subsequent experiments, we repeated the intracellular staining experiment above using 5 million PBMCs from 8 pairs of cases and controls from our Peruvian cohort matched for age (+/− 5 years), sex, season of blood draw, and proportion of European genetic ancestry (+/− 0.05). We stimulated 500,000 cells per condition and, after extracellular staining, we stained all samples with anti-IL17A – APC (BioLegend, Clone BL168) and anti-IL22 – PE (BioLegend, Clone 2G12A41). We collected data using two BD LSRFortessa™ analyzers.
To compare cytokine production across CD4+ T cell subsets, we gated all CD4+ T cells, all memory CD4+ T cells, all naïve CD4+ T cells, Tregs, and eight populations on Boolean combinations of three surface markers: CD26+CD161+CCR6+, CD26−CD161+CCR6+, CD26+CD161−CCR6+, CD26+CD161+CCR6−, CD26−CD161−CCR6+, CD26−CD161+CCR6−, CD26+CD161−CCR6−, CD26−CD161−CCR6−. We calculated the OR of cells in a given population producing each cytokine, across all donors, with the Cochran-Mantel-Haenszel method. We compared the percent of cells producing IL-17A or IL-22 between cases and controls with a one-sided Wilcoxon signed rank test.
MTB300 peptide megapool stimulation of PBMCs
PBMCs were thawed in warm cVIVO15, washed twice, filtered through 70 uM cell strainers, and rested overnight in a tissue culture incubator (5% CO2) in 96-well U bottom plates at a concentration of 2 million cells/well. The next day, cells were recovered, counted, and cultured in 96-well U bottom plates at a concentration of 1 million cells/well. We added LEAF-purified anti-CD28 (BioLegend CD28.2), anti-CD40 (BioLegend HB14), and anti-CD49d (BioLegend 9F10) to all the wells to a final concentration of 1 ug/mL. To the peptide stimulated well, we added MTB300 megapool (reagent provided by Dr. Cecilia Lindestam Arlehamn) to a final concentration of 2 ug/mL. After incubation for 2 hours, we added Brefeldin A (BioLegend) and Monensin (BioLegend) to a final concentration of 5ug/mL and 2uM, respectively, and incubated cells for 16–18 hours in a tissue culture incubator. After stimulation, cells were recovered, transferred to 96-well V bottom plates, stained with conjugated antibodies, fixed and permeabilized, stained with antibodies for intracellular IL-17A and IFNγ, and analyzed on a BD LSRFortessa™ as previously described in the PMA and ionomycin stimulation experiment. We also used the same antibodies and concentrations as in that experiment (Supplementary Table 10b–c).
To assess M.tb response across all T cells, we gated CD3+ live cells, and for C-12 cells, we gated CD4+CD45RO+CD26+CD161+CCR6 non-Treg T cells. For both analyses, we quantified the percent of cells producing IL-17A or IFNγ in the unstimulated and stimulated samples from each donor, and calculated a fold change in the mean percent cytokine-producing cells (across donors) between stimulated and unstimulated cells. P values were obtained from the two-sided Wilcoxon signed-rank test for paired samples. To compare cytokine production between CD26+CD161+CCR6+ cells from Boston control donors and TB cohort donors, we computed a p value from the Wilcoxon rank-sum test.
Data availability
Single-cell sequencing data are available on dbGaP; count matrices and meta data are on GEO (GSE158769). Single cell expression and cluster abundance data can also be explored in an interactive browser at https://immunogenomics.io/tbru/. Genotype data is available on dbGaP (accession: phs002025.v1.p1).
Code availability
Custom analysis scripts are available on GitHub (https://github.com/immunogenomics/TB_Tcell_CITEseq).
Extended Data
Extended Data Fig. 1. CITE-seq cell and feature quality.
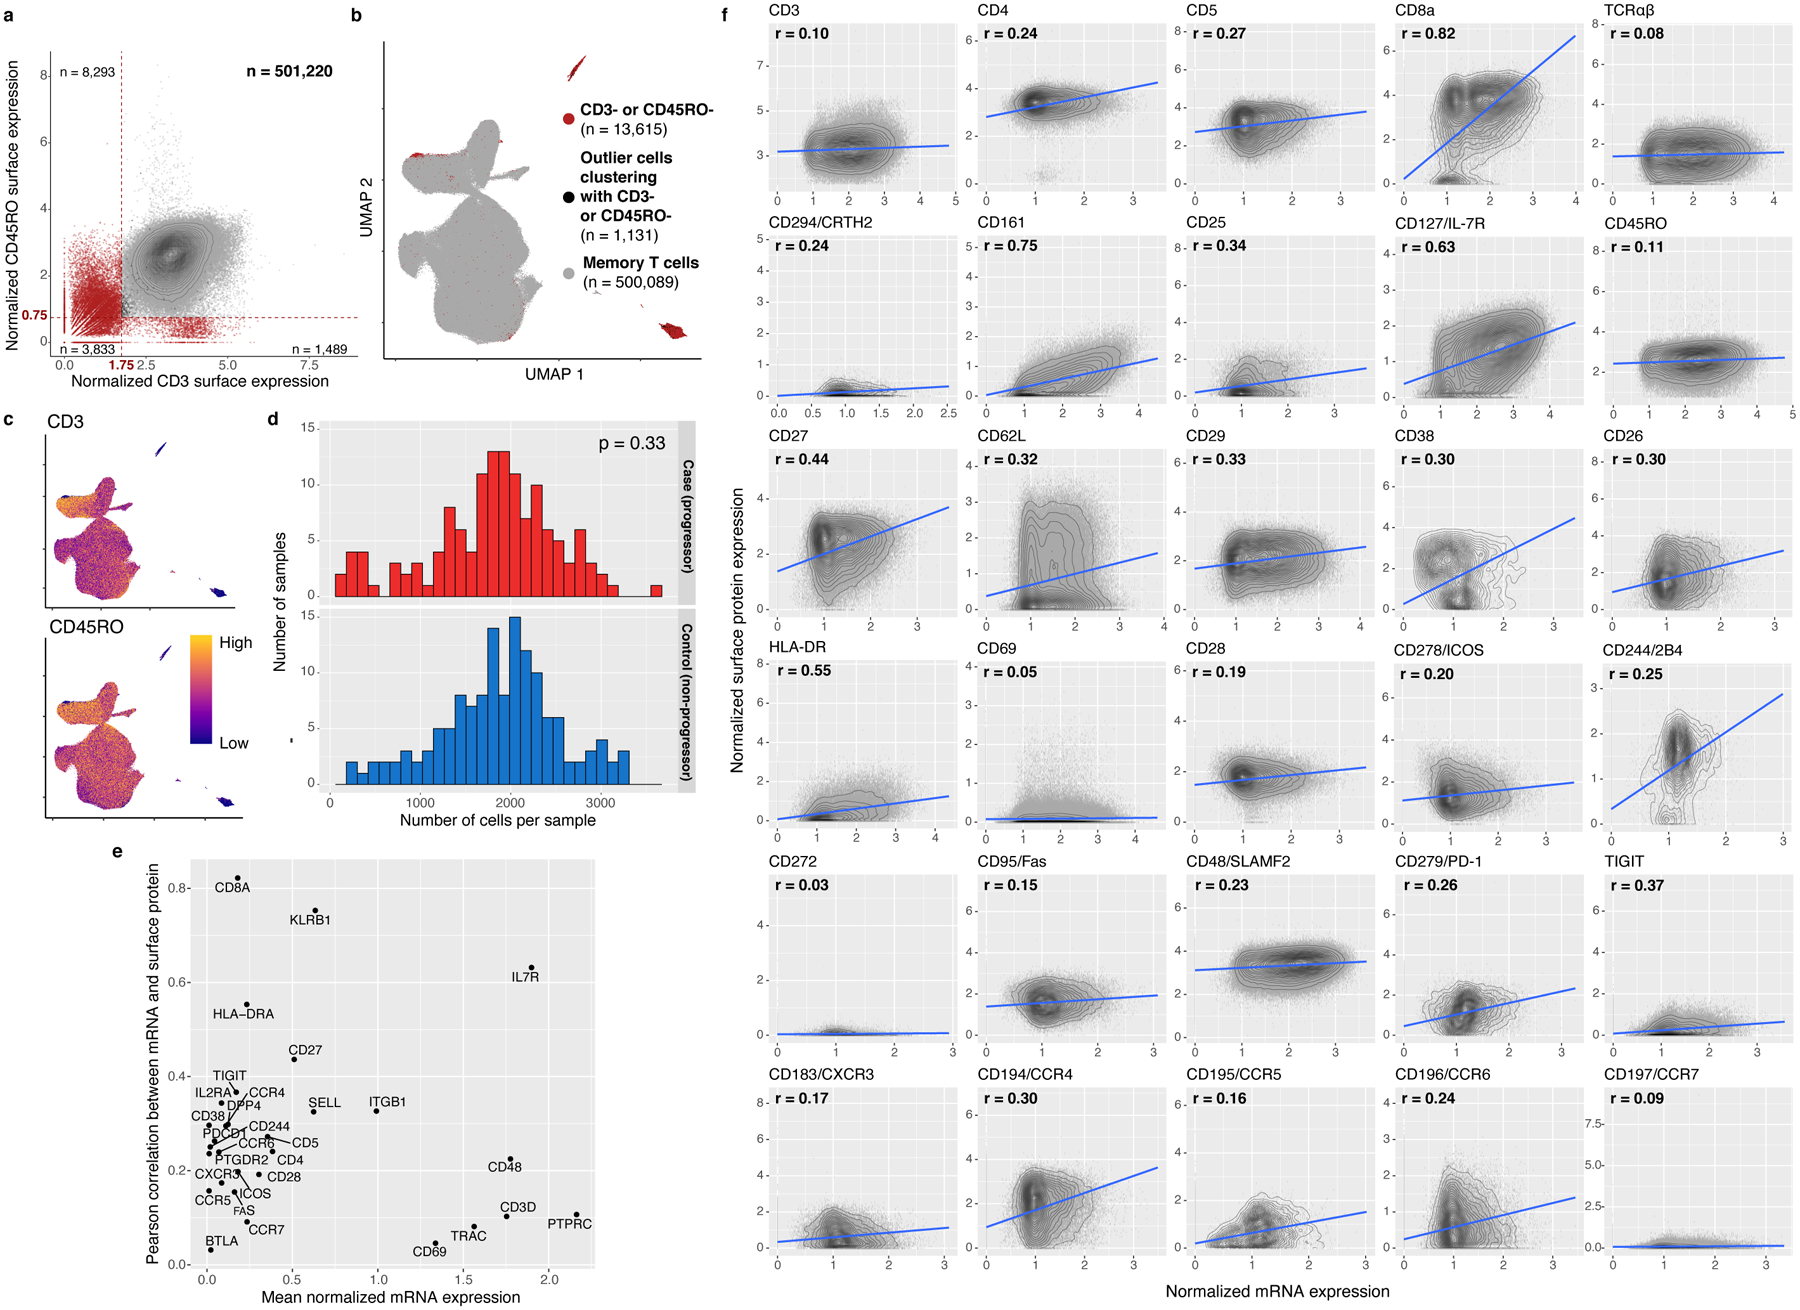
a, In silico memory T cell gating. Each cell is plotted based on its normalized surface expression of CD3 and CD45RO, measured through CITE-seq. Gates are demarcated with red dashed lines. Red cells were removed. Counts represent the number of cells in each quadrant. b, UMAP representation of gated cells. Red cells were gated out in (a) and cells clustering with them in the UMAP (shown in black in (a) and (b)) were also removed. c, Normalized CD3 and CD45RO surface protein expression. d, Number of cells per sample after QC, stratified by TB progression status. P value is from a two-sided t test comparing mean cell counts in each group. e, Pearson correlation coefficient (r) was calculated between normalized mRNA and surface protein expression for each marker across cells passing QC. r is plotted against average normalized mRNA expression for each protein. f, Each cell is plotted based on normalized expression of each marker in surface protein and mRNA, both measured through CITE-seq, with density contours. We fit a best-fit line (in blue) with a linear model.
Extended Data Fig. 2. Comparing proportions of eight major T cell states between flow cytometry and CITE-seq.
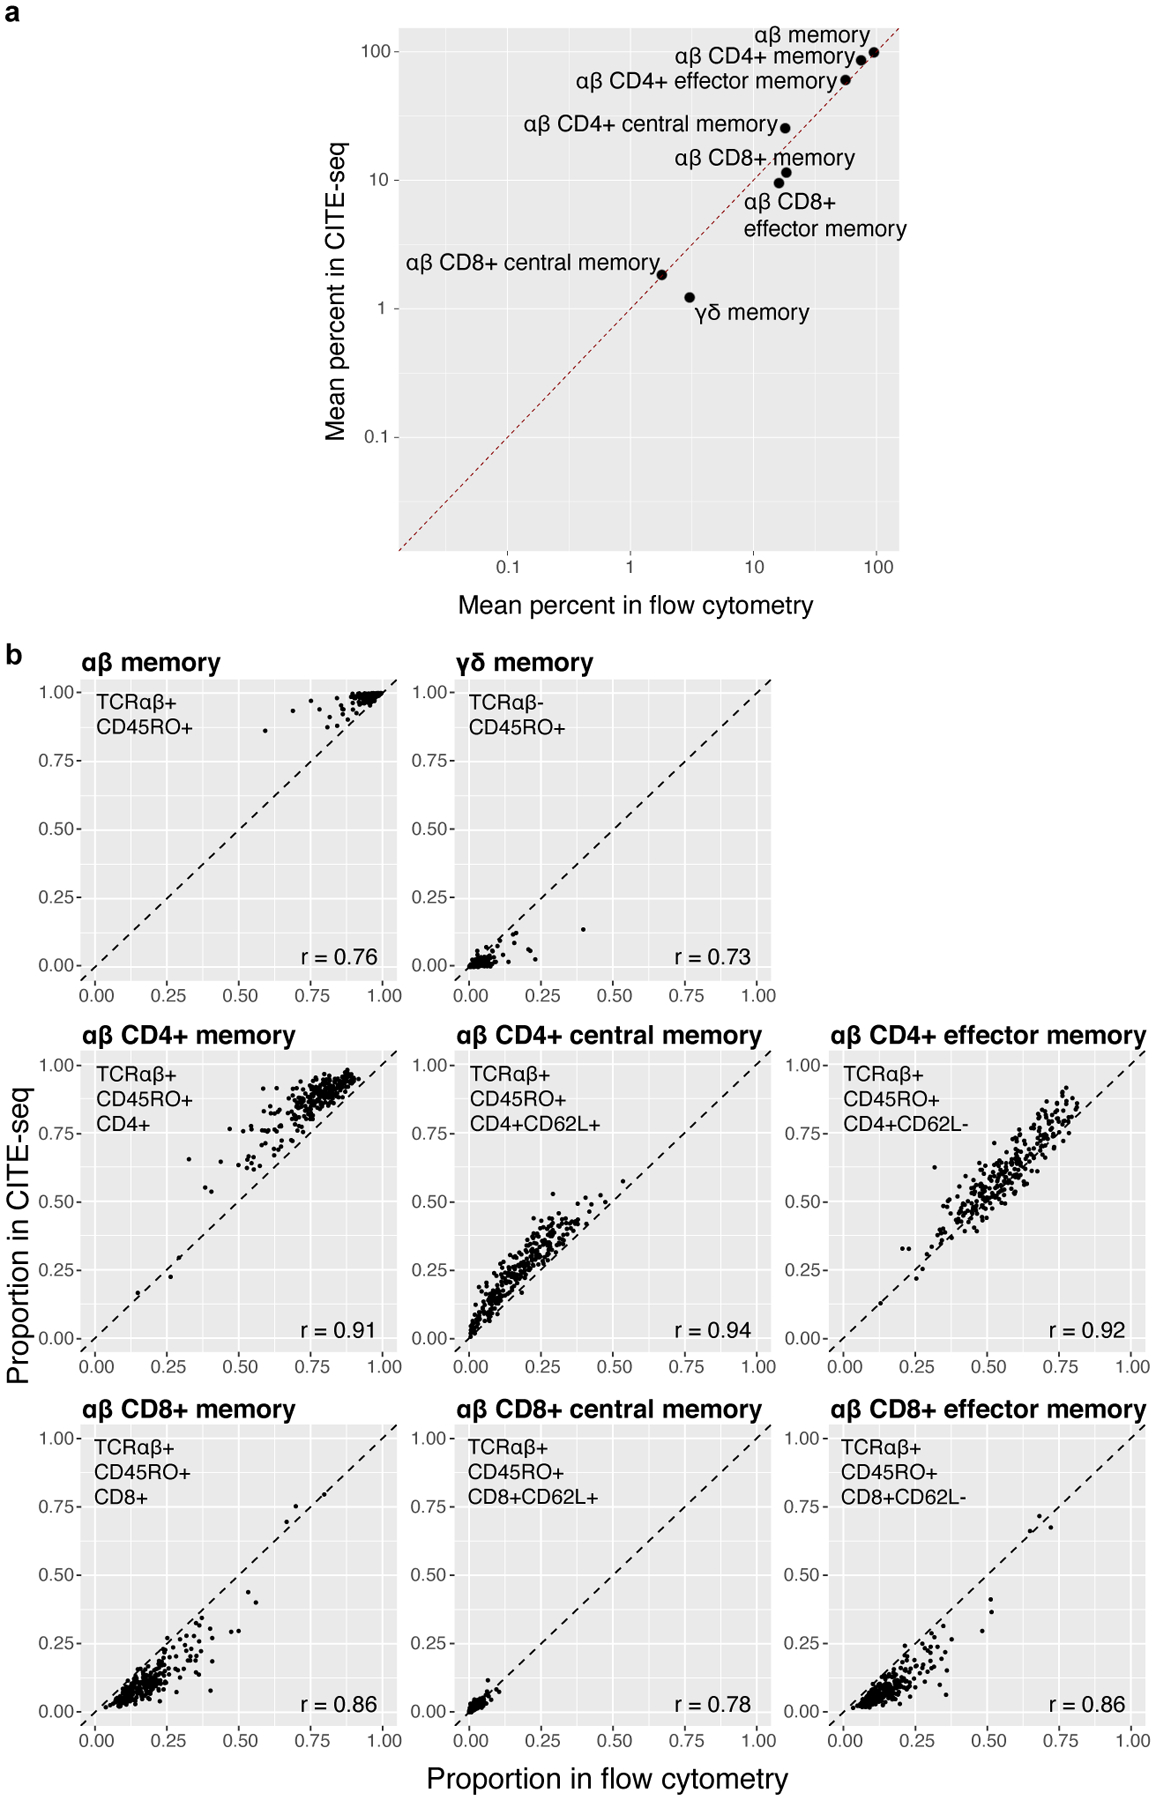
a, Average percents per population in CITE-seq vs. flow cytometry. Gates in (b). Dashed line indicates the identity line. b, For each population, proportions plotted across 259 donors. Flow cytometry gating occurred after gating T cells. CITE-seq gating occurred after isolation of memory T cells. The dashed line indicates the identity line, and we calculated Pearson correlation coefficients (r) for each state.
Extended Data Fig. 3. Multimodal integration with canonical correlation analysis.
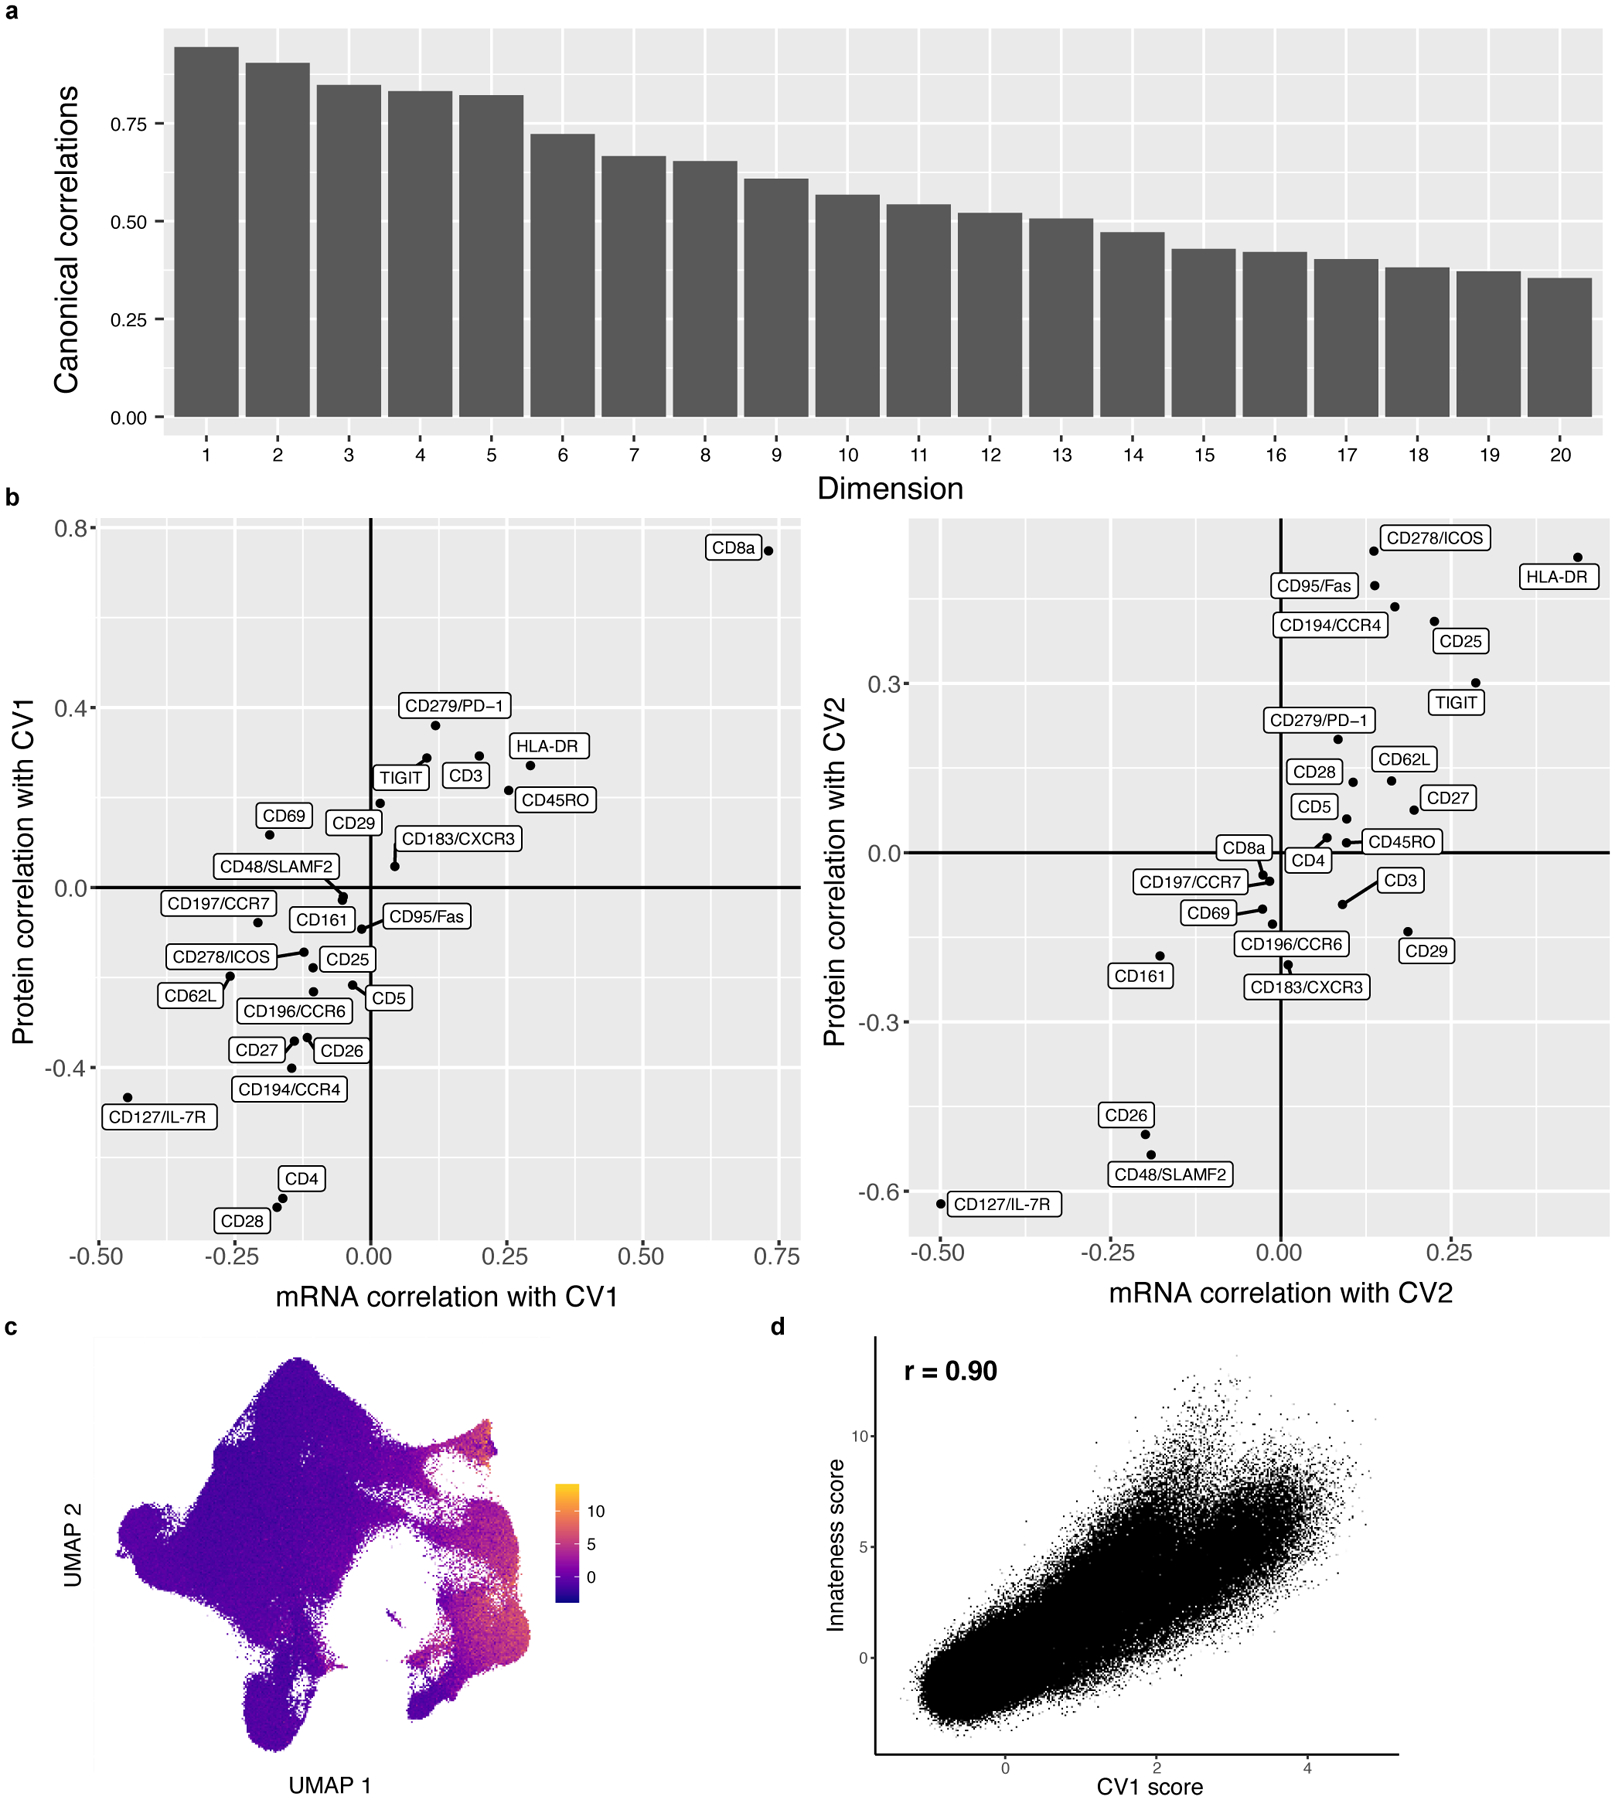
a, Correlations for the top 20 canonical dimensions used in downstream analysis. Bars represent the Pearson correlation between mRNA and protein projections for each dimension. b, Marker correlation with canonical variates (CVs). Each marker is plotted based on its mRNA and protein correlation with CV1 (left) or CV2 (right). c, Innateness scores. UMAP is colored based on a gene expression-derived cytotoxicity score defined in Gutierrez-Arcelus, et al. d, Correlation between innateness score and CV1. Each cell is plotted based on its innateness score from (c) and its CV1 projection, and we report the Pearson correlation coefficient.
Extended Data Fig. 4. Single-cell expression of surface proteins, measured with CITE-seq.
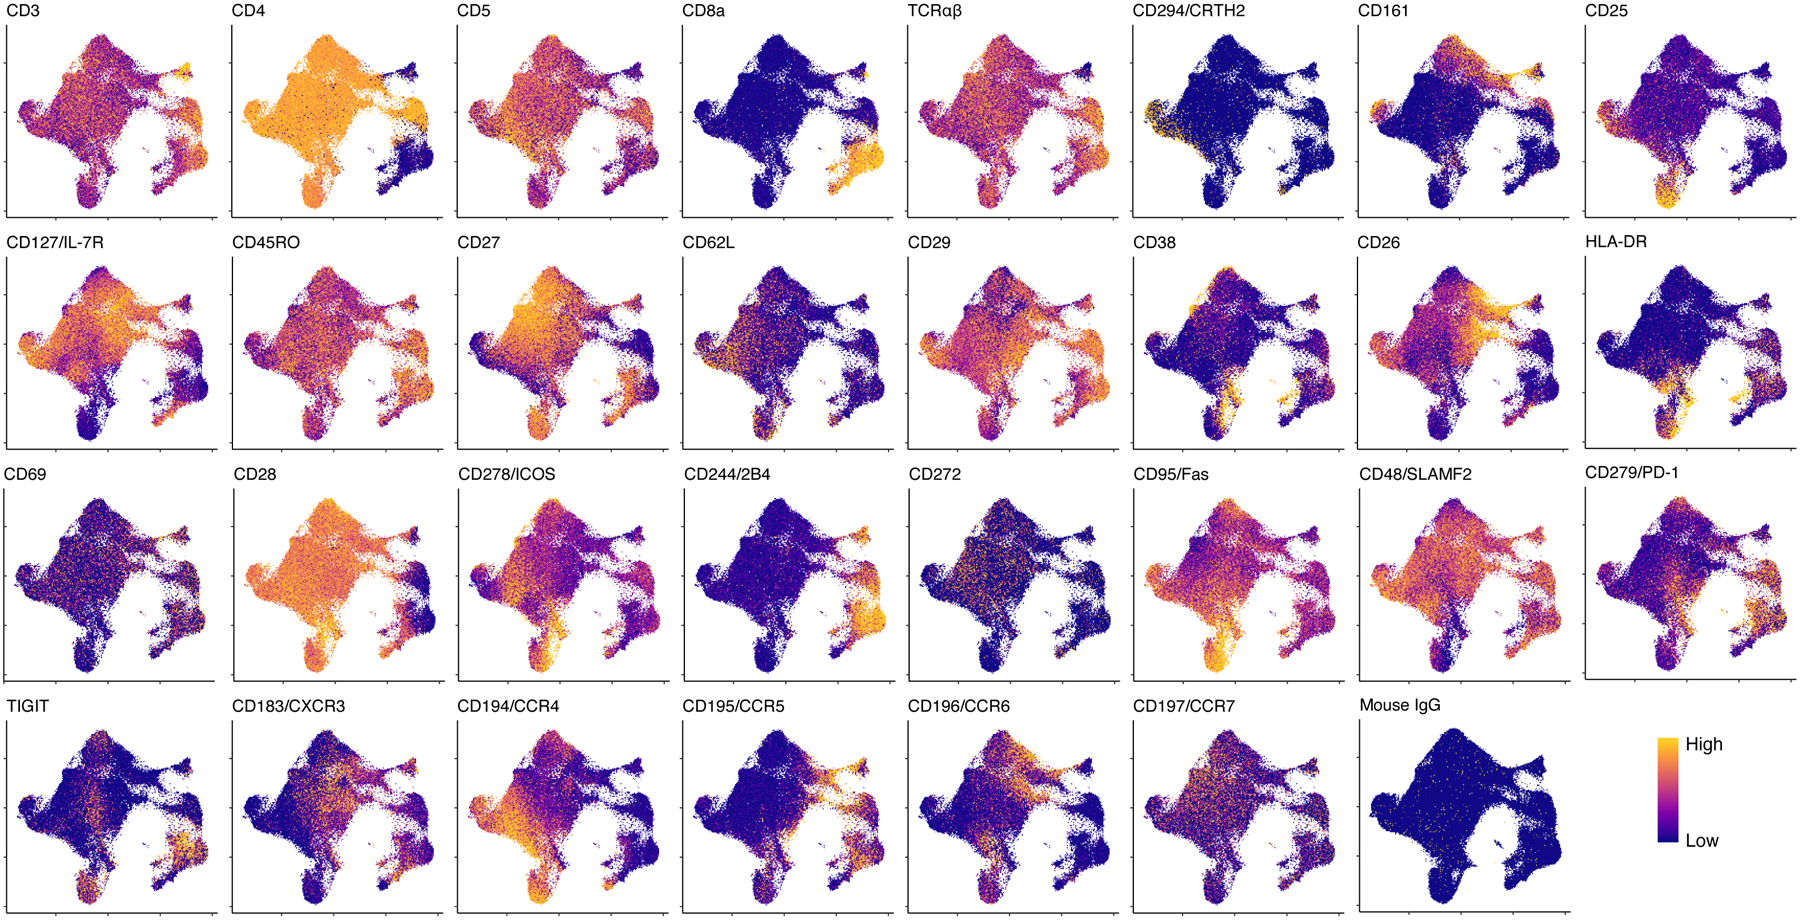
Each cell is colored according to its expression of each protein and plotted in UMAP space. Colors are scaled independently for each marker from minimum (blue) to maximum (yellow) expression.
Extended Data Fig. 5. Technical replicate consistency.
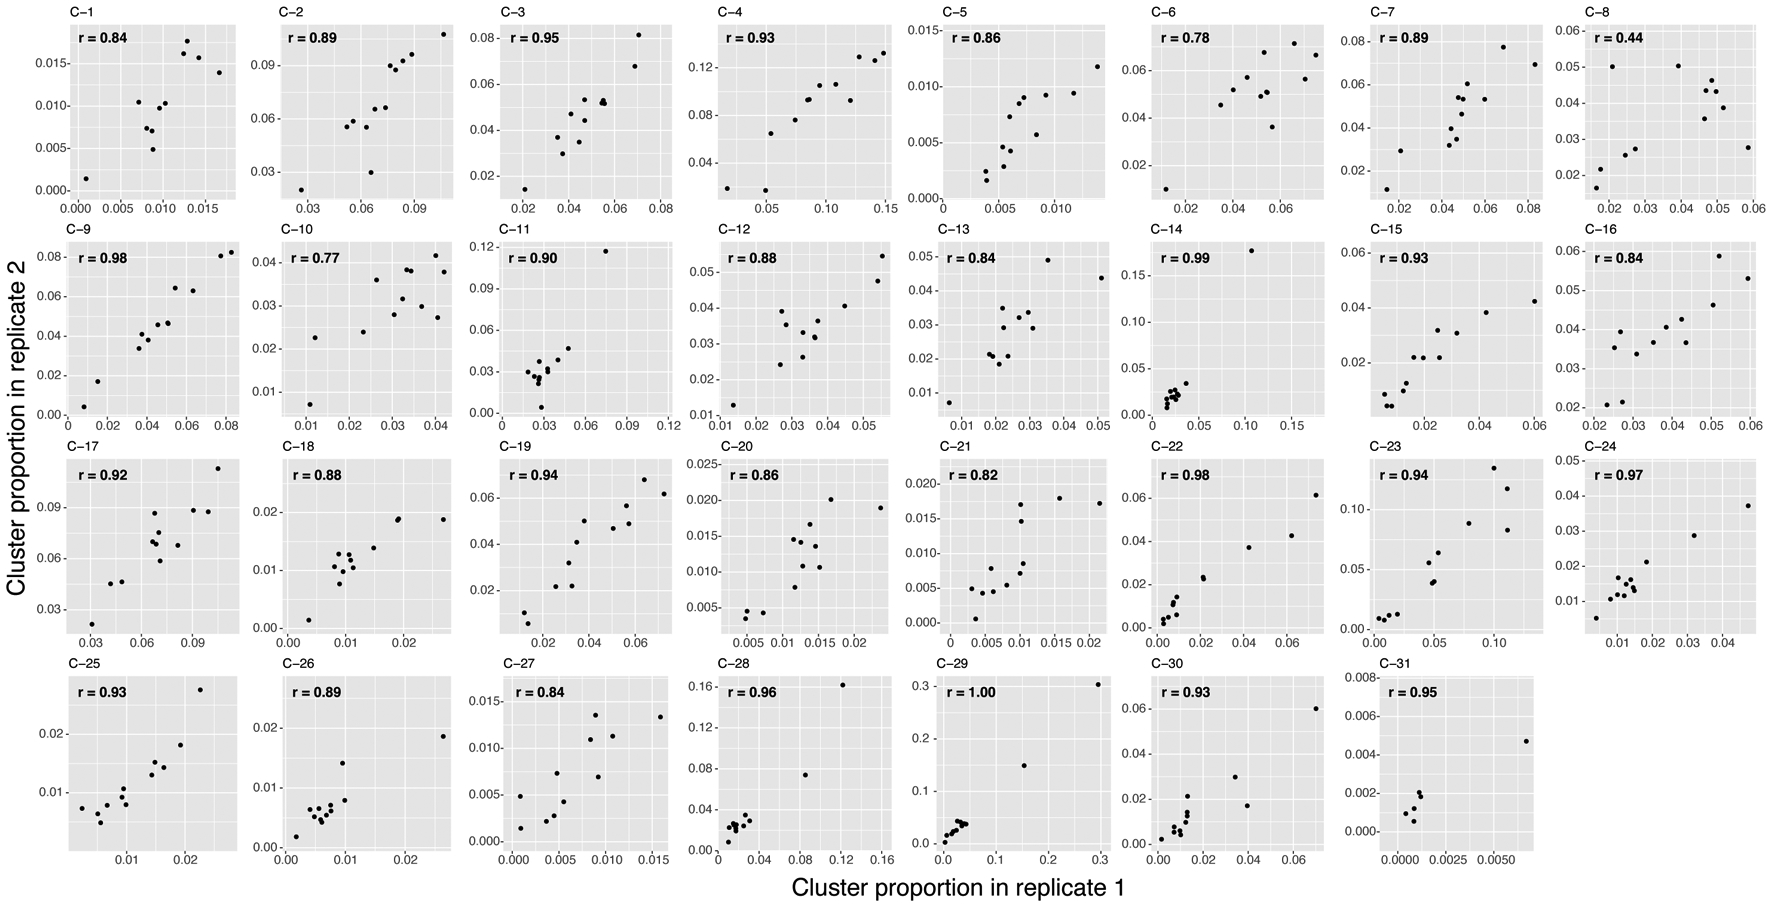
For each of the 31 clusters, we plotted each multimodal donor based on its proportion in replicate 1 and in replicate 2. We calculated the Pearson correlation coefficients (r) for each cluster.
Extended Data Fig. 6. Effects of donor covariates on memory T cell states.
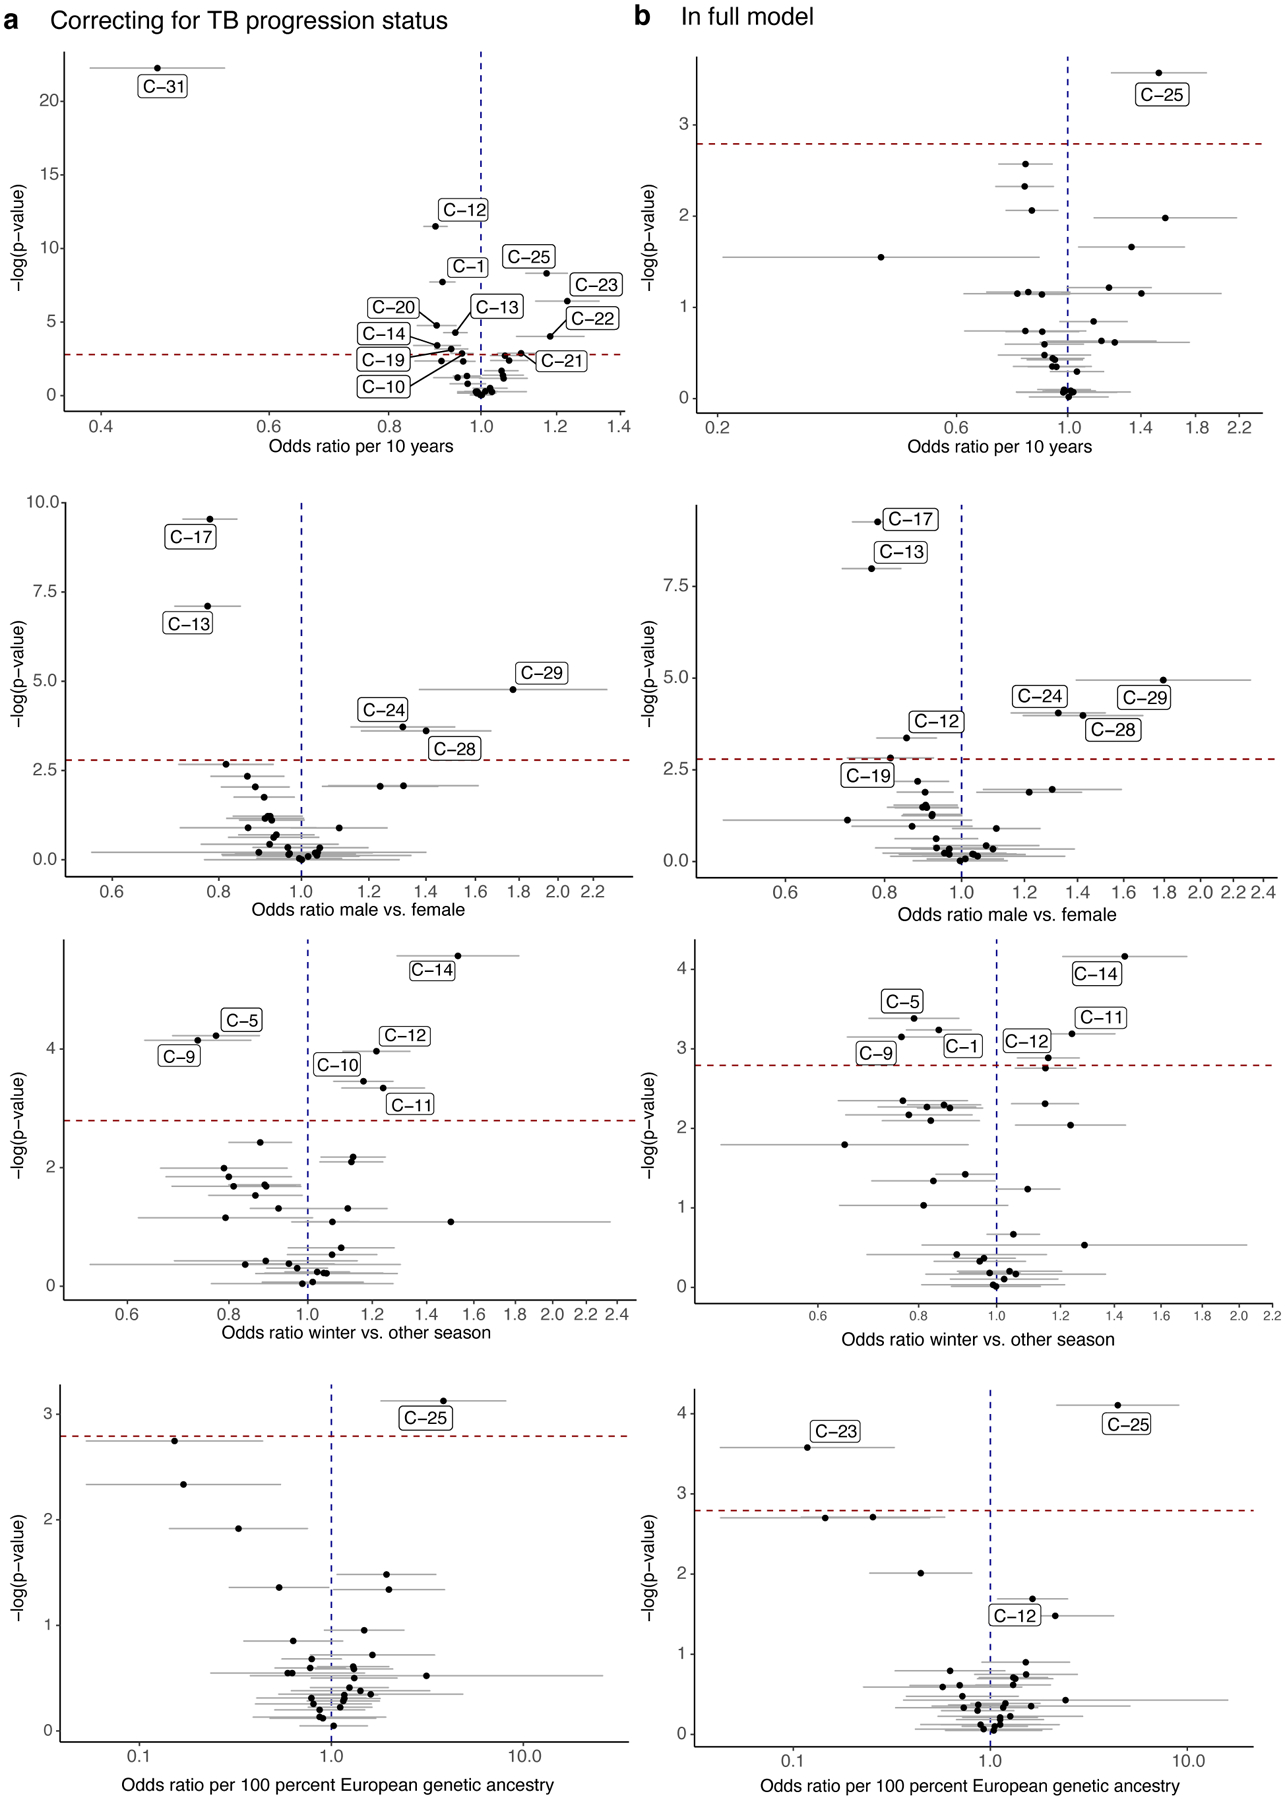
Effects of age, sex, winter blood draw, and proportion of European genetic ancestry in (a) model correcting for technical covariates (# UMIs/cell, % MT UMIs/cell), donor, batch, and TB disease status, and (b) full model with TB disease status, age, sex, winter blood draw, proportion of European genetic ancestry, technical covariates, donor, and batch. For all, n=271 samples from 259 independent donors. For each cluster, data are presented as the MASC OR of a cell being in each cluster given the contrast covariate (95% CI error bars), and the −log(LRT p value) of the association. The dashed horizontal line corresponds to a Bonferroni p-value threshold of 0.05/31. Labeled clusters are significant at this threshold.
Extended Data Fig. 7. Unimodal clusters and associations with TB disease progression.
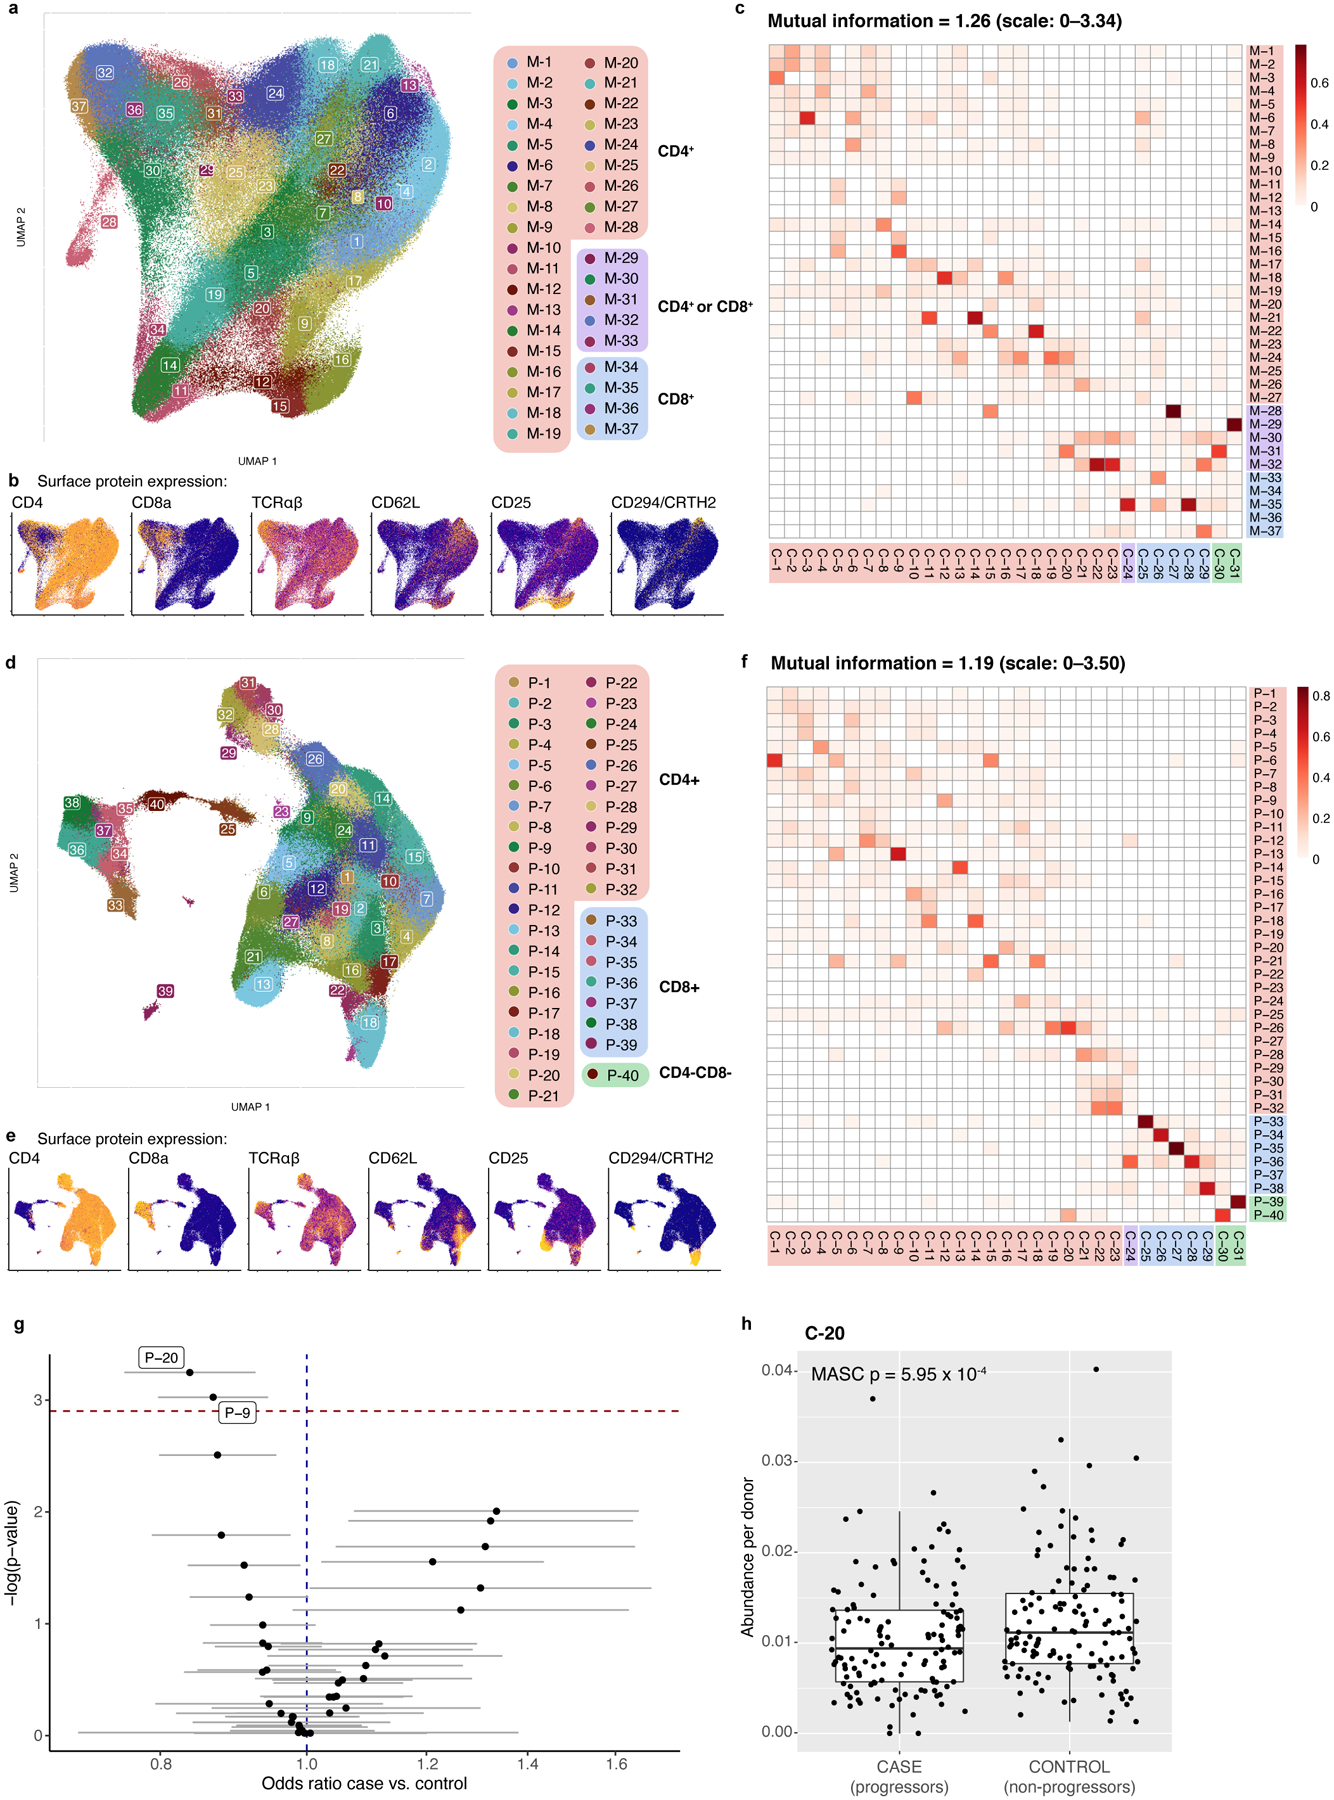
a–c, mRNA clusters. d–f, protein clusters. a and d, UMAPs colored by unimodal clusters. Clusters boxed in red are CD4+, purple are mixed CD4+ and CD8+, blue are CD8+, and green are CD4−CD8−. b and e, Expression of major lineage-defining surface markers measured through CITE-seq. The UMAPs are colored by the expression of five markers measured through CITE-seq. Colors are scaled independently for each marker from minimum (blue) to maximum (yellow) expression. c and f, Heatmap of overlap between mRNA and multimodal clusters. Colors indicate the proportion of the multimodal cluster (column) overlapping with the mRNA cluster (row). g, Associations between TB disease status and unimodal protein clusters. For each cluster, the data are presented as MASC ORs of a cell being in each cluster for cases vs. controls (95% CI error bars), and the −log(LRT p value) of the association (n=271 samples from 259 independent donors). The dashed horizontal line corresponds to a Bonferroni p-value threshold of 0.05/40. Labeled clusters are significant at this threshold. h, Abundance of C-20 in 128 cases and 131 controls. P value is from an LRT with 1 d.f. Boxplots show the median (vertical bar), 25th and 75th percentiles (lower and upper bounds of box, respectively), and 1.5×IQR (or minimum/maximum if they lie within that range; end of whiskers).
Extended Data Fig. 8. Cell state signature extrapolation in public data.
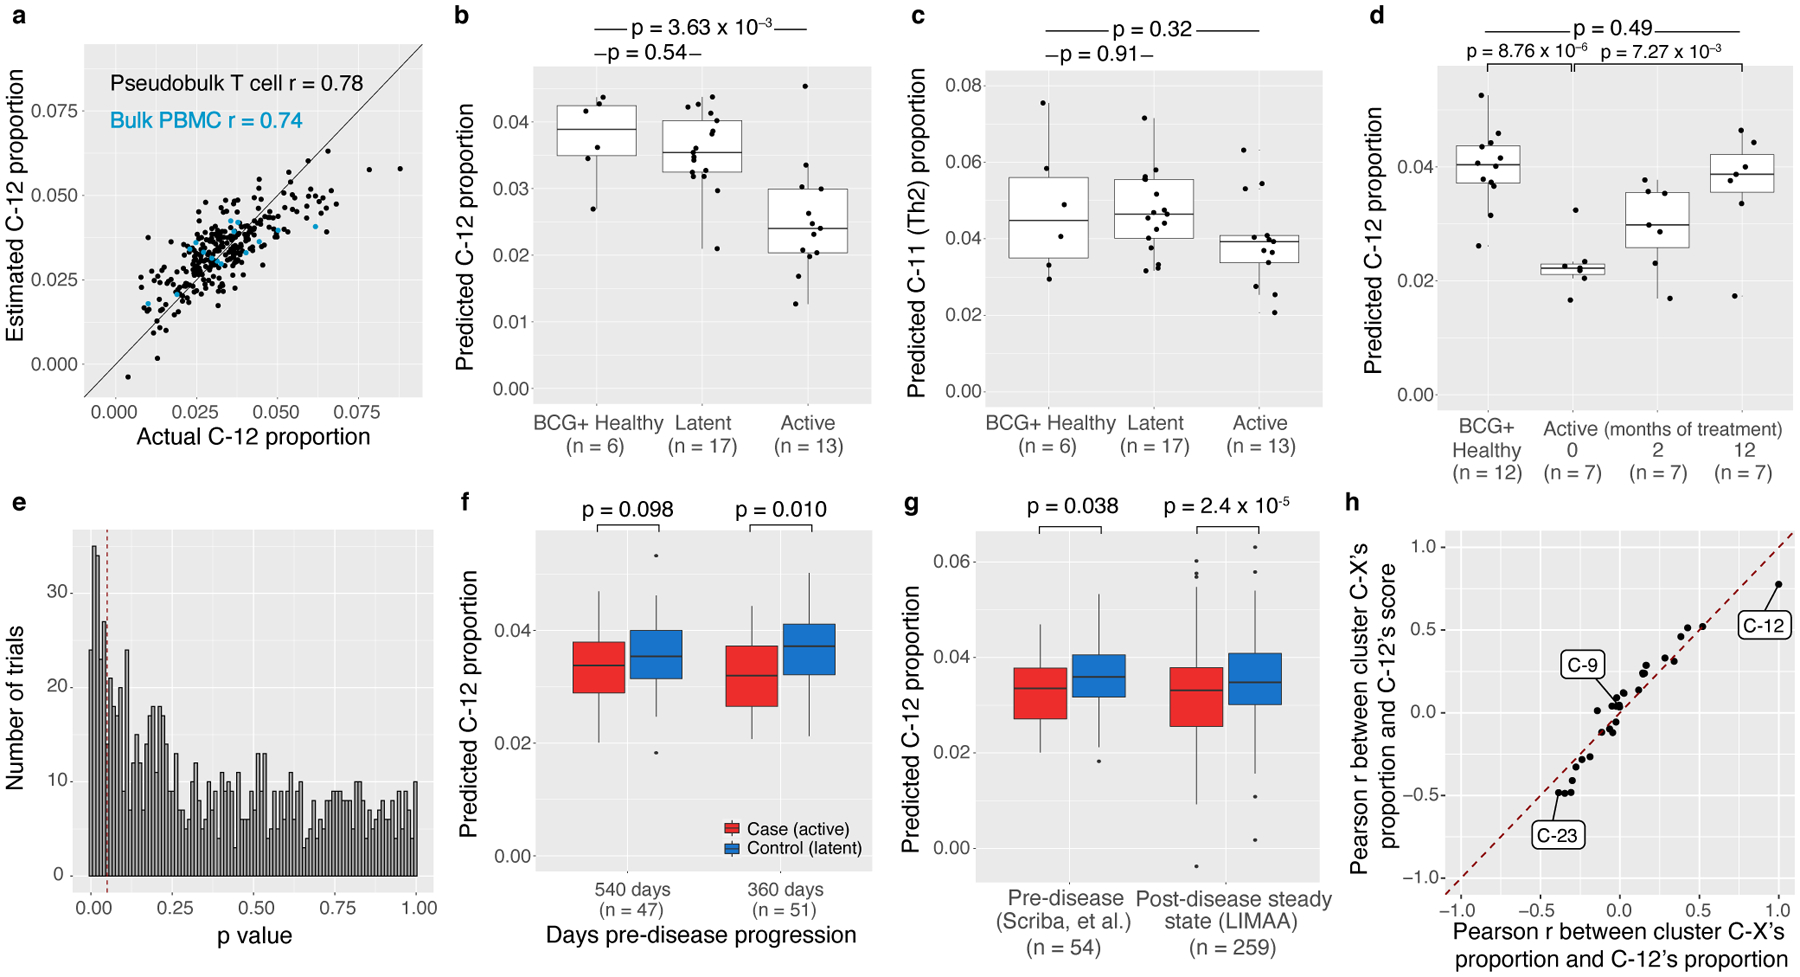
a, Correlation between actual and predicted C-12 proportion, per sample in memory T cell CITE-seq study (n = 271, black) and bulk PBMC RNA-seq (n = 15, blue). Line represents the identity line and we calculated the Pearson correlation coefficients (r) for T cell samples and bulk PBMC samples separately. Predicted (b) C-12 or (c) C-11 (Th2, negative control) proportion in 3 categories of donors from Berry, et al. d, Predicted C-12 proportion in active donors at 3 time points during anti-mycobacterial treatment (0, 2, 12 months) and uninfected controls. In b–d, we calculated p-values with a two-sided t test. e, Histogram of two-sided t test p values from 1,000 trials of downsampling LIMAA cohort to 7 cases and 12 controls (as in Berry, et al.) and comparing the average C-12 proportion in cases vs controls. Dashed line is the significance threshold of p = 0.05 (power = 0.15). f, Predicted C-12 proportion in active cases and latent controls at 2 pre-disease-progression time points in Scriba, et al. g, Predicted C-12 proportion in active cases and latent controls in pre- and post-disease cohorts. Pre-disease data are aggregated across 2 time points. In f and g, p-values are from a one-sided t-test (Satterthwaite’s d.f. method) of the beta estimate for TB progression status in the linear mixed model. h, Concordance of Pearson correlations between each cluster’s proportion and the C-12 score or the C-12 cluster’s proportion. Pearson correlation coefficients were computed for each cluster across 271 memory T cell samples. Each point represents one of the 31 clusters, and the dashed line is the identity line. All boxplots show the median (vertical bar), 25th and 75th percentiles (lower and upper bounds of box, respectively), and 1.5xIQR (or minimum/maximum if they lie within that range; end of whiskers).
Extended Data Fig. 9. Cytokine production in Boston donors.
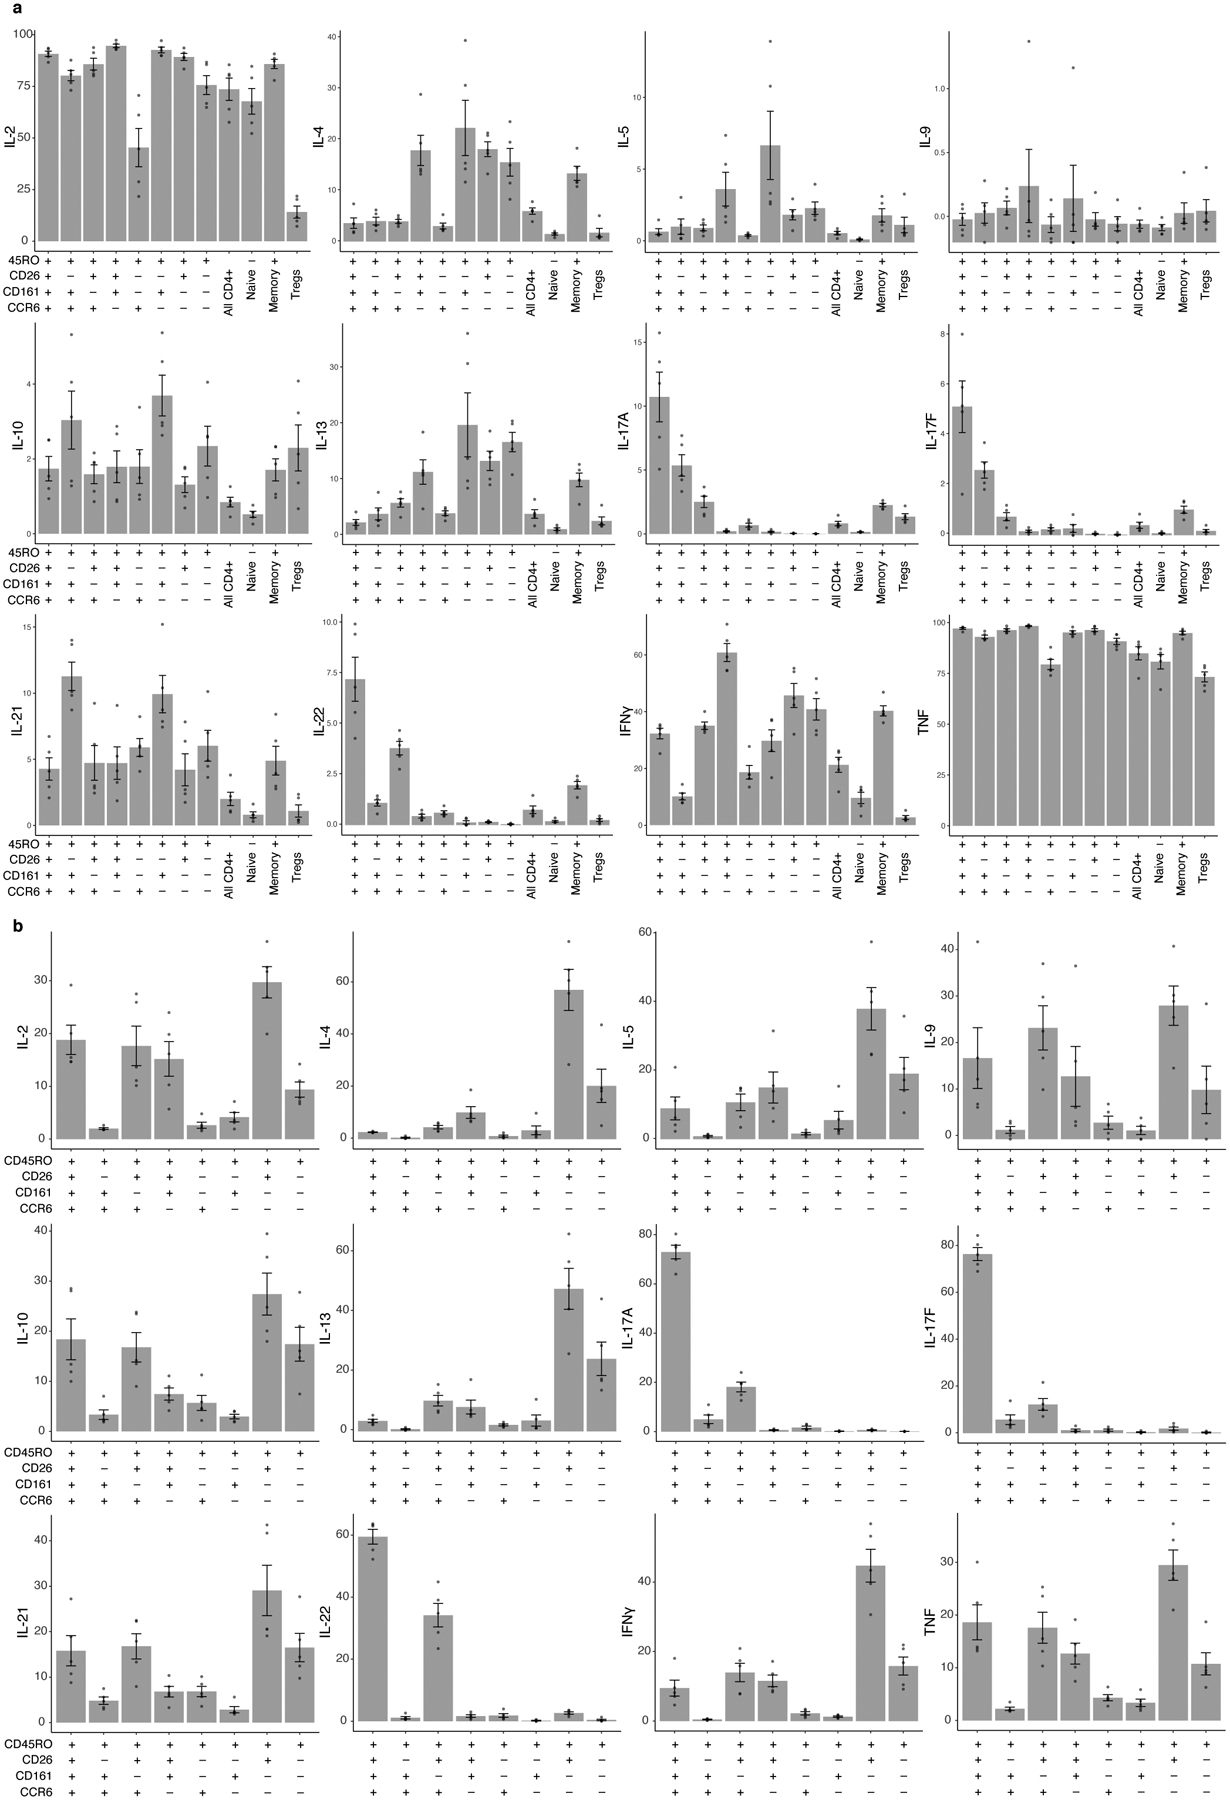
Bars represent the mean and error bars show standard error of the mean across 5 Boston donors unascertained for TB. a, Per-donor percent of cells producing each cytokine in gated populations. b, Per-donor percent of total cytokine-producing memory CD4+ T cells in each gated population.
Extended Data Fig. 10. M.tb antigen-specific response in CD4+CD26+CD161+CCR6+ memory T cells.
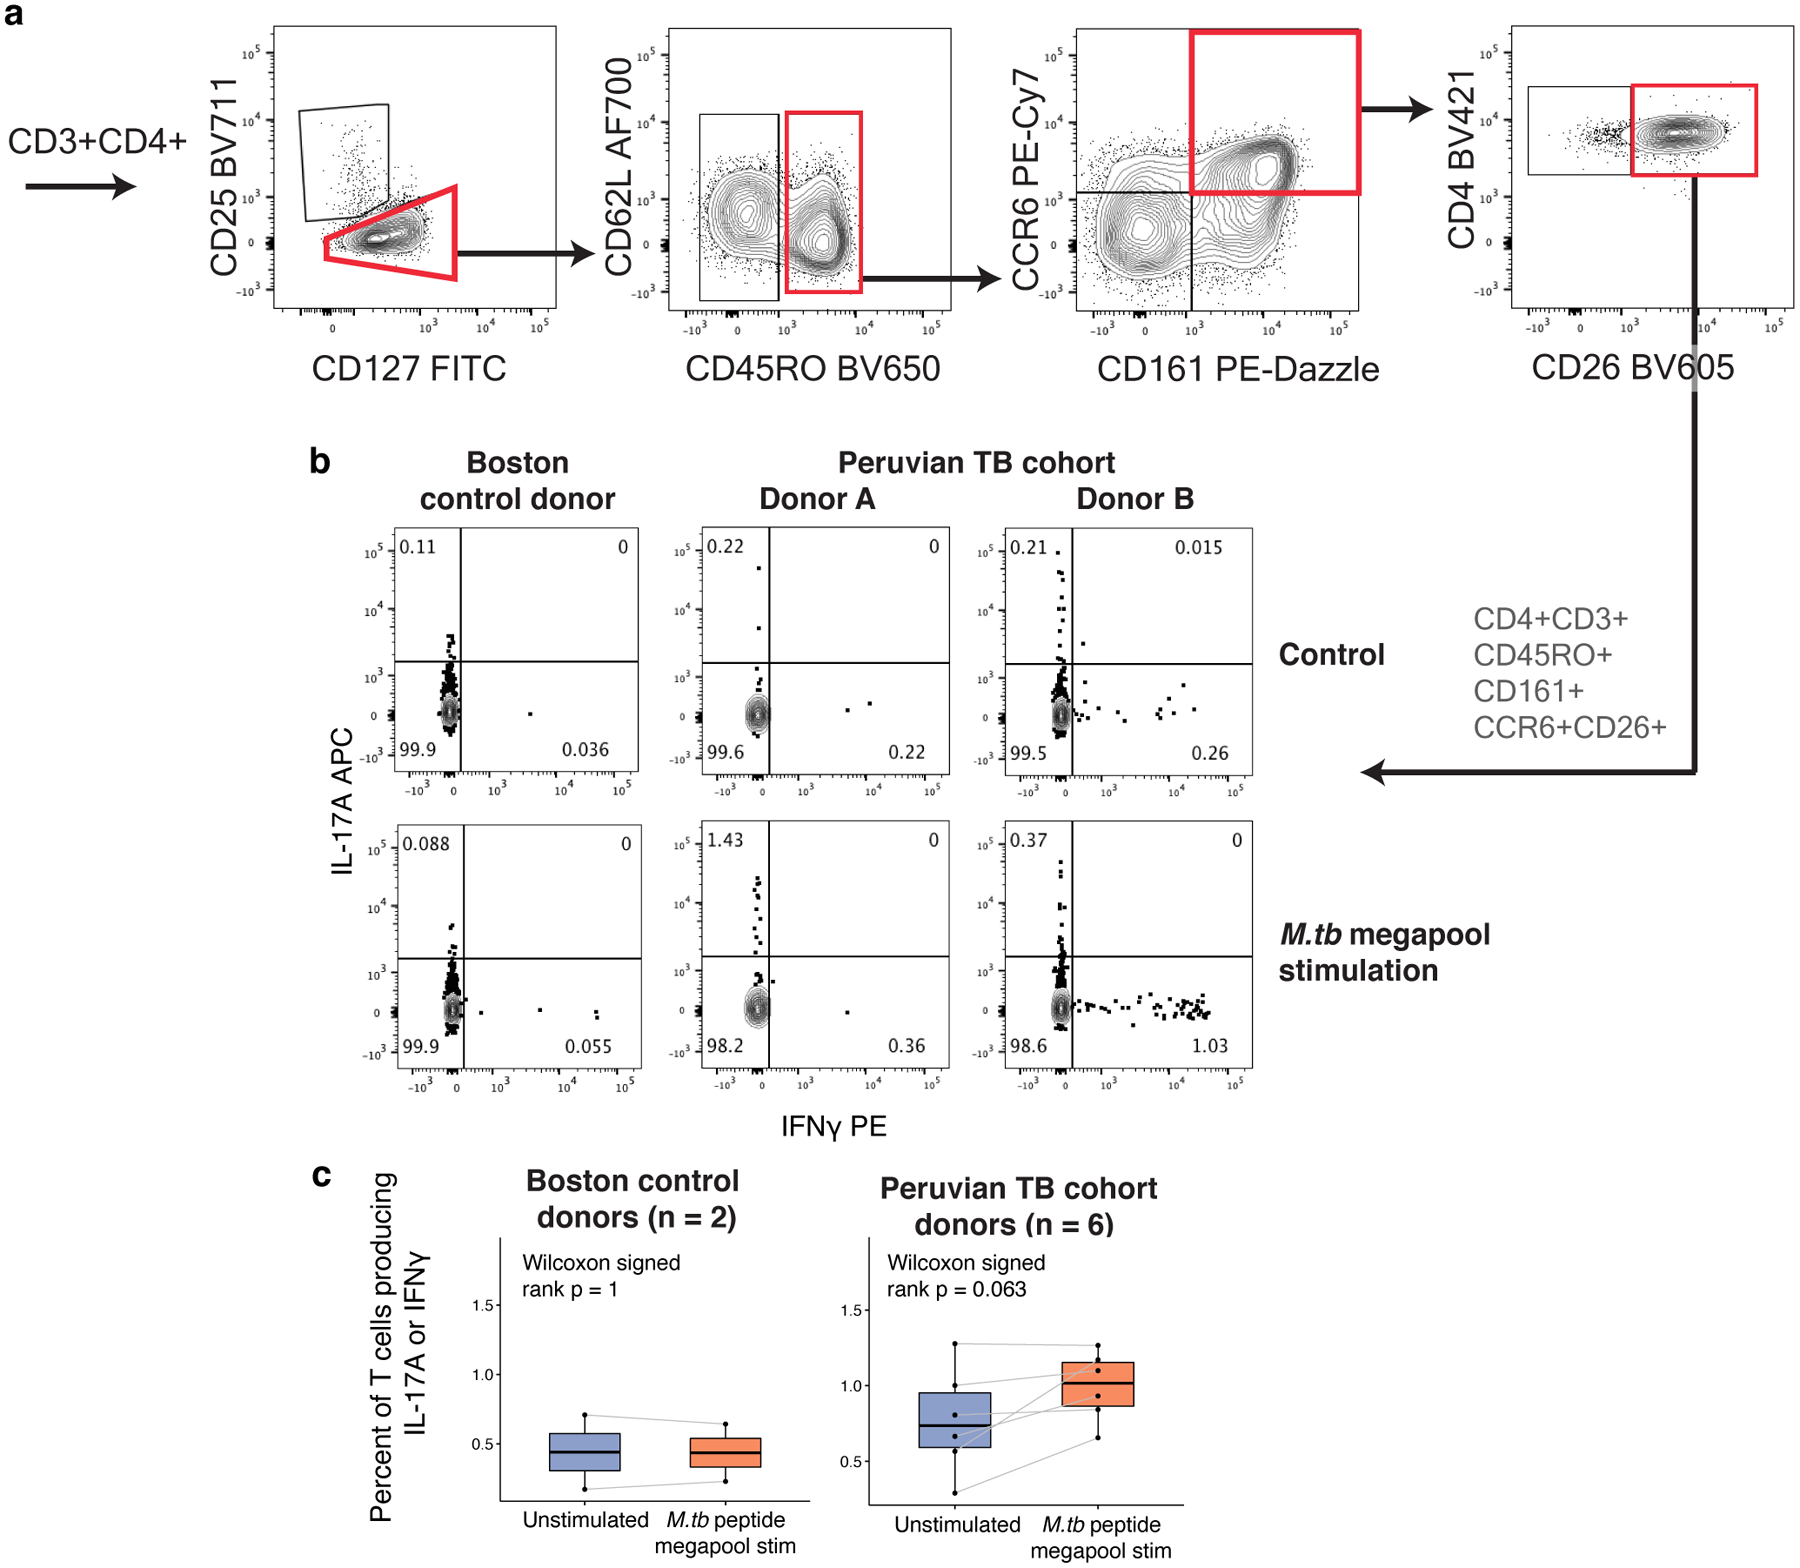
a, Biaxial plots showing representative gating of CD3+CD4+CD45RO+CD161+CCR6+CD26+ cells in a Boston donor. b, Intracellular staining for IL-17A and IFNγ in a Boston control donor and two Peruvian TB cohort donors after either no peptide stimulation (control) or stimulation with the MTB300 megapool. c, IL-17A or IFNγ response to MTB300 stimulation in all CD3+ T cells from either Boston control donors (n = 2) or Peruvian TB cohort donors (n = 6). Each point corresponds to the percent of cells producing IL-17A or IFNγ from one donor, measured with intracellular cytokine staining. Lines connect measurements from the same donor before and after stimulation with MTB300 peptide megapool. Boxplots show the median (vertical bar), 25th and 75th percentiles (lower and upper bounds of box, respectively), and minimum/maximum (end of whiskers). P values are from a two-sided Wilcoxon signed-rank test comparing donors before and after antigen stimulation.
Supplementary Material
Weights for each gene in linear mixed model estimating C-12 proportion, trained on T cell and PBMC data.
Acknowledgements
This work is supported in part by funding from the National Institutes of Health (U19 AI111224 (S.R., M.B.M., D.B.M.), UH2AR067677 (S.R.), T32 HG002295 (A.N.), T32 AR007530 (A.N.), U01 HG009379 (S.R.), U19 AI111211 (J.D.E), R01AI049313 (D.B.M.)).
Footnotes
Competing interests
The authors declare no competing interests.
References
- 1.Nathan A, Baglaenko Y, Fonseka CY, Beynor JI & Raychaudhuri S Multimodal single-cell approaches shed light on T cell heterogeneity. Curr Opin Immunol 61, 17–25, doi: 10.1016/j.coi.2019.07.002 (2019). [DOI] [PMC free article] [PubMed] [Google Scholar]
- 2.Spitzer MH & Nolan GP Mass Cytometry: Single Cells, Many Features. Cell 165, 780–791, doi: 10.1016/j.cell.2016.04.019 (2016). [DOI] [PMC free article] [PubMed] [Google Scholar]
- 3.Peterson VM et al. Multiplexed quantification of proteins and transcripts in single cells. Nat Biotechnol 35, 936–939, doi: 10.1038/nbt.3973 (2017). [DOI] [PubMed] [Google Scholar]
- 4.Stoeckius M et al. Simultaneous epitope and transcriptome measurement in single cells. Nat Methods 14, 865–868, doi: 10.1038/nmeth.4380 (2017). [DOI] [PMC free article] [PubMed] [Google Scholar]
- 5.Carr EJ et al. The Cellular Composition of the Human Immune System Is Shaped by Age and Cohabitation. Nat Immunol 17, 461–468, doi: 10.1038/ni.3371 (2016). [DOI] [PMC free article] [PubMed] [Google Scholar]
- 6.Brodin P et al. Variation in the human immune system is largely driven by non-heritable influences. Cell 160, 37–47, doi: 10.1016/j.cell.2014.12.020 (2015). [DOI] [PMC free article] [PubMed] [Google Scholar]
- 7.Houben RM & Dodd PJ The Global Burden of Latent Tuberculosis Infection: A Re-estimation Using Mathematical Modelling. PLoS Med 13, e1002152, doi: 10.1371/journal.pmed.1002152 (2016). [DOI] [PMC free article] [PubMed] [Google Scholar]
- 8.Organization WH Global tuberculosis report 2020. (2020).
- 9.Verver S et al. Rate of Reinfection Tuberculosis after Successful Treatment Is Higher than Rate of New Tuberculosis. Am J Respir Crit Care Med 171, 1430–1435, doi: 10.1164/rccm.200409-1200OC (2005). [DOI] [PubMed] [Google Scholar]
- 10.Day CL et al. PD-1 Expression on Mycobacterium tuberculosis-Specific CD4 T Cells Is Associated With Bacterial Load in Human Tuberculosis. Front Immunol 9, 1995, doi: 10.3389/fimmu.2018.01995 (2018). [DOI] [PMC free article] [PubMed] [Google Scholar]
- 11.Adekambi T et al. Distinct effector memory CD4+ T cell signatures in latent Mycobacterium tuberculosis infection, BCG vaccination and clinically resolved tuberculosis. PLoS One 7, e36046, doi: 10.1371/journal.pone.0036046 (2012). [DOI] [PMC free article] [PubMed] [Google Scholar]
- 12.Arrigucci R et al. Active Tuberculosis Is Characterized by Highly Differentiated Effector Memory Th1 Cells. Front Immunol 9, 2127, doi: 10.3389/fimmu.2018.02127 (2018). [DOI] [PMC free article] [PubMed] [Google Scholar]
- 13.Lindestam Arlehamn CS et al. Memory T cells in latent Mycobacterium tuberculosis infection are directed against three antigenic islands and largely contained in a CXCR3+CCR6+ Th1 subset. PLoS Pathog 9, e1003130, doi: 10.1371/journal.ppat.1003130 (2013). [DOI] [PMC free article] [PubMed] [Google Scholar]
- 14.Scriba TJ et al. Distinct, specific IL-17- and IL-22-producing CD4+ T cell subsets contribute to the human anti-mycobacterial immune response. J Immunol 180, 1961–1970, doi: 10.4049/jimmunol.180.3.1962 (2008). [DOI] [PMC free article] [PubMed] [Google Scholar]
- 15.Coulter F et al. IL-17 Production from T Helper 17, Mucosal-Associated Invariant T, and gammadelta Cells in Tuberculosis Infection and Disease. Front Immunol 8, 1252, doi: 10.3389/fimmu.2017.01252 (2017). [DOI] [PMC free article] [PubMed] [Google Scholar]
- 16.Burel JG et al. Transcriptomic Analysis of CD4(+) T Cells Reveals Novel Immune Signatures of Latent Tuberculosis. J Immunol 200, 3283–3290, doi: 10.4049/jimmunol.1800118 (2018). [DOI] [PMC free article] [PubMed] [Google Scholar]
- 17.Perreau M et al. Lack of Mycobacterium tuberculosis-specific interleukin-17A-producing CD4+ T cells in active disease. Eur J Immunol 43, 939–948, doi: 10.1002/eji.201243090 (2013). [DOI] [PubMed] [Google Scholar]
- 18.Becerra MC et al. Transmissibility and potential for disease progression of drug resistant Mycobacterium tuberculosis: prospective cohort study. BMJ 367, l5894, doi: 10.1136/bmj.l5894 (2019). [DOI] [PMC free article] [PubMed] [Google Scholar]
- 19.Zumla A, Raviglione M, Hafner C & von Reyn CF Tuberculosis. N Engl J Med 368, 745–755, doi: 10.1056/NEJMra1200894 (2013). [DOI] [PubMed] [Google Scholar]
- 20.Fontenot JD, Gavin MA & Rudensky AY Foxp3 programs the development and function of CD4+CD25+ regulatory T cells. Nat Immunol 4, 330–336 (2003). [DOI] [PubMed] [Google Scholar]
- 21.Liu W et al. CD127 expression inversely correlates with FoxP3 and suppressive function of human CD4+ T reg cells. J Exp Med 203, 1701–1711, doi: 10.1084/jem.20060772 (2006). [DOI] [PMC free article] [PubMed] [Google Scholar]
- 22.Gutierrez-Arcelus M et al. Lymphocyte innateness defined by transcriptional states reflects a balance between proliferation and effector functions. Nat Commun 10, 687, doi: 10.1038/s41467-019-08604-4 (2019). [DOI] [PMC free article] [PubMed] [Google Scholar]
- 23.Korsunsky I et al. Fast, sensitive, and accurate integration of single cell data with Harmony. Nat Methods, doi: 10.1101/461954 (2019). [DOI] [PMC free article] [PubMed] [Google Scholar]
- 24.Savage AK et al. The transcription factor PLZF directs the effector program of the NKT cell lineage Immunity 29, 391–403, doi: 10.1016/j.immuni.2008.07.011 (2008). [DOI] [PMC free article] [PubMed] [Google Scholar]
- 25.Suliman S et al. Peripheral Blood Mucosal-Associated Invariant T Cells in Tuberculosis Patients and Healthy Mycobacterium tuberculosis-Exposed Controls. J Infect Dis 222, 995–1007, doi: 10.1093/infdis/jiaa173 (2020). [DOI] [PMC free article] [PubMed] [Google Scholar]
- 26.Sallusto F, Lenig D, Förster R, Lipp M & Lanzavecchia A Two subsets of memory T lymphocytes with distinct homing potentials and effector functions. Nature 401, 708–712 (1999). [DOI] [PubMed] [Google Scholar]
- 27.Joeckel LT & Bird PI Are all granzymes cytotoxic in vivo? Biol Chem 395, 181–202, doi: 10.1515/hsz-2013-0238 (2014). [DOI] [PubMed] [Google Scholar]
- 28.Maecker HT, McCoy JP & Nussenblatt R Standardizing immunophenotyping for the Human Immunology Project. Nat Rev Immunol 12, 191–200 (2012). [DOI] [PMC free article] [PubMed] [Google Scholar]
- 29.Acosta-Rodriguez EV et al. Surface phenotype and antigenic specificity of human interleukin 17-producing T helper memory cells. Nat Immunol 8, 639–646, doi: 10.1038/ni1467 (2007). [DOI] [PubMed] [Google Scholar]
- 30.Szabo SJ et al. A Novel Transcription Factor, T-bet, Directs Th1 Lineage Commitment. Cell 100, P665–669, doi: 10.1016/S0092-8674(00)80702-3 (2000). [DOI] [PubMed] [Google Scholar]
- 31.Sallusto F, Zielinski CE & Lanzavecchia A Human Th17 subsets. Eur J Immunol 42, 2215–2220, doi: 10.1002/eji.201242741 (2012). [DOI] [PubMed] [Google Scholar]
- 32.Wambre E et al. A phenotypically and functionally distinct human TH2 cell subpopulation is associated with allergic disorders. Sci Transl Med 9, eaam9171, doi: 10.1126/scitranslmed.aam9171 (2017). [DOI] [PMC free article] [PubMed] [Google Scholar]
- 33.Kleinewietfeld M et al. CCR6 expression defines regulatory effector/memory-like cells within the CD25+CD4+ T-cell subset. Blood 105, 2877–2886, doi: 10.1182/blood-2004-07-2505 (2005). [DOI] [PubMed] [Google Scholar]
- 34.Lee J et al. Enrichment of Human CCR6+ Regulatory T Cells with Superior Suppressive Activity in Oral Cancer. J Immunol 199, 467–476, doi: 10.4049/jimmunol.1601815 (2017). [DOI] [PubMed] [Google Scholar]
- 35.Fonseka CY et al. Mixed-effects association of single cells identifies an expanded effector CD4+ T cell subset in rheumatoid arthritis. Sci Transl Med 10 (2018). [DOI] [PMC free article] [PubMed] [Google Scholar]
- 36.Kaczorowski KJ et al. Continuous immunotypes describe human immune variation and predict diverse responses. Proc Natl Acad Sci U S A 114, E6097–6106, doi: 10.1073/pnas.1705065114 (2017). [DOI] [PMC free article] [PubMed] [Google Scholar]
- 37.Hashimoto K et al. Single-cell transcriptomics reveals expansion of cytotoxic CD4 T cells in supercentenarians. Proc Natl Acad Sci U S A 116, 24242–24251, doi: 10.1073/pnas.1907883116 (2019). [DOI] [PMC free article] [PubMed] [Google Scholar]
- 38.Amadori A et al. Genetic control of the CD4/CD8 T-cell ratio in humans. Nat Med 1, 1279–1283 (1995). [DOI] [PubMed] [Google Scholar]
- 39.Kissick HT et al. Androgens alter T-cell immunity by inhibiting T-helper 1 differentiation. Proc Natl Acad Sci U S A 111, 9887–9892, doi: 10.1073/pnas.1402468111 (2014). [DOI] [PMC free article] [PubMed] [Google Scholar]
- 40.Ter Horst R et al. Host and Environmental Factors Influencing Individual Human Cytokine Responses. Cell 167, 1111–1124 e1113, doi: 10.1016/j.cell.2016.10.018 (2016). [DOI] [PMC free article] [PubMed] [Google Scholar]
- 41.Nedelec Y et al. Genetic Ancestry and Natural Selection Drive Population Differences in Immune Responses to Pathogens. Cell 167, 657–669 e621, doi: 10.1016/j.cell.2016.09.025 (2016). [DOI] [PubMed] [Google Scholar]
- 42.Berry MP et al. An interferon-inducible neutrophil-driven blood transcriptional signature in human tuberculosis. Nature 466, 973–977, doi: 10.1038/nature09247 (2010). [DOI] [PMC free article] [PubMed] [Google Scholar]
- 43.Scriba TJ et al. Sequential inflammatory processes define human progression from M. tuberculosis infection to tuberculosis disease. PLoS Pathog 13, e1006687, doi: 10.1371/journal.ppat.1006687 (2017). [DOI] [PMC free article] [PubMed] [Google Scholar]
- 44.Fritsch RD et al. Stepwise Differentiation of CD4 Memory T Cells Defined by Expression of CCR7 and CD27. J Immunol 175, 6489–6497, doi: 10.4049/jimmunol.175.10.6489 (2005). [DOI] [PubMed] [Google Scholar]
- 45.Coquet JM et al. The CD27 and CD70 costimulatory pathway inhibits effector function of T helper 17 cells and attenuates associated autoimmunity. Immunity 38, 53–65, doi: 10.1016/j.immuni.2012.09.009 (2013). [DOI] [PubMed] [Google Scholar]
- 46.MA State Public Health L aboratory Tuberculosis Report. (Massachusetts Department of Public Health, 2020). [Google Scholar]
- 47.Arlehamn CS, McKinney DM & Carpenter C A Quantitative Analysis of Complexity of Human Pathogen-Specific CD4 T Cell Responses in Healthy M. tuberculosis Infected South Africans. PLOS Pathog 12, e1005760, doi: 10.1371/journal.ppat.1005760 (2016). [DOI] [PMC free article] [PubMed] [Google Scholar]
- 48.Christophersen A et al. Distinct phenotype of CD4(+) T cells driving celiac disease identified in multiple autoimmune conditions. Nat Med, doi: 10.1038/s41591-019-0403-9 (2019). [DOI] [PMC free article] [PubMed] [Google Scholar]
- 49.Zhang F et al. Defining Inflammatory Cell States in Rheumatoid Arthritis Joint Synovial Tissues by Integrating Single-cell Transcriptomics and Mass Cytometry. Nat Immunol 20, 928–942, doi: 10.1101/351130 (2019). [DOI] [PMC free article] [PubMed] [Google Scholar]
- 50.Smillie CS et al. Intra- and Inter-cellular Rewiring of the Human Colon during Ulcerative Colitis. Cell 178, 714–730 e722, doi: 10.1016/j.cell.2019.06.029 (2019). [DOI] [PMC free article] [PubMed] [Google Scholar]
- 51.Boisson-Dupuis S et al. Inherited and acquired immunodeficiencies underlying tuberculosis in childhood. Immunol Rev 264, 103–120 (2015). [DOI] [PMC free article] [PubMed] [Google Scholar]
- 52.Pai M et al. Tuberculosis. Nat Rev Dis Primers 2, 16076, doi: 10.1038/nrdp.2016.76 (2016). [DOI] [PubMed] [Google Scholar]
- 53.Bustamante J, Boisson-Dupuis S, Abel L & Casanova JL Mendelian susceptibility to mycobacterial disease: genetic, immunological, and clinical features of inborn errors of IFN-γ immunity. Semin Immunol 26, 454–470, doi: 10.1016/j.smim.2014.09.008 (2014). [DOI] [PMC free article] [PubMed] [Google Scholar]
- 54.Okada S et al. Impairment of immunity to Candida and Mycobacterium in humans with bi-allelic RORC mutations. Science 349, 606–613, doi: 10.1126/science.aaa4282 (2015). [DOI] [PMC free article] [PubMed] [Google Scholar]
- 55.Luo Y et al. Early progression to active tuberculosis is a highly heritable trait driven by 3q23 in Peruvians. Nat Commun 10, 3765, doi: 10.1038/s41467-019-11664-1 (2019). [DOI] [PMC free article] [PubMed] [Google Scholar]
- 56.Cosmi L et al. Human interleukin 17–producing cells originate from a CD161+CD4+ T cell precursor. J Exp Med 205, 1903–1916, doi: 10.1084/jem.20080397 (2008). [DOI] [PMC free article] [PubMed] [Google Scholar]
- 57.Bengsch B et al. Human Th17 Cells Express High Levels of Enzymatically Active Dipeptidylpeptidase IV (CD26). J Immunol 188, 5438–5447, doi: 10.4049/jimmunol.1103801 (2012). [DOI] [PubMed] [Google Scholar]
- 58.Morimoto C & Schlossman SF The structure and function of CD26 in the T-cell immune response. Immunol Rev 161, 55–70 (1998). [DOI] [PubMed] [Google Scholar]
- 59.Fergusson JR et al. CD161 defines a transcriptional and functional phenotype across distinct human T cell lineages. Cell Rep 9, 1075–1088, doi: 10.1016/j.celrep.2014.09.045 (2014). [DOI] [PMC free article] [PubMed] [Google Scholar]
- 60.Yamazaki T et al. CCR6 regulates the migration of inflammatory and regulatory T cells. J Immunol 181, 8391–8401 (2008). [DOI] [PMC free article] [PubMed] [Google Scholar]
- 61.Scriba TJ et al. Differential Recognition of Mycobacterium tuberculosis-Specific Epitopes as a Function of Tuberculosis Disease History. Am J Respir Crit Care Med 196, 772–781, doi: 10.1164/rccm.201706-1208OC (2017). [DOI] [PMC free article] [PubMed] [Google Scholar]
- 62.Chowdhury R et al. A multi-cohort study of the immune factors associated with M. tuberculosis infection outcomes. Nature 560, 644–648, doi: 10.1038/s41586-018-0439-x (2018). [DOI] [PMC free article] [PubMed] [Google Scholar]
- 63.Wang M et al. Genetic polymorphisms of IL-17A, IL-17F, TLR4 and miR-146a in association with the risk of pulmonary tuberculosis. Sci Rep 6, 28586, doi: 10.1038/srep28586 (2016). [DOI] [PMC free article] [PubMed] [Google Scholar]
- 64.Khader SA et al. IL-23 and IL-17 in the establishment of protective pulmonary CD4+ T cell responses after vaccination and during Mycobacterium tuberculosis challenge. Nat Immunol 8, 369–377 (2007). [DOI] [PubMed] [Google Scholar]
- 65.Arlehamn CL et al. Transcriptional profile of tuberculosis antigen-specific T cells reveals novel multifunctional features. J Immunol 193, 2931–2940, doi: 10.4049/jimmunol.1401151 (2014). [DOI] [PMC free article] [PubMed] [Google Scholar]
- 66.Shanmugasundaram U et al. Control of Mycobacterium tuberculosis Infection in Lungs is Associated with Recruitment of Antigen-Specific Th1 and Th17 cells Co-expressing CXCR3 and CCR6. bioRxiv, doi: 10.1101/2020.03.09.981019 (2020). [DOI] [PMC free article] [PubMed] [Google Scholar]
- 67.Darrah PA et al. Prevention of tuberculosis in macaques after intravenous BCG immunization. Nature 577, 95–102, doi: 10.1038/s41586-019-1817-8 (2020). [DOI] [PMC free article] [PubMed] [Google Scholar]
- 68.Lindenstrom T et al. Vaccine-induced th17 cells are maintained long-term postvaccination as a distinct and phenotypically stable memory subset. Infect Immun 80, 3533–3544, doi: 10.1128/IAI.00550-12 (2012). [DOI] [PMC free article] [PubMed] [Google Scholar]
- 69.Fares A Seasonality of tuberculosis. J Glob Infect Dis 3, 46–55, doi: 10.4103/0974-777X.77296 (2011). [DOI] [PMC free article] [PubMed] [Google Scholar]
- 70.Moody DB et al. CD1b-mediated T cell recognition of a glycolipid antigen generated from mycobacterial lipid and host carbohydrate during infection. J Exp Med 192, 965–976 (2000). [DOI] [PMC free article] [PubMed] [Google Scholar]
- 71.Thornton T et al. Estimating Kinship in Admixed Populations. Am J Hum Genet 91, 122–138, doi: 10.1016/j.ajhg.2012.05.024 (2012). [DOI] [PMC free article] [PubMed] [Google Scholar]
- 72.Consortium TGP A global reference for human genetic variation. Nature 526, 68–74, doi: 10.1038/nature15393 (2015). [DOI] [PMC free article] [PubMed] [Google Scholar]
- 73.Reich D et al. Reconstructing Native American population history. Nature 488, 370–374, doi: 10.1038/nature11258 (2012). [DOI] [PMC free article] [PubMed] [Google Scholar]
- 74.Purcell S et al. PLINK: A Tool Set for Whole-Genome Association and Population-Based Linkage Analyses. Am J Hum Genet 81, 559–575, doi: 10.1086/519795 (2007). [DOI] [PMC free article] [PubMed] [Google Scholar]
- 75.Alexander DH, Novembre J & Lange K Fast model-based estimation of ancestry in unrelated individuals. Genome Res 19, 1655–1664, doi: 10.1101/gr.094052 (2009). [DOI] [PMC free article] [PubMed] [Google Scholar]
- 76.O’Connell J et al. A general approach for haplotype phasing across the full spectrum of relatedness. PLoS Genet 10, e1004234, doi: 10.1371/journal.pgen.1004234 (2014). [DOI] [PMC free article] [PubMed] [Google Scholar]
- 77.Howie BN, Donnelly P & Marchini J A Flexible and Accurate Genotype Imputation Method for the Next Generation of Genome-Wide Association Studies. PLoS Genet 5, e1000529, doi: 10.1371/journal.pgen.1000529 (2009). [DOI] [PMC free article] [PubMed] [Google Scholar]
- 78.Kang HM et al. Multiplexed droplet single-cell RNA-sequencing using natural genetic variation. Nat Biotechnol 36, 89–94, doi: 10.1038/nbt.4042 (2018). [DOI] [PMC free article] [PubMed] [Google Scholar]
- 79.Li H A statistical framework for SNP calling, mutation discovery, association mapping and population genetical parameter estimation from sequencing data. Bioinformatics 27, 2987–2993, doi: 10.1093/bioinformatics/btr509 (2011). [DOI] [PMC free article] [PubMed] [Google Scholar]
- 80.McInnes L & Healy J UMAP: Uniform Manifold Approximation and Projection for Dimension Reduction. arXiv, 1802.03426 (2018). [Google Scholar]
- 81.Gonzalez I, Déjean S, Martin PGP & Baccini A CCA: An R Package to Extend Canonical Correlation Analysis. J of Stat Soft 23 (2007). [Google Scholar]
- 82.Dobin A, Davis CA & Schlesinger F STAR: ultrafast universal RNA-seq aligner. Bioinformatics 29, 15–21, doi: 10.1093/bioinformatics/bts635 (2013). [DOI] [PMC free article] [PubMed] [Google Scholar]
- 83.Li B & Dewey CN RSEM: accurate transcript quantification from RNA-Seq data with or without a reference genome. BMC Bioinformatics 12, 323, doi: 10.1186/1471-2105-12-323 (2011). [DOI] [PMC free article] [PubMed] [Google Scholar]
- 84.Friedman JH, Hastie T & Tibshirani R Regularization Paths for Generalized Linear Models via Coordinate Descent. J Stat Softw 33, 1–22, doi: 10.18637/jss.v033.i01 (2010). [DOI] [PMC free article] [PubMed] [Google Scholar]
- 85.Kuznetsova A, Brockhoff PB & Christensen RHB lmerTest Package: Tests in Linear Mixed Effects Models. J Stat Softw 82, 1–36, doi: 10.18637/jss.v082.i13 (2017). [DOI] [Google Scholar]
Associated Data
This section collects any data citations, data availability statements, or supplementary materials included in this article.
Supplementary Materials
Weights for each gene in linear mixed model estimating C-12 proportion, trained on T cell and PBMC data.
Data Availability Statement
Single-cell sequencing data are available on dbGaP; count matrices and meta data are on GEO (GSE158769). Single cell expression and cluster abundance data can also be explored in an interactive browser at https://immunogenomics.io/tbru/. Genotype data is available on dbGaP (accession: phs002025.v1.p1).