Abstract
Photodynamic therapy (PDT), as an emerging treatment modality, which takes advantage of reactive oxygen species (ROS) generated upon light illumination to ablate tumours, has suffered from a limited treatment depth, strong oxygen dependence and short ROS lifespan. Herein, we developed a highly efficient NIR-I light (808 nm laser) initiated theranostic system based on a fluorescent photosensitizer (EBD-1) with cancer cell membrane targeting ability, which can realize large penetration depth in tissue, generate superoxide radicals (O2−˙) to relieve the oxygen-dependence, confine the ROS oxidation at the cell membrane, and self-report the cell viability during the PDT process. In vivo experiments demonstrated that EBD-1 under 808 nm light successfully accomplished remarkable cancer ablation. This work will be beneficial for the design of novel photosensitizers for PDT-based theranostic systems.
A NIR-I light initiated theranostic system based on photosensitizer EBD-1 with cancer cell membrane targeting ability, which can self-report cell viability.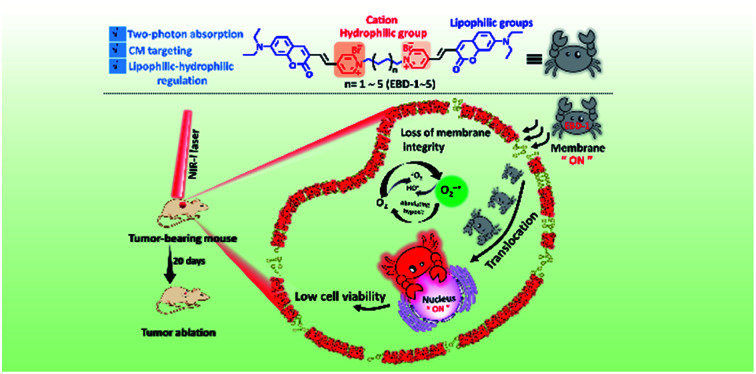
Introduction
Photodynamic therapy (PDT) takes advantage of photosensitizers (PSs), which are activated by light illumination to generate highly toxic reactive oxygen species (ROS)1–3via two different mechanisms4–7 (type-I and type-II) to oxidize cellular components (such as, unsaturated lipids, amino acid residues and nucleic acids) and kill cancer cells.8–11 Insights into the ROS generation mechanism have revealed that the type-II pathway (3O2 transformed into 1O2) is highly dependent on the oxygen concentration. However, tumour microenvironments feature hypoxia as a result of the aggressive proliferation of cancer cells and the tumour vasculature, which would greatly hinder the efficiency of PDT.12–15 As for the type-I pathway (charge transfer between PSs and adjacent various substrate molecules, which is not limited to oxygen), it not only can mitigate the hypoxia limitation but also can produce more cytotoxic ROS (O2−˙, OH˙, H2O2), which holds great promise in effective ablation of tumours.16–19
Recently developed PSs that can undergo the type-I pathway have received increasing attention and are mostly limited to metal-based inorganic nanomaterials,20–22 ranging from metal oxides and noble metal to metal–organic frameworks.23,24 Nevertheless, the inferior biodegradability and the potential risk of immune toxicities impede their clinical translation.25,26 By contrast, organic molecules with merits of optimal biosafety and biocompatibility have only been reported in a few cases for the following type-I pathway.27,28 For instance, the Peng group accomplished an O2−˙ photo-generator by constructing a FRET system.29 Notably, organic molecules activated by light can also undergo the fluorescence process, which can be used to guide the PDT. The NIR-I bio-window (750–1000 nm) with higher tissue penetration, lower auto-fluorescence, minimum photo-damage to living organisms, and a lower and higher signal-to-noise ratio and detection sensitivity is in great demand for biological applications.30–33 In this regard, NIR-I responsive fluorescent PSs which can follow the type-I mechanism are advantageous for efficient PDT.
As is widely reported, ROS with a very short lifespan can only diffuse to a limited distance (<20 nm) in biological systems, and would decay and degrade fast before reaching the site of action.34–36 Hence, to ensure the therapeutic effect, it's of paramount importance to control the ROS oxidation reaction to take place within the target sites to cause fatal oxidative damage.37,38 For the cellular uptake, the very first step is always to interact with the plasma membrane, which is a lipid bilayer decorated with proteins and holds the integrity of cells.39–41 Clearly, PSs with a suitable hydrophilicity–lipophilicity balance that can be retained on the surface of cancer cells would in situ generate ROS to oxidize cholesterol and other unsaturated phospholipids,42–45 which results in the changes of membrane permeability and the losses of membrane fluidity and integrity and finally induces cell death46–48 (for instance, apoptosis and necrosis). Therefore, it's reasonable to envision that NIR-I light-responsive fluorescent PSs with cancer cell membrane targeting ability, which can undergo the type-I pathway, would provide more effective imaging-guided PDT. Unfortunately, such ideal agents have rarely been reported.27–29,49
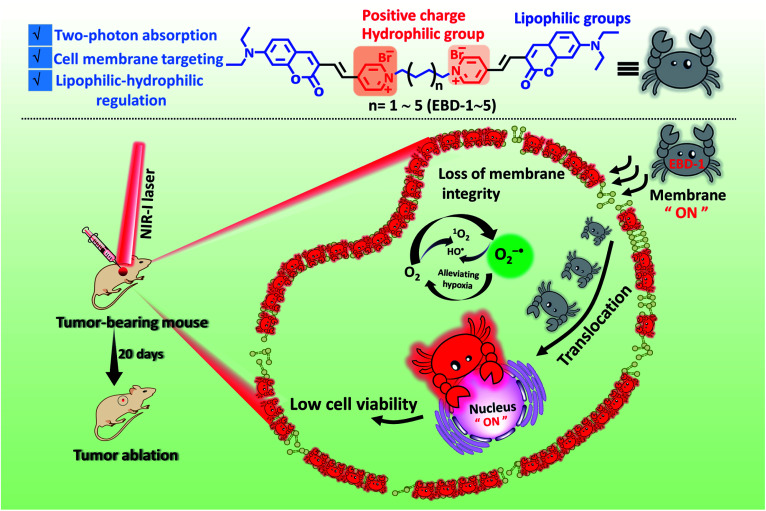
Herein, we developed a series of novel NIR-I light-responsive O2−˙ generators (EBD-1–EBD-5) with plasma membrane targeting ability, which were built based on coumarin and double pyridine groups connected by alkyl chains (as shown in Scheme 1). EBD-1–EBD-5 all exhibited two-photon absorption and generated abundant ROS under NIR-I illumination, and delivered red fluorescence upon interaction with the plasma membrane and DNA in mitochondria and the nucleus. With the alkyl chains elongating, the ROS generation capability and hydrophilicity of the five molecules gradually decreased. For EBD-1 with the most robust ROS generation stimulus, the red fluorescence of the probe witnessed immigration from the plasma membrane into the nucleus due to the cell death induced by in situ generated ROS, which can self-report and evaluate the therapeutic efficacy (Scheme 1). Furthermore, the positively charged PSs can differentiate cancer cells from normal cells. In vivo models demonstrated that EBD-1 under 808 nm light successfully accomplished remarkable cancer ablation, showing great advances for imaging-guided PDT.
Scheme 1. Schematic illustration of the highly efficient NIR-I light initiated theranostic system based on fluorescent photosensitizer EBD-1 with cancer cell membrane targeting ability, which can self-report the cell viability.
Results & discussion
Molecular design and basic photophysical properties
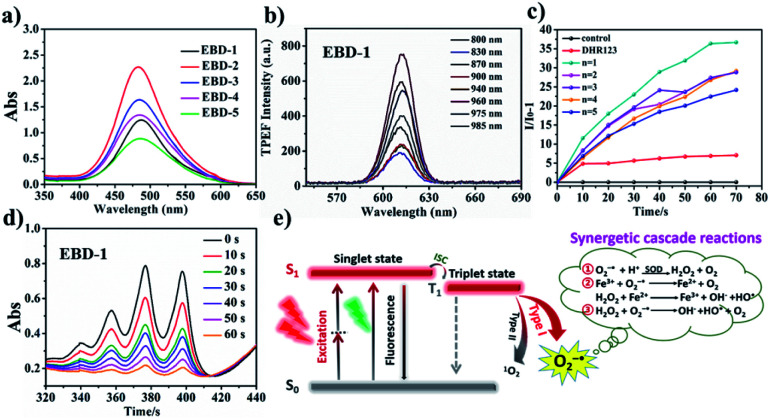
PSs (EBD-1–EBD-5) with double pyridine salts were designed and synthesized tactfully through varying the alkyl chain length (Scheme S1†) via a Knoevenagel condensation reaction between coumarin aldehyde and active methylene, for specific cancer cell targeting and were systematically characterized by 1H NMR, 13C NMR and HRMS (Fig. S1–S30†). As shown in the absorption spectra in an aqueous solution in Fig. 1a, EBD-1–EBD-5 show a maximum absorption peak at about 480 nm due to the coplanar coumarin framework with strong conjugation effects. In addition, as shown in Fig. 1b and S31a–k,† all five PSs possess favorable two-photon optical properties, could be excited using a NIR-I laser and exhibit a bright red emission (Fig. S32†). As presented in Table S1,† the large extinction coefficient (ε × 104) and small ΔEST values were favorable for ROS generation, and a large stoke-shift (140 nm) as exhibited in Fig. S33a–e and S34† indicated their great potential for imaging-guided PDT50–53
Fig. 1. (a) The absorption spectra of EBD-1−EBD-5 in an aqueous solution. (b) Two-photon excited fluorescence spectra of EBD-1 in 99% glycerin systems with femtosecond laser pulses at 500 mV with various excitation wavelengths. (c) Fluorescence spectra for O2−˙ using DHR123 as an indicator under white light irradiation (20 mW cm−2), where I0 and I represent the fluorescence intensity with the presence of DHR123. (d) The decomposition rates of ABDA in the presence of EBD-1 at different irradiation times (0–60 s). (e) Schematic illustration of photo-induced type-I and type-II PDT enabled using PSs.
In vitro ROS generation
To investigate the specific ROS generation of the as-obtained PSs EBD-1–EBD-5, in vitro ROS detection tests were carried out. Firstly, the O2−˙ generating capacity was probed by using commercial O2−˙ indicator DHR123, which is non-fluorescent but emits strong green fluorescence at 528 nm while reacting with O2−˙. As exhibited in Fig. 1c, EBD-1–EBD-5 all increased the fluorescence intensity of the indicator after light irradiation, suggesting their O2−˙ generation capability. Interestingly, among the 5 PSs with different alkyl chain lengths, EBD-1 with the shortest chain length and EBD-5 with the longest chain length exhibited the highest and lowest O2−˙ generation capability, respectively, which could be attributed to the improved fluorescence quantum yield in PSs with longer chains and more drastic intramolecular vibration. Moreover, the generation of superoxide anion radicals was further confirmed by the free radical scavenging assay (Fig. S35a–f†). As is widely reported, O2−˙ would subsequently trigger a series of synergetic cascade reactions (Fig. 1e), yielding more toxic ROS. Also, as shown in Fig. 1d and S36,† a commercial 1O2 indicator, ABDA, was exploited to evaluate the 1O2 production capability, and it demonstrated that EBD-1 simultaneously possessed the ability to produce 1O2. The as-obtained PSs can follow both type-I and type-II pathways, which can relieve the oxygen dependence to some extent. Furthermore, the stability of the as-obtained PSs in different physiological media, such as water, PBS, and Dulbecco's Modified Eagle's Medium (DMEM) and under irradiation was evaluated as displayed in Fig. S37a–c.† In view of the obvious representativeness, EBD-1 and EBD-5 were selected for following study.
NIR-I light triggered type-I ROS generation
Considering the two-photon absorption properties and the robust ROS generation capability, EBD-1 was selected for further investigation of type-I ROS generation under NIR-I light. As shown in Fig. 2a, the electron paramagnetic resonance (EPR) spectra of EBD-1 with 5,5-dimethyl-1-pyrroline N-oxide (DMPO) as a spin-trap agent were obtained. For pure DMPO solution with 808 nm laser irradiation (red line) or DMPO + EBD-1 in the dark (black line), there were no EPR signals; while for DMPO + EBD-1 with a 808 nm laser for 60 s, a characteristic paramagnetic adduct was observed, which was in good accordance with the O2−˙ signal.22,49 Moreover, the generation of O2−˙ in HeLa cells cultured with EBD-1 under 808 nm laser irradiation was confirmed using O2−˙ specific fluorescent probe dihydroethidium (DHE) as displayed in Fig. 2b and S38.† In addition, the more toxic OH˙ was detected by the hydroxyphenyl fluorescein (HPF) assay as shown in Fig. 2c and S39,† which indicated that O2−˙-mediated cascade reactions took place in HeLa cells incubated with EBD-1 under 808 nm irradiation, showing great promise for realizing enhanced PDT.
Fig. 2. (a) The EPR signals of DMPO for O2−˙ characterization in the presence of 10 μM EBD-1 in CH3OH at room temperature (808 nm laser; 200 mW cm−2 for 60 s). (b) O2−˙ detection in HeLa cells incubated with EBD-1 using DHE (10 μM, λex = 488 nm, λem = 570–620 nm) under irradiation (808 nm laser; 200 mW cm−2). (c) OH˙ detection in HeLa cells incubated with EBD-1 using HPF (λex = 488 nm, λem = 530 nm) under irradiation (808 nm laser; 200 mW cm−2) and the 3D imaging of OH˙ in HeLa cells by using HPF as an indicator after 10 min of laser irradiation (obtained using ImageJ). Scale bar = 20 μm.
Cell membrane targeting and specific targeting mechanisms
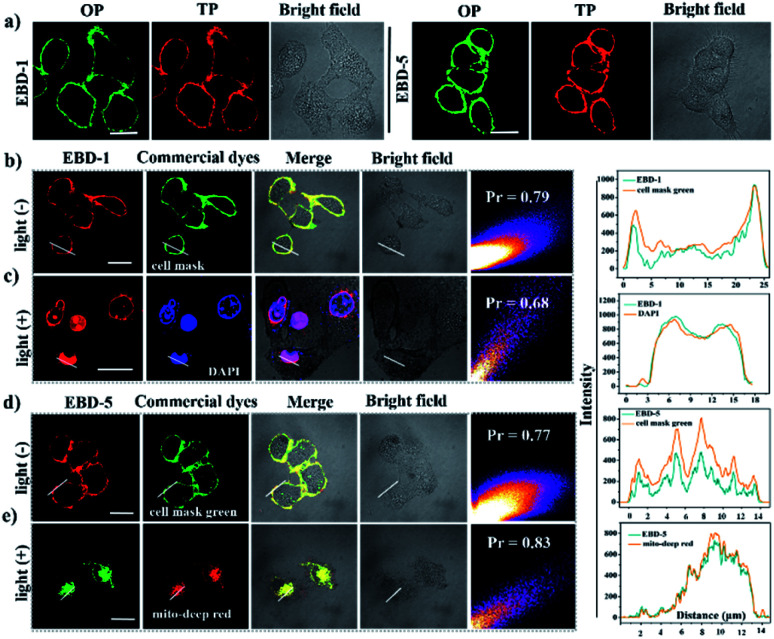
To study their potential in imaging-guided PDT, a cellular imaging experiment was performed. As shown in Fig. 3a, without irradiation, the high-quality OP and TP fluorescence imaging of EBD-1 (10 μM) and EBD-5 (10 μM) studied by CLSM revealed their superior plasma membrane-anchoring in HeLa cells, which was attributed to the positive charges and a good balance of hydrophilicity and hydrophobicity in the EBD-1 and EBD-5 structures.54–56 For further exploring the spatial distribution of fluorescence imaging in HeLa cells, a series of co-localization assays of EBD-1 and EBD-5 with commercial dyes were carried out with and without the irradiation, respectively. As displayed in Fig. 3b and d, without irradiation, commercial CellMask Green Plasma Membrane Stain and PSs were co-incubated with HeLa cells for 20 min and then were co-localized by CLSM, which displayed high overlap between commercial dyes and PSs with a high Pearson correlation factor value. The red fluorescence of PSs on the cell membrane was ascribed to restricted intra-molecular rotation (RIR) hindering non-radiative decay, which was further supported by viscosity tests in water and glycerin systems of different ratios (0–99%)57,58 (Fig. S40a and S41a†). Under continuous irradiation for 20 min, due to ROS-induced permeability change and loss of integrity of the membrane, PSs gradually escaped from the plasma membrane and entered the intracellular environment. To further track the PS movement, as shown in Fig. 3c and e, co-localization experiments of PSs with the aid of commercial dyes DAPI and MitoTracker Deep Red were conducted. Clearly, after continuous irradiation, EBD-1 was finally localized in the cell nucleus which implied the execution of apoptosis and necrosis induced by EBD-1 (see details in the ESI Fig. S42†), which can also be verified by the bulged nucleus and the collapsed cell membrane in the bright field image of HeLa cells incubated with EBD-1. However, EBD-5 was still localized in mitochondria even when the cell was in apoptotic and necrotic states, which was confirmed by the collapsed cytoskeleton in the bright field image of HeLa cells incubated with EBD-5. According to the above experiments, under illumination, EBD-1 with cell membrane targeting ability showed great advances in self-reporting the cell viability and imaging-guided PDT.
Fig. 3. (a) One-photon excitation (OPE) and two-photon excitation (TPE) imaging of HeLa cells pretreated with EBD-1 and EBD-5. (b) EBD-1 pre-treated HeLa cells co-localized with CellMask Green without irradiation. Red channel for EBD-1 (λex = 488 nm, λem = 630 nm) and the green channel for CellMask Green (λex = 522 nm, λem = 535 nm). (c) The co-staining experiment between EBD-1 and DAPI with irradiation for 20 min: red channel for EBD-1 and the blue channel for DAPI (λex = 405 nm, λem = 420–450 nm). (d) EBD-5 pretreated HeLa cells co-localized with CellMask Green without irradiation. Red channel for EBD-5 (λex = 488 nm, λem = 630 nm) and the green channel for CellMask Green. (e) The co-staining experiment between EBD-5 and MitoTracker Deep Red with irradiation for 20 min. Green channel for EBD-5 and the red channel for MitoTracker Deep Red (λex = 640 nm, λem = 659 nm) (808 nm laser; 200 mW cm−2). Scale bar: 20 μm.
To unravel the specific targeting mechanism and interaction mode after PSs enter the intracellular environment, fluorescence titration and 1H NMR titration tests of PSs (10−5 M) with DNA (0–10.0 eq) were implemented (Fig. S40b, c and S41b, e†). As shown in Fig. S40b and c,† the “off–on” fluorescence response and slight proton chemical shift change of EBD-1 indicated that the translocation to the nucleus could be due to its interaction with the nuclear DNA accompanied by high binding energy (−427.85 kcal mol−1) (Table S2 and Fig. S41f†).59 However, for EBD-5 with a positive zeta potential value and larger log P value (Fig. S41c and d†), electrostatic interaction and long-alkyl chain-induced hydrophobicity would enable it to firmly stain mitochondria, which was also reported in the previous literature.60The turn-on fluorescence when EBD-5 anchored on mitochondria could be attributed to the interaction between EBD-5 and mitochondrial DNA61–66 (Fig. S41e†).
Differentiating cancer cells from normal cells and cytotoxicity assay
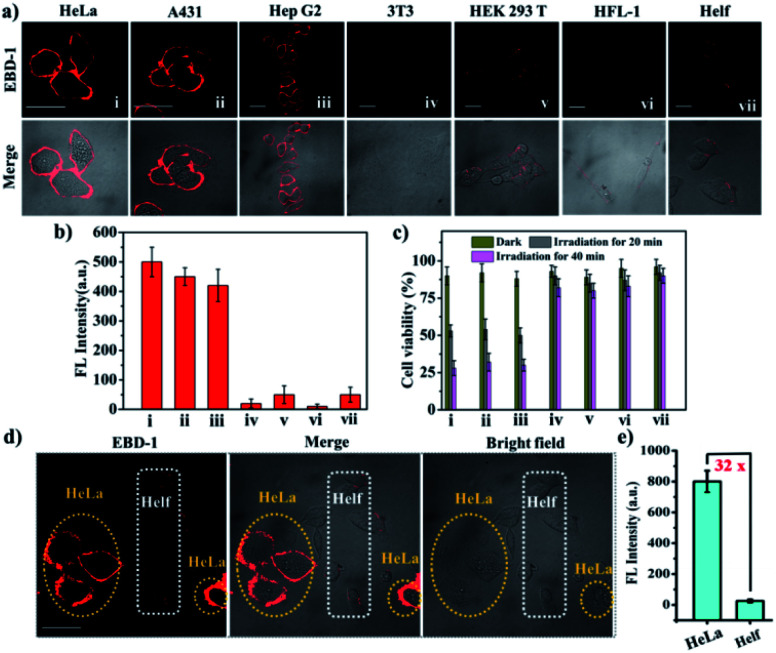
Considering that cancer cells normally bear negative surface charges compared to normal cells,67,68 the positively charged double pyridine salts in the as-prepared PSs would endow them with the capability to differentiate cancer cells from normal cells. To verify the superior uptake by cancer cells over normal cells, cancer cells (A431, HeLa, and Hep G2) and normal cells (HEK 293 T, HFL-1, 3T3 and HELF) were co-cultured with the as-prepared PSs, respectively, for 20 min. Taking EBD-1 and EBD-5 as examples, we observed that both of them showed stronger red fluorescence when cultivated with various cancer cells (A431, HeLa, and Hep G2) with a 10-fold increase in fluorescence intensity compared to those of normal cells (HEK 293T, HFL-1, 3T3 and HELF) (Fig. 4a, b and S43a†). For further demonstrating the easier uptake by cancer cells for our PSs, a co-cultured model (HeLa and HELF cells) was built for mimicking a real tumour environment in vitro. As displayed in Fig. 4d, e and S43b,† when staining with EBD-1 or EBD-5 for 30 min, the 32-fold or 30-fold fluorescence enhancements were quantified using ImageJ software in HeLa cells (cancer cells), respectively, compared to those of HELF cells (normal cells), suggesting a specific preference for cancer cell uptake. In addition, since a low dark cytotoxicity of PSs is generally required as a prerequisite for further cellular study, a series of cell survival assays including photo-toxicity and dark-cytotoxicity among different cell lines under different conditions (0, 5, 10, 15, 20, and 25 μM under dark or irradiation conditions) (Fig. 4c and S43c–e†) were carried out. The lower dark cytotoxicity as well as high photo-toxicity for cancer cells implied that our developed PSs would probably be the ideal candidates for further ex vivo imaging and cancer treatment.
Fig. 4. (a) Confocal images of three cancer cells (HeLa, A431, and Hep G2) and four normal cells (3T3, HEK 293T, HFL-1 and HELF), incubated with EBD-1 (10−5 M) for 30 min. (b) Fluorescence intensity of different cell lines stained using EBD-1. (c) Viabilities of different cell lines treated with EBD-1 (10−5 M) under different conditions for 10 min (dark or 808 nm laser; 200 mW cm−2). (d) Fluorescence intensity distribution of HeLa (yellow circle) and HELF cells (white circle) cultivated in the same dish. (e) Fluorescence intensity of the two cell lines stained with EBD-1. All of the fluorescence intensities of different cell lines were obtained using cell image processing software ImageJ. Scale bar = 20 μm.
Intracellular ROS detection and live/dead cell assessment
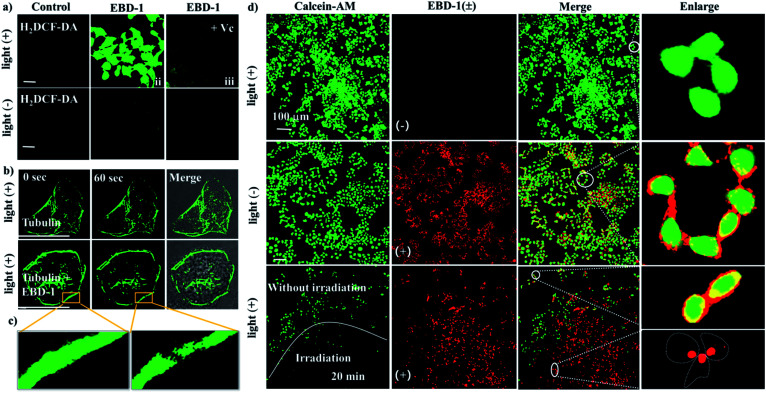
To evaluate the intracellular ROS generation ability of EBD-1 and EBD-5, a commercial ROS indicator, non-emissive 2,7-dichloro fluorescein diacetate (H2DCF-DA) that emitted green fluorescence immediately upon reacting with ROS, was used to detect intracellular ROS levels under 808 nm irradiation. As presented in Fig. 5a, when HeLa cells were incubated with H2DCF-DA alone without or with illumination for 30 min, no obvious fluorescence change was observed, indicating negligible endogenous ROS generation. But when co-cultured with H2DCF-DA and EBD-1 under the same conditions, HeLa cells showed noticeable green fluorescence enhancement in a short time, suggesting the great capability of ROS generation, which was verified by the quenched fluorescence with the addition of ROS scavenger vitamin C (Vc). Meanwhile, as shown in Fig. 5b and c, the cytoskeleton of the cells was degraded instantaneously after irradiation for 60 s, viz., the outward bulging of the cell membrane was observed from the bright field image. Moreover, to intuitively evaluate the killing effect on cancer cells, the standard living cell commercial dye calcein-AM and PSs (EBD-1) were used simultaneously to monitor cell activity. As depicted in Fig. 5d, group 1 (row 1): calcein AM + irradiation, group 2 (row 2): calcein AM + EBD-1, group 3 (row 3): calcein AM + EBD-1 + irradiation for 20 min were studied, respectively. As expected, group 1 exhibited strong green fluorescence in the whole cytoplasm after irradiation for 10 min, which was similar to that before irradiation (Fig. S44c†), indicating the high activity of cancer cells. Also, the long irradiation alone (40 min) wouldn't compromise the cell viability (Fig. S45†). The cells treated with calcein AM and EBD-1 without light illumination (group 2) presented green fluorescence in the cytoplasm as well as red fluorescence in the plasma membrane, indicating that EBD-1 anchored on the cell membrane. For the cells treated with calcein AM and EBD-1 with light illumination in group 3, to study the irradiation effect, the observed region was deliberately separated into two zones, one with irradiation for 20 min and the other without irradiation. In comparison, negligible green fluorescence was detected after continuous irradiation, suggesting the lost cell viability. Simultaneously, in the red channel, no fluorescence from EBD-1 was witnessed on the cell membrane and can be found only in the nucleus, as shown in the enlarged image, indicating the cell death, which was confirmed by the commercial live/dead cell staining calcein AM/PI assay (Fig. S46a and b†).Relatively, the killing capability to cancer cells of EBD-5 was also evaluated as shown in Fig. S44a–d.† All of these results further verified that the highly efficient NIR-I light responsive fluorescent photosensitizer (EBD-1) with cancer cell membrane targeting ability showed great advances in imaging-guided PDT.
Fig. 5. (a) Intracellular ROS imaging in the absence or presence of EBD-1 and Vc using H2DCF-DA (λex = 504 nm, λem = 529 nm) as an indicator. (b) Tubulins were labeled with EBD-1 before and after 808 nm laser irradiation for 60 s (200 mW cm−2) (λex = 500 nm, λem = 520 nm). (c) Enlarged view of the cell cytoskeleton collapses. (d) Live/dead cell assays of HeLa cells treated with different groups (group 1: calcein AM + irradiation, group 2: calcein AM + EBD-1, and group 3: calcein AM + EBD-1 + irradiation for 20 min). Green channel for calcein AM (λex = 490 nm, λem = 515 nm) and the red channel for EBD-1 (λex = 488 nm, λem = 630 nm). Scale bar = 20 μm.
In vivo fluorescence imaging
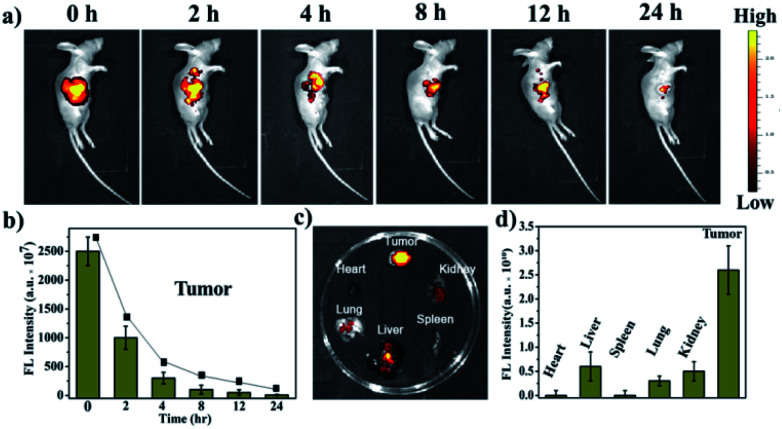
In view of a series of in vitro assays for ROS generation ability and the spatial distribution in sub-organelles of PSs via adjusting alkyl chains during apoptosis and necrosis, EBD-1 with the shortest alkyl chain was selected for further therapeutic effect investigation. Firstly, A431 tumour-bearing mice were obtained by subcutaneously injecting A431 cells (1 × 10⁶ cells). Next the tumour-bearing mice were intratumorally injected with EBD-1 (10−3 M) at a dose of 100 μL per 200 mm3, and then in vivo fluorescence imaging was performed at different time points. As exhibited in Fig. 6a and b, the fluorescence signal at the tumour site was very strong at the beginning and gradually decreased. After 24 h, the fluorescence of the tumour tissue was still clearly visible, suggesting that EBD-1 possesses long-term in vivo imaging capability. In addition, biological distribution of EBD-1 in major organs and tumours was studied by ex vivo fluorescence imaging. Fig. 6c shows that the long retention time of EBD-1 in the tumour sites also provided sufficient time for the subsequent treatment, and also strong fluorescence was presented in the detoxification organ liver, which showed that most of the EBD-1 was metabolized by the liver. Meanwhile, the heart, spleen, lungs and kidneys displayed low fluorescence intensity, which was also in line with the semi-quantitative bio-distribution (Fig. 6d).
Fig. 6. (a) In vivo fluorescence imaging of A431-tumour-bearing BALB/c mice at different time points injected with 100 μL of EBD-1 (10−3 M/200 mm3). (b) Fluorescence intensity of EBD-1 in the tumour. (c) Fluorescence images of harvested tumours and major organs at 24 h of the experiment. (d) Fluorescence intensity of tumours and major organs after 24 h of the experiment.
In vivo antitumour effects
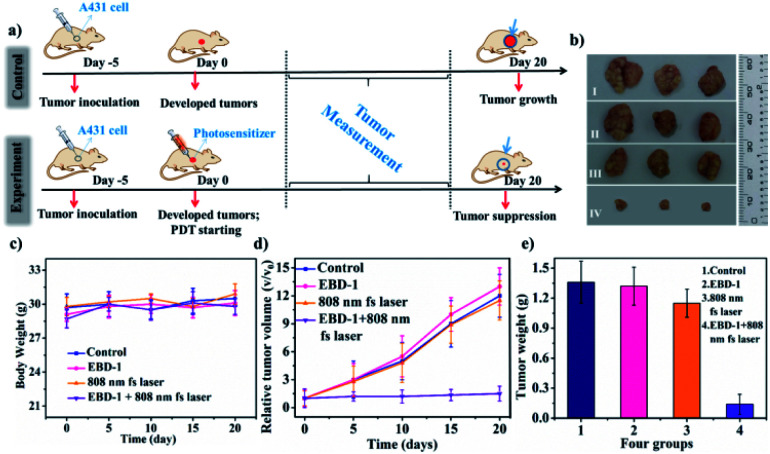
As is known, PSs with two-photon excitation (TPE) under ultra-short (femtosecond, fs) pulses of NIR light excitation displayed minimal damage to tissues, enhanced spatial selectivity and deeper tissue penetration for PDT in tumour ablation.69–71 For evaluating the anti-tumour performance of EBD-1, PDT treatment was performed on mice models as schematically illustrated in Fig. 7a. After injection of EBD-1 (10−3 M, 100 μL), A431 skin tumour-bearing nude mice were exposed to 10 min of irradiation. To better understand the efficient anti-tumour effect of EBD-1, the tumour-bearing mice of 5 days were divided into four groups (3 mice in each group): group I: control group; group II: mice with EBD-1 injection; group III: mice with 808 nm fs laser irradiation for 10 min; group IV: mice with EBD-1 injection and received 808 nm fs laser irradiation for 10 min. As presented in Fig. 7b, the three tumour batches gathered from mice in group I, group II and group III all exhibited remarkable growth. By contrast, when treated with EBD-1 under continuous exposure to NIR laser irradiation for 10 min (group IV), the volume of the tumours obviously shrank, indicating an effective tumour suppression, which was also supported by the images of the average volume and weight of the tumours and body weight (Fig. 7c–e and S47†). Furthermore, given the specific preference for cancer cell uptake and NIR-I light activation of EBD-1 to generate ROS, EBD-1 would deliver high PDT efficacy to treat non-superficial tumours as well. Finally, the in vivo biosafety of EBD-1 was tested by virtue of hematoxylin and eosin (H&E) staining of the main tissue slices (heart, liver, spleen, lungs, kidneys and tumor). As depicted in Fig. S48,† no apparent histopathological lesion was discovered within all the slices except tumour tissue, indicating the perfect histocompatibility.
Fig. 7. (a) Schematic illustration of PDT treatment. (b) The three parallel tumour images of four groups of mice 20 days after the therapy. Group I: control group; group II: mice with EBD-1 injection; group III: mice with 808 nm fs laser irradiation for 10 min; group IV: mice with EBD-1 injection and received 808 nm fs laser irradiation for 10 min. (c) Body weight curves of different groups of mice. (d) Relative tumour volume of tumour-bearing mice in four groups 20 days after PDT treatment. (e) Tumour weight of mice undergoing four different treatments.
Conclusions
In summary, the NIR-I light excited and plasma membrane-anchoring photosensitizers (EBD-1–EBD-5) following the type I mechanism were developed successfully, and were selectively ingested by cancer cells. Interestingly, EBD-1 with a short alkyl chain displayed the most efficient ROS generation capability because of the weaker intramolecular vibration, lower fluorescence quantum yield and narrow energy gap between the lowest singlet state and the lowest triplet state (ΔEST). Triggered by in situ generated ROS, membrane-to-nucleus migration of EBD-1 during apoptosis and necrosis processes was observed. Furthermore, in vivo experiments demonstrated the remarkable tumour ablation performance of EBD-1. This work would be beneficial for exploiting more efficient and valuable bio-probes for clinical applications.
Author contributions
All the authors have given approval to the final version of the manuscript.
Ethical statement
All animals (4–5 week old BALB/c mice) were obtained from Shanghai SIPPR-Bk Laboratory Animal Co., Ltd. The animal studies were performed in compliance with the relevant laws and institutional guidelines set by the Anhui Committee of Use and Care of Laboratory Animals and the overall project protocols were approved by the College of Life Science, Anhui University.
Conflicts of interest
There are no conflicts to declare.
Supplementary Material
Acknowledgments
This work was supported by the National Natural Science Foundation of China (51772002, 51432001 and 21805001), Natural Science Fund of Education Department of Anhui Province (KJ2018A0024), and Changjiang Scholars and Innovative Research Team in University, Academician Workstation of Anhui University, Anhui University Scientific Research Start-up Fund (S020118002/039 and S020118002/089). The authors acknowledge the support of the Key Lab of Photovoltaic and Energy Conservation Materials, Chinese Academy of Sciences (PECL2019KF012). We thank Prof. Hong Bi from Anhui University for the help in conducting EPR experiments.
Electronic supplementary information (ESI) available. Experimental and methods, synthesis, photophysical properties, and typical fluorescence images. See DOI: 10.1039/d0sc03093g
References
- Wu W. Mao D. Xu S. Panahandeh-Fard M. Duan Y. Hu F. Kong D. Liu B. Adv. Funct. Mater. 2019:1901791. doi: 10.1002/adfm.201901791. [DOI] [Google Scholar]
- Lu K. He C. Lin W. J. Am. Chem. Soc. 2014;136:16712–16715. doi: 10.1021/ja508679h. [DOI] [PMC free article] [PubMed] [Google Scholar]
- Gong H. Chao Y. Xiang J. Han X. Song G. Feng L. Liu J. Yang G. Chen Q. Liu Z. Nano Lett. 2016;16:2512–2521. doi: 10.1021/acs.nanolett.6b00068. [DOI] [PubMed] [Google Scholar]
- Wei Z. Liang P. Xie J. Song C. Tang C. Wang Y. Yin X. Cai Y. Han W. Dong X. Chem. Sci. 2019;10:2778–2784. doi: 10.1039/C8SC04123G. [DOI] [PMC free article] [PubMed] [Google Scholar]
- Straten D. Mashayekhi V. Bruijn H. S. Oliveira S. Robinson D. J. Cancers. 2017;9:19. doi: 10.3390/cancers9020019. [DOI] [PMC free article] [PubMed] [Google Scholar]
- Mroz P. Yaroslavsky A. Kharkwal G. B. Hamblin M. R. Cancers. 2011;3:2516–2539. doi: 10.3390/cancers3022516. [DOI] [PMC free article] [PubMed] [Google Scholar]
- Henderson B. W. Dougherty T. J. Photochem. Photobiol. 1992;55:145–157. doi: 10.1111/j.1751-1097.1992.tb04222.x. [DOI] [PubMed] [Google Scholar]
- Fan W. Huang P. Chen X. Chem. Soc. Rev. 2016;45:6488–6519. doi: 10.1039/C6CS00616G. [DOI] [PubMed] [Google Scholar]
- Bystrom L. M. Guzman M. L. Rivella S. Antioxid. Redox Signaling. 2014;20:1917–1924. doi: 10.1089/ars.2012.5014. [DOI] [PMC free article] [PubMed] [Google Scholar]
- Liou G.-Y. Storz P. Free Radical Res. 2010;44:479–496. doi: 10.3109/10715761003667554. [DOI] [PMC free article] [PubMed] [Google Scholar]
- Lin L.-S. Song J. Song L. Ke K. Liu Y. Zhou Z. Shen Z. Li J. Yang Z. Tang W. Niu G. Yang H.-H. Chen X. Angew. Chem. 2018;130:4996–5000. doi: 10.1002/ange.201712027. [DOI] [PubMed] [Google Scholar]
- Zhang L. Wang D. Yang K. Sheng D. Tan B. Wang Z. Ran H. Yi H. Zhong Y. Lin H. Chen Y. Adv. Sci. 2018;5:1800049. doi: 10.1002/advs.201800049. [DOI] [PMC free article] [PubMed] [Google Scholar]
- Liu Y. Bhattarai P. Dai Z. Chen X. Chem. Soc. Rev. 2019;4:2053–2108. doi: 10.1039/C8CS00618K. [DOI] [PMC free article] [PubMed] [Google Scholar]
- Abbas M. Zou Qi. Li S. Yan X. Adv. Mater. 2017;29:160502. doi: 10.1002/adma.201605021. [DOI] [PubMed] [Google Scholar]
- Wang D. Wu H. Lim W. Phua S. Xu P. Chen Q. Guo Z. Zhao Y. Adv. Mater. 2019;31:1901893. doi: 10.1002/adma.201901893. [DOI] [PubMed] [Google Scholar]
- Benov L. Protoplasma. 2001;217:33–36. doi: 10.1007/BF01289410. [DOI] [PubMed] [Google Scholar]
- Dai Y. Yang Z. Cheng S. Wang Z. Zhang R. Zhu G. Wang Z. Yung B. C. Tian R. Jacobson O. Xu C. Ni Q. Song J. Sun X. Niu G. Chen X. Adv. Mater. 2018;30:1704877. doi: 10.1002/adma.201704877. [DOI] [PubMed] [Google Scholar]
- Samuel E. L. G. Marcano D. C. Berka V. Bitner B. R. Wu G. Potter A. Fabian R. H. Pautler R. G. Kentd T. A. Tsai A. Tour J. M. Proc. Natl. Acad. Sci. U. S. A. 2015;112:2343–2348. doi: 10.1073/pnas.1417047112. [DOI] [PMC free article] [PubMed] [Google Scholar]
- Yao J. Cheng Y. Zhou M. Zhao S. Lin S. Wang X. Wu J. Li S. Wei H. Chem. Sci. 2018;9:2927–2933. doi: 10.1039/c7sc05476a. [DOI] [PMC free article] [PubMed] [Google Scholar]
- Gilson R. C. Black K. C. L. Lane D. D. Achilefu S. Angew. Chem., Int. Ed. 2017;56:10717–10720. doi: 10.1002/anie.201704458. [DOI] [PMC free article] [PubMed] [Google Scholar]
- Lucky S. S. Idris N. M. Li Z. Huang K. Soo K. C. Zhang Y. ACS Nano. 2015;9:191–205. doi: 10.1021/nn503450t. [DOI] [PubMed] [Google Scholar]
- Han R. Zhao M. Wang Z. Liu H. Zhu S. Huang L. Wang Y. Wang L. Hong Y. Sha Y. Jiang Y. ACS Nano. 2020;14:9532–9544. doi: 10.1021/acsnano.9b05169. [DOI] [PubMed] [Google Scholar]
- Lan G. Ni K. Veroneau S. S. Feng X. Nash G. T. Luo T. Xu Z. Lin W. J. Am. Chem. Soc. 2019;141:4204–4208. doi: 10.1021/jacs.8b13804. [DOI] [PubMed] [Google Scholar]
- Lv Z. Wei H. Li Q. Su X. Liu S. Zhang K. Y. Lv W. Zhao Q. Li X. Huang W. Chem. Sci. 2018;9:502–512. doi: 10.1039/C7SC03765A. [DOI] [PMC free article] [PubMed] [Google Scholar]
- Ren S. Cheng X. Chen M. Liu C. Zhao P. Huang W. He J. Zhou Z. Miao L. ACS Appl. Mater. Interfaces. 2017;9:31509–31518. doi: 10.1021/acsami.7b09522. [DOI] [PubMed] [Google Scholar]
- Sharifi S. Behzadi S. Laurent S. Forrest M. L. Stroeve P. Mahmoudi M. Chem. Soc. Rev. 2012;41:2323–2343. doi: 10.1039/C1CS15188F. [DOI] [PMC free article] [PubMed] [Google Scholar]
- Nguyen V.-N. Qi S. Kim S. Kwon N. Kim G. Yim Y. Park S. Yoon J. J. Am. Chem. Soc. 2019;141:16243–16248. doi: 10.1021/jacs.9b09220. [DOI] [PubMed] [Google Scholar]
- Zhuang Z. Dai J. Yu M. Li J. Shen P. Hu R. Lou X. Zhao Z. Tang B. Z. Chem. Sci. 2020;11:3405–3417. doi: 10.1039/D0SC00785D. [DOI] [PMC free article] [PubMed] [Google Scholar]
- Li M. Xiong T. Du J. Tian R. Xiao M. Guo L. Long S. Fan J. Sun W. Shao K. Song X. Foley J. W. Peng X. J. Am. Chem. Soc. 2019;141:2695–2702. doi: 10.1021/jacs.8b13141. [DOI] [PubMed] [Google Scholar]
- Feng Y. Wu Y. Zuo J. Tu L. Que I. Chang Y. Cruz L. J. Chan A. Zhang H. Biomaterials. 2019;201:33–41. doi: 10.1016/j.biomaterials.2019.02.015. [DOI] [PubMed] [Google Scholar]
- Hou Z. Deng K. Wang M. Liu Y. Chang M. Huang S. Li C. Wei Y. Cheng Z. Han G. Al Kheraif A. A. Lin J. Chem. Mater. 2019;31:774–784. doi: 10.1021/acs.chemmater.8b03762. [DOI] [Google Scholar]
- Liu B. Li C. Yang P. Hou Z. Lin J. Adv. Mater. 2017;29:1605434. doi: 10.1002/adma.201605434. [DOI] [PubMed] [Google Scholar]
- Yang D. Ma P. Hou Z. Cheng Z. Li C. Lin J. Chem. Soc. Rev. 2015;44:1416. doi: 10.1039/C4CS00155A. [DOI] [PubMed] [Google Scholar]
- Niedre M. Patterson M. S. Wilson B. C. Photochem. Photobiol. 2002;75:382–391. doi: 10.1562/0031-8655(2002)0750382DNILDO2.0.CO2. [DOI] [PubMed] [Google Scholar]
- Liu Z. Zou H. Zhao Z. Zhang P. Shan G. Kwok R. T. K. Lam J. W. Y. Zheng L. Tang B. ACS Nano. 2019;13:11283–11293. doi: 10.1021/acsnano.9b04430. [DOI] [PubMed] [Google Scholar]
- Leem J. W. Park J. Kim S.-W. Kim S.-R. Choi S. H. Choi K.-H. Kim Y. L. Adv. Sci. 2018;5:1700863. doi: 10.1002/advs.201700863. [DOI] [PMC free article] [PubMed] [Google Scholar]
- Chen W. Luo G. Zhang X. Adv. Mater. 2019;31:1802725. doi: 10.1002/adma.201802725. [DOI] [PubMed] [Google Scholar]
- Benhamou R. I. Bibi M. Berman J. Fridman M. Angew. Chem., Int. Ed. 2018;57:6230–6235. doi: 10.1002/anie.201802509. [DOI] [PMC free article] [PubMed] [Google Scholar]
- Guo L. Li C. Shang H. Zhang R. Li X. Lu Q. Cheng X. Liu Z. Sun J. Z. Yu X. Chem. Sci. 2020;11:661. doi: 10.1039/C9SC05875C. [DOI] [PMC free article] [PubMed] [Google Scholar]
- Cheng H. Fan G.-L. Fan J.-H. Yuan P. Deng F.-A. Qiu X.-Z. Yu X.-Y. Li S.-Y. Biomaterials. 2019;224:119497. doi: 10.1016/j.biomaterials.2019.119497. [DOI] [PubMed] [Google Scholar]
- Qiu W. X. Zhang M. K. Liu L. H. Gao F. Zhang L. Li S. Y. Xie B. R. Zhang C. Feng J. Zhang X. Z. Biomaterials. 2018;16:181–194. doi: 10.1016/j.biomaterials.2018.01.037. [DOI] [PubMed] [Google Scholar]
- Zhang C. Gao F. Wu W. Qiu W.-X. Zhang L. Li R. Zhuang Z.-N. Yu W. Cheng H. Zhang X.-Z. ACS Nano. 2019;13:11249–11262. doi: 10.1021/acsnano.9b04315. [DOI] [PubMed] [Google Scholar]
- Jia H. R. Zhu Y. X. Xu K. F. Liu X. Y. Wu F. G. J. Controlled Release. 2018;286:103–113. doi: 10.1016/j.jconrel.2018.07.027. [DOI] [PubMed] [Google Scholar]
- Andrews N. W. Almeida P. E. Corrotte M. Trends Cell Biol. 2014;24:734–742. doi: 10.1016/j.tcb.2014.07.008. [DOI] [PMC free article] [PubMed] [Google Scholar]
- Tian M. Sun J. Dong B. Lin W. Angew. Chem., Int. Ed. 2018;57:16506–16510. doi: 10.1002/anie.201811459. [DOI] [PubMed] [Google Scholar]
- Mroz P. Yaroslavsky A. Kharkwal G. B. Hamblinn M. R. Cancers. 2011;3:2516–2539. doi: 10.3390/cancers3022516. [DOI] [PMC free article] [PubMed] [Google Scholar]
- Oleinick N. L. Evans H. H. Radiat. Res. 1998;150:S146–S156. [PubMed] [Google Scholar]
- Mikeš J. Kleban J. Sačková V. Horváth V. Jamborová E. Vaculová A. Kozubík A. Hofmanová J. Fedoročko P. Photochem. Photobiol. Sci. 2007;6:758–766. doi: 10.1039/b700350a. [DOI] [PubMed] [Google Scholar]
- Li M. Xia J. Tian R. Wang J. Fan J. Du J. Long S. Song X. Foley J. W. J. Am. Chem. Soc. 2018;140:14851–14859. doi: 10.1021/jacs.8b08658. [DOI] [PubMed] [Google Scholar]
- Hu W. He T. Zhao H. Tao H. Chen R. Jin L. Li J. Fan Q. Huang W. Baev A. Prasad P. N. Angew. Chem., Int. Ed. 2019;58:11105–11111. doi: 10.1002/anie.201905129. [DOI] [PubMed] [Google Scholar]
- Gao Y. Wang X. He X. He Z. Yang X. Tian S. Meng F. Ding D. Luo L. Tang B. Adv. Funct. Mater. 2019;29:1902673. [Google Scholar]
- Gao S. Wang G. Qin Z. Wang X. Zhao G. Ma Q. Zhu L. Biomaterials. 2017;112:324–335. doi: 10.1016/j.biomaterials.2016.10.030. [DOI] [PubMed] [Google Scholar]
- Sun X. Luo X. Zhang X. Xie J. Jin S. Wang H. Zheng X. Wu X. Xie Y. J. Am. Chem. Soc. 2019;141:3797–3801. doi: 10.1021/jacs.8b13051. [DOI] [PubMed] [Google Scholar]
- Zhang W. Huang Y. Chen Y. Zhao E. Hong Y. Chen S. Lam J. W. Y. Chen Y. Hou J. Tang B. Z. ACS Appl. Mater. Interfaces. 2019;11:10567–10577. doi: 10.1021/acsami.9b00643. [DOI] [PubMed] [Google Scholar]
- Li Y. Wu Y. Chang J. Chen M. Liu R. Li F. Chem. Commun. 2013;49:11335–11337. doi: 10.1039/C3CC46991C. [DOI] [PubMed] [Google Scholar]
- Jia H.-R. Zhu Y.-X. Xu K.-F. Pan G.-Y. Liu X. Qiao Y. Wu F.-G. Chem. Sci. 2019;10:4062–4068. doi: 10.1039/C8SC04884C. [DOI] [PMC free article] [PubMed] [Google Scholar]
- Li Q. Li Y. Jacky T. Lam W. Y. Sung H. H. Y. Williams I. D. Kwok R. T. K. Ho C. Li K. Wang J. Tang B. Angew. Chem., Int. Ed. 2019;58:2–10. doi: 10.1002/anie.201813331. [DOI] [Google Scholar]
- Zhang H. Zhu X. Liu G. Ding X. Wang J. Yang M. Zhang R. Zhang Z. Tian Y. Zhou H. Anal. Chem. 2019;91:6730–6737. doi: 10.1021/acs.analchem.9b00806. [DOI] [PubMed] [Google Scholar]
- Zhang T. Li Y. Zheng Z. Ye R. Zhang Y. Kwok R. T. K. Lam J. W. Y. Tang B. J. Am. Chem. Soc. 2019;141:5612–5616. doi: 10.1021/jacs.9b00636. [DOI] [PubMed] [Google Scholar]
- Zhang R. Niu G. Li X. Guo L. Zhang H. Yang R. Chen Y. Yu X. Tang B. Z. Chem. Sci. 2019;10:1994–2000. doi: 10.1039/C8SC05119D. [DOI] [PMC free article] [PubMed] [Google Scholar]
- Tian M. Sun J. Dong B. Lin W. Anal. Chem. 2019;91:10056–10063. doi: 10.1021/acs.analchem.9b01959. [DOI] [PubMed] [Google Scholar]
- Chen H. Wang J. Feng X. Zhu M. Hoffffmann S. Hsu A. Qian K. Huang D. Zhao F. Liu W. Zhang H. Cheng Z. Chem. Sci. 2019;10:7946–7951. doi: 10.1039/C9SC01410A. [DOI] [PMC free article] [PubMed] [Google Scholar]
- Chen J. Law C. Lam J. Dong Y. Lo S. M. F. Williams I. D. Zhu D. Chem. Mater. 2003;15:1535–1546. doi: 10.1021/cm021715z. [DOI] [Google Scholar]
- Hong Y. Chen S. Leung C. Lam J. Tang B. Chem.–Asian J. 2013;8:1806–1812. doi: 10.1002/asia.201300065. [DOI] [PubMed] [Google Scholar]
- Liu S. Cheng Y. Zhang H. Qiu Z. Kwok R. T. K. Lam J. W. Y. Tang B. Angew. Chem., Int. Ed. 2018;57:6274–6278. doi: 10.1002/anie.201803268. [DOI] [PubMed] [Google Scholar]
- Shi J. Chang N. Li C. Mei J. Deng C. Luo X. Liu Z. Bo Z. Dong Y. Tang B. Chem. Commun. 2012;4:10675–10677. doi: 10.1039/C2CC35641D. [DOI] [PubMed] [Google Scholar]
- Chen B. Le W. Wang Y. Li Z. Wang D. Ren L. Lin L. Cui S. Hu J. J. Hu Y. Yang P. Ewing R. C. Shi D. Cui Z. Theranostics. 2016;6:1887–1898. doi: 10.7150/thno.16358. [DOI] [PMC free article] [PubMed] [Google Scholar]
- Wang D. Lee M. M. S. Shan G. Kwok R. T. K. Lam J. W. Y. Su H. Cai Y. Tang B. Adv. Mater. 2018;30:1802105. doi: 10.1002/adma.201802105. [DOI] [PubMed] [Google Scholar]
- Shen Y. Shuhendler A. J. Ye D. Xu J. Chen H. Chem. Soc. Rev. 2016;45:6725–6741. doi: 10.1039/C6CS00442C. [DOI] [PubMed] [Google Scholar]
- Dong B. Song X. Kong X. Wang C. Tang Y. Liu Y. Lin W. Adv. Mater. 2016;28:8755–8759. doi: 10.1002/adma.201602939. [DOI] [PubMed] [Google Scholar]
- Zhang H. Zhu X. Li H. Liu G. Wang J. Wang A. Kong L. Zhu W. Anal. Chem. 2019;91:14911–14919. doi: 10.1021/acs.analchem.9b03009. [DOI] [PubMed] [Google Scholar]
Associated Data
This section collects any data citations, data availability statements, or supplementary materials included in this article.


