

Abstract
The monosaccharide O-GlcNAc is an essential and dynamic post-translational modification (PTM) that decorates thousands of nucleocytoplasmic proteins. Interrogating the role of O-GlcNAc on a target protein is crucial yet challenging to perform in cells. We recently reported a pair of methods to selectively install or remove O-GlcNAc on a target protein in cells using nanobody-fusions to an engineered O-GlcNAc transferase (OGT) or split O-GlcNAcase (OGA). Target protein O-GlcNAcylation and de-O-GlcNAcylation complements methods to interrogate the role of O-GlcNAc on a global scale or at individual glycosites. Herein, we describe a protocol for utilizing the nanobody-OGT and -splitOGA systems to screen for O-GlcNAc functionality on a target protein. We additionally include associated protocols for the detection of O-GlcNAc and cloning procedures to adapt the method for the user’s target protein of interest.
Keywords: O-GlcNAc, glycosylation, deglycosylation, nanobodies, proximity-direction, post-translational modification
INTRODUCTION:
O-Linked N-acetyl glucosamine (O-GlcNAc) is a dynamic post-translational modification (PTM) installed on serine or threonine residues of numerous nucleocytoplasmic proteins by a pair of enzymes, O-GlcNAc transferase (OGT) and O-GlcNAcase (OGA) (Figure 1a). O-GlcNAc plays essential roles in nutrient homeostasis, cellular signaling, and its dysregulation has been linked to various chronic diseases. To uncover the functions of the O-GlcNAc modification in cells and organisms, methods to engineer O-GlcNAc from the global glycoproteome to specific glycosites have been developed (highlighted inset, Figure 1b). Recently, approaches to engineer O-GlcNAc on desired target proteins using nanobodies or RNA aptamers have been reported, which complement methods for altering O-GlcNAc globally or at specific glycosites (Figure 1c). Protein selective methods to engineer O-GlcNAc enable researchers to characterize the role of O-GlcNAc on a target protein within cells. Researchers may use these methods after characterization of the phenotypic effects of O-GlcNAc using a global method, but prior to detailed glycosite mapping and mutagenesis studies on a target protein.
Figure 1:
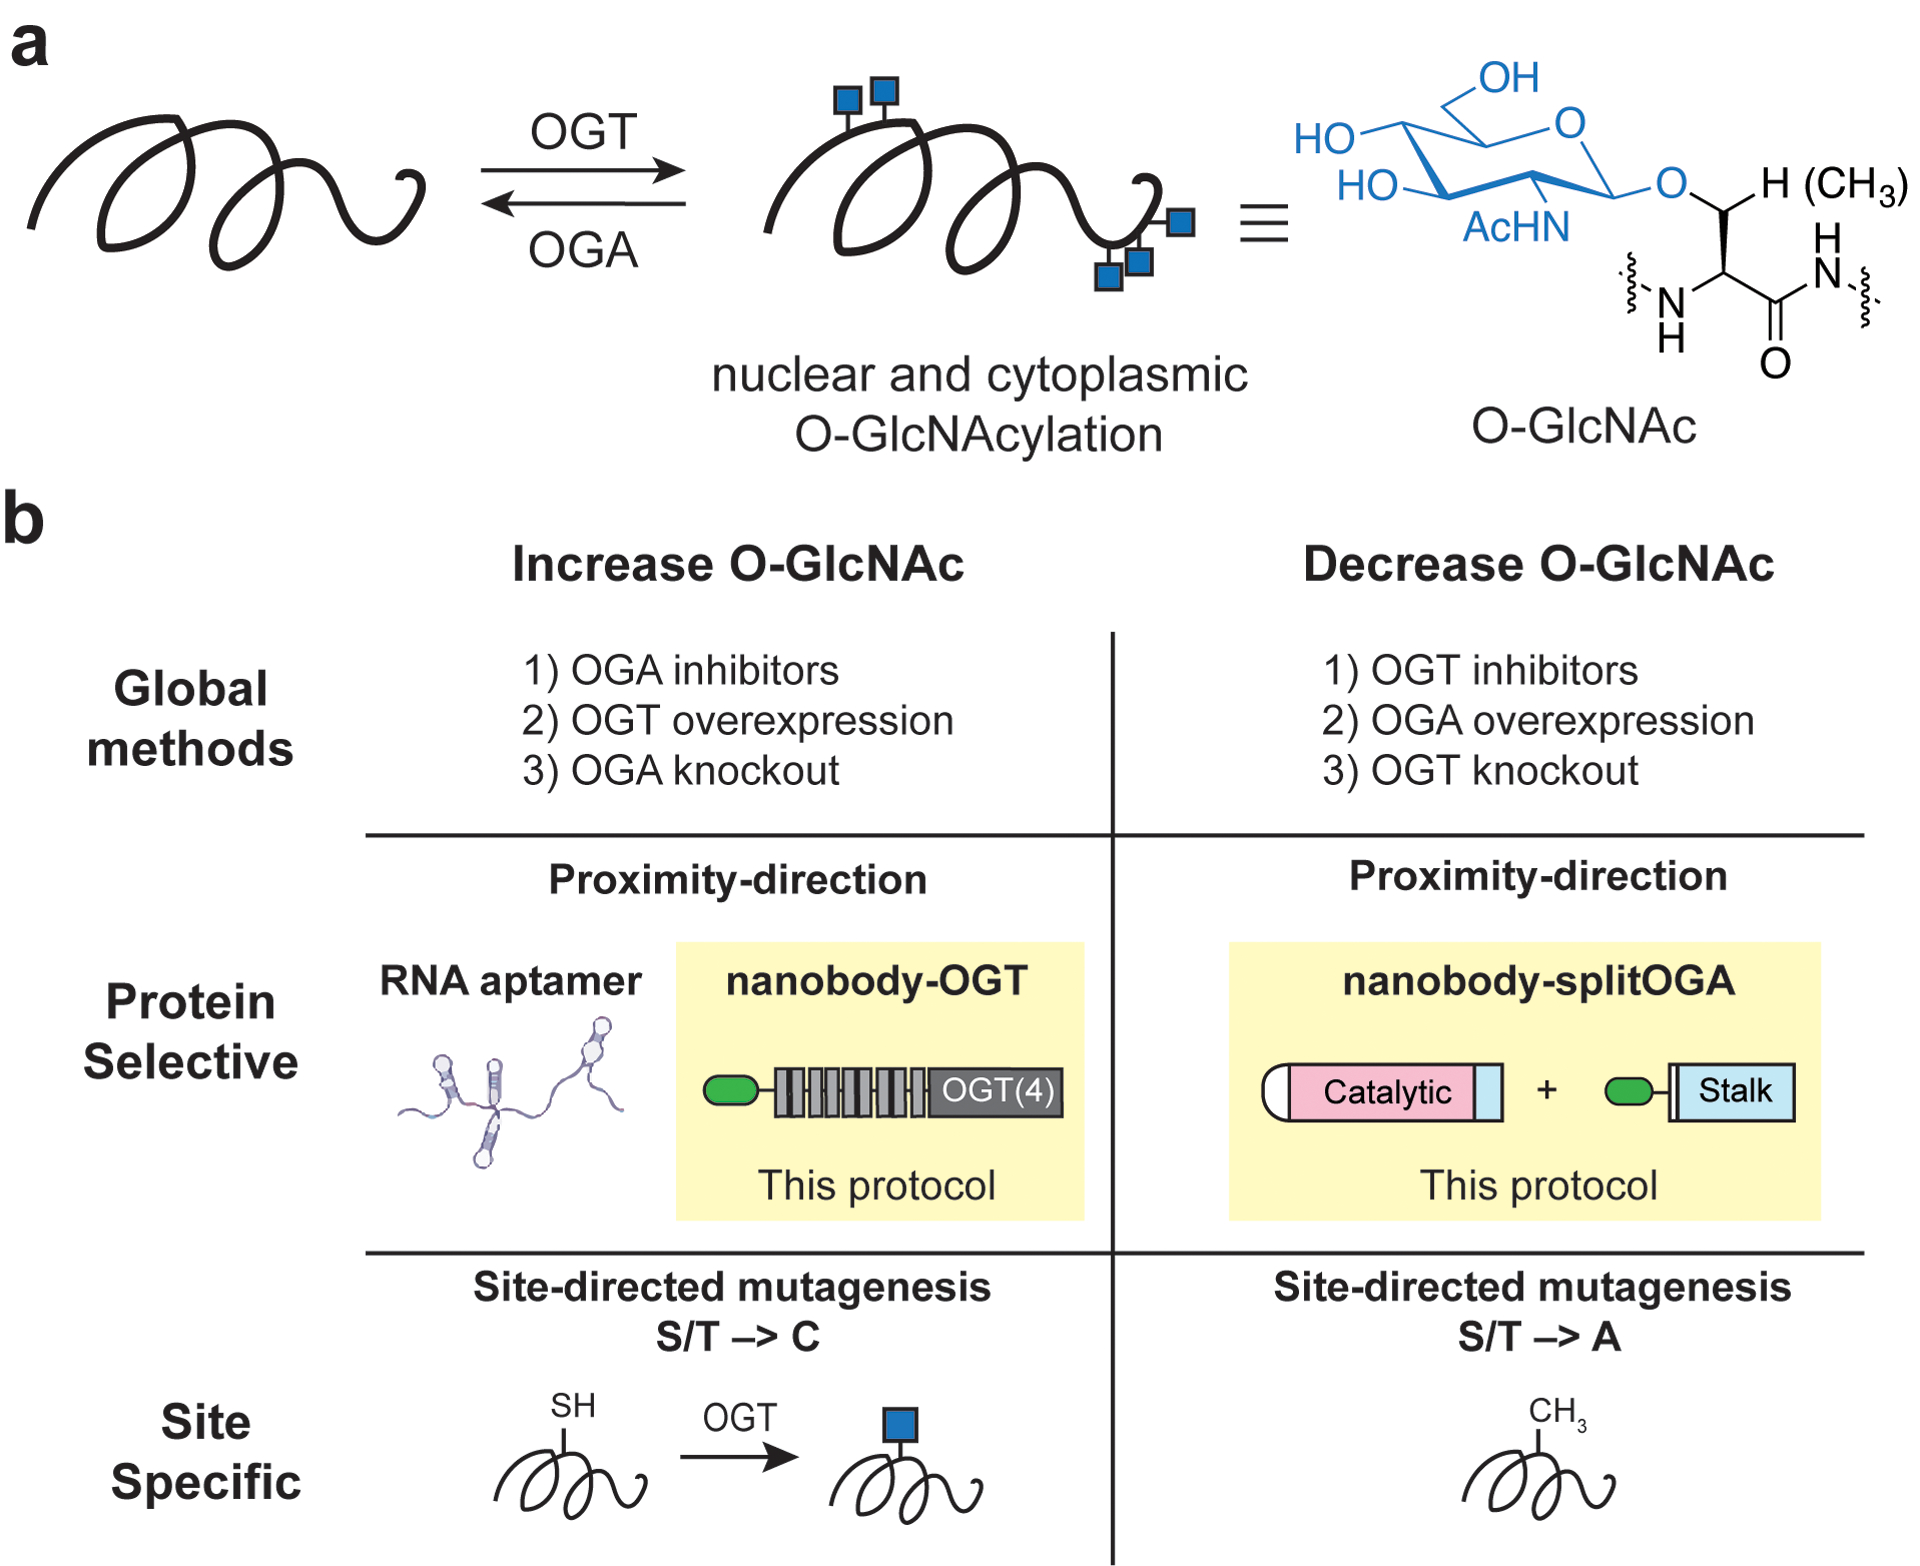
Current approaches to study O-GlcNAc. (a) O-GlcNAc is added or removed on a global level by the OGT or OGA enzymes. (b) Global methods to regulate the O-GlcNAc state of a cell rely on inhibitors (i.e., Thiamet-G, OSMI-4, among others), overexpression, or knockdowns of OGT and OGA. Protein selective O-GlcNAc engineering can be performed with RNA aptamers (Zhu, Y. 2019) or the nanobody-OGT/OGA constructs detailed in this protocol. O-GlcNAc engineering at the glycosite level is achievable with site-directed mutagenesis.
Here we detail a protein selective approach that selectively installs or removes O-GlcNAc on a target protein in living cells using a nanobody-OGT or nanobody-splitOGA fusion, respectively. A nanobody is a small, single-domain protein binder that is capable of recognizing intracellular targets with high affinity and selectivity. The nanobody is fused to an engineered OGT or splitOGA for expression in cells. The target protein of interest is tagged with either a protein epitope (i.e., GFP/RFP) or a peptide tag (i.e., EPEA, Ubc/6E tag, BC2), which recruits the complementary nanobody-OGT or -splitOGA for selective addition or removal of O-GlcNAc. The downstream biological effects of O-GlcNAc on the target protein may then be measured. The advantage of this approach is two-fold: (1) it enables protein-level functional analysis in the absence of a glycosite map and (2) the biological effect of O-GlcNAc on the target protein, if any, is measurable regardless of the native levels of O-GlcNAc on the protein. Furthermore, use of nanobody-OGT increases the stoichiometry of an O-GlcNAc-modified target protein, which improves detection of the glycosites by mass spectrometry (MS) for future site-directed mutagenesis studies.
Here, we describe the application of the nanobody-OGT system to a target protein in cells for targeted protein O-GlcNAcylation and the detection and analysis of changes in O-GlcNAc using immunoprecipitation (IP) (Basic Protocol 1). Application of the nanobody-splitOGA system to a target protein for targeted protein deglycosylation and analysis by IP is also described (Basic Protocol 2). In some cases, users may find O-GlcNAcylated proteins are more readily visualized by a chemoenzymatic labeling method that is also detailed here (Alternative protocol 1). We also describe one protocol for generating additional nanobody-fusions to -OGT/-splitOGA and tagged target proteins using our vector scaffolds (Support Protocol 1). Finally, we provide additional guidance for the use of this system, analysis of Western blot results, and the design of OGT and OGA fusion proteins in the commentary section of this protocol.
Basic Protocol 1
Target protein O-GlcNAcylation of JunB using nanobody-OGT
In Basic Protocol 1, we describe a representative protocol for use of nanobody-OGT for target protein O-GlcNAcylation (Ramirez et al. 2020). Here, the GFP nanobody nLag6 fused to OGT is directed to GFP-Flag-JunB-EPEA as the target protein in HEK293T cells. Of the several GFP nanobodies available (Fridy, et al. 2014), the GFP nanobody nLag6 produces the highest yields of O-GlcNAc on the target protein (unpublished data). This protocol is generalizable to other nanobody-tag pairs, target proteins, and transfectable cell lines. Catalytically inactive nanobody-OGT is used as a negative control. Here, we detect O-GlcNAc changes with the RL2 antibody following IP using C-tag beads (Figure 2). Additional methods to detect the O-GlcNAcylated protein are described in Alternative Protocol 1.
Figure 2:
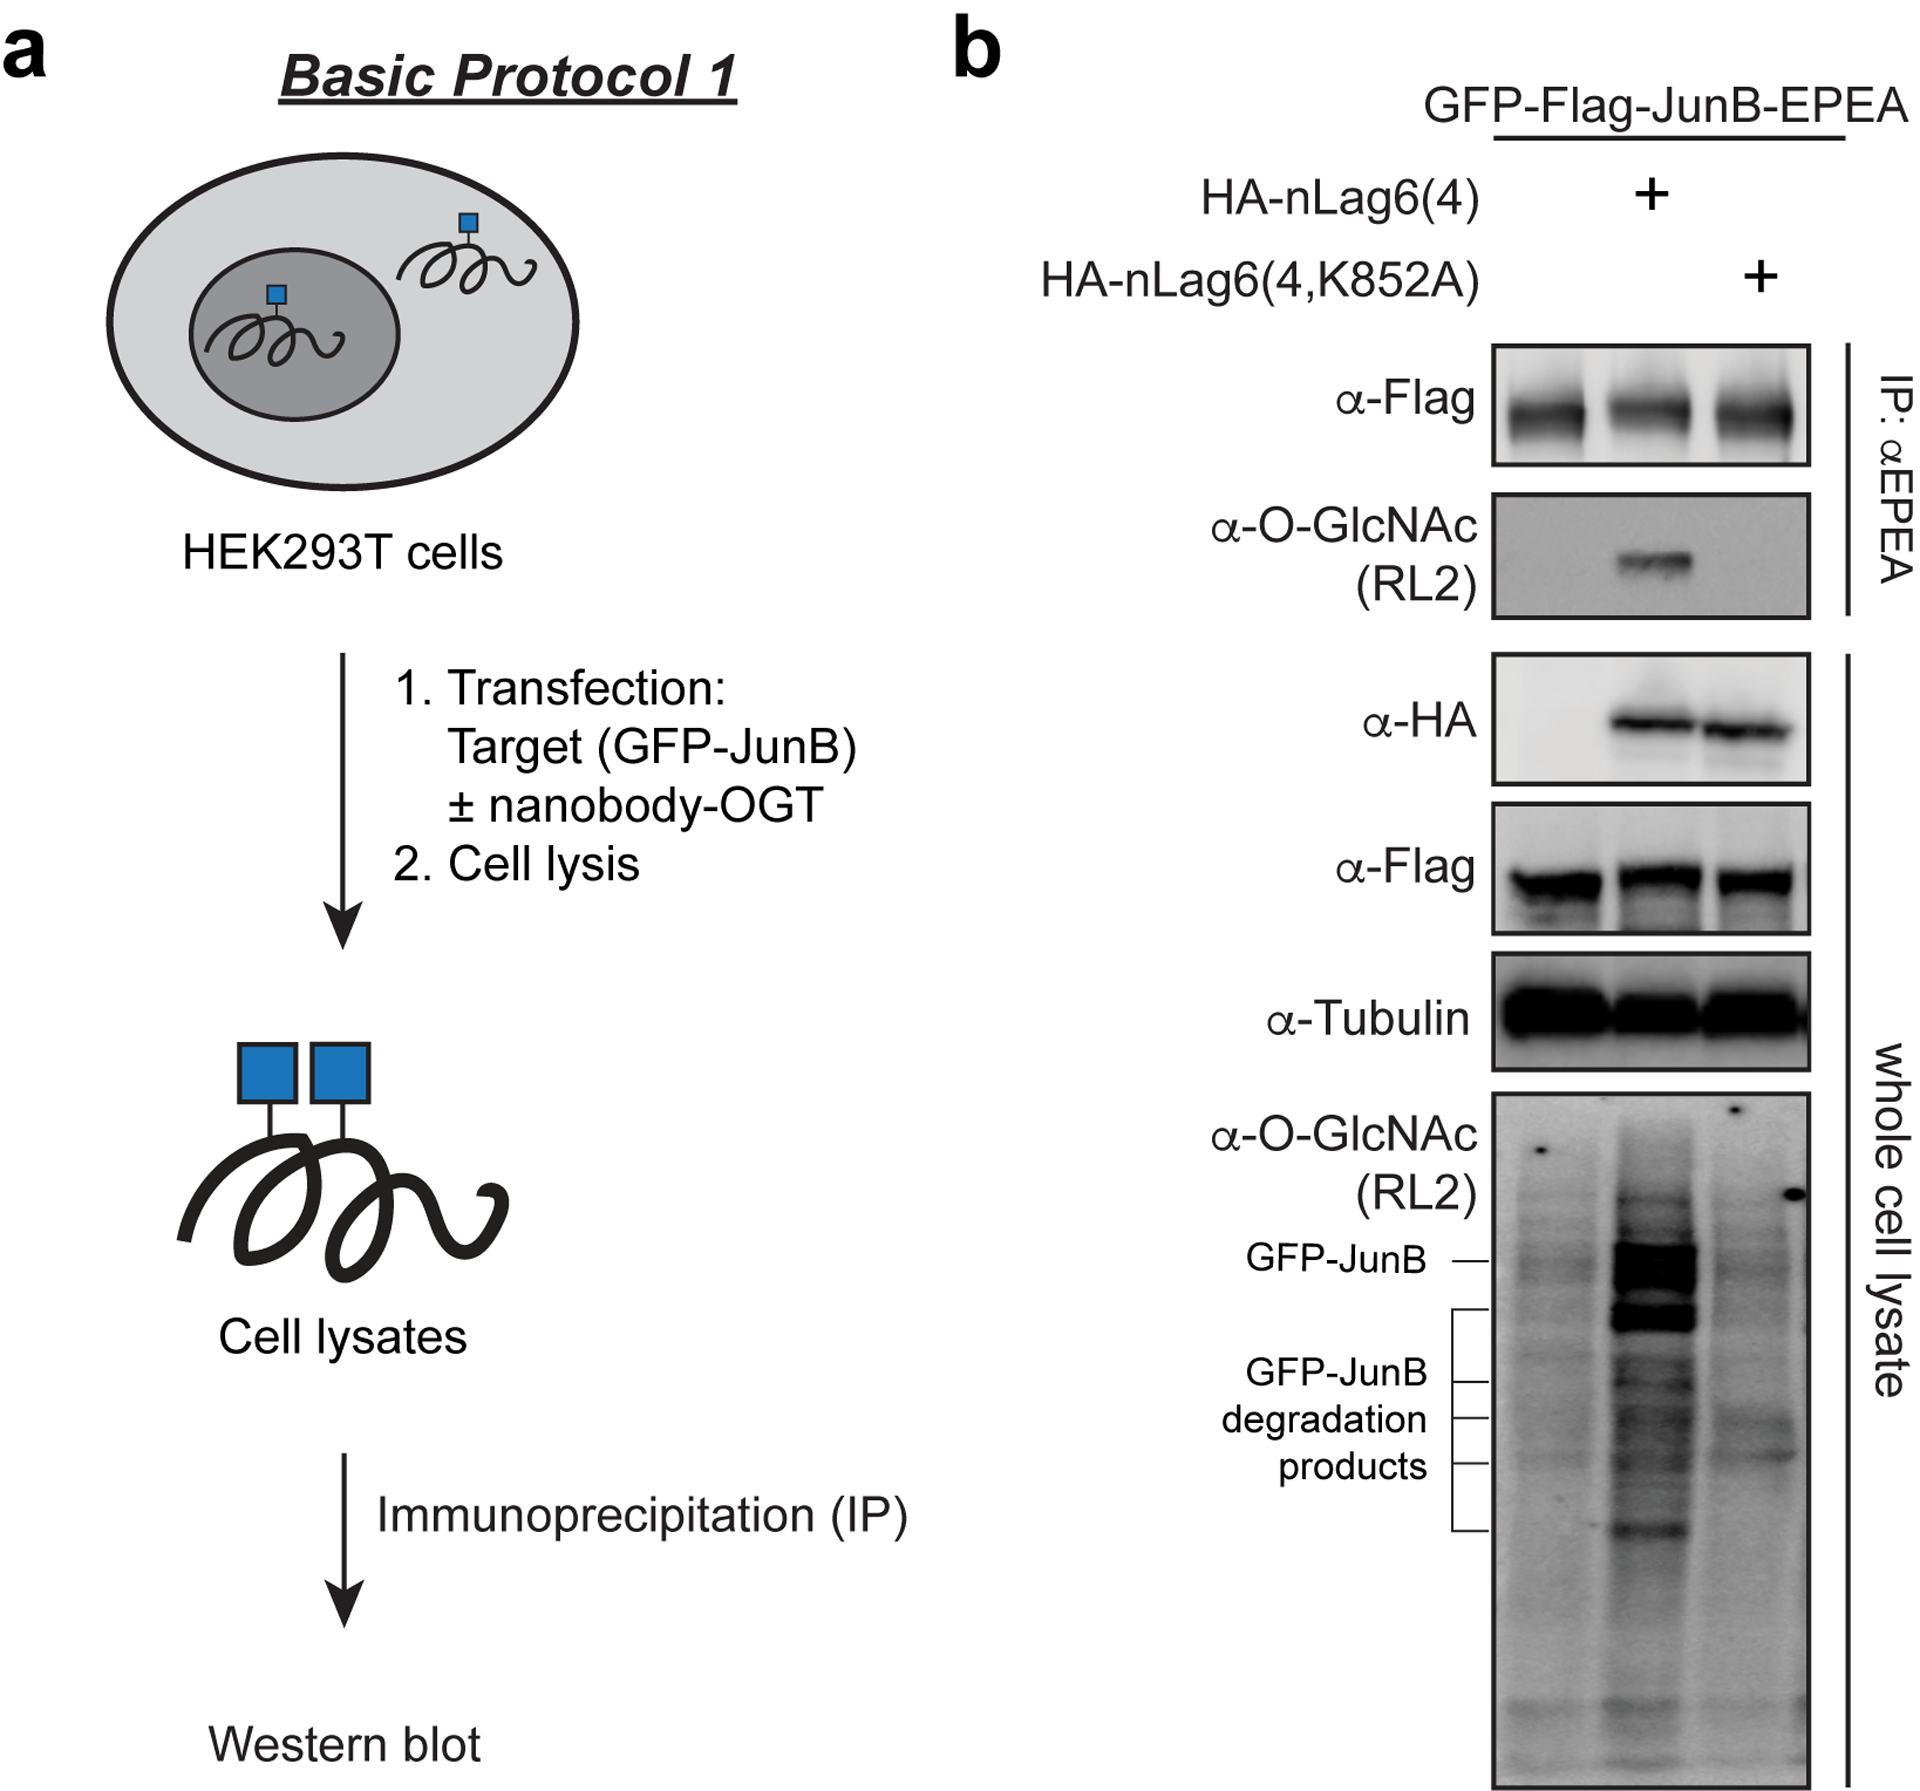
Basic Protocol 1 workflow (a) and representative data (b) for targeting of GFP-JunB with nanobody-OGT. HEK293T cells are first co-transfected with the target protein GFP-JunB and either nanobody-OGT or a catalytically inactive nanobody-OGT(K852A). Cell lysates are collected and GFP-JunB is immunoprecipitated using C-Tag beads. Captured proteins are then resolved by gel electrophoresis and blotted with antibodies for a western blot.
Materials
Reagents
HEK293T cells (ATCC, cat. no. CRL-3216)
DMEM cell media (Prepared in Reagents and Solutions section)
TransIT®-Pro (Mirus bio, cat. no. MIR5760)
Opti-MEM (Thermo, cat. no. 31985070)
pcDNA3.1-GFP-Flag-JunB-EPEA (Addgene, cat. no. 160743)
pcDNA3.1-empty vector (Invitrogen, cat. no. V79020)
pcDNA3.1-HA-nLag6-(EAAAK)4-OGT(4) (Addgene, cat. no. 168192)
pcDNA3.1-HA-nLag6-(EAAAK)4-OGT(4,K852A) (Addgene, cat. no. 168191)
Trypsin-EDTA (0.25%), phenol red (Thermo, cat. no. 25200114)
1X PBS (Prepared in Reagents and Solutions section)
2% SDS + 1X PBS (Prepared in Reagents and Solutions section)
PUGNAc (Sigma, cat. no. A7229–10MG)
cOmplete™, EDTA-free Protease Inhibitor Cocktail (Sigma, cat. no. 11873580001)
Pierce BCA Protein Assay Kit (Thermo, cat. no. 23225)
5X BME sample buffer (Prepared in Reagents and Solutions section)
CaptureSelect™ C-Tag affinity matrix (Thermo, cat. no. 191307010)
1X TBST (Prepared in Reagents and Solutions section)
1X BME sample buffer (Prepared in Reagents and Solutions section)
PageRuler™ Prestained Protein Ladder, 10 to 180 kDa (Thermo, cat. no. 26617)
Ponceau stain solution (VWR, cat. no. 76236–520)
3% BSA + 1X TBST (Prepared in Reagents and Solutions section)
HA-Tag (C29F4) Rabbit mAb (Cell signaling, cat. no. 3724S)
Tubulin (Cell signaling, cat. no 2148S)
O-GlcNAc (RL2) (Abcam, cat. no. ab2739)
Flag-Tag (M2) (Sigma, cat. no. F2165–1MG)
Flag-Tag (D6W5B) (Cell signaling, cat. no. 14793S)
Anti-Mouse IR-800CW (Li-cor, cat. no. 925–32210)
Anti-Rabbit IR-680RD (Li-cor, cat. no. 925–68071)
Equipment
150 mm Falcon Sterile Tissue Culture Dishes, Polystyrene (VWR, cat. no. 25383–103)
15 mL centrifuge conical tubes (VWR, cat. no. 89039–664)
Eppendorf centrifuge 5810 R (Eppendorf, cat.no. 022628157)
1.5 mL microcentrifuge tubes (VWR, cat. no. 89000–028)
Microtube racks (VWR, cat. no. 82024–479)
Biorad TC20™ Automated Cell Counter (Biorad, cat. no. 1450102)
Cell Counting Kit, 30 dual-chambered slides with trypan blue (Biorad, cat. no. 1450003)
6-well TC treated plates (VWR, cat. no.10062–892)
Echo Revolve microscope (Echo, cat. no. Revolve R4)
Eppendorf benchtop centrifuge 5425 (Eppendorf, cat.no. 2231000767)
Digital heat block (VWR, cat. no. 10753–536)
Branson Sonifier® SFX250 (Thomas Scientific, cat. no. 1182T56)
Vortex-Genie 2 (Scientific Industries, cat. no. SI-0236)
VWR® Tube Rotator (VWR, cat. no. 10136–084)
Mini-PROTEAN Tetra Vertical Electrophoresis starter kit (Biorad, cat. no. #1658025FC)
iBlot™ 2 (Thermo, cat. no. IB21001S)
Gel boxes (VWR, cat. no. 490016–642)
VWR® Variable Speed Rocker (VWR, cat. no. 75832–308)
Azure Imager C600 (Azure, cat. no. AC6001)
Protocol
Cell culture, transfection, and sample processing
-
1Split cultured confluent HEK 293T cells growing in a 15-cm dish in a cell incubator set to 37°C and 5% CO2 and count the cell number as follows:
- Remove cell media and add 5 mL of trypsin to the cells to detach. Wait 2–5 mins until fully detached.
- Add 5 mL of DMEM cell media, collect the cells into a 15 mL conical tube, and centrifuge the cells 1,000 × g for 3 mins.
- Remove the supernatant and fully resuspend cells in 10 mL of DMEM cell media.
- Take 20 μL of resuspended cells and mix with 20 μL of trypan blue. Add 15 μL of the cell/trypan blue mix to each side of a dual-chambered cell counting slide.
- Insert slide into the automated cell counter, repeat for the other side, and take the average of the cell count.
-
2
Prepare a diluted solution of HEK 293T cells to plate 1×10⁶ cells/well in a final volume of 2 mL of DMEM cell media into each well of a 6-well plate to achieve about a 70–90% confluence for transfection the next day.
Note: For the three samples in Table 1 below this means a solution mix of 3×10⁶ cells in a total volume of 6 mL of DMEM cell media. Then, 2 mL of this solution mix is added to each individual well in a 6-well plate for a total of 3 wells. This amount can be scaled up for additional replicates or to include samples from Basic Protocol 2 or Alternative Protocol 1.
-
3
Incubate the cells in a cell incubator set to 37°C and 5% CO2 until cell confluency is about 70–90%. This is typically checked using the Echo Revolve microscope 18–24 hrs after plating, though any standard TC microscope should work.
-
4When cells are 70–90% confluent, prepare a TransIT-Opti-MEM-DNA transfection mix for the three samples in Table 1 below as follows:
- Place three 1.5 mL microcentrifuge tubes in a rack and label them 1–3.
- Add the indicated μg of DNA in the table below to their respective tubes.
- Prepare a TransIT-Opti-MEM master mix. For three samples this will be a 3.5X master mix solution or 7 μL of TransIT + 700 μL of Opti-MEM. Note: manufacturer’s instructions suggest 1 μL of TransIT/μg of DNA and 200 μL of Opti-MEM/well of a 6-well plate. When preparing master mixes, we add an extra 0.5X of the total number of samples to account for pipetting variability.
- Add 200 μL of the TransIT-Opti-MEM master mix to each of the tubes containing the DNA.
- Incubate samples for 15 mins at 21°C.
- After incubation, add the TransIT-Opti-MEM-DNA mix to the respective well in the 6-well plate in a dropwise circular motion.
-
5
Incubate the cells from step 4 for 48 hrs in a cell incubator set to 37°C and 5% CO2.
-
6
After 48 hrs, remove media from the cells in step 5 and add 1 mL of trypsin/well to the cells to detach. Wait 2–5 mins until fully detached.
-
7
Label three 1.5 mL microcentrifuge tubes with the sample number 1–3 and place in a rack, then collect the cells from each of the wells from the trypsinized cells from step 6 into their respectively labeled tube. Then, add 400 μL of 1X PBS to each well to collect the remaining cells for each sample.
-
8
Centrifuge the cells from step 7 for 1 min 1,000 × g and remove the supernatant without disturbing the cell pellet.
-
9
Add 1 mL of 1X PBS to wash the pelleted cells from step 8, centrifuge for 1 min 1,000 × g, and remove the supernatant.
-
10
Add 150 μL of 2% SDS + 1X PBS + 50 μM PUGNAc + 1X protease inhibitors to the pelleted cells from step 9.
Note: Although the cells are lysed in 2% SDS + 1X PBS in this protocol, we have found other lysis buffers (M-PER, RIPA, etc) are also compatible as long as the detergent concentration is < 0.2% during the bead incubation step. For cells lysed in 2% SDS we heat the cells in step 11 in order to reduce the viscosity from the samples after sonication. Heating is not required for other lysis buffers.
-
11
Place the cells from step 10 in a heat block set at 95°C for 5 mins.
-
12
Sonicate the cells from step 11 for 10 secs at 10% amplitude.
-
13
Cell debris from the sonicated samples in step 12 are pelleted by centrifugation for 5 mins 21,150 × g.
-
14
145 μL of each of the sonicated cell lysate samples from step 13 is transferred to a clean 1.5 mL microcentrifuge tubes and labeled with the corresponding sample number 1–3.
-
15
A BCA assay is performed according to the manufacturer’s instructions to determine the protein concentration. Note: Typically, we observe between 2–4 μg/μL from a sample obtained from a single well in a 6-well plate.
-
16
Protein concentration of the samples from step 14 is normalized to 2.5 μg/μL with 2% SDS + 1X PBS.
Table 1:
Number of wells and DNA amounts can be scaled up accordingly for additional replicates or material.
| Nanobody-OGT | μg | |||
|---|---|---|---|---|
| #1 | #2 | #3 | ||
| Target protein | pcDNA3.1-GFP-Flag-JunB-EPEA | 1 | 1 | 1 |
| pcDNA3.1-empty vector | 1 | |||
| Active nanobody-OGT | pcDNA3.1-HA-nLag6-(EAAAK)4-OGT(4) | 1 | ||
| Inactive nanobody-OGT | pcDNA3.1-HA-nLag6-(EAAAK)4-OGT(4,K852A) | 1 | ||
C-Tag bead incubation
-
17
Two 1.5 mL microcentrifuge tubes per sample from step 16 are labeled with the corresponding sample number 1–3 and separated into two racks [three tubes for the cell lysate input rack and three tubes for the immunoprecipitation (IP) rack]
-
18
40 μL (100 μg) of each sample from step 16 is transferred to the correspondingly labeled tube in the cell lysate input and IP racks from step 17. 10 μL of 5X BME is added to each tube in the cell lysate input rack.
-
1940 μL/sample (20 μL bead volume) of a 50% slurry of the C-Tag resin container is transferred to a 1.5 mL microcentrifuge tube and beads are washed once with 1X PBS to remove ethanol from beads. Washing steps are as follows:
- Beads are centrifuged for 1 min 1,000 × g to pellet beads.
- Supernatant is removed and 1 mL of 1X PBS is added to the beads.
- The sample is lightly vortexed and centrifuged for 1 min 1,000 × g to pellet the beads.
- Supernatant is removed and an equal volume of 1X PBS is added to the bead volume to create a 50% slurry (i.e., 40 μL of C-tag resin + 40 μL of 1X PBS)
-
20
The 50% slurry prepared in step 19 is lightly vortexed to mix the beads and then using a cut pipette tip, 40 μL of the 50% slurry is added to each of the tubes in the IP rack from step 18.
-
21
1 mL of 1X PBS is added to the protein-bead mixture samples from step 20 to dilute the SDS and samples are placed in the rotator at 21°C for 1 hr.
-
22The beads from the samples in step 21 are washed 4X with 1X PBS as follows:
- The samples are centrifuged for 1 min 1,000 × g to pellet the beads.
- Supernatant is removed and 1 mL of 1X PBS is added to the beads.
- The samples are allowed to rotate for 5 mins at 21°C.
- Steps a-c are repeated an additional 3 times for a total of 4 washes. In the final wash, completely remove the supernatant and place the beads in the IP rack.
-
23
Add 50 μL of 1X BME to the each of the samples in the IP rack from step 22d and lightly vortex the samples.
Western Blotting
-
24
All 50 μL of the three cell lysate input and three IP samples from steps 18 and 23 are heated at 95°C for 5 mins in a heat block.
-
25
Samples from step 24 are centrifuged 1 min 21,130 × g.
-
26
15 μL of a diluted molecular weight protein ladder (1 μL of protein ladder/10 μL of 1X BME) and 15 μL of each of the cell lysate and IP samples are individually loaded on separate wells of a 15-well 6–12% SDS-PAGE gel as depicted in the following Table 2. The gel was run at a 150 V for 1 hr at 21°C. Note: Representative data shown here are obtained on handcast gels and run on a Biorad system. Any standard protocol for handcasting gels should be sufficient for replication.
-
27
Following the instruction manual provided with the iBlot2 machine, the proteins in the gel from step 26 are transferred to a membrane using the P0 setting on the iBlot 2.
-
28
After the protein transfer from step 27, the membrane is transferred to a gel box and 5 mL of ponceau stain is added to verify successful transfer of the proteins. The ponceau stain is discarded and the membrane is briefly rinsed with DI water to remove excess ponceau stain. Then, the ponceau stained membrane is cut vertically between MW samples 5–6 and 10–11 to create the three membranes that will be blotted as indicated in the top row of Table 2 and below in step 31.
-
29
The cut membranes from step 28 are then transferred to individual gel boxes labeled with the sample type and antibody conditions indicated in the top row of Table 2. 5 mL of 1X TBST is added to each gel box and placed in the rocker for 5 mins at 21°C to remove the ponceau stain. The 1X TBST in the membranes is discarded.
-
30
The membranes from step 29 are blocked by adding 5 mL of 3% BSA + 1X TBST. The gel boxes are placed in a rocker for 1 hr at 21°C.
-
31
The blocking buffer added in step 30 is discarded from the gel boxes and the membranes are rinsed with DI water briefly.
-
32
5 mL of diluted primary antibody solutions prepared in 3% BSA + 1X TBST were made as indicated below for each membrane. The 5 mL of diluted primary antibody solution was added to the corresponding membrane from step 31 and incubated in a rocker for 1 hr at 21°C.
Cell lysate membrane 1- HA-Tag (C29F4) Rabbit mAb (Cell signaling; dilution 1:1,000)- For detection of transfected HA-tagged nanobody-OGT.
- Flag (M2) Mouse mAb (Sigma; dilution 1:5,000)- For detection of transfected Flag tagged GFP-Flag-JunB-EPEA
Cell lysate membrane 2- Tubulin Rabbit mAb (Cell signaling, dilution 1:1,000)- As a control for protein loading control
- O-GlcNAc RL2 Mouse mAb (Abcam; dilution 1:1,000)- As a control to observe global changes in O-GlcNAc from transfected nanobody-OGT constructs.
IP membrane- Flag Rabbit mAb (Cell signaling; dilution 1:1,000)- For detection of transfected Flag tagged GFP-Flag-JunB-EPEA from the C-tag enrichment
-
O-GlcNAc RL2 Mouse mAb (Abcam; dilution 1:1,000)- For detection of levels of O-GlcNAc in the enriched GFP-Flag-JunB-EPEANote: If an IR imager such as the Azure or Li-cor is available for multiplex western blotting, incubation of 1° Abs from different species can be performed simultaneously [i.e., HA (Rabbit) and Flag (Mouse)] for cell lysate input and IP membranes.
-
33
The primary antibody mix added in step 32 is discarded or can be transferred to a labeled 15-mL conical tube for storage and later reuse. Note: the primary antibody mix is stored at 4 °C and reusable at least 2X within a 2-week timeframe.
-
34
The membranes from step 33 are washed by adding 10 mL of 1X TBST, placing the membranes in a rocker at 21°C for 5 mins, discarding the wash buffer, and repeating these steps for a total of three times.
-
35
The washed membranes from step 34 are each incubated with 5 mL of diluted secondary infrared (IR) antibodies prepared in 3% BSA + 1X TBST as indicated below and placed in a rocker for 1 hr at 21°C.
Can combine for multiplex IR imaging- anti-Mouse IR-800CW (Li-cor; dilution 1:10,000)
- anti-Rabbit IR-680RD (Li-cor; dilution 1:10,000)
-
36
The secondary antibody mix added in step 35 is discarded, and the membranes are washed by adding 10 mL of 1X TBST, placing the membranes in a rocker at 21°C for 5 mins, discarding the wash buffer, and repeating these steps for a total of three times.
-
37
Results are developed by IR imaging under automatic exposure settings in the Azure imager. Images are converted to grayscale using the Azure and representative results can be seen in Figure 2.
Table 2:
MW-Diluted molecular weight ladder (1 μL of protein ladder/10 μL of 1X BME). 1–3 are the sample numbers from Table 1.
| Cell lysate: HA/Flag (M2) | Cell lysate: O-GlcNAc/Tubulin | IP: O-GlcNAc/Flag | ||||||||||||
|---|---|---|---|---|---|---|---|---|---|---|---|---|---|---|
| 1 | 2 | 3 | 4 | 5 | 6 | 7 | 8 | 9 | 10 | 11 | 12 | 13 | 14 | 15 |
| MW | 1 | 2 | 3 | MW | MW | 1 | 2 | 3 | MW | MW | 1 | 2 | 3 | MW |
Basic Protocol 2
Target protein deglycosylation of Nup62 using nanobody-splitOGA
In Basic Protocol 2, we describe a representative protocol for use of nanobody-splitOGA (Ge et al. 2021). The representative protocol uses nLag6 fused to split-OGA for targeted deglycosylation of GFP-Flag-Nup62-EPEA as the target protein in HEK293T cells. The following protocol is largely analogous to the Basic Protocol 1 with the addition of new reagents and slight modifications. Catalytically inactive nLag6-splitOGA is used as a negative control. As above, the method is generalizable to additional nanobody-tag pairs, target proteins, and cell lines.
Materials
Reagents
pcDNA3.1-GFP-Flag-Nup62-EPEA (Addgene, cat. No. 168101)
pcDNA3.1-empty vector (Invitrogen, cat. No. V79020)
pcDNA3.1-myc-OGA(1–400) (Addgene, cat. No. 168095)
pcDNA3.1-myc-OGA(1–400, D174N) (Addgene, cat. No. 168097)
pcDNA3.1-HA-nLag6-(EAAAK)4-OGA(544–706) (Addgene, cat. No. 168190)
Myc-tag (9B11) Mouse mAb (Cell signaling, cat. No. 2276S)
GAPDH (D16H11) XP® Rabbit mAb (Cell signaling, cat. No 5174S)
Protocol
Cell culture, transfection, and sample processing
-
1
Conduct Basic Protocol 1 steps 1–3, then proceed to step 2 of the protocol below.
-
2When cells are 70–90% confluent, prepare a TransIT-Opti-MEM-DNA transfection mix for the three samples of Table 3 as follows:
- Place three 1.5 mL microcentrifuge tubes in a rack and label them 1–3.
- Add the indicated μg of DNA in the table below to their respective tubes.
- Prepare a TransIT-Opti-MEM master mix. For three samples this will be a 3.5X master mix solution or 10.5 μL of TransIT + 1,050 μL of Opti-MEM. Note: manufacturer’s instructions suggest 1 μL of TransIT/μg of DNA and 200 μL of Opti-MEM/well of a 6-well plate. When preparing master mixes, we add an extra 0.5X of the total number of samples to account for pipetting variability.
- Add 200 μL of the TransIT-Opti-MEM master mix to each of the tubes containing the DNA.
- Incubate samples for 15 mins at 21°C.
- Add the TransIT-Opti-MEM-DNA mix to the respective well in the 6-well plate in a dropwise circular motion.
-
3
Continue with steps 5–25 from Basic Protocol 1, then proceed to the western blot section step 4 in the protocol below
Table 3:
Number of wells and DNA amounts can be scaled up accordingly for additional replicates or material.
| Nanobody-splitOGA | μg | |||
|---|---|---|---|---|
| #1 | #2 | #3 | ||
| Target protein | pcDNA3.1-GFP-Flag-Nup62-EPEA | 1 | 1 | 1 |
| pcDNA3.1-empty vector | 1.6 | |||
| Active OGA fragment | pcDNA3.1-myc-OGA(1–400) | 0.8 | ||
| Inactive OGA fragment | pcDNA3.1-myc-OGA(1–400, D174N) | 0.8 | ||
| nanobody-OGA fragment | pcDNA3.1-HA-nLag6-(EAAAK)4-OGA(544–706) | 0.8 | 0.8 | |
Western blot
-
4
15 μL of a diluted molecular weight protein ladder (1 μL of protein ladder/10 μL of 1X BME) and 15 μL of each of the cell lysate and IP samples are individually loaded on separate wells of a 15-well 6–12% SDS-PAGE gel as depicted in the following Table 4. The gel was run at a 150 V for 1 hr at 21°C. Note: Representative data shown here are obtained on handcast gels and run on a Biorad system. Any standard protocol for handcasting gels should be sufficient for replication.
-
5
Following the instruction manual provided with the iBlot2 machine, the proteins in the gel from step 4 are transferred to a membrane using the P0 setting on the iBlot 2.
-
6
After the protein transfer from step 5, the membrane is transferred to a gel box and 5 mL of ponceau stain is added to verify successful transfer of the proteins. The ponceau stain is discarded and the membrane is briefly rinsed with DI water to remove excess ponceau stain. Then, the ponceau stained membrane is cut vertically between MW samples 5–6 and 10–11 to create the three membranes that will be blotted as indicated in the top row of Table 4 and below in step 9.
-
7
The cut membranes from step 6 are then transferred to individual gel boxes labeled with the sample type and antibody conditions indicated in the top row of Table 2. 5 mL of 1X TBST is added to each gel box and placed in the rocker for 5 mins at 21°C to remove the ponceau stain.
-
8
The 1X TBST added to the membranes in step 7 is discarded and the membranes are blocked by adding 5 mL of 3% BSA + 1X TBST. The gel boxes are placed in a rocker for 1 hr at 21°C.
-
9
The blocking buffer added in step 8 is discarded from the gel boxes and the membranes are rinsed with DI water briefly.
-
10
5 mL of diluted primary antibody solutions prepared in 3% BSA + 1X TBST were made as indicated below for each membrane. The 5 mL of diluted primary antibody solution was added to the corresponding membrane from step 9 and incubated in a rocker for 1 hr at 21°C.
Cell lysate membrane 1- HA-Tag (C29F4) Rabbit mAb (Cell signaling; dilution 1:1,000)- For detection of transfected HA-tagged nanobody-OGA(544–706) stalk domain.
- Flag (M2) Mouse mAb (Sigma; dilution 1:5,000)- For detection of transfected Flag tagged GFP-Flag-Nup62-EPEA
Cell lysate membrane 2- Myc-tag (9B11) Mouse mAb (Cell signaling, dilution 1:1,000)- For detection of transfected Myc-tagged catalytic OGA(1–400) domain and catalytically inactive OGA(1–400, D174N).
- GAPDH (D16H11) XP® Rabbit mAb (Cell signaling, dilution 1:1,000)- As a control for protein loading control
Cell lysate membrane 3- O-GlcNAc RL2 Mouse mAb (Abcam; dilution 1:1,000)- As a control to observe global changes in O-GlcNAc from transfected OGA constructs
- GAPDH (D16H11) XP® Rabbit mAb (Cell signaling, dilution 1:1,000)- As a control for protein loading control
IP membrane- Flag Rabbit mAb (Cell signaling; dilution 1:1,000)- For detection of transfected Flag tagged GFP-Flag-JunB-EPEA from the C-tag enrichment
-
O-GlcNAc RL2 Mouse mAb (Abcam; dilution 1:1,000)- For detection of levels of O-GlcNAc in the enriched GFP-Flag-JunB-EPEANote: If an IR imager such as the Azure or Li-cor is available for multiplex western blotting, incubation of 1° Abs from different species can be performed simultaneously [i.e., HA (Rabbit) and Flag (Mouse)] for cell lysate input and IP membranes.
-
11
The primary antibody mix added in step 10 is discarded or can be transferred to a labeled 15-mL conical tube for storage and later reuse. Note: the primary antibody mix is stored at 4 °C and reusable at least 2X within a 2-week timeframe.
-
12
The membranes from step 11 are washed by adding 10 mL of 1X TBST, placing the membranes in a rocker at 21°C for 5 mins, discarding the wash buffer, and repeating these steps for a total of three times.
-
13
The washed membranes from step 12 are each incubated with 5 mL of diluted secondary infrared (IR) antibodies prepared in 3% BSA + 1X TBST as indicated below and placed in a rocker for 1 hr at 21°C.
Can combine for multiplex IR imaging- anti-Mouse IR-800CW (Li-cor; dilution 1:10,000)
- anti-Rabbit IR-680RD (Li-cor; dilution 1:10,000)
-
14
The secondary antibody mix added in step 13 is discarded, and the membranes are washed by adding 10 mL of 1X TBST, placing the membranes in a rocker at 21°C for 5 mins, discarding the wash buffer, and repeating these steps for a total of three times.
-
15
Results are developed by IR imaging under automatic exposure settings in the Azure imager. Images are converted to grayscale using the Azure and representative results for the nanobody-OGA samples can be seen in Figure 3.
Table 4:
MW-Diluted molecular weight ladder (1 μL of protein ladder/10 μL of 1X BME). 1–3 are the sample numbers from Table 3.
| Cell lysate: HA/Flag (M2) | Cell lysate: Myc/GAPDH | Cell lysate: O-GlcNAc/GAPDH | ||||||||||||
|---|---|---|---|---|---|---|---|---|---|---|---|---|---|---|
| 1 | 2 | 3 | 4 | 5 | 6 | 7 | 8 | 9 | 10 | 11 | 12 | 13 | 14 | 15 |
| MW | 1 | 2 | 3 | MW | MW | 1 | 2 | 3 | MW | MW | 1 | 2 | 3 | MW |
Figure 3:
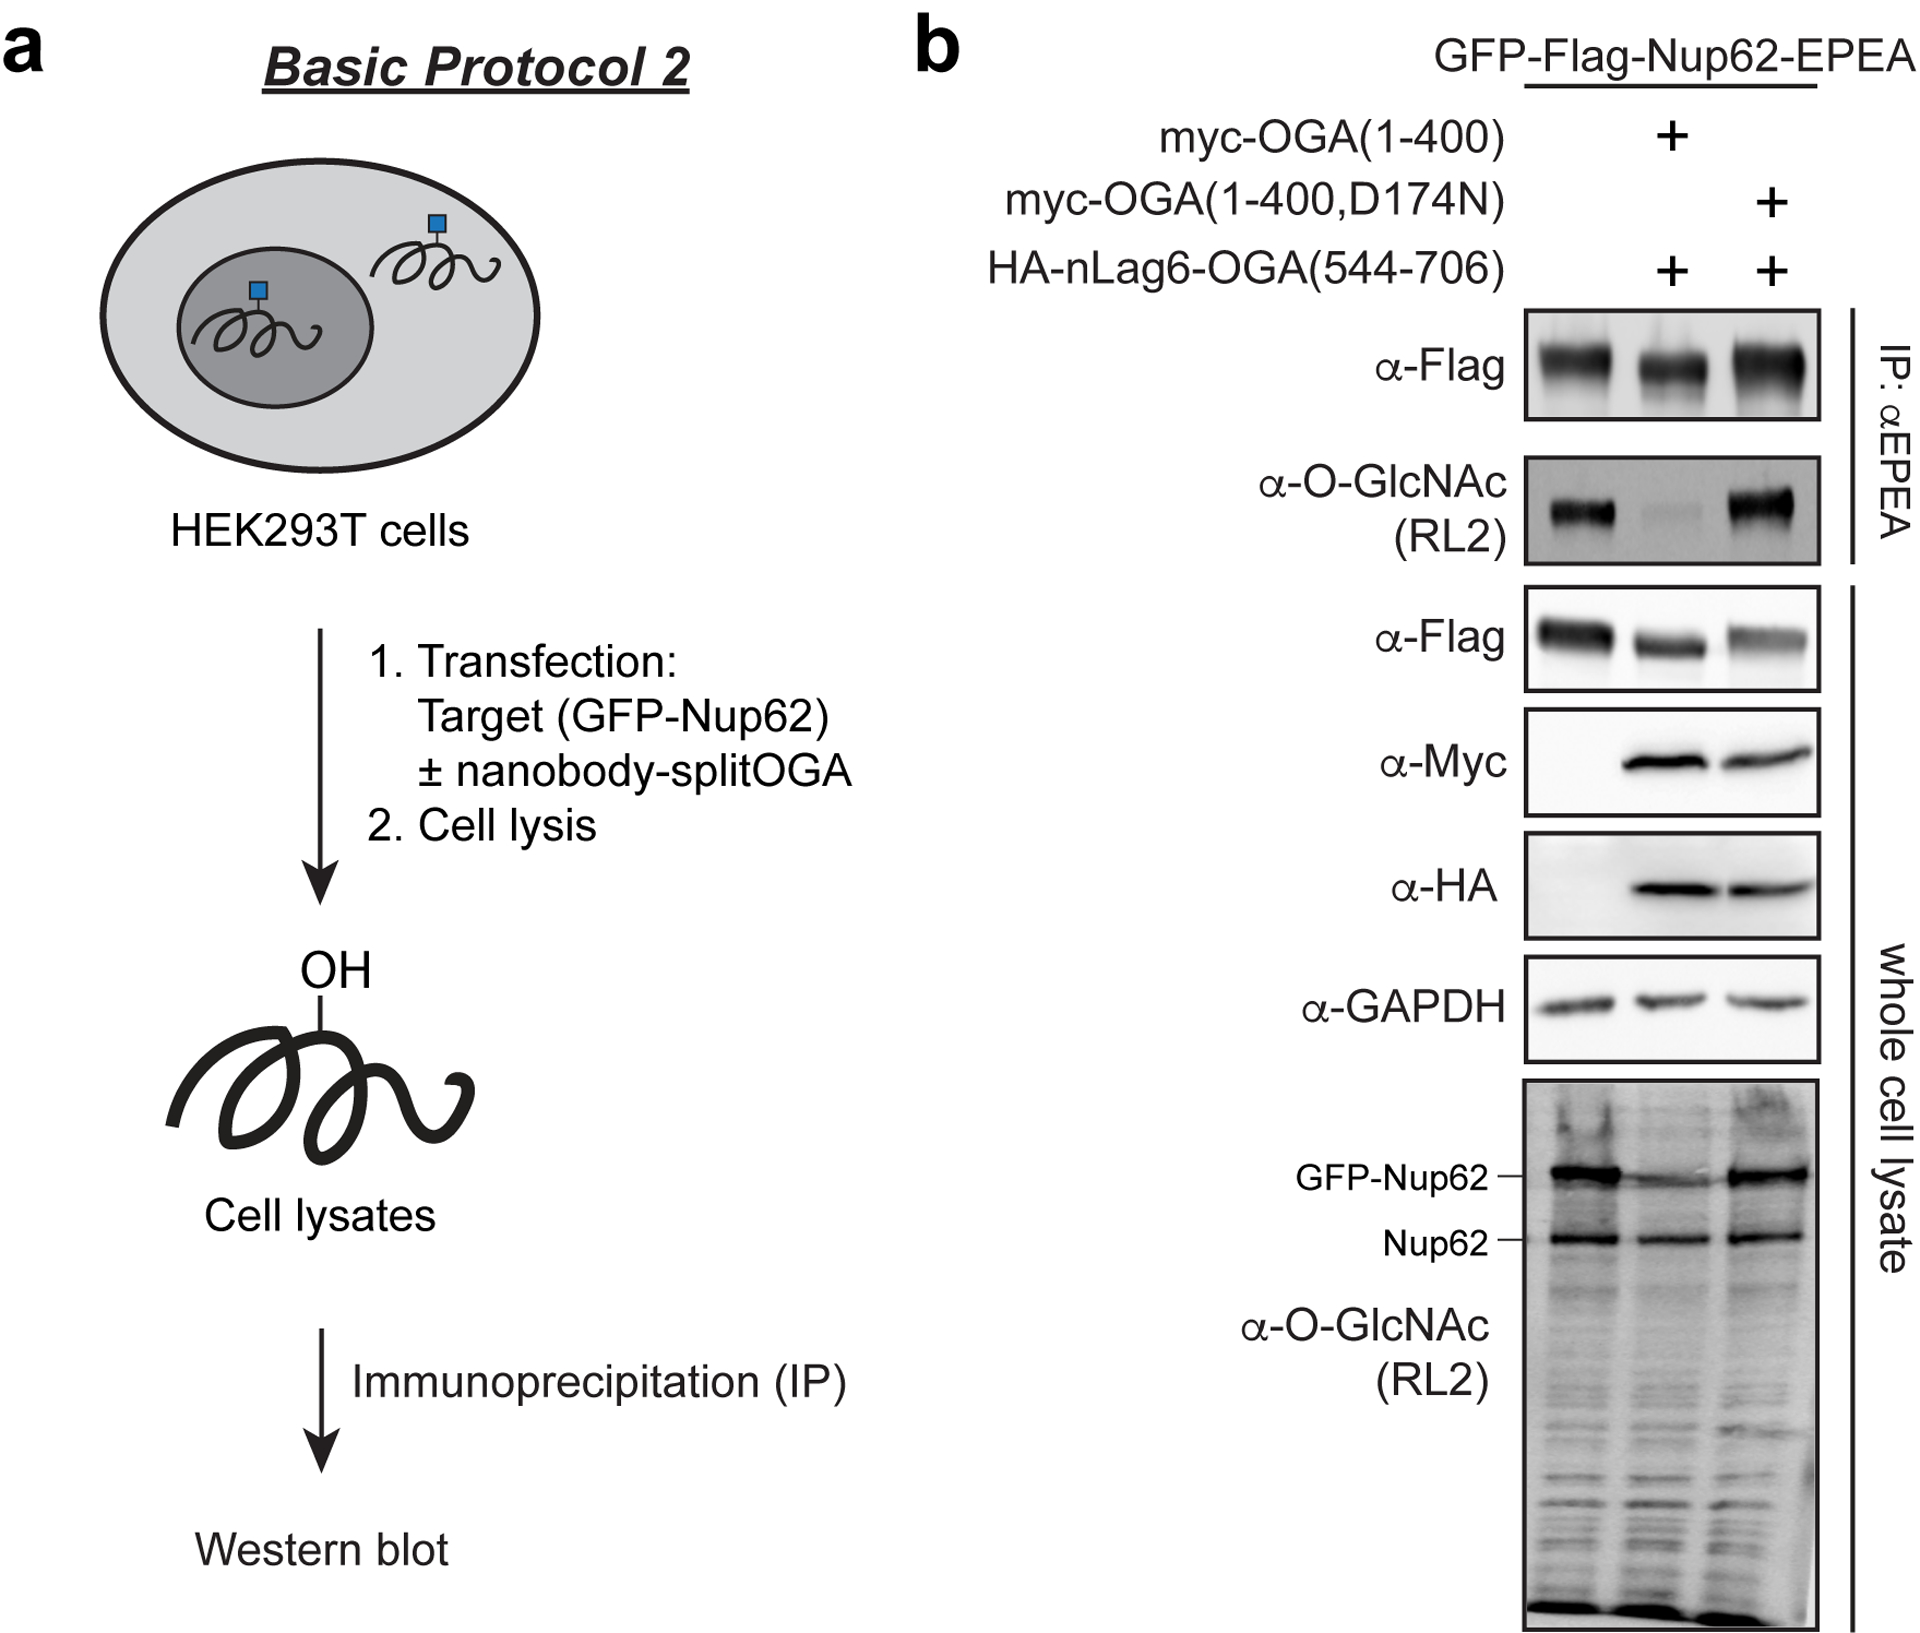
Basic Protocol 2 workflow (a) and representative data (b) for targeting of GFP-Nup62 with nanobody-splitOGA. HEK293T cells are first co-transfected with the target protein GFP-Nup62 and either nanobody-splitOGA or a catalytically inactive nanobody-splitOGA(D174N). Cell lysates are collected and GFP-Nup62 is immunoprecipitated using C-Tag beads. Captured proteins are then resolved by gel electrophoresis and blotted with antibodies for a western blot.
Alternative Protocol 1
Verification of the O-GlcNAc state of a tagged target protein through chemoenzymatic labeling
Basic Protocols 1 and 2 is sufficient to determine the O-GlcNAc state of a tagged target protein, however, O-GlcNAc antibodies do not universally recognize all O-GlcNAc proteins. Alternatively, chemoenzymatic labeling methods facilitate the enrichment of O-GlcNAcylated proteins independent of the protein backbone or provide the stoichiometry of O-GlcNAc residues in a protein (Rexach et al, 2010). Alternative Protocol 1 is adapted from (Darabedian et al. 2018) and uses the GalT1(Y298L) enzyme to label O-GlcNAc-modified residues with an azidosugar (GalNAz) for introduction of biotin or PEG groups through click chemistry (Figure 4).
Figure 4:
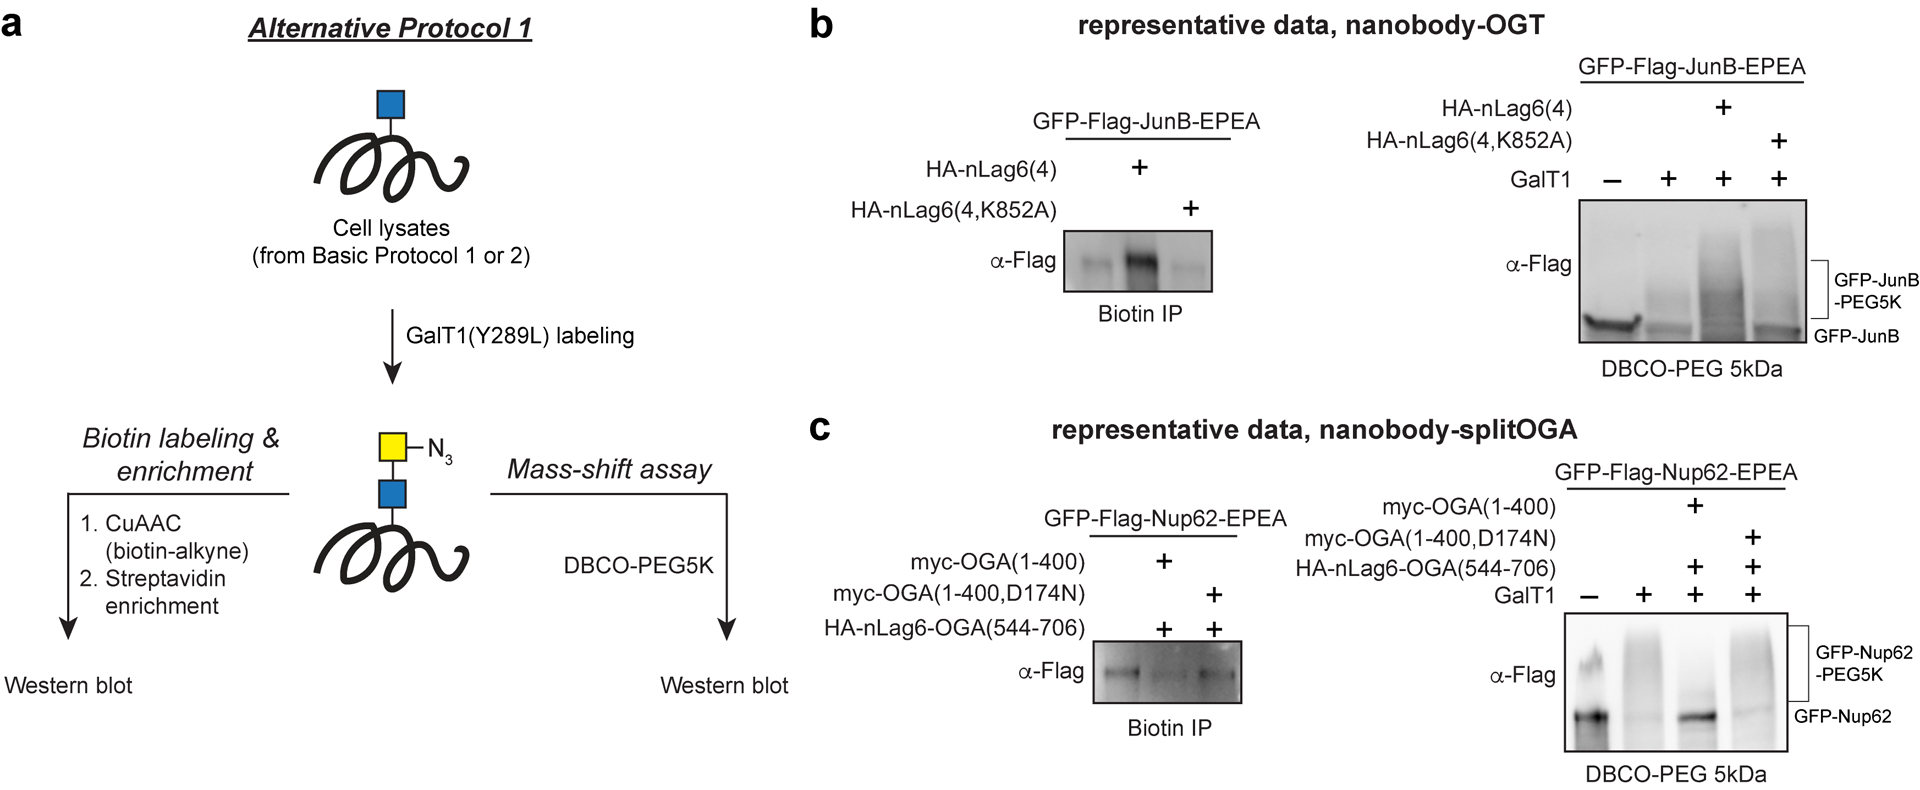
Alternative Protocol 1 workflow (a) and representative data (b, c) for target proteins GFP-JunB and GFP-Nup62 with nanobody-OGT or nanobody-splitOGA. This protocol begins after the transfection and cell lysate collection steps from Basic Protocols 1 & 2. The cell lysates are labeled in a GalT1 reaction to attach GalNAz and samples are then split to perform either a biotin labeling and enrichment or a PEG mass-shift assay. Samples are then resolved by gel electrophoresis and blotted with antibodies for a western blot to obtain the representative data shown at the bottom of the figure.
Materials
Reagents
Dithiothreitol [DTT (VWR, cat. No. 97061–340)]
Iodoacetamide (Sigma, cat. No. I1149–5G)
4X methanol/1X chloroform/3X water combined solution (Prepared in Reagents & Solutions section)
1% SDS + 20 mM HEPES pH 7.9 (Prepared in Reagents & Solutions section)
GalT1 Click-it kit (Thermo, cat. No. C33368)
10X PBS (VWR, cat. No. 101175–842)
Biotin-alkyne (Sigma, cat. No. 764213–10MG)
Sodium ascorbate (Sigma, cat. No. A7631–25G)
CuSO4 (Sigma, cat. No. 209198–100G)
THPTA (Sigma, cat. No. 762342–100MG)
Streptavidin agarose (Thermo, cat. No. 20359)
1% SDS + 1X PBS (Prepared in Reagents & Solutions section)
0.2% SDS + 1X PBS (Prepared in Reagents & Solutions section)
5kDa DBCO-PEG (Click Chemistry Tools, cat. No. A118–1000)
Flag-Tag (M2) (Sigma, cat. No. F2165–1MG)
Anti-Mouse IR-800CW (Li-cor, cat. No. 925–32210)
Anti-biotin IR-800CW (Li-cor, cat. No. 926–32230)
Equipment
Stir plate (VWR, cat. No. 10153–304)
Protocol
-
1
If conducting nanobody-OGT studies, then cell lysate samples from Basic Protocol 1 step 12 can be used for the following protocol by continuing to step 2 of the Reduction & Alkylation section described below. If conducting nanobody-OGA studies, HEK 293T cells should first be processed following steps 1–2 of Basic Protocol 2. Then steps 5–12 of Basic Protocol 1 should be followed to obtain cell lysate samples to use for the following protocol starting at step 2 of the Reduction and Alkylation section described below. The protocol hereafter is identical for both nanobody-OGT/OGA samples.
Reduction & Alkylation
-
2
Add 4 μL of 1 M DTT for a final concentration of ~25 mM to 150 μL of the samples from step 1 of Alternative Protocol 1.
-
3
The samples from step 2 are placed in the heat block at 95°C for 5 mins.
-
4
The samples from step 3 are returned to room temperature and 8 μL of 1 M iodoacetamide for a final concentration of ~50 mM is added to the samples from step 3.
-
5
The samples from step 4 are rotated in the dark at 21°C for 1 hr.
-
6
Place the methanol/chloroform/water combined solution with the stir bar on a stir plate.
-
7
500 μL of the methanol/chloroform/water combined solution is added to precipitate the proteins from samples in step 5.
-
8
The samples from step 7 are then vortexed and centrifuged for 5 mins 10,000 × g.
-
9
The upper aqueous layer is removed from samples in step 8, 500 μL of methanol is added to the organic layer, and the samples are briefly vortexed to mix.
-
10
Samples from step 9 are centrifuged for 1 min at 10,000 × g, supernatant is removed, and samples are allowed to air dry for 5 mins.
-
11
150 μL of 1% SDS + 20 mM HEPES pH 7.9 is added to the dry samples from step 10 and are then resuspended by sonication one time 5 secs on 10% amplitude. Continue sonicating if sample is not fully resuspended.
-
12
A BCA assay is performed for samples in step 11 according to the manufacturer’s instructions, and the protein concentration for each sample from step 11 is adjusted to 2.5 μg/μL with 1% SDS + 20 mM HEPES pH 7.9.
-
13
100 μg of protein is a starting point per biotin or PEG labeling reaction; however, protein amounts can be scaled according to the target protein abundance.
GalT1(Y289L) labeling reaction
-
14
The following components in Table 6 are added to the protein solution from step 12. Two reactions per sample from step 12 can be performed to allow a biotin labeling reaction and enrichment starting at step 20 and a PEG labeling reaction starting at step 29. Include an additional negative control from sample 1 step 12 of Alternative Protocol 1 which is the transfected GFP-Flag-JunB-EPEA if doing the nanobody-OGT samples from Basic Protocol 1 or GFP-Flag-Nup62-EPEA if doing the nanobody-OGA samples from Basic Protocol 2. This negative control will be used to identify PEG bands that arise from background labeling from the PEG reaction. This negative control will be labeled as sample number 0.
-
15
Proteins from the samples of step 14 are precipitated by adding 1 mL of the methanol/chloroform/water solution, vortexing, and centrifuging for 5 mins 10,000 × g.
-
16
Upper aqueous layer is removed from samples in step 15, 500 μL of methanol is added to the organic layer, and samples are vortexed.
-
17
Samples from step 16 are centrifuged for 2 min at 10,000 × g, supernatant is removed, and samples are allowed to air dry for 5 mins.
-
18
50 μL of 1% SDS + 1X PBS is added to the dry samples from step 17 and the samples are resuspended by sonication one time 5 secs on 10% amplitude. Continue sonicating if the samples are not fully resuspended.
-
19
If performing a biotin labeling and enrichment, then proceed with step 20 of the following part of the protocol for the samples in step 18. Otherwise, skip to step 29 of the PEG labeling part of the protocol for the samples in step 18.
Note: The biotin labeling and enrichment step is usually performed when differences in O-GlcNAc of a target protein are not apparent from Basic Protocols 1 and 2. This procedure is also performed as an orthogonal recognition to O-GlcNAc antibodies due to the protein bias of O-GlcNAc antibodies like RL2. The PEG labeling procedure is performed to determine the relative number of O-GlcNAc motifs present in the target protein and to quantify the percentage of modified to unmodified target protein.
Table 6.
The mixture was incubated with rotation at 4°C for 18 hrs
| Reaction components | Volume 1X (μL) | Final Concentration |
|---|---|---|
| Protein samples (2.5 μg/μL) from step 12 | 40 | 100 μg |
| H2O | 49 | |
| 2.5X GalT1 labeling buffer | 80 | 1X |
| 100 mM MnCl2 | 11 | 5.5 mM |
| 0.5 mM UDP-GalNAz | 10 | 0.025 mM |
| GalT1(Y289L) | 10 | |
| Final volume | 200 |
Biotin labeling and biotin pull-down
-
20
The following components are added to the protein solution from step 18:
-
21
Proteins from the samples of step 20 are precipitated by adding 1 mL of the methanol/chloroform/water combined solution, mixing, and centrifuging for 5 mins 10,000 × g.
-
22
Upper aqueous layer is removed from samples in step 21 and 1 mL of methanol is added to the organic layer and mixed.
-
23
Samples in step 22 are centrifuged for 1 min at 10,000 × g, supernatant is removed, and samples are air dried for 5 mins
-
24
100 μL of 2% SDS+ 1X PBS is added to the dry samples from step 23.
-
25
Samples from step 24 are fully resuspended by sonication 5 secs 10% amplitude. Continue sonicating if sample is not fully resuspended.
-
26
40 μL of a 50% slurry of streptavidin beads and 1 mL of 1X PBS is added to each of the samples in step 25 and incubated for 1 hr at 21°C in a rotator.
-
27Samples from step 26 are centrifuged 1 min 1,000 × g to pellet beads, supernatant is removed, and beads are washed as follows:
- Add 1 mL of 0.2% SDS + 1X PBS to the beads.
- Incubate for 5 mins at 21°C in a rotator
- Centrifuge samples to pellet beads 1 min 1,000 × g
- Remove supernatant from beads
- Repeat steps a-d for a total of 5 washes.
- Completely remove the supernatant in the final wash step to leave only the beads.
-
28
Add 50 μL of 1X BME to the beads in the samples from step 27f.
DBCO-PEG5K Reaction
-
29
Protein samples from step 18 of the Alternative Protocol 1 are labeled with DBCO-PEG5K as follows:
-
30
5.5 μL of 10 mM DBCO-PEG is added to each of the samples from step 29 for a final concentration ~1 mM and mixed by pipetting.
-
31
The samples from step 30 are allowed to react by placing them in a heat block set at 95°C for 5 mins.
-
32
The proteins from the samples in step 31 are precipitated with 500 μL of the methanol/chloroform/water combined solution followed by vortexing.
-
33
Samples from step 32 are centrifuged at 10,000 × g for 5 mins and upper layer is removed.
-
34
500 μL of methanol is added to the samples from step 33 and vortexed.
-
35
Samples from step 34 are centrifuged at 10,000 × g for 1 min to pellet proteins, supernatant is removed, and samples are air dried for 5 mins.
-
36
40 μL of 1% SDS + 1X PBS is added to the dry samples in step 35 and the samples are sonicated 5 secs on 10% amplitude
-
37
10 μL of 5X BME is added to the resuspended samples from step 36.
Western blotting
-
38
All 50 μL of the biotin IP and PEG labeled samples from steps 28 and 37 are heated at 95°C for 5 mins in a heat block.
-
39
Samples are centrifuged 1 min 21,130 × g.
-
40
15 μL of a diluted molecular weight protein ladder (1 μL of protein ladder/10 μL of 1X BME) and 15 μL of each of the biotin IP and PEG samples are individually loaded on separate wells of a 15-well 6–12% SDS-PAGE gel as depicted in the following Table 8. Note: We make handcasted gels using the provided casting accessories provided in the Biorad starter kit but any standard protocol for handcasting gels should be sufficient.
-
41
Following the instruction manual provided with the iBlot2 machine, the proteins in the gel from step 40 are transferred to a membrane using the P0 setting on the iBlot 2.
-
42
After the protein transfer from step 41, the membrane is transferred to a gel box and 5 mL of ponceau stain is added to verify successful transfer of the proteins. The ponceau stain is discarded and the membrane is briefly rinsed with DI water to remove excess ponceau stain. Then, the ponceau stained membrane is cut vertically between MW samples 5–6 to create the two membranes that will be blotted as indicated in the top row of Table 8 and below in step 46.
-
43
The cut membranes from step 42 are then transferred to individual gel boxes labeled with the sample type and antibody conditions indicated in the top row of Table 8. 5 mL of 1X TBST is added to each gel box and placed in the rocker for 5 mins at 21°C to remove the ponceau stain.
-
44
The 1X TBST added to the membranes in step 43 is discarded and the membranes are blocked by adding 5 mL of 3% BSA + 1X TBST. The gel boxes are placed in a rocker for 1 hr at 21°C.
-
45
The blocking buffer added in step 44 is discarded from the gel boxes and the membranes are rinsed with DI water briefly.
-
46
5 mL of diluted primary antibody solutions prepared in 3% BSA + 1X TBST were made as indicated below for each membrane. The 5 mL of diluted primary antibody solution was added to the corresponding membrane from step 45 and incubated in a rocker for 1 hr at 21°C.
Biotin IP & PEG labeled membranes- Flag (M2) Mouse mAb (Sigma; dilution 1:5,000)- For detection of transfected Flag tagged GFP-Flag-JunB-EPEA or GFP-Flag-Nup62-EPEA from the biotin enrichment or PEG labeling
-
47
The primary antibody mix added in step 46 is discarded or can be transferred to a labeled 15-mL conical tube for storage and later reuse. Note: the primary antibody mix is stored at 4 °C and reusable at least 2X within a 2-week timeframe.
-
48
The membranes from step 47 are washed by adding 10 mL of 1X TBST, placing the membranes in a rocker at 21°C for 5 mins, discarding the wash buffer, and repeating these steps for a total of three times.
-
49
The washed membranes from step 48 are each incubated with 5 mL of diluted secondary infrared (IR) antibody prepared in 3% BSA + 1X TBST as indicated below and placed in a rocker for 1 hr at 21°C.
Biotin IP membrane & PEG labeled membrane- anti-Mouse IR-800CW (Li-cor; dilution 1:10,000)
-
50
The secondary antibody mix added in step 49 is discarded, and the membranes are washed by adding 10 mL of 1X TBST, placing the membranes in a rocker at 21°C for 5 mins, discarding the wash buffer, and repeating these steps for a total of three times.
-
51
Results are developed by IR imaging under automatic exposure settings in the Azure imager. Images are converted to grayscale using the Azure and representative results can be seen in Figure 4.
Table 8:
MW-Diluted molecular weight ladder (1 μL of protein ladder/10 μL of 1X BME). 1–3 are the sample numbers from Table 1 or Table 3. Sample 0 is the negative PEG control from Table 6 step 14 of Alternative protocol 1.
| Biotin IP: Flag | PEG labeled samples: Flag | |||||||||
|---|---|---|---|---|---|---|---|---|---|---|
| 1 | 2 | 3 | 4 | 5 | 6 | 7 | 8 | 9 | 10 | 11 |
| MW | 1 | 2 | 3 | MW | MW | 0 | 1 | 2 | 3 | MW |
Support Protocol 1
Cloning of new nanobody-OGT/-splitOGA and target protein pairs
Support Protocol 1 describes adaptation of the protocols above to alternate nanobody-tag pairs and target proteins. The nanobody-OGT/-splitOGA constructs are modular, which allows for the exchange of different nanobodies, enzymes, or target protein constructs using a pair of restriction enzymes (Figure 5). To date, we have tested and validated the system using several nanobody-tag pairs on >20 target proteins (Ramirez et al., 2020; Ge et al., 2021; and unpublished results). We describe here an example cloning protocol using pcDNA3.1-Nup62-Flag-EPEA scaffold plasmid to insert the JunB gene to create the pcDNA3.1-JunB-Flag-EPEA plasmid. This protocol can be generalized to insert any target protein of interest. Additional nanobody fusion constructs and plasmid scaffolds can be obtained from Addgene.
Figure 5:
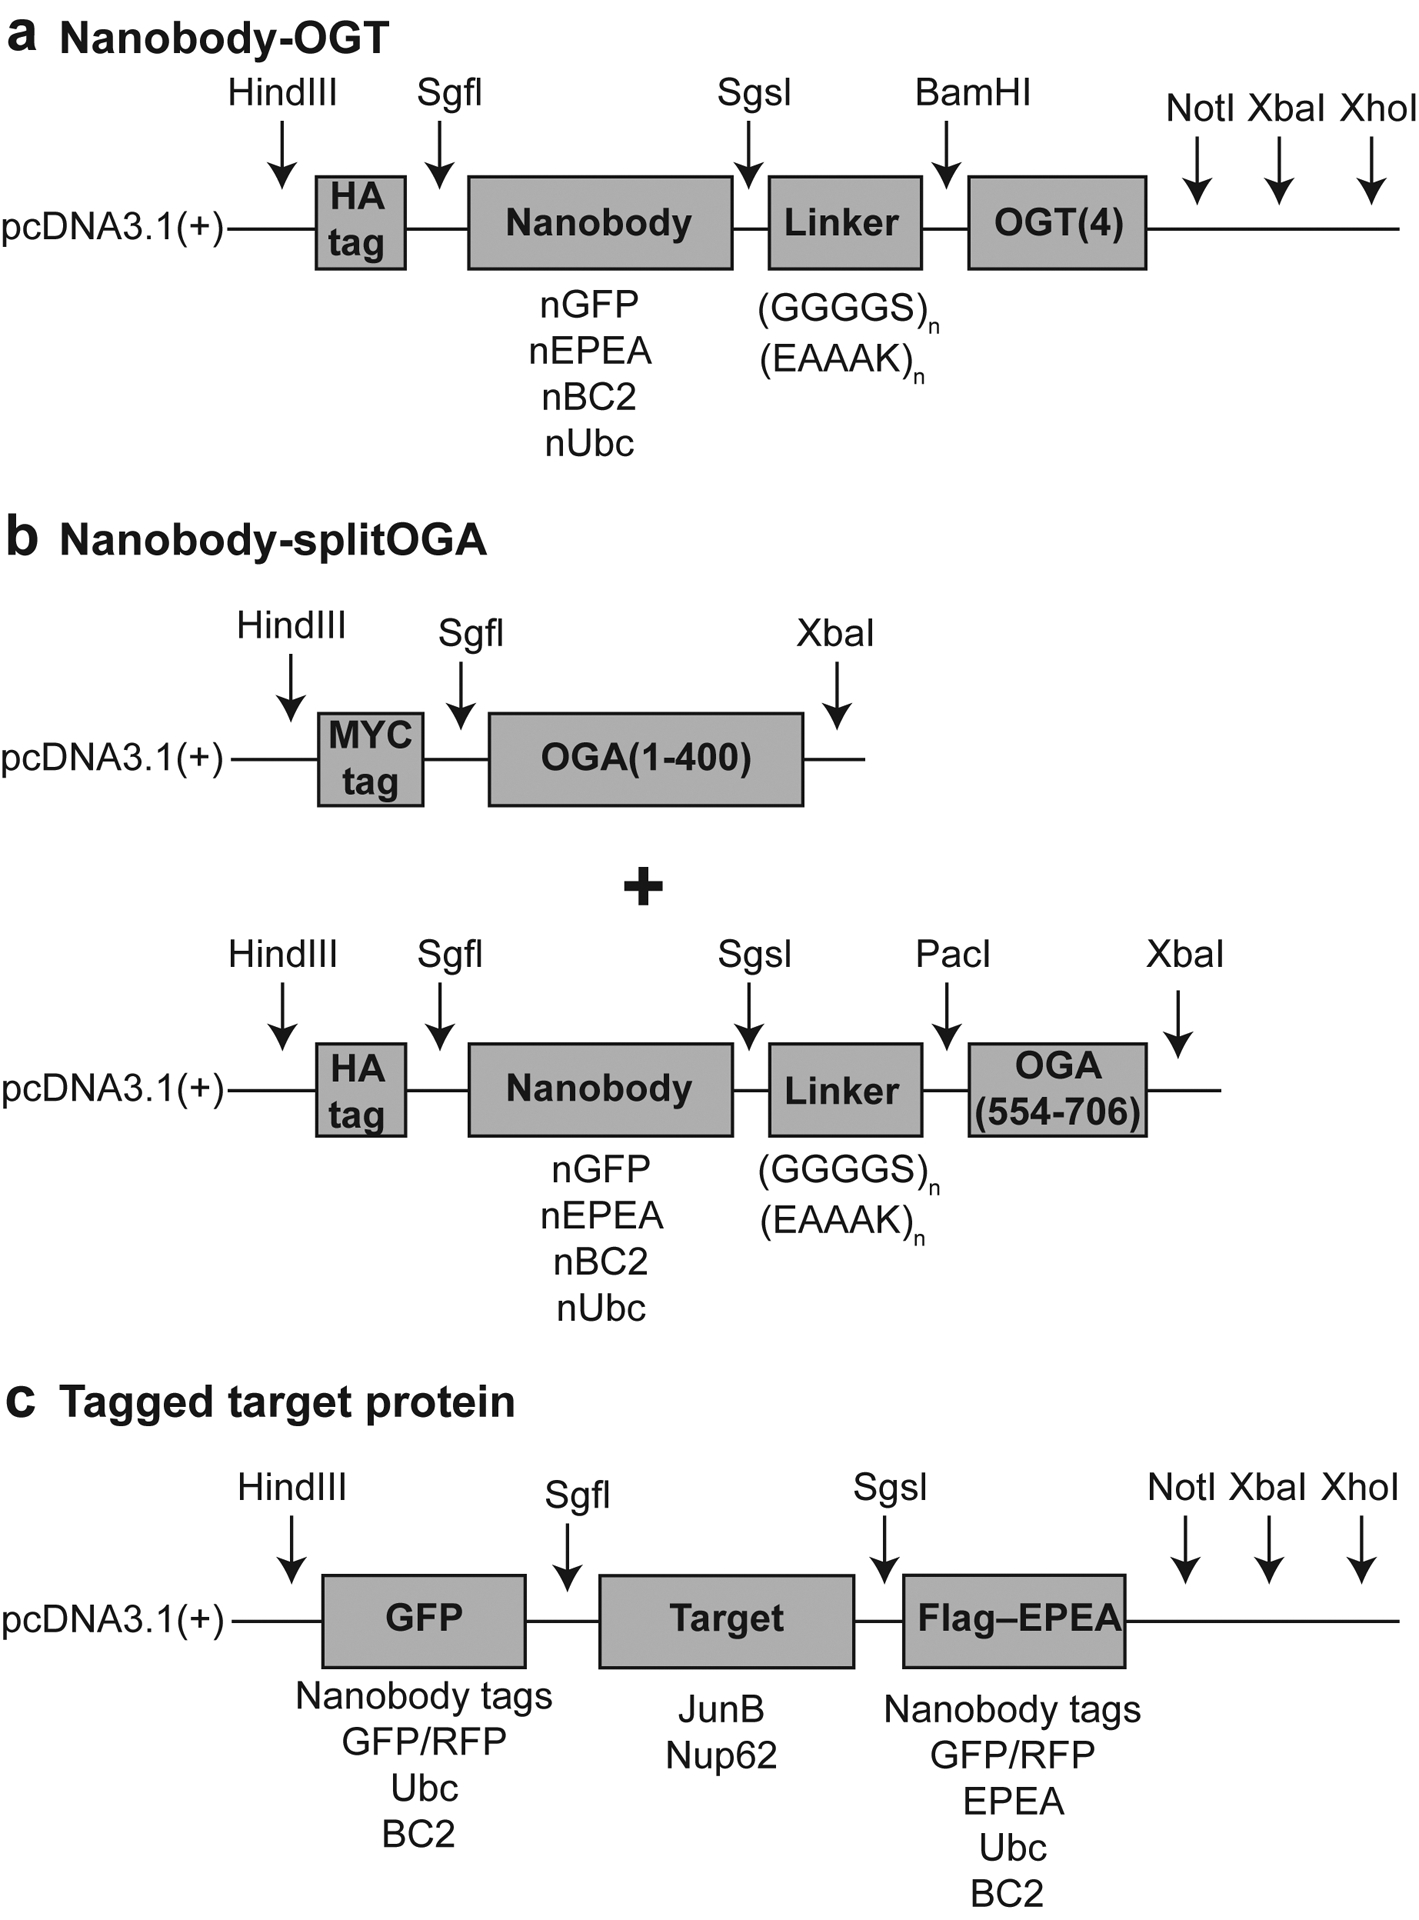
Example plasmid scaffold schematics for cloning with gene and restriction site annotations.
Materials
-
1
pcDNA3.1-GFP-Flag-JunB-EPEA (Addgene, cat. No. 160743)
-
2
pcDNA3.1-Nup62-Flag-EPEA (Addgene, cat. No. 160744)
-
3
Bacterial plates (VWR, 25384–342)
-
4
Bacterial culture tubes (VWR, 60818–725 (CS))
-
5
LB Agar Lennox (IBI scientific, cat. No. IB49120)
-
6
LB Lennox broth (IBI scientific, cat. No. IB49113)
-
7
LB media + 100 μg/mL ampicillin (Prepared in Reagents and Solutions section)
-
8
1X TE buffer (VWR, cat. No. 101171–430)
-
9
Molecular H2O (VWR, cat. No. 95043–416)
-
10
2X Q5 master mix (NEB, cat. No. M0492S)
-
11
Ultrapure agarose (Thermo, cat. No. 16500100)
-
12
UltraPure™ Ethidium Bromide, 10 mg/mL (Thermo, cat. No. 15585011)
-
13
Quick-Load® Purple 1 kb Plus DNA Ladder (NEB, cat. No. N0550L)
-
14
Monarch gel purification kit (NEB, cat. No. T1020L)
-
15
Razor blades (VWR, cat. No. 55411–050)
-
16
AsiSI (Sgfl) (NEB, cat. No. R0630L)
-
17
AscI (Sgsl) (NEB, cat. No. R0558L)
-
18
Cutsmart buffer (supplied with restriction enzymes from NEB)
-
19
T4 ligase (NEB, cat. No. M0202L)
-
20
MACH1 competent cells (Thermo, cat. No. C862003)
-
21
SOC media (Thermo, cat. No. 15544034)
-
22
Zymo miniprep kit (Zymo Research, cat. No. D4054)
Equipment
-
23
Bacterial plate incubator (VWR, cat. No. 89511–420)
-
24
Bacterial culture shaker (VWR, cat. No. 12620–942)
-
25
Nanodrop (Thermo, cat. No. ND-ONE-W)
-
26
Microwave (VWR, cat. No. 470309–418)
-
27
Sub-Cell GT Horizontal Electrophoresis Cell, 15 × 15 cm tray, with PowerPac Basic Power Supply and gel caster (Biorad, cat. no. 1640302)
-
28
T100™ Thermal Cycler (Biorad, cat. No. 1861096)
-
29
Safe Imager™ 2.0 Blue-Light Transilluminator (Thermo, cat. no. G6600)
Protocol
-
Order the pcDNA3.1-GFP-Flag-JunB-EPEA and pcDNA3.1-Nup62-Flag-EPEA plasmids from Addgene. While waiting for the plasmids to arrive you can skip to step 6 and order primers to amplify the JunB gene.
Note: In this step, the pcDNA3.1-GFP-Flag-JunB-EPEA plasmid can be replaced with a plasmid carrying your gene of interest.
When the bacterial stabs from Addgene arrive, pick around the Nup62 bacterial stab using a pipette tip and streak on an ampicillin plate. Repeat for the JunB bacterial stab and streak on a separate ampicillin plate. Place the plates in an incubator set to 37°C for 16 hrs.
Remove the two ampicillin plates from the incubator from step 3. Add 10 mL of LB + 100 μg/mL ampicillin media to two bacterial culture tubes, label with the plasmid name, and then pick a single colony from each plate to grow in the media for 16 hrs at 37°C in a shaker.
The next day, perform a miniprep of the two cultures using the Zymo miniprep kit by following the manufacturer’s instructions and eluting the samples in 50 μL of elution buffer.
Measure the DNA concentration of the miniprep plasmids using a nanodrop. Prepare a 1 ng/μL diluted working solution of the pcDNA3.1-GFP-Flag-JunB-EPEA plasmid using TE buffer. For example, if plasmid concentration is 200 ng/μL, then transfer 1 μL of the plasmid to a 1.5 mL microcentrifuge tube and then add 200 μL of TE buffer to create the 1 ng/μL diluted working solution.
- Order a JunB forward primer containing an Sgfl restriction enzyme overhang and a reverse primer containing an Sgsl restriction enzyme overhang. Example primers are as follows:
- Sgfl JunB fwd primer (Bold is Sgfl restriction site)- TGCGCGATCGCAATGTGCACTAAAATGGAACAGCCCTTC
- Sgsl JunB rev primer (Bold is Sgsl restriction site)-TAGTCTGGCGCGCCGAAGGCGTGTCCCTTGA
When primers from step 6 arrive, resuspend them in TE buffer to a final concentration of 100 μM. This will be your stock solution and can be stored at −20°C. Prepare a diluted working solution of 10 μM of both primers by transferring 10 μL of the 100 μM stock solution to a 1.5 mL microcentrifuge tube and then adding 90 μL of TE buffer.
-
Perform a PCR reaction as follows to amplify the JunB gene with the Sgfl and Sgsl restriction enzyme sites. After the PCR reaction is finished, add 10 μl of the 6X sample buffer solution to the PCR tube.
PCR cycling conditions- Denature: 95°C for 3 mins
- Denature: 95°C for 30 secs
- Anneal: 72°C for 20 secs
- Extend: 72°C for 3 mins
- Repeat: steps 2–4 35X times
- Final Extension: 72°C for 6 mins
- Hold at 6°C forever
- Prepare a 1% agarose gel to run the PCR reaction as follows:
- Measure 1 g of ultrapure agarose and add to a 250 mL bottle.
- Add 120 mL of 1X TAE buffer to the agarose in the 250 mL bottle.
- Microwave the solution on the high setting for 3 mins, stopping every 1 min to stir the solution. The 1X TAE buffer will evaporate leaving about 100 mL of solution.
- Let the solution cool until warm to the touch and then add 10 μL of ethidium bromide.
- Pour about 50 mL of the solution into a gel casting chamber, remove bubbles with a 8-well gel comb by raking the surface of the solution, and then insert the comb. Add additional solution if the wells on the gel comb are not completely covered by the agarose solution.
- Wait for the gel to solidify.
- Remove the gel comb from the solidified gel and place the gel with its casting stand in the electrophoresis machine.
Load 10 μl of the DNA ladder in the first well and 60 μL of the JunB PCR reaction from step 8 in the second well.
Run the agarose gel at 120 V for 20 mins.
Check for a successful PCR product by removing the gel with its casting stand from the electrophoresis machine and placing in the blue light transilluminator. The JunB PCR product should be around the ~1,000 bp marker.
Perform a gel excision of the PCR product from the gel by cutting around the PCR product with a razor blade and placing the cut gel fragment in a 1.5 mL microcentrifuge tube.
Gel purify the PCR fragment using the Monarch gel extraction kit by following the manufacturer’s instructions and elute the product in 15 μL.
Prepare to digest the PCR product from step 14 and the pcDNA3.1-Nup62-Flag-EPEA plasmid from step 5 by adding the indicated volumes of the reagents to 0.2 mL PCR tubes as indicated in the following table.
Run a gel and perform a gel excision purification to isolate the cut PCR and cut scaffold vector products as described in steps 9–14. The cut JunB PCR product is ~1,000 bp, the cut scaffold vector is ~5,400 bp. Elute the products in 15 μL.
Perform a ligation reaction of the digested products by adding the indicated volumes of the reagents to a 1.5 mL microcentrifuge tube as indicated in the following table.
To the 20 μL of the T4 DNA ligation from step 17 60 μL of MACH1 competent E. coli cells was added and the mix was incubated for 15 mins on ice
The ligation-cell mix from step 18 was heat shocked using a heat block set at 42°C for 45 secs.
The cells from step 19 are transferred to ice and 1 mL of SOC media is added under a flame
The cells from step 20 are allowed to grow in the 37°C shaker for 1 hr.
The cells from step 21 are centrifuged for 1 min at 1,000 × g.
900 μL of the supernatant from the sample in step 22 is discarded and the remaining volume is used to resuspend the pelleted bacterial cells.
The resuspended cells from step 23 are plated in ampicillin bacterial plates and left to grow for 16 hrs at 37°C.
Prepare three bacterial culture tubes, label them 1–3, and then add 10 mL of LB + 100 μg/mL ampicillin media. Pick one colony per bacterial culture tube from the bacterial plate from step 24 and grow for 16 hrs at 37°C in a shaker.
Prepare bacterial stocks of overnight cultures from step 25 by labeling three 1.5 mL microcentrifuge tubes 1–3. Add 500 μL of 50% glycerol to each of the tubes, then add 500 μL of the each of the bacterial cultures to their respective tubes. Invert the tubes by hand five times then place in a microcentrifuge rack and store in a −80 freezer.
Perform a miniprep of the three bacterial cultures from step 25 using the Zymo miniprep kit by following the manufacturer’s instructions and eluting the samples in 50 μL of elution buffer.
- Prepare to send samples for sequencing using your preferred sequencing provider. We request to sequence our samples using the T7 fwd and BGH rev sequencing primers by sending at least 1 μg of plasmid DNA.
- T7 fwd sequencing primer- TAATACGACTCACTATAGGG
- BGH rev sequencing primer- TAGAAGGCACAGTCGAGG
Check sequencing results from step 28. Discard any bacterial stocks that had the incorrect sequence.
Additional DNA can be obtained using the bacterial stocks made in step 26 that had the correct sequence by taking scrapings of the frozen bacterial stock with a pipette tip and growing in LB media cultures with ampicillin.
The newly developed pcDNA3.1-JunB-Flag-EPEA plasmid obtained from step 30 can now be tested with the EPEA nanobody-OGT/OGA fusions using the workflows from Basic Protocol 1 & 2 or Alternative Protocol 1. Note: to test with the EPEA nanobody-OGT/OGA fusions the EPEA nanobody fusions and their inactive controls will need to be ordered directly from Addgene.
REAGENTS AND SOLUTIONS:
Materials
Dulbecco’s Modified Eagle’s Medium (DMEM) (VWR, cat. no. 95042–512)
Fetal Bovine Serum (FBS) (Peak serum, cat. no. PS-FB2)
Penicillin:Streptomycin 10k/10k (P/S) (VWR. cat. no. 12001–692)
Tris base (VWR, cat. no. 97061–794)
NaCl (VWR, cat. no. 97063–366)
Tween-20 (VWR, cat. no. 97062–332)
Bovine Serum Albumin (BSA), heat shock fraction, pH 7, ≥98% (Sigma, cat. no. A9647–1KG)
Glycerol (VWR, cat. no. 200003–324)
ß-mercaptoethanol (VWR, cat. no. 97064–878)
Sodium dodecyl sulfate (SDS) (VWR, cat. no. 97064–470)
bromophenol blue (VWR, cat. no. 97061–690)
methanol (VWR, cat. no. BDH1135–1LP)
chloroform (VWR, cat. no. BDH1109–4LG)
10X PBS (VWR, cat. no. 75801–000)
HEPES sodium salt (VWR, cat. no. 80761–250)
LB Agar Lennox (VWR, cat. no. 89126–180)
LB Lennox broth (VWR, cat. no. 89126–176)
Ampicillin (VWR, cat. no. 97061–440)
DMEM cell media
Combine the following volumes
500 mL of DMEM
50 mL of FBS for ~10% FBS
5 mL of P/S for ~10 units penicillin, 10 μg streptomycin
1X TBST 1L pH 7.5
2.42 g for 20 mM Tris
8.77 g for 150 mM NaCl
1 mL for 0.1% Tween-20
Add 800 mL of milliQ H2O
Adjust pH to 7.9
Up to 1 L with milliQ H2O
1.5 M Tris-HCl pH 6.8 500 mL
90.855 g for 1.5M Tris
Add 250 mL of milliQ H2O
Adjust pH to 6.8
Up to 500 mL with milliQ H2O
3% BSA + 1X TBST 1L
30 g of BSA
Up to 1 L with 1X TBST
5X BME 20 mL
4 mL of 1.5 M Tris-HCl pH 6.8
10 mL glycerol
5 mL of ß-mercaptoethanol
2g of SDS
1 mL of 1% bromophenol blue
1X BME 50 mL
10 mL 5X BME
40 mL milliQ H2O
Can aliquot into 1 mL tubes and store at −20°C
1X PBS 1L
100 mL of 10X PBS
Add milliQ H2O to 1 L
Chloroform/methanol/water 115 mL
60 mL of methanol
15 mL of chloroform
40 mL of milliQ H2O
Stir bar
Note: The chloroform/methanol/water can be added individually to a sample in the following volumes 150 μL chloroform/600 μL methanol/400 μL H2O but can also be combined. When combined, it is necessary to include a stir bar and stir plate to mix the solution as they will separate over time.
1 M HEPES pH 7.9 1 L
238.3 g of HEPES
Add 800 mL of milliQ H2O
Adjust pH to 7.9
Bring volume up to 1 L with milliQ H2O
10% SDS 500 mL
50 g of SDS
Bring volume up to 500 mL with milliQ H2O
1% SDS + 20 mM HEPES pH 7.9 1 L
100 mL of 1% SDS
20 mL of 1 M HEPES pH7.9
Up to 1 L with milliQ H2O
LB Agar plates 1L
20 g of LB Agar Lennox
Add milliQ H2O to 1 L
Autoclave media
Wait for temperature around 40–50°C
Add 1 mL of 100 mg/mL ampicillin
Add 25 mL of media to bacterial plates and wait to solidify
LB media 1L
20 g of LB Lennox broth
Add milliQ H2O to 1 L
Autoclave media
0.2% SDS + 1X PBS 100 mL
2 mL of 10% SDS
Up to 100 mL with milliQ H2O
1% SDS + 1X PBS 1 L
100 mL of 10% SDS
100 mL of 10 X PBS
Up to 1 L with milliQ H2O
100 mg/mL ampicillin solution
1 g of ampicillin
Up to 10 mL with milliQ H2O
LB media + 100 μg/mL ampicillin
1 mL of 100 mg/mL ampicillin
1000 mL of LB media
COMMENTARY
BACKGROUND INFORMATION:
O-Linked N-acetyl glucosamine (O-GlcNAc) is a ubiquitous post-translational modification (PTM) cycled on serine or threonine residues of numerous nucleocytoplasmic proteins by the pair of enzymes, O-GlcNAc transferase (OGT) and O-GlcNAcase (OGA). Although O-GlcNAc plays essential roles in many cellular processes and its dysregulation is linked to various chronic diseases, our mechanistic understanding of this critical PTM is still emerging (Hart 2019). Historically, mechanistic studies of O-GlcNAc were challenging due to difficulties in detection and manipulation of O-GlcNAc on proteins. In recent years, several innovations have addressed these challenges, such as improved MS detection through EThcD (Mikesh et al. 2006), inhibitors for OGT and OGA (Estevez et al. 2020; Martin et al. 2018; Yuzwa et al. 2008), and site-directed mutagenesis for the permanent addition or removal of O-GlcNAc (Gorelik et al. 2019; Gorelik and van Aalten 2020). However, global alteration of O-GlcNAc levels require additional studies to characterize the function of O-GlcNAc on a target protein. Separately, protein specific site-directed mutagenesis studies can be challenging for O-GlcNAcylated proteins with multiple or unmapped glycosites and prohibitive for researchers without access to the instrumentation required for glycosite mapping. Therefore, new techniques like the nanobody system described here or RNA aptamers (Zhu, Y. 2019) that alter O-GlcNAc on a target protein without requiring prior knowledge of the glycosites on a protein would accelerate the functional annotation of O-GlcNAc in the proteome.
To address this challenge, we recently developed an approach for protein-level functional analysis of O-GlcNAc by selectively installing or removing O-GlcNAc on a target protein in living cells using nanobody-OGT and nanobody-splitOGA fusions (Ramirez et al., 2020; Ge et al., 2021). Nanobodies are small, single-domain protein binders that are capable of recognizing intracellular targets with high affinity and selectivity (Cheloha et al. 2020). In our initial studies with the nanobody-OGT system, we demonstrated targeting of proteins for modification with O-GlcNAc using a high affinity GFP nanobody (Kirchhofer et al. 2010) and a nanobody recognizing a small 4-amino acid peptide tag EPEA (De Genst et al. 2010) at the C-terminus of proteins. We further expanded the system for the selective removal of O-GlcNAc on target proteins using an engineered nanobody-splitOGA and introduced two new peptide tags BC2 (Traenkle et al. 2015) and Ubc (Ling et al. 2019) as compatible with the nanobody-OGA system, and by extension nanobody-OGT. Further work from our group increased the efficiency from the nanobody-OGT/splitOGA systems by optimization of the binding affinity of the GFP nanobodies (Fridy et al. 2014). The use of the optimal GFP nanobody, Lag6, is described here. Future evaluation of new nanobody-peptide tags, such as the ALFA-tag (Götzke et al. 2019), PepTag (Traenkle et al. 2020), and myc-tag (LI et al. 2018), will further expand the applicability of the system.
A major limitation when using nanobodies-enzyme fusions is the artificial binding introduced by the nanobody recognition of the target protein. This binding event can stabilize the target protein, interfere with interactions, localization, and affect function. Therefore, use of the catalytically inactivate nanobody-OGT/OGA is a necessary negative control. Fortunately, several recent innovations that can control nanobody binding through chemogenetic (Farrants et al. 2020) or optogenetic methods (Gil et al. 2020; Lee et al. 2014; Redchuk et al. 2020; Yu et al. 2019), nanobody stability (Tang et al. 2016), and expression (Gross et al. 2013) may prove useful in the design of a spatiotemporal controllable nanobody-OGT/splitOGA system in the future. As development of nanobody-enzyme fusions increases, we envision the simultaneous use of various nanobody tag and enzyme fusions targeting various PTMs such as phosphorylation (Scheller et al. 2020), ubiquitination (Caussinus, Kanca, and Affolter 2011), and O-GlcNAc to study cellular pathways or create synthetic regulatory circuits for a greater understanding and control of cellular signaling.
CRITICAL PARAMETERS:
Sample collection & processing
Due to the nature of O-GlcNAc as a nutritional sensor for the cell, we recommend maintaining a consistent cell culture environment to reduce variability associated with nutritional concentrations and cell passage over time. Addition of inhibitors of the enzymes to the lysis buffer and protein denaturation through heating should be performed in order prevent post-lysis modification of cellular proteins. For Alternate Protocol 1, it is critical that all the protein is fully resuspended during precipitation and resuspension steps to ensure all of the protein is fully labeled during GalT1, biotin, or PEG reactions.
Protein fusion design
Design of nanobody-enzyme fusions:
When generating protein fusions of nanobodies to enzymes, the nanobody should ideally be fused C-terminus of nanobody to the N-terminus of an enzyme because the complementary determining regions (CDRs), the main antigen binding sites, are located in close proximity to the N-terminus of the nanobody. Enzyme fusions to the N-terminus of the nanobody can potentially interfere with the antigen binding site and should be avoided when possible. Crystal structures of a nanobody-antigen interaction should ultimately inform the design of nanobody-enzyme fusions.
Design of OGT fusions:
When generating fusions of OGT, we found the expression of OGT to be greatest with N-terminal fluorescent protein fusions (GFP, mRFP) and weakest with peptide tag fusions (HA-tag). We do not recommend adding fusions to the C-terminus of OGT as the protein does not express well.
Design of the tagged target protein:
When generating nanobody epitope tag fusions of target proteins it is important to check that the addition of the tag does not interfere with the protein’s function or localization. We recommend performing immunofluorescence experiments of the endogenous target and the transfected target to check that the subcellular localization is unaffected. Both N- and C-terminal tag additions should be checked on the target protein to identify the best fusion orientation. In addition, we recommend using a rigid linker (EAAAK)4 or linkers that do not contain serine or threonine residues to prevent glycosylation of the linker itself. We have found that flexible linkers containing (GGGGS)4 are glycosylated by OGT through MS analysis. These considerations should be taken into account before generating stable cell lines of target proteins through either lentiviral transduction or CRISPR epitope tagging knock-in strategies.
Choice of nanobody-tag pair:
In the representative protocol we used the GFP-tag and the GFP nanobody Lag6, which are one of several validated nanobody-tag pairs that are compatible with this system. When choosing an appropriate nanobody-tag pair, several aspects should be considered. First, some tags can only function at certain positions on the protein, such as the EPEA-tag, which only works at the C-terminus. Other peptide tags, like the Ubc, BC2, and ALFA tags, are flexible in their positioning. Second, the binding affinity of the nanobody can affect the glycosylation and deglycosylation efficiency of fusion constructs. We have found that nanobodies with moderate affinities, like Lag6 (Kd ~ 310 nM), achieve the greatest induction or reduction of O-GlcNAc on the target protein. Therefore, when testing new nanobodies targeting new antigens, it is important to try various binding affinities for optimal results. Third, the size of the nanobody-tag pair should be considered as part of the experimental design. In our current system, researchers have the choice to use the 4-aa tag EPEA, peptide epitope tags (10–15 aa in length), whole proteins like GFP, or a combination of all three.
UNDERSTANDING RESULTS & TROUBLESHOOTING:
Caveats of the nanobody-OGT/OGA technologies
The engineering to create the nanobody-OGT/OGA technologies produced a system that is successful in modulating the O-GlcNAc state of desired target proteins in live cells. However, several limitations exist in the current system. First, this is a protein selective method, therefore specific glycosites may be differentially glycosylated by the nanobody-OGT. Second, the nanobody-tag pair may affect the protein by artificially stabilizing it due to the nanobody binding. Third, this protocol uses overexpression of the target and nanobody-OGT/OGA which can lead to biological artifacts. Inclusion of proper controls to support interpretation of the biological findings is essential until future iterations of the method may address these issues. Inclusion of an inactive catalytic control for nanobody-OGT/OGA or an active “mismatched” nanobody-OGT/OGA is strongly encouraged to allow differentiation of possible biological artifacts due to overexpression, nanobody binding, or some other unknown biological interaction with the OGT/OGA proteins.
Understanding western blot results
Due to the uncharged nature of the O-GlcNAc modification, most O-GlcNAc proteins do not migrate differently on a protein gel (with exceptions, as in the case of heavily O-GlcNAc modified Nup62). In the case of Nup62, use of nanobody-OGT causes a noticeable upward shift in the molecular weight of Nup62 and a downward shift when using nanobody-OGA (see representative data, Figure 3B). Heavily glycosylated proteins labeled with PEG groups will also have difficulties being transferred, detected by protein specific antibodies, and show smears instead of discrete protein banding. Smears are particularly abundant with overexpressed target proteins due to the generation of partly degraded protein products that are still glycosylated. In these cases, using antibodies recognizing peptide tags such as Flag, PEG2K instead of PEG5K groups, and lower acrylamide percentage gels 8% can help to resolve bands.
Using the C-tag beads for immunoprecipitation can sometimes reveal a band at the ~55kDa range that can be observed through ponceau staining or RL2 blotting. This band is tubulin and is immunoprecipitated due to the similarity of tubulin’s C-terminus amino acid sequence (EEEA) to the recognition of the C-tag beads for the peptide (EPEA) at the C-terminus of proteins. This does not generally affect the results obtained from the IP unless the target protein is similar in molecular weight. In this case, other epitope tag beads such as Flag, Myc, GFP or others can be used for the enrichment.
Evaluation of global O-GlcNAc levels:
Global RL2 blots can be very sensitive to the presence of the transfected target protein and nanobody-OGT to the point that the majority of the RL2 signal is related to the transfected proteins. For example, increases in global O-GlcNAc by RL2 can be observed from expression of the target GFP-JunB and nanobody-OGT, which are partly derived from degradation products of the nanobody-OGT and the target protein which can be observed in biotin enrichments (Figure 3A). Differentiation of the global RL2 blot from the expressed proteins can be validated with the biotin enrichment from Alternative Protocol 1 and blotting with Flag, HA, or GFP antibodies, or through an HA-tag pull-down and O-GlcNAc blot.
Alternative to O-GlcNAc antibodies:
Due to the bias of the O-GlcNAc antibodies such as RL2 and CTD110.6 for nucleoporins or regions of a protein backbone, we have found that performing the Alternative Protocol 1 is preferable for observing O-GlcNAc on proteins with low O-GlcNAc occupancy. This allows for direct enrichment of the O-GlcNAc modified product independent of the protein backbone.
Unchanged or low-fold changes in the O-GlcNAc status of a target protein:
In cases where the nanobody-OGT/OGA are being utilized on proteins and the O-GlcNAc state appears unchanged after performing Basic Protocol 1, then Alternative Protocol 1 of biotin labeling and enrichment may provide a more sensitive measurement due to the enrichment of the glycoproteins. If no change is observed with one of the nanobody-fusions (i.e., nanobody-OGT), the user may want to apply the other nanobody-fusion (i.e., nanobody-splitOGA). For example, proteins that are heavily glycosylated like Nup62 exhibit minor increases in O-GlcNAc when using the nanobody-OGT, but do exhibit dramatic decreases in O-GlcNAc levels when using nanobody-splitOGA (Figure 3B). By contrast, proteins that are not heavily glycosylated like JunB in U2OS cells show significant increases in O-GlcNAc levels in the presence of nanobody-OGT (Figure 3A). Additionally, treatment of cells with OGT, OGA, kinase, or phosphatase inhibitors should be performed to determine if the protein is dynamically modified by O-GlcNAc or if phosphorylation of the protein is affecting its O-GlcNAc state.
TIME CONSIDERATIONS:
Basic Protocol 1 and 2 (4–5 days): 1 day plating of HEK293T cells, 2 days transfection and generation of lysates, 1 day IP and Western blot.
Alternate Protocol 1 (2 days): From lysates, 1 day GalT1 labeling, 1 day biotin or PEG labeling and western blotting.
Support Protocol 1 (4 days from arrival of Addgene plasmids and primers and exclusion of sequence validation): 1 day PCR reaction, restriction enzyme digest, ligation, transformation, 1 day of colony growth, 1 day of culture growth, 1 day of miniprep, additional days for sequence validation dependent on provider turnaround.
Table 5:
MW-Diluted molecular weight ladder (1 μL of protein ladder/10 μL of 1X BME). 1–3 are the sample numbers from Table 3.
| IP: Flag/O-GlcNAc | ||||
|---|---|---|---|---|
| 1 | 2 | 3 | 4 | 5 |
| MW | 1 | 2 | 3 | MW |
Table 7.
The mixture was incubated with rotation at 21°C for 1 hr
| Reaction Components | Volume (μL) | Final Concentration |
|---|---|---|
| Protein sample from step 18 | 50 | 100 μg |
| H2O | 76 | |
| 10X PBS | 15 | 1X |
| 10 mM Biotin Alkyne Probe | 1.5 | 100 μM |
| 100 mM Sodium Ascorbate | 3 | 2 mM |
| 10 mM THPTA | 1.5 | 100 μM |
| 50 mM CuSO4 | 3 | 1 mM |
| Final Volume | 150 |
Table 9:
The mixture is incubated in a thermocycler with the conditions described below
| Components | μL |
|---|---|
| Template DNA pcDNA3.1-GFP-Flag-JunB-EPEA (1 ng/μL) from step 5 | 1.5 |
| Sgfl JunB fwd primer (10 μM) from step 7 | 2.5 |
| Sgsl JunB rev primer (10 μM) from step 7 | 2.5 |
| molecular H2O | 18.5 |
| 2X Q5 Master mix | 25 |
| Total | 50 |
Table 10.
The mixture was incubated for 1 hr at 37°C
| Reagents | Volume in μL | Reagents | Volume in μL |
|---|---|---|---|
| JunB PCR product from step 14 | 15 | pcDNA3.1-Nup62-Flag-EPEA Vector from step 5 | 5 μg |
| 10X Cut Smart buffer | 5 | 10X Cut Smart buffer | 5 |
| Sgfl | 1 | Sgfl | 1 |
| Sgsl | 1 | Sgsl | 1 |
| H2O | 28 | H2O up to 50 μL | X |
| Total | 50 | Total | 50 |
Table 11.
The mixture was incubated at 21°C for 20 mins.
| Reagents | Volume in μL |
|---|---|
| Cut JunB DNA insert from step 16 | 3 |
| Cut DNA scaffold vector from step 16 | 1 |
| T4 ligase | 1 |
| 10X T4 ligase | 2 |
| H2O | 13 |
| Total | 20 |
ACKNOWLEDGEMENTS:
Support from the National Institutes of Health (U01CA242098-01, C.M.W.), the Sloan Foundation (C.M.W.), the Camille and Henry Dreyfus Foundation (C.M.W.), the Merck Fellowship Fund, and Harvard University is gratefully acknowledged.
Footnotes
CONFLICT OF INTEREST:
The authors declare no conflict of interest.
Contributor Information
Daniel H. Ramirez, 12 Oxford St, Cambridge MA 02138
Yun Ge, 12 Oxford St, Cambridge MA 02138.
Christina M. Woo, 12 Oxford St, Cambridge MA 02138.
LITERATURE CITED:
- Caussinus E, Kanca O, & Affolter M (2011). Fluorescent fusion protein knockout mediated by anti-GFP nanobody. Nature Structural & Molecular Biology, 19(1), 117–121. doi: 10.1038/nsmb.2180 [DOI] [PubMed] [Google Scholar]
- Cheloha RW, Harmand TJ, Wijne C, Schwartz TU, & Ploegh HL (2020). Exploring cellular biochemistry with nanobodies. Journal of Biological Chemistry, 295(45), 15307–15327. doi: 10.1074/jbc.REV120.012960 [DOI] [PMC free article] [PubMed] [Google Scholar]
- Darabedian N, Thompson JW, Chuh KN, Hsieh-Wilson LC, & Pratt MR (2018). Optimization of Chemoenzymatic Mass Tagging by Strain-Promoted Cycloaddition (SPAAC) for the Determination of O-GlcNAc Stoichiometry by Western Blotting. Biochemistry, 57(40), 5769–5774. doi: 10.1021/acs.biochem.8b00648 [DOI] [PMC free article] [PubMed] [Google Scholar]
- De Genst EJ, Guilliams T, Wellens J, O’Day EM, Waudby CA, Meehan S, … Dobson CM (2010). Structure and properties of a complex of alpha-synuclein and a single-domain camelid antibody. Journal of Molecular Biology, 402(2), 326–343. doi: 10.1016/j.jmb.2010.07.001 [DOI] [PubMed] [Google Scholar]
- Estevez A, Zhu D, Blankenship C, & Jiang J (2020). Molecular Interrogation to Crack the Case of O-GlcNAc. Chemistry, 26(53), 12086–12100. doi: 10.1002/chem.202000155 [DOI] [PMC free article] [PubMed] [Google Scholar]
- Farrants H, Tarnawski M, Muller TG, Otsuka S, Hiblot J, Koch B, … Johnsson K (2020). Chemogenetic Control of Nanobodies. Nat Methods, 17(3), 279–282. doi: 10.1038/s41592-020-0746-7 [DOI] [PubMed] [Google Scholar]
- Fridy PC, Li Y, Keegan S, Thompson MK, Nudelman I, Scheid JF, … Rout MP (2014). A robust pipeline for rapid production of versatile nanobody repertoires. Nat Methods, 11(12), 1253–1260. doi: 10.1038/nmeth.3170 [DOI] [PMC free article] [PubMed] [Google Scholar]
- Ge Y, Ramirez DH, Yang B, D’Souza AK, Aonbangkhen C, Wong S, & Woo CM (2021). Target protein deglycosylation with a nanobody-directed split OGA in living cells. Nat Chem Biol. doi: 10.1038/s41589-021-00757-y [DOI] [PMC free article] [PubMed] [Google Scholar]
- Gil AA, Carrasco-Lopez C, Zhu L, Zhao EM, Ravindran PT, Wilson MZ, … Toettcher JE (2020). Optogenetic control of protein binding using light-switchable nanobodies. Nat Commun, 11(1), 4044. doi: 10.1038/s41467-020-17836-8 [DOI] [PMC free article] [PubMed] [Google Scholar]
- Gorelik A, Bartual SG, Borodkin VS, Varghese J, Ferenbach AT, & van Aalten DMF (2019). Genetic recoding to dissect the roles of site-specific protein O-GlcNAcylation. Nature Structural & Molecular Biology, 26(11), 1071–1077. doi: 10.1038/s41594-019-0325-8 [DOI] [PMC free article] [PubMed] [Google Scholar]
- Gorelik A, & van Aalten DMF (2020). Tools for functional dissection of site-specific O-GlcNAcylation. RSC Chemical Biology, 1(3), 98–109. doi: 10.1039/D0CB00052C [DOI] [PMC free article] [PubMed] [Google Scholar]
- Gotzke H, Kilisch M, Martinez-Carranza M, Sograte-Idrissi S, Rajavel A, Schlichthaerle T, … Frey S (2019). The ALFA-tag is a highly versatile tool for nanobody-based bioscience applications. Nat Commun, 10(1), 4403. doi: 10.1038/s41467-019-12301-7 [DOI] [PMC free article] [PubMed] [Google Scholar]
- Gross GG, Junge JA, Mora RJ, Kwon HB, Olson CA, Takahashi TT, … Arnold DB (2013). Recombinant probes for visualizing endogenous synaptic proteins in living neurons. Neuron, 78(6), 971–985. doi: 10.1016/j.neuron.2013.04.017 [DOI] [PMC free article] [PubMed] [Google Scholar]
- Hart GW (2019). Nutrient regulation of signaling and transcription. Journal of Biological Chemistry, 294(7), 2211–2231. doi: 10.1074/jbc.AW119.003226 [DOI] [PMC free article] [PubMed] [Google Scholar]
- Jin-jing LI, F. X, Yan-wei JI,Mei SHU,Zhui TU,Jin-heng FU. (2018). Biopanning of Anti c-Myc-tag Nanobodies and Its Application for Bioimaging. China Biotechnology, 38(2), 61–67. doi: 10.13523/j.cb.20180209 [DOI] [Google Scholar]
- Kirchhofer A, Helma J, Schmidthals K, Frauer C, Cui S, Karcher A, … Rothbauer U (2010). Modulation of protein properties in living cells using nanobodies. Nature Structural & Molecular Biology, 17(1), 133–138. doi: 10.1038/nsmb.1727 [DOI] [PubMed] [Google Scholar]
- Lee S, Park H, Kyung T, Kim NY, Kim S, Kim J, & Heo WD (2014). Reversible protein inactivation by optogenetic trapping in cells. Nat Methods, 11(6), 633–636. doi: 10.1038/nmeth.2940 [DOI] [PubMed] [Google Scholar]
- Ling J, Cheloha RW, McCaul N, Sun ZJ, Wagner G, & Ploegh HL (2019). A nanobody that recognizes a 14-residue peptide epitope in the E2 ubiquitin-conjugating enzyme UBC6e modulates its activity. Molecular Immunology, 114, 513–523. doi: 10.1016/j.molimm.2019.08.008 [DOI] [PMC free article] [PubMed] [Google Scholar]
- Martin SES, Tan ZW, Itkonen HM, Duveau DY, Paulo JA, Janetzko J, … Walker S (2018). Structure-Based Evolution of Low Nanomolar O-GlcNAc Transferase Inhibitors. Journal of the American Chemical Society, 140(42), 13542–13545. doi: 10.1021/jacs.8b07328 [DOI] [PMC free article] [PubMed] [Google Scholar]
- Mikesh LM, Ueberheide B, Chi A, Coon JJ, Syka JE, Shabanowitz J, & Hunt DF (2006). The utility of ETD mass spectrometry in proteomic analysis. Biochimica et Biophysica Acta (BBA)-Proteins and Proteomics, 1764(12), 1811–1822. doi: 10.1016/j.bbapap.2006.10.003. [DOI] [PMC free article] [PubMed] [Google Scholar]
- Ramirez DH, Aonbangkhen C, Wu HY, Naftaly JA, Tang S, O’Meara TR, & Woo CM (2020). Engineering a Proximity-Directed O-GlcNAc Transferase for Selective Protein O-GlcNAcylation in Cells. ACS Chemical Biology. doi: 10.1021/acschembio.0c00074 [DOI] [PMC free article] [PubMed] [Google Scholar]
- Redchuk TA, Karasev MM, Verkhusha PV, Donnelly SK, Hulsemann M, Virtanen J, … Verkhusha VV (2020). Optogenetic regulation of endogenous proteins. Nat Commun, 11(1), 605. doi: 10.1038/s41467-020-14460-4 [DOI] [PMC free article] [PubMed] [Google Scholar]
- Rexach JE, Rogers CJ, Yu SH, Tao J, Sun YE, & Hsieh-Wilson LC (2010). Quantification of O-glycosylation stoichiometry and dynamics using resolvable mass tags. Nature chemical biology, 6(9), 645–651 doi: 10.1038/nchembio.412 [DOI] [PMC free article] [PubMed] [Google Scholar]
- Scheller L, Schmollack M, Bertschi A, Mansouri M, Saxena P, & Fussenegger M (2020). Phosphoregulated orthogonal signal transduction in mammalian cells. Nat Commun, 11(1), 3085. doi: 10.1038/s41467-020-16895-1 [DOI] [PMC free article] [PubMed] [Google Scholar]
- Tang JC, Drokhlyansky E, Etemad B, Rudolph S, Guo B, Wang S, … Cepko CL (2016). Detection and manipulation of live antigen-expressing cells using conditionally stable nanobodies. Elife, 5. doi: 10.7554/eLife.15312 [DOI] [PMC free article] [PubMed] [Google Scholar]
- Traenkle B, Emele F, Anton R, Poetz O, Haeussler RS, Maier J, … Rothbauer U (2015). Monitoring interactions and dynamics of endogenous beta-catenin with intracellular nanobodies in living cells. Molecular & Cellular Proteomics, 14(3), 707–723. doi: 10.1074/mcp.M114.044016 [DOI] [PMC free article] [PubMed] [Google Scholar]
- Traenkle B, Segan S, Fagbadebo FO, Kaiser PD, & Rothbauer U (2020). A novel epitope tagging system to visualize and monitor antigens in live cells with chromobodies. Scientific Reports, 10(1), 14267. doi: 10.1038/s41598-020-71091-x [DOI] [PMC free article] [PubMed] [Google Scholar]
- Yu D, Lee H, Hong J, Jung H, Jo Y, Oh BH, … Heo WD (2019). Optogenetic activation of intracellular antibodies for direct modulation of endogenous proteins. Nat Methods, 16(11), 1095–1100. doi: 10.1038/s41592-019-0592-7 [DOI] [PubMed] [Google Scholar]
- Yuzwa SA, Macauley MS, Heinonen JE, Shan X, Dennis RJ, He Y, … Vocadlo DJ (2008). A potent mechanism-inspired O-GlcNAcase inhibitor that blocks phosphorylation of tau in vivo. Nature Chemical Biology, 4(8), 483–490. doi: 10.1038/nchembio.96 [DOI] [PubMed] [Google Scholar]
- Zhu Y (2019). Regulating O-GlcNAcylation on Specific Proteins Using RNA Aptamers (Doctoral dissertation, Johns Hopkins University; ). [Google Scholar]