Abstract
This paper presents an algorithm to transform and reconstruct diffusion-weighted imaging (DWI) data for alignment of micro-structures in association with spatial transformations. The key idea is to decompose the diffusion-attenuated signal profile, a function defined on a unit sphere, into a series of weighted diffusion basis functions (DBFs), reorient these weighted DBFs independently based on a local affine transformation, and then recompose the reoriented weighted DBFs to obtain the final transformed signal profile. The decomposition is performed in a sparse representation framework in recognition of the fact that each diffusion signal profile is often resulting from a small number of fiber populations. A non-negative constraint is further imposed so that noise-induced negative lobes in the signal profile can be avoided. The proposed framework also explicitly models the isotropic component of the diffusion-attenuated signals to avoid undesirable artifacts during transformation. In contrast to existing methods, the current algorithm executes the transformation directly in the signal space, thus allowing any diffusion models to be fitted to the data after transformation.
Index Terms—: Diffusion-weighted imaging, reorientation, spatial transformation
I. Introduction
DIFFUSION-WEIGHTED imaging (DWI) [1] reveals spectacular details of brain tissue micro-structures through observation of water diffusion patterns, which are shaped by local tissue structures. It, therefore, captures vital information that is of paramount importance for in vivo investigation of white matter and connectivity alterations that are associated with brain diseases, development, and aging [2]–[5]. However, effective intra- and inter-subject comparisons of DWI data at a group or individual level cannot yet be performed without dedicated spatial normalization algorithms that ensure that the comparisons are executed based on matching structures.
While spatial normalization algorithms that deal with anatomical T1- and T2-weighted images are plenty [6], spatial normalization based on DWI data [7]–[9] offers a more direct means of detecting correspondences in white matter micro-structures, information on which is often lost in the homogeneous white matter contrast of anatomical scans. Two essential components of diffusion-based spatial normalization algorithms are spatial coordinate mapping for matching of macro-structures and local diffusion profile reorientation for angular alignment of micro-structures. The need to meet both requirements makes designing such spatial normalization algorithms much more challenging compared with traditional scalar-based spatial normalization algorithms. The current work focuses on the latter component and aims to devise a reorientation algorithm that can be applied directly on DWI data, therefore allowing any diffusion models to be fitted after spatial transformation.
Due to its directional nature, spatial normalization of diffusion data often requires more than coordinate mapping between image domains. The diffusion-attenuated signal profile (DW signals represented as a spherical function) encapsulated by each image voxel has to be transformed appropriately for correct micro-structural alignment (see Fig. 1). For the case of diffusion tensor imaging (DTI) [10], this is reduced to reorientation based on the principal diffusion directions [11]. This approach, however, can be problematic in regions that are traversed in different directions by multiple fiber populations. Since the tensor model does not differentiate between diffusion components resulting from different fiber populations, the diffusion profile is often rigidly reoriented, resulting in inconsistency with respect to the geometry of the transformed fibers.
Fig. 1.
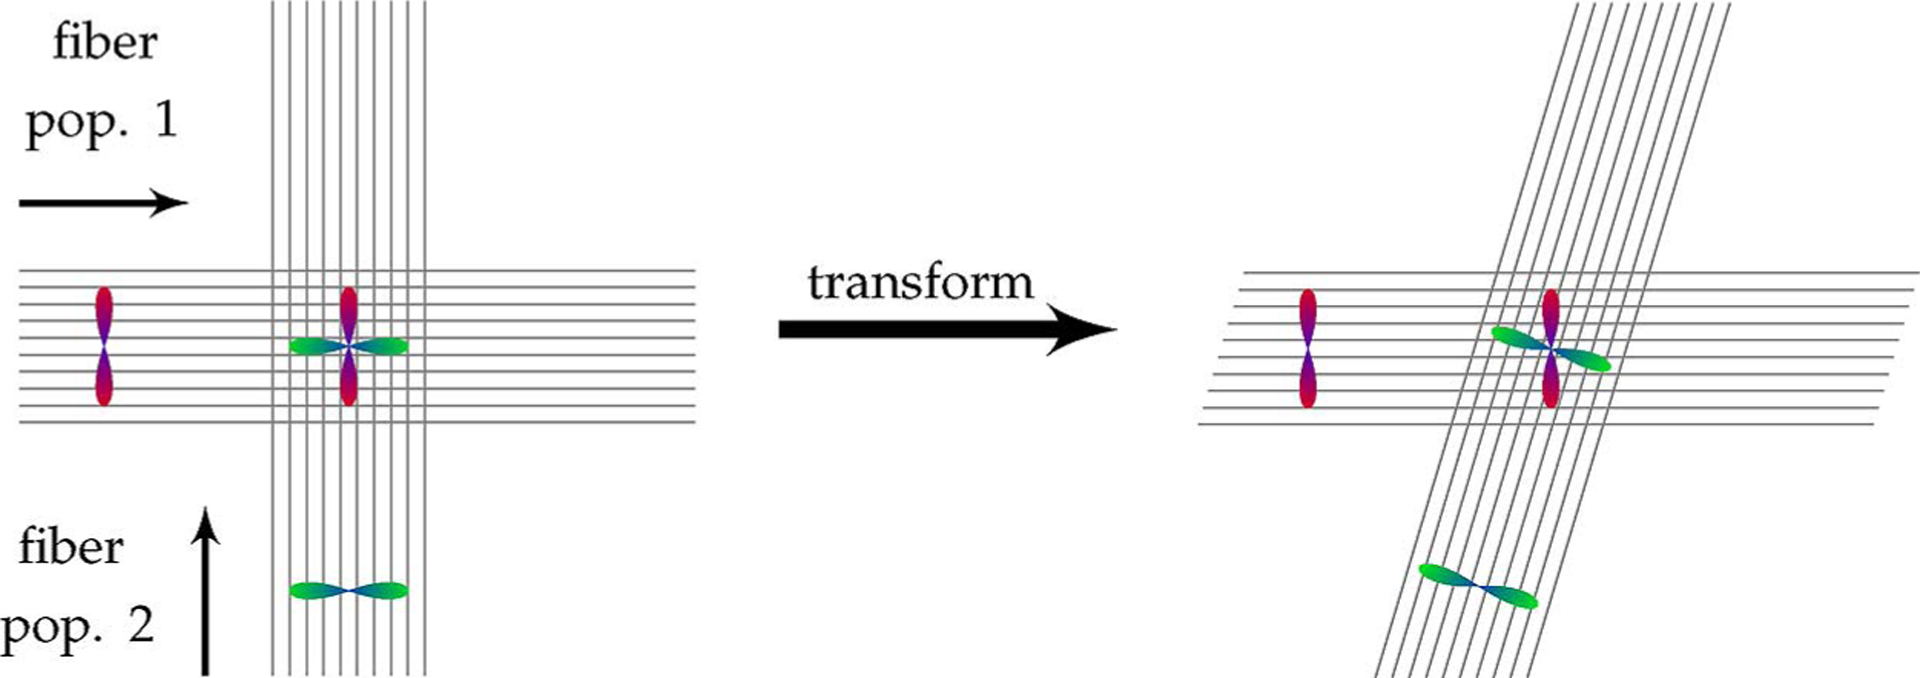
DWI reorientation. Two fiber populations, one horizontal and one vertical, are shown together with their individual diffusion-attenuated signal profiles. When the two fiber populations cross each other, the resulting signal profile is a combination of signals from the individual fiber populations. Since the individual fiber populations transform differently with respect to a local transformation (horizontal shearing in this example), the signal profiles of the individual fibers need to be decoupled, reoriented individually, and then recombined to form a reoriented signal profile.
With appropriate higher-order diffusion models [12]–[17], performing diffusion imaging at a higher angular resolution than what is typically applied for DTI enables one to resolve the diffusion components that are associated with different fiber populations. This allows reorientation of the signal profile to be carried out more accurately. Fig. 1 illustrates that, to be consistent with the fiber geometry, diffusion profiles at fiber crossings should be reoriented with careful consideration of the constituent fiber populations. In this particular example, the diffusion component resulting from the fiber population in the horizontal direction should be minimally affected by the horizontal shearing, as opposed to the diffusion component associated with the fiber population in the vertical direction. Existing solutions to achieve this are discussed next.
A. Related Works
A number of methods for reorientation of diffusion data have been proposed in the literature [18]–[21]. Most revolve around reorienting a certain form of diffusion/fiber orientation distribution function (ODF). Hong et al.’s method [18], for instance, aims to maintain the volume fraction of the fiber ODF through each infinitesimal surface area element on the sphere as it is reoriented. In [19] and [20], Raffelt et al. present a reorientation framework where the fiber ODF [22], [23] is decomposed into a series of weighted spherical harmonic (SH) point spread functions (PSFs), which are then reoriented individually and composed to form the reoriented fiber ODF. This approach was later extended by Dhollander et al. in [21] for direct reorientation of DWI data in the Q-space. It is further demonstrated in [21] the importance of taking into account the isotropic component in modeling the diffusion to avoid the danger of turning an isotropic signal profile into an anisotropic one.
B. Contributions
We introduce a reorientation algorithm that will work directly on the DWI data. This will allow any models to be fitted to the data after reorientation. Inspired by the works of Raffelt et al. [19], [20] and Dhollander et al. [21], the key idea of the proposed reorientation algorithm is to decompose the signal profile, a function defined on a unit sphere, into a series of weighted diffusion basis functions (DBFs), reorient these weighted DBFs independently based on the local affine transformation, and then recompose the reoriented weighted DBFs to obtain the final transformed signal profile. A DBF [24] represents the diffusion response function of a single coherent fiber population or a specific diffusion component, such as isotropic diffusion. In contrast to [19]–[21], our method presents the following distinctions.
1). Computation Complexity:
Our method avoids the computation complexity of SHs especially that required by the associated Legendre polynomials. Reorientation of the signal profile involves reorienting and recomputing the DBFs. Since it is generally difficult to be certain in advance the exact transformation that will be applied, precomputing the DBFs for signal profile reconstruction is practically infeasible. Efficient computation of DBFs is very important for spatial normalization, since very often the DBFs have to be computed for a significant number of times as the spatial normalization algorithm iterates to refine correspondence matching. Computation burden grows drastically when the number of SH basis functions is increased for better approximation of the signal profiles.
2). Smoothing:
Our method avoids the smoothing effect of SHs. When SH basis functions of insufficient order are used, loss of sharp directional information is inevitable. Although this can be partially alleviated by increasing the allowable maximum order of SH basis functions, the computation cost will rapidly increase by multiple folds—the number of SH basis functions increases in the order of the square of the maximum order. Both Raffelt et al.’s method [19], [20] and Dhollander et al.’s method [21] utilize certain forms of SH representation for the signal profile and the DBFs.
3). Artifacts:
Our method avoids the artifacts associated with SHs. The negative-lobe artifacts caused by truncation of the SH series and the Gibbs phenomenon have been discussed extensively in [20]. Fig. 2 shows that the DBFs proposed by Dhollander et al. [21] exhibit similar artifacts that should be corrected for more accurate representation of the signal profile. Note that in our implementation of the Dhollander DBFs, we did not remove the zeroth-order SH term as was originally done in [21]. With this modification, each Dhollander DBF can now be used to represent the signal profile of a single fiber population. This allows a fair evaluation of the Dhollander DBFs with respect to the DBFs proposed in the present work.
Fig. 2.
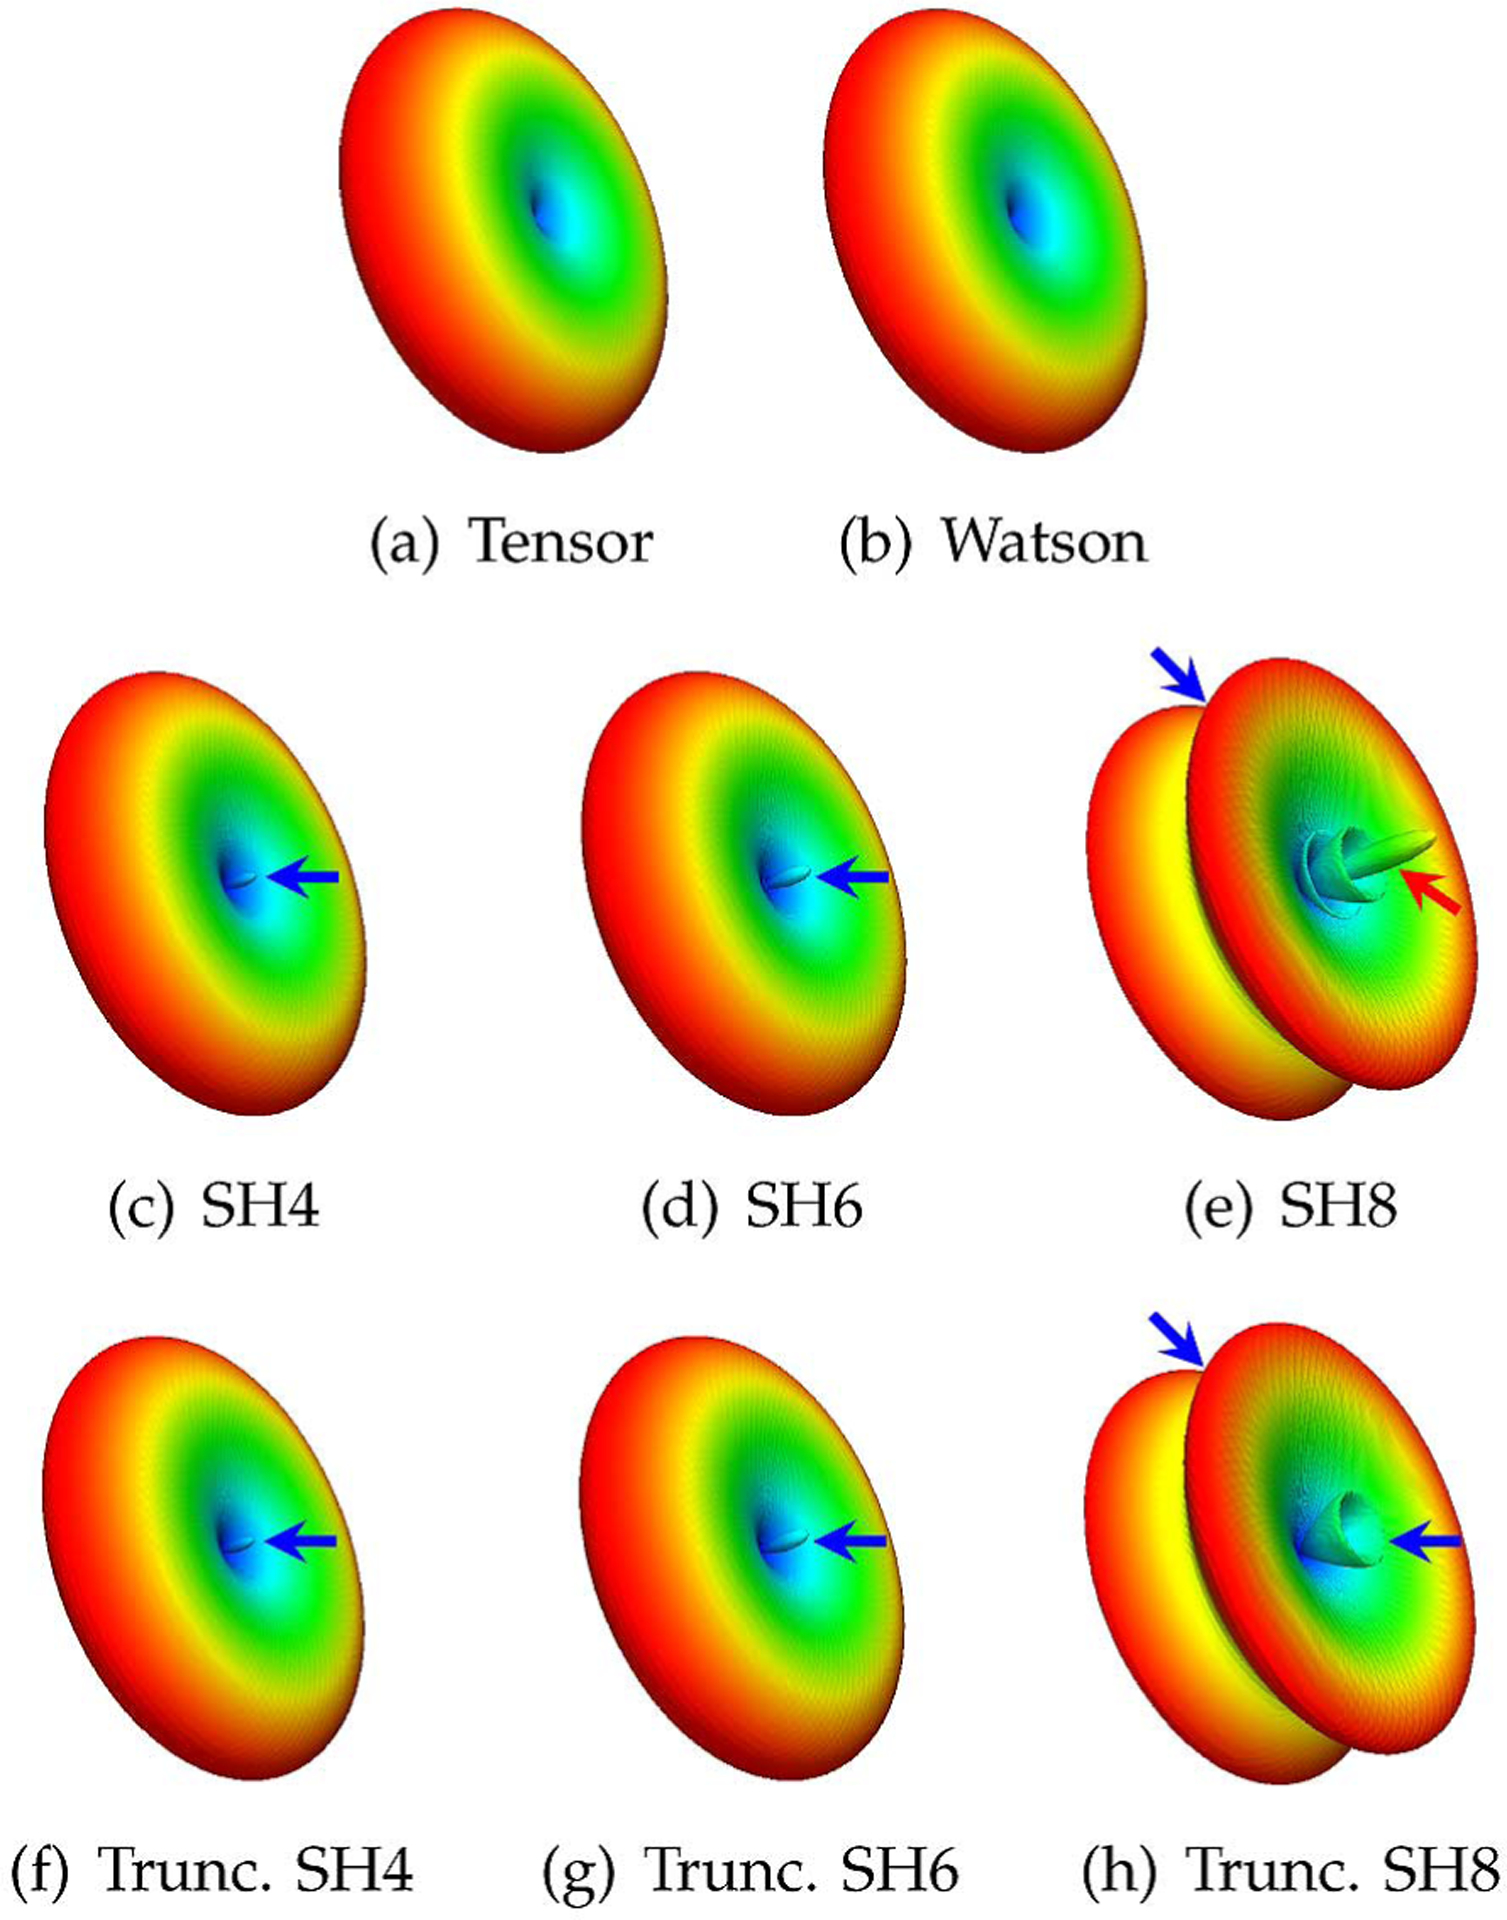
Diffusion basis functions. Typical basis functions generated using (a) the tensor model, (b) the Watson distribution function, (c)–(e) the Dhollander basis functions [21] generated using SHs with maximum orders of 4, 6, and 8, and (f)–(h) the Dhollander basis functions modified by truncating the negative lobes. The red arrow marks the negative lobes. The blue arrows mark the problematic areas that will prevent the basis function from accurately representing the diffusion-attenuated signals.
4). Isotropic Diffusion:
Our method explicitly models the isotopic diffusion so that the isotropic component of the signal profile will not be reoriented. The effect of this additional component was discussed in [21]; but it is unclear in the paper how the weight of the isotropic component should be estimated. We will show that if the commonly used least-norm estimation technique is employed to determine the weights associated with the basis functions, the outcome will be far from satisfactory.
5). Sparse Representation:
Our method incorporates an efficient non-negative L1-regularized least-squares solver, which is guaranteed to converge to the global solution in a finite number of iterative steps. This allows us to obtain a sparse representation of the signal profile, reflecting the fact that the diffusion-attenuated signals at each voxel are essentially generated by a limited number of fiber populations. While employing sparse representation for diffusion modeling has been well documented (see [25] for an excellent example), the application of such framework to DWI reorientation has not been sufficiently studied. We will demonstrate that sparse representation is essential for obtaining accurately reoriented signal profiles. Sparse representation was not considered in [19]–[21].
C. Paper Organization
In the upcoming sections of the paper, we will first detail in Section II the key components of the proposed algorithm. We will discuss a number of DBF options, how the weights with respect to these DBFs can be estimated in a sparse representation framework, and how reorientation can finally be performed. We will then demonstrate the effectiveness of the proposed algorithm in Section III with both synthetic and in vivo data, evaluating the reorientation accuracy as well as the preservation of diffusion properties (e.g., diffusion anisotropy) with reorientation. Additional discussion is provided in Section IV before concluding the paper.
II. Approach
The proposed algorithm entails first decomposing the signal profile into a series of weighted DBFs. Given a local affine transformation, which can be computed from a local Jacobian of a deformation field estimated by any deformable spatial normalization algorithms, the weighted DBFs are then independently reoriented and recomposed to obtain the final transformed signal profile.
A. Single Tensor Model
We first consider the single tensor model, with which ellipsoidal, planar, and spherical directional functions can be reasonably approximated. A diffusion tensor D can be decomposed as D = UKUT, where U is a rotation matrix and K is a diagonal matrix consisting of eigenvalues {λ1, λ2, λ3}. The shape of the tensor is determined by its eigenvalues. For instance, if λ1 > λ2 ≥ λ3, the shape is ellipsoidal with the major axis of the ellipsoid pointing in the direction of the eigenvector corresponding to λ1. This indicates preferential diffusion of water molecules along a particular direction. For λ1 = λ2 ≫ λ3, the shape is planar, indicating diffusion along directions orthogonal to the eigenvector corresponding to λ1. For λ1 = λ2 = λ3, the diffusion is isotropic, resulting in a tensor with a spherical shape.
For principal diffusion along a particular direction μ and λ1 > λ2 = λ3, one can rewrite the tensor as
| (1) |
where I is the identity tensor. If we further assume that λ1 ≫ λ2 = λ3, the equation above can be further simplified to become
| (2) |
With this simplified form, the single tensor model
| (3) |
where S(g) is the diffusion-attenuated signal in direction g and S0 is the baseline signal without diffusion sensitization, is in fact identical in form to the Watson distribution function [26]. This is apparent if we approximate, by using (2), the exponent as and rewrite the model (3) as
| (4) |
Comparing this with the probability distribution function (PDF) of the Watson distribution [26], which is defined as
| (5) |
we can see that in fact μ is precisely the mean orientation and –bλ1 = κ is the concentration parameter of the Watson distribution function. C(κ) is a normalizing constant to ensure that the density function integrates to unity over the unit sphere. The Watson distribution function corresponds to the “stick” model in [27].
B. Decomposition of the Signal Profile
In a diffusion-weighted experiment with typical acquisition parameters, it is unlikely that water molecules will be able to traverse regions separated by more than a few tens of microns over the diffusion time. We, therefore, posit that there is no effective exchange between spatially distinct fiber bundles. For this reason, the diffusion-weighted signals resulting from different fiber populations can be assumed to add independently to generate the total measured signals [22].
Denoting the diffusion-attenuated signal measured in direction gi (i = 1, …, M) as S(gi), the collection of signals forms a spherical function that can be decomposed into a series of weighted DBFs. In our case, the DBFs consist of a set of single tensor models with principal diffusion directions uniformly distributed on a unit sphere. That is
| (6) |
where wj is the weight for the jth DBF, which is defined as
| (7) |
Tensor Dj is defined according to (1). For 1 ≤ j ≤ N, the principal diffusion direction is set to μj. The set of principal diffusion directions should ideally be uniformly distributed on a unit sphere. For j = 0, we set λ1 = λ2 so that f0(gi | λ1, λ2) = f0(λ1) = exp(−bλ1) can be used to model the isotropic diffusion of free water [27]. Note that we have dropped since it is constant for each voxel and can be taken as absorbed by the weights. In matrix form, (6) can be rewritten as
| (8) |
where
| (9) |
and
| (10) |
Assuming M < N + 1, (8) represents a set of underdetermined linear equations, a possible solution to which involves solving a least-norm problem
| (11) |
where ‖ · ‖p denotes the p-norm. The solution can be obtained analytically as
| (12) |
In the presence of noise, the equality in (6) can be relaxed by solving a Tikhonov-regularized least-squares problem
| (13) |
where γ is a tuning parameter that controls the relative weighting between the two terms. We shall however show with empirical evidence that both the least-norm and Tikhonov-regularized least-squares formulations do not work well for the purpose of reorientation. The proposed solution is discussed next.
C. Sparse Representation
Since most white matter voxels are expected to contain contributions from relatively few fiber populations, we expect a relatively small number of DBF weights to have positive values; the vast majority of the weights should be zeros. This requirement can be met by taking a sparse signal representation approach [28] in estimating the weights. In this approach, a given signal profile is represented by a set of weights associated with elements of a dictionary (or base) of functions. The elements of such a dictionary are called atoms (or basis functions). The idea is to select from the dictionary the atom decomposition that best match the signal structure, using a sparsity criterion for selecting among equivalent decompositions. Essentially, this approach aims to represent the signal profile with as little number of atoms as possible.
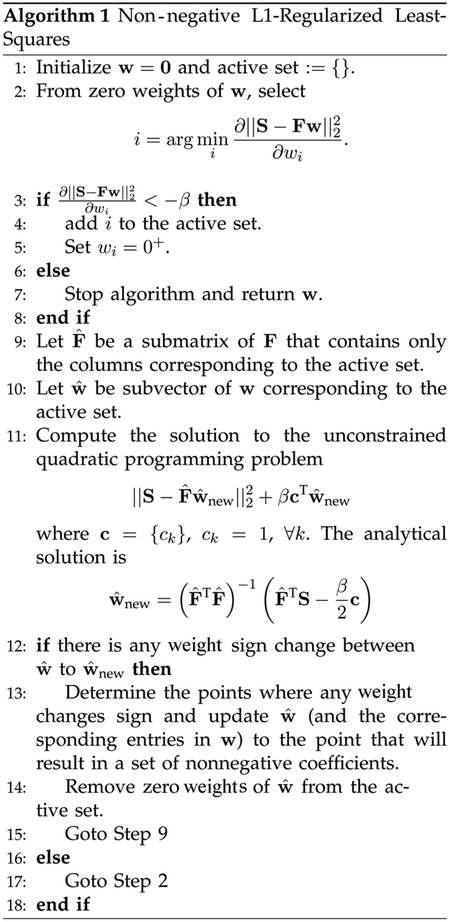
In our case, (6) represents the decomposition of the signal profile as a linear combination of atoms in the dictionary F. Based on the basis pursuit (BP) framework [28], we compute a solution to (6), taking into account the possible presence of noise, by means of a non-negative L1-regularized least-squares problem
| (14) |
where β ≥ 0 is a tuning parameter. The non-negative constraint imposed on the DBF weights is included to suppress spurious negative lobes, which can occur due to imaging noise. The sparse representation problem can be solved by using an active-set-based algorithm (see Algorithm 1), which is modified from the feature-sign algorithm presented in [29] to incorporate the non-negative constraint. The algorithm can be proven to always converge to the global optimum in a finite number of iterations [29]. Note that when β = 0, (14) reduces to the non-negative least squares (NNLS) problem
| (15) |
For all four methods (least norm, Tikhonov, non-negative least squares, and sparse), the diffusion-attenuated signals S and the DBFs F are normalized to unit norm prior to estimating the weights w. The weights are then re-scaled based on the scaling factors used for the normalization of the signals and the DBFs so that the original unnormalized signals can be represented using the unnormalized DBFs.
D. Reconstruction of the Transformed Signal Profile
For reorientation of a signal profile, the directions of the DBFs, μj, are reoriented independently based on a local affine transformation matrix A, i.e., . Based on the reoriented DBFs, a new matrix in replacement of F can be computed as
| (16) |
The transformed signal profile is S′ finally obtained as
| (17) |
Note that the isotropic component is not reoriented.
E. Estimation of the Orientation Distribution Function
Upon fitting the model (6) to the signal profile, the corresponding ODF can be computed. Assuming no net motion of spin population, the PDF of the displacements of water molecules p(x) is related to the DW signals by [30]
| (18) |
where τ is the diffusion time. Using this relationship and (6), the displacement PDF can be written as
| (19) |
Expressing x = ru, where u is a unit vector, the ODF can be computed with [31]
| (20) |
giving
| (21) |
F. Estimation of Local Fiber Orientations
To extract the orientations associated with the ODF peaks, which represent the local fiber orientations, the following steps are performed.
Sample the ODF with sufficient angular density at orientations u1, …, uL.
Remove orientations associated with ODF values less than the mean ODF value.
Locate orientations with ODF values greater than those of their neighboring orientations.
- Compute the mean orientations of the orientations in the neighborhood of the orientations with the maximal values. This can be done by computing the eigenvector corresponding to the largest eigenvalue of dyadic tensor
for ui satisfying ODF(ui) > ODF(v), . denotes orientations in the neighborhood of. Return the mean orientations as the output.
III. Experimental Results
In this section, we will report the results of our evaluations of the proposed method based on synthethic and in vivo data. For all experiments, we set β = 0.01. The tuning parameter for the Tikhonov-regularized least-squares solver γ was set to be equal to β. Unless otherwise specified, the DBFs were composed of tensor models [i.e., (1) and (7)]. For the synthetic data, λ1 and λ2 = λ3 were set according to the parameters used for generating the data. For the in vivo data, λ1 and λ2 = λ3 were estimated from the corpus callosum (using a region consisting of 130 voxels). A total of 321 orientations, generated by subdividing the faces of an icosahedron three times and discarding antipodal symmetric directions, were used as the principal diffusion directions of the DBFs. L = 1281 orientations, generated by subdividing the faces of an icosahedron four times, were used to locate the ODF peaks.
A. Parameters
The parameters that affect the performance of the proposed reorientation strategy are the regularization parameter β, the number of acquisition gradient directions, and the number of principal directions used to generate the DBFs. To quantitatively evaluate the effects of these parameters on reorientation performance, we randomly generated 100 sample signal profiles, reflecting two fiber populations with crossing angles varying between 30° and 90°, and partial volume fractions ranging between 0.25 and 0.75. Each fiber population is modeled by a tensor with λ1 = 1.5 × 10⁻³ mm2/s, λ2 = λ3 = 3 × 10⁻⁴ mm2/s, and b = 2000 s/mm2. The baseline non-diffusion weighted signal was set to 150. The (120) gradient directions were taken from the in vivo dataset. Note that these diffusion parameters were carefully chosen to mimic the in vivo data. For each sample signal profile, a corresponding post-reorientation ground truth signal profile was generated by first reorienting the directions of the two fiber populations using a randomly generated transformation. The proposed reorientation algorithm was applied to the sample signal profile using the same transformation, and the reorientation accuracy was then evaluated with respect to the ground truth by computing the root mean square (RMS) error. The transformations were composed of random rotation (between −45° and 45°), scaling (0.75–1.25) and shearing (−0.5 to +0.5). That is, the transformation matrix is defined as A = HSR, where
| (22) |
and R = Rx Ry Rz with
| (23) |
| (24) |
| (25) |
The transformation parameters were drawn uniformly from the following ranges: −0.5 ≤ h ≤ 0.5, 0.75 ≤ sx, sy, sz ≤ 1.25, −45° ≤ θx, θy, θz ≤ 45°.
In addition, various levels of Rician noise was added to each sample signal profile for evaluation of the parameters in relation to noise. We generated the Rician-corrupted signal as
| (26) |
where η1 and η2 are independently sampled from a normal distribution with zero mean and variance . The value is a realization of a random variable with a Rician PDF of parameters S(gi) and σrician. The parameter σrician was set according to the required signal-to-noise ratio (SNR), which is defined as
| (27) |
Results for SNR = 5, 10, 15, 20 are shown in Fig. 3 with discussions in the following subsections.
Fig. 3.
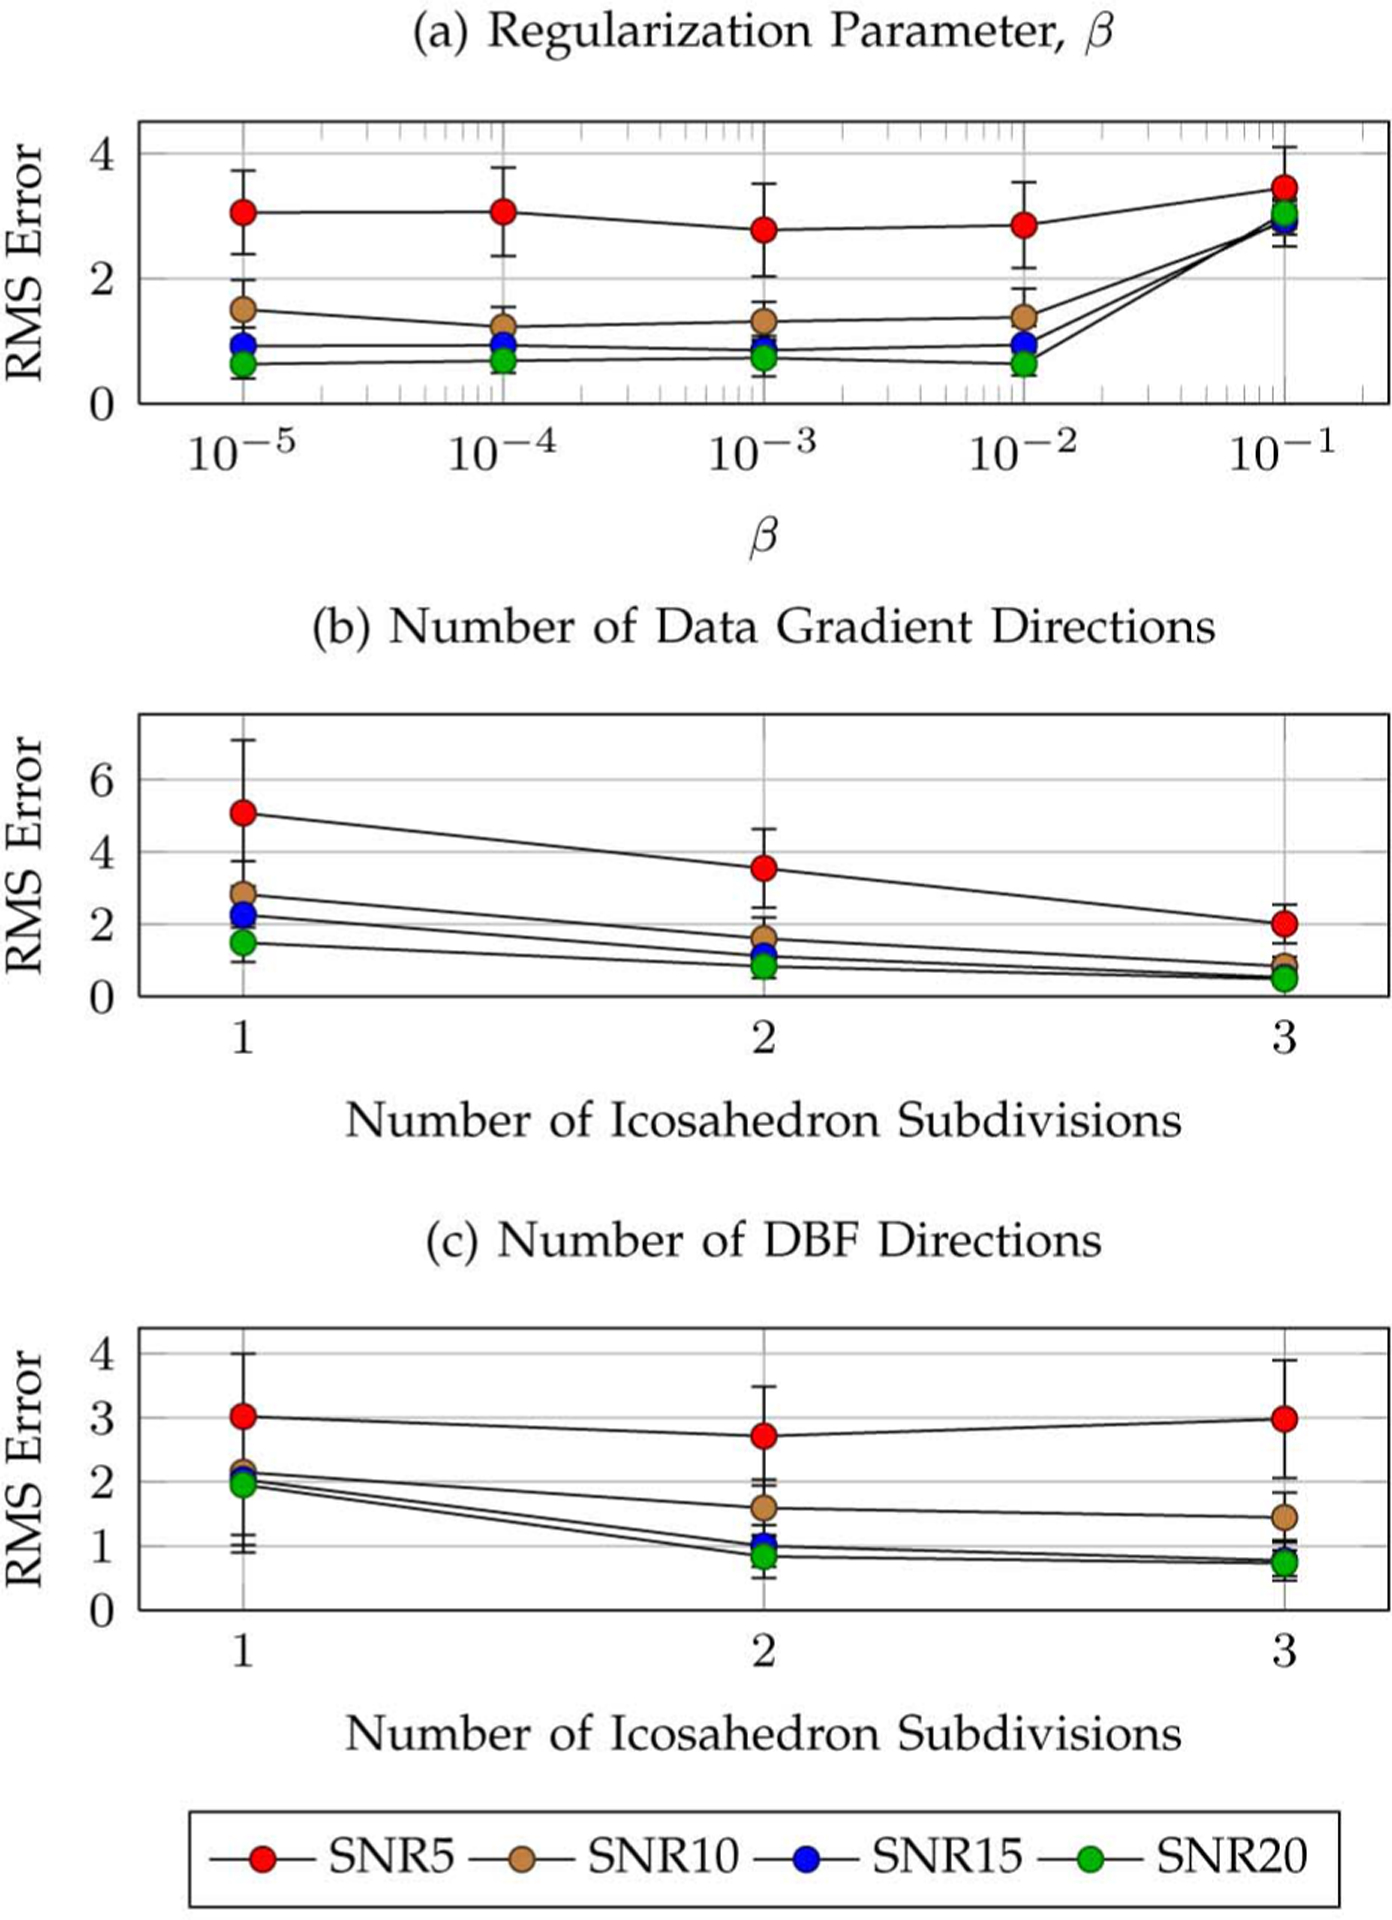
Parameters. Average reorientation RMS errors with respect to (a) the regularization parameter β, (b) the number of data gradient directions, and (c) the number of DBF directions. Subdivision of the faces of an icosahedron 1, 2, and 3 times (discarding antipodal symmetric directions) corresponds to a total of 21, 81, and 321 directions, respectively. The error bars indicate the standard deviations.
1). Regularization Parameter β:
Fig. 3(a) shows that the reorientation performance is relatively insensitive to the variation of β from 1 × 10⁻⁵ to 1 × 10⁻². The parameter value β = 1 × 10⁻² was chosen for the rest of the experiments to ensure reasonably small reconstruction error and at the same time sufficient sparsity of the estimated DBF weights.
2). Number of Data Gradient Directions:
Fig. 3(b) shows the variation of the reorientation accuracy with respect to the number of data gradient directions. The directions here were generated by subdividing the faces of an icosahedron. Unsurprisingly, reorientation accuracy increases with the number of data gradient directions. In the upcoming experiments involving synthesized data, we set the gradient directions to match those from the in vivo dataset for consistency. The RMS errors associated with the gradient directions used for the in vivo dataset are 2.82 ± 0.80, 1.36 ± 0.39, 0.90 ± 0.30, and 0.69 ± 0.29, respectively, for SNR = 5, 10, 15, 20.
3). Number of DBF Directions:
Fig. 3(c) shows that increasing the number of DBF directions will generally increase the reorientation accuracy (except for the case of SNR = 5, where the effect of noise is greater). Consistent with previous work [18], [20], we chose for the rest of the experiments a total number of 321 DBF directions (three icosahedron subdivisions).
B. The Necessity of Sparse Representation and the Isotropic Component
We will demonstrate in this section that both sparse representation and the isotropic component are essential for accurate reorientation of the signal profile.
1). Sparse Representation:
To demonstrate the necessity of sparse representation, we show in Fig. 4 the typical distributions of weights estimated by solving the least-norm problem (11), the Tikhonov-regularized least-squares problem (13), the non-negative least-squares problem (15), and the sparse representation problem (14). Results for an anisotropic signal profile of two crossing fibers and an isotropic signal profile are shown for SNR = ∞ (noiseless) and SNR = 10. It can be observed from the figures that by taking the sparse representation approach the true constituents of the signal profiles can be estimated more accurately with less distraction from nonrelated DBFs. We note in particular that, for the sparse representation approach, the weights of the DBFs that truly represent the constituents of the signal profile (e.g., w0 for the isotropic case) are much higher than the nonrelated DBFs. Observe that in the presence of noise, the weights estimated via solving the least-norm problem are unrealistically large. Solving the non-negative least-squares problem results in weights that are much more reflective of the true constituents of the anisotropic signal profile, but not the isotropic signal profile, particularly when noise is present. We will demonstrate with experimental results that correct modeling of the diffusion-attenuated signals is crucial for generating correct reorientation results.
Fig. 4.
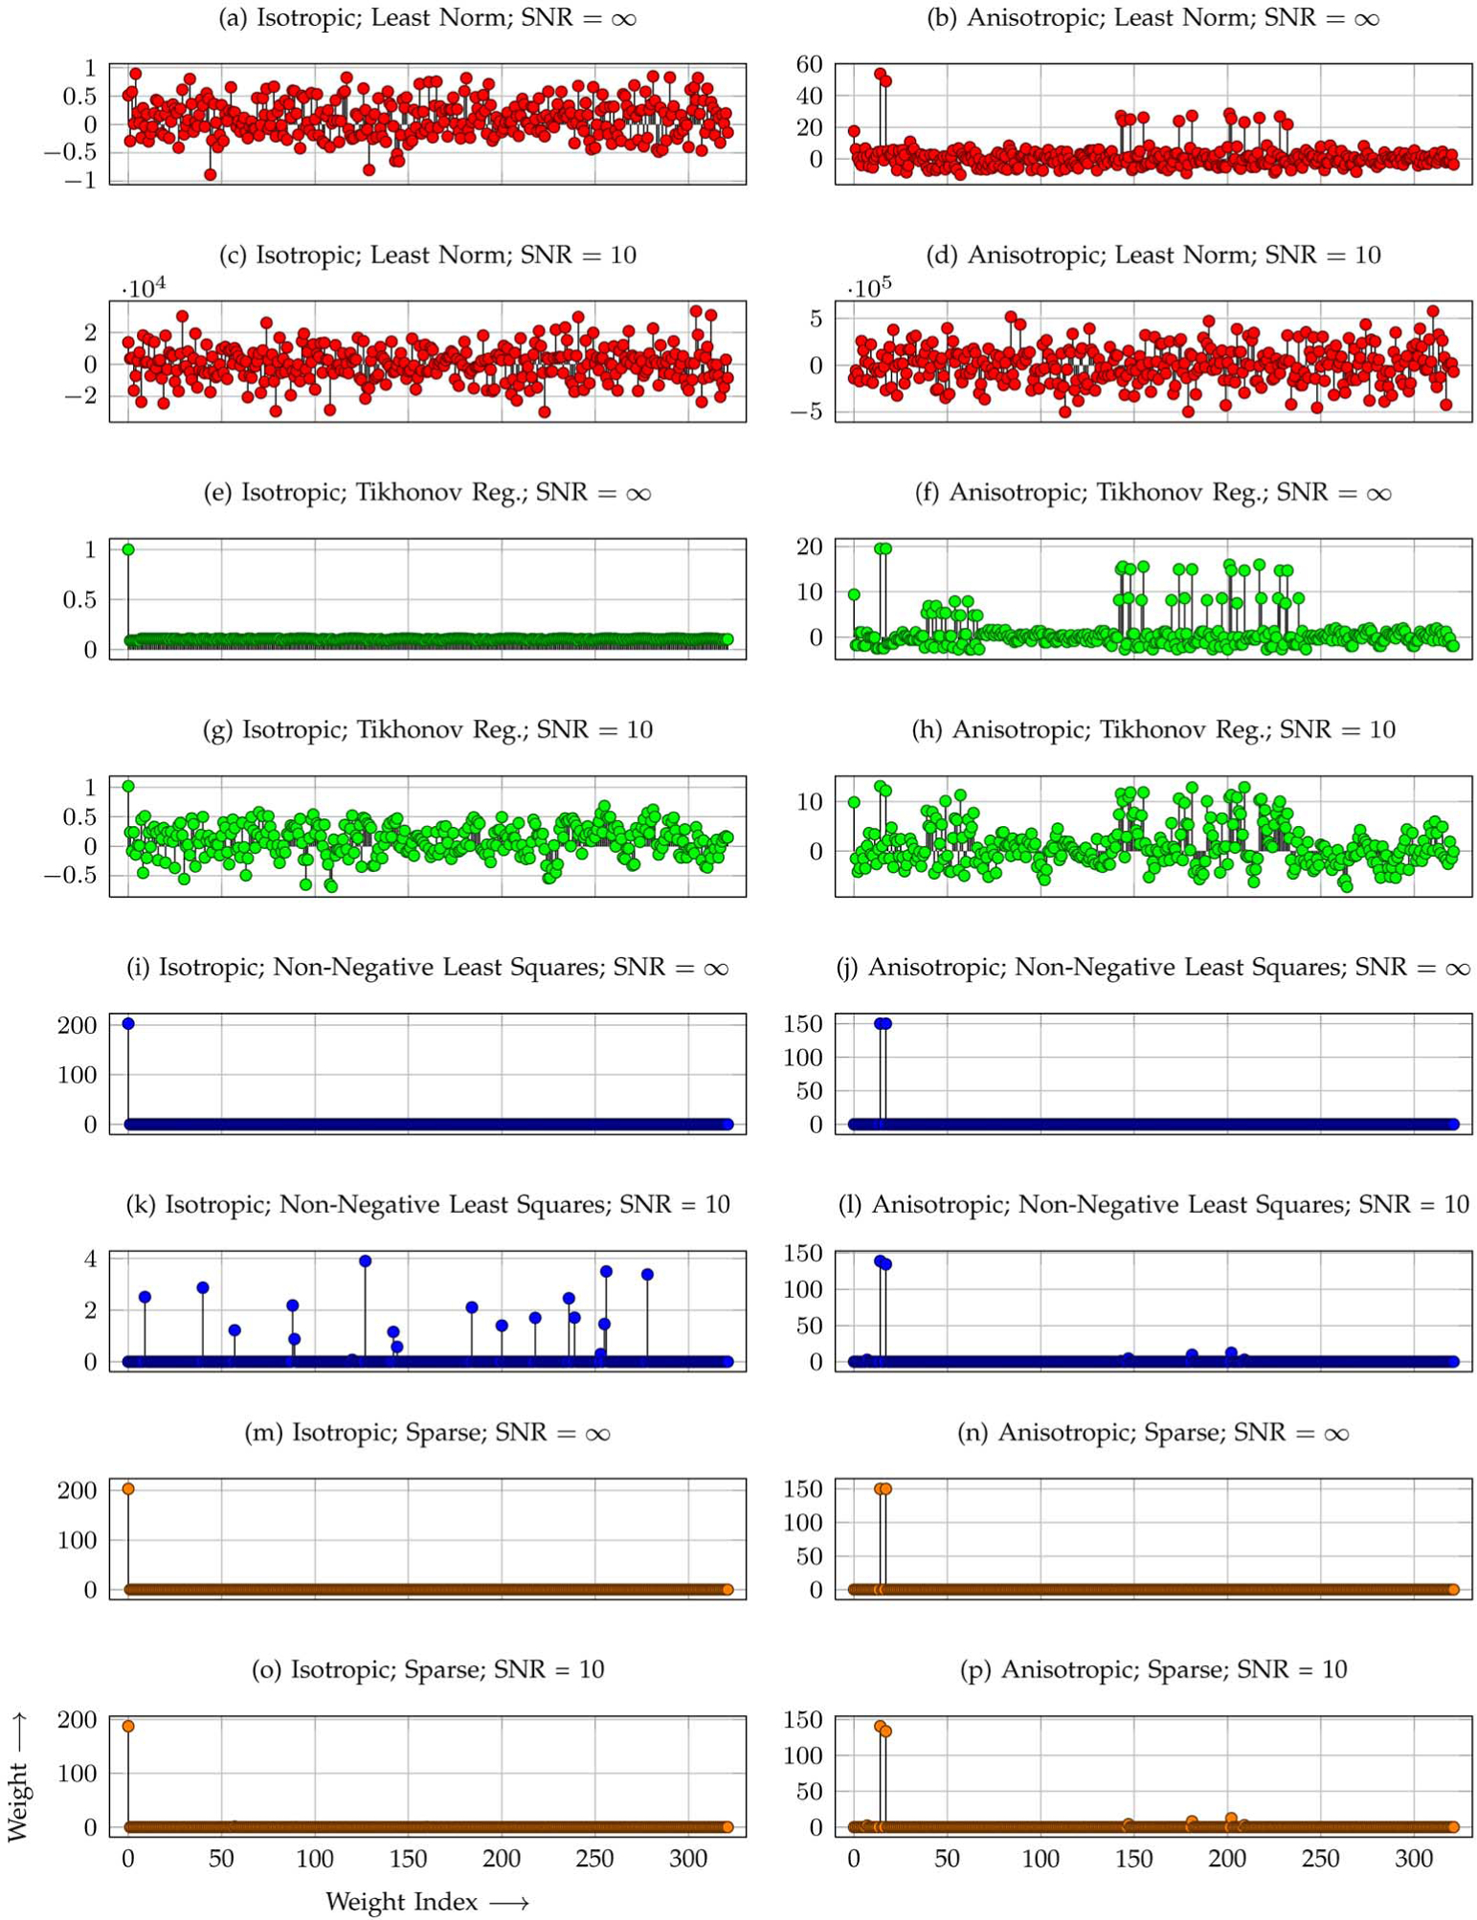
Weight distributions. Distributions of weights estimated by solving (a)–(d) the least-norm problem, (e)–(h) the Tikhonov-regularized least-squares problem, (i)–(l) the non-negative least-squares problem, and (m)–(p) the sparse representation problem for both anisotropic (two crossing fiber populations) and isotropic signal profiles. Even though the same set of tensor DBFs is used, the estimated weights vary vastly with the method used for weight estimation.
2). The Isotropic Component:
Determining the weight for the isotropic term by solving the least-norm problem, the Tikhonov-regularized least-squares problem, and the non-negative least-squares problem is susceptible to ambiguity. When the DBFs are distributed densely and uniformly on a sphere, giving equal weights to all DBFs can result in an isotropic signal profile, hence defeating the purpose of including an isotropic term in (6) to model the isotropic diffusion. The sparse representation problem (14) helps avoid this pitfall by choosing the sparsest representation. For an isotropic signal profile, the typical distributions of weights estimated by solving the least-norm problem, Tikhonov-regularized least-squares problem, non-negative least-squares problem, and sparse representation formulation are shown graphically in Fig. 4(a), (e), (i), and (m), respectively. Fig. 4(m) indicates that the sparse representation approach gives a peak with huge amplitude for w0 and zeros for all other weights. Fig. 4(a) and (e) shows that the amplitude of the w0 peak is much reduced in favor of weights of other nonrelated DBFs. A non-negative constraint improves the results when the SNR is high [Fig. 4(i)] but falls short for noisy situations [Fig. 4(k)]. Failure to capture the isotropic diffusion component will adversely affect the outcome of reorientation—an isotropic signal profile will end up being anisotropic after reorientation.
Fig. 5 shows typical reorientation results for the tensor DBFs generated (a) using the sparse representation framework, (b) without the isotropic component, and (c) using the Tikhonov-regularized least-squares solver. The corresponding ODFs, computed using the method described in Section II–E, are shown in Fig. 6. Note that trilinear spatial interpolation was performed on the weights of the DBFs. The figures illustrate that if no isotropic component is included in the model or if a non-sparse method is used, isotropic profiles will be inappropriately reoriented.
Fig. 5.
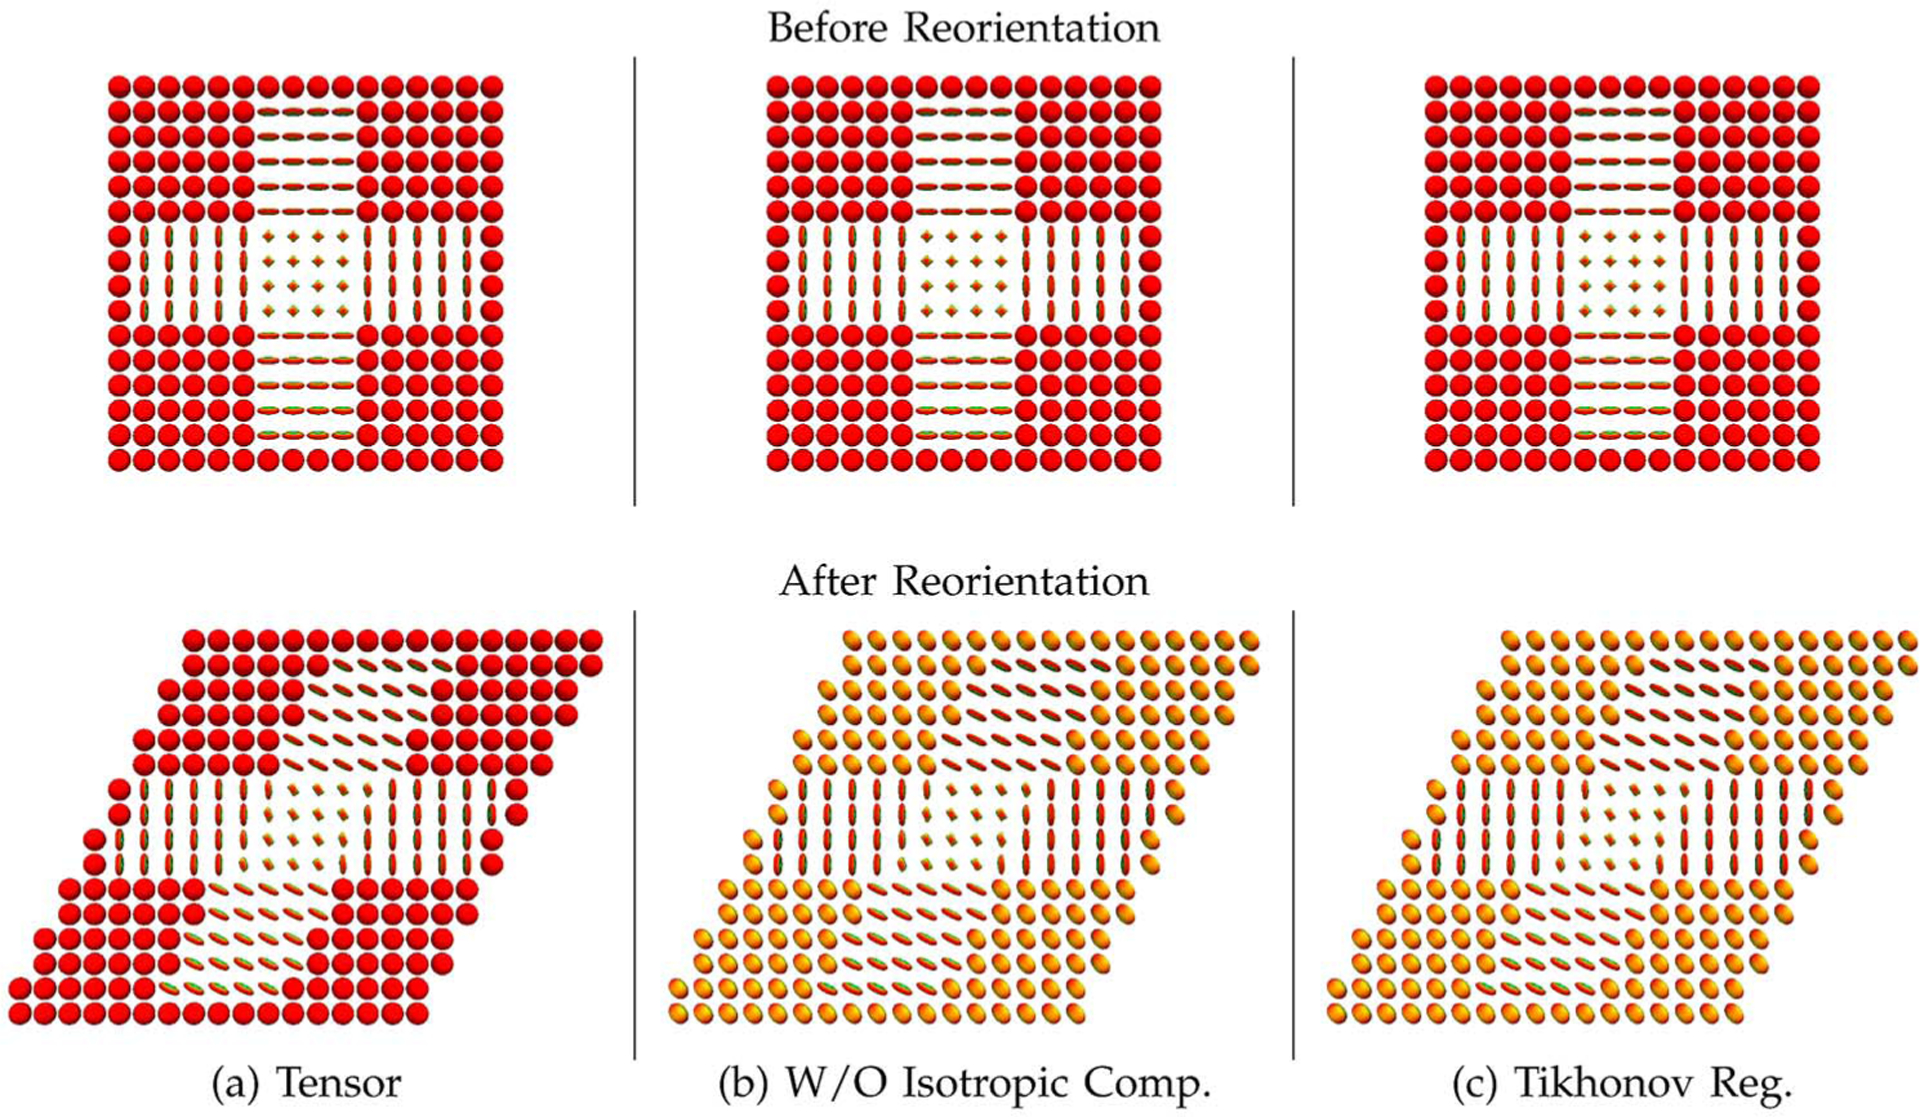
Example reorientation results. Reorientation by (a) employing the proposed sparse representation strategy, (b) excluding the isotropic component from the set of DBFs, and (c) utilizing the Tikhonov-regularized least-squares solver (isotropic component inclusive). The tensor DBFs are used for all cases. The corresponding ODFs are shown in Fig. 6.
Fig. 6.
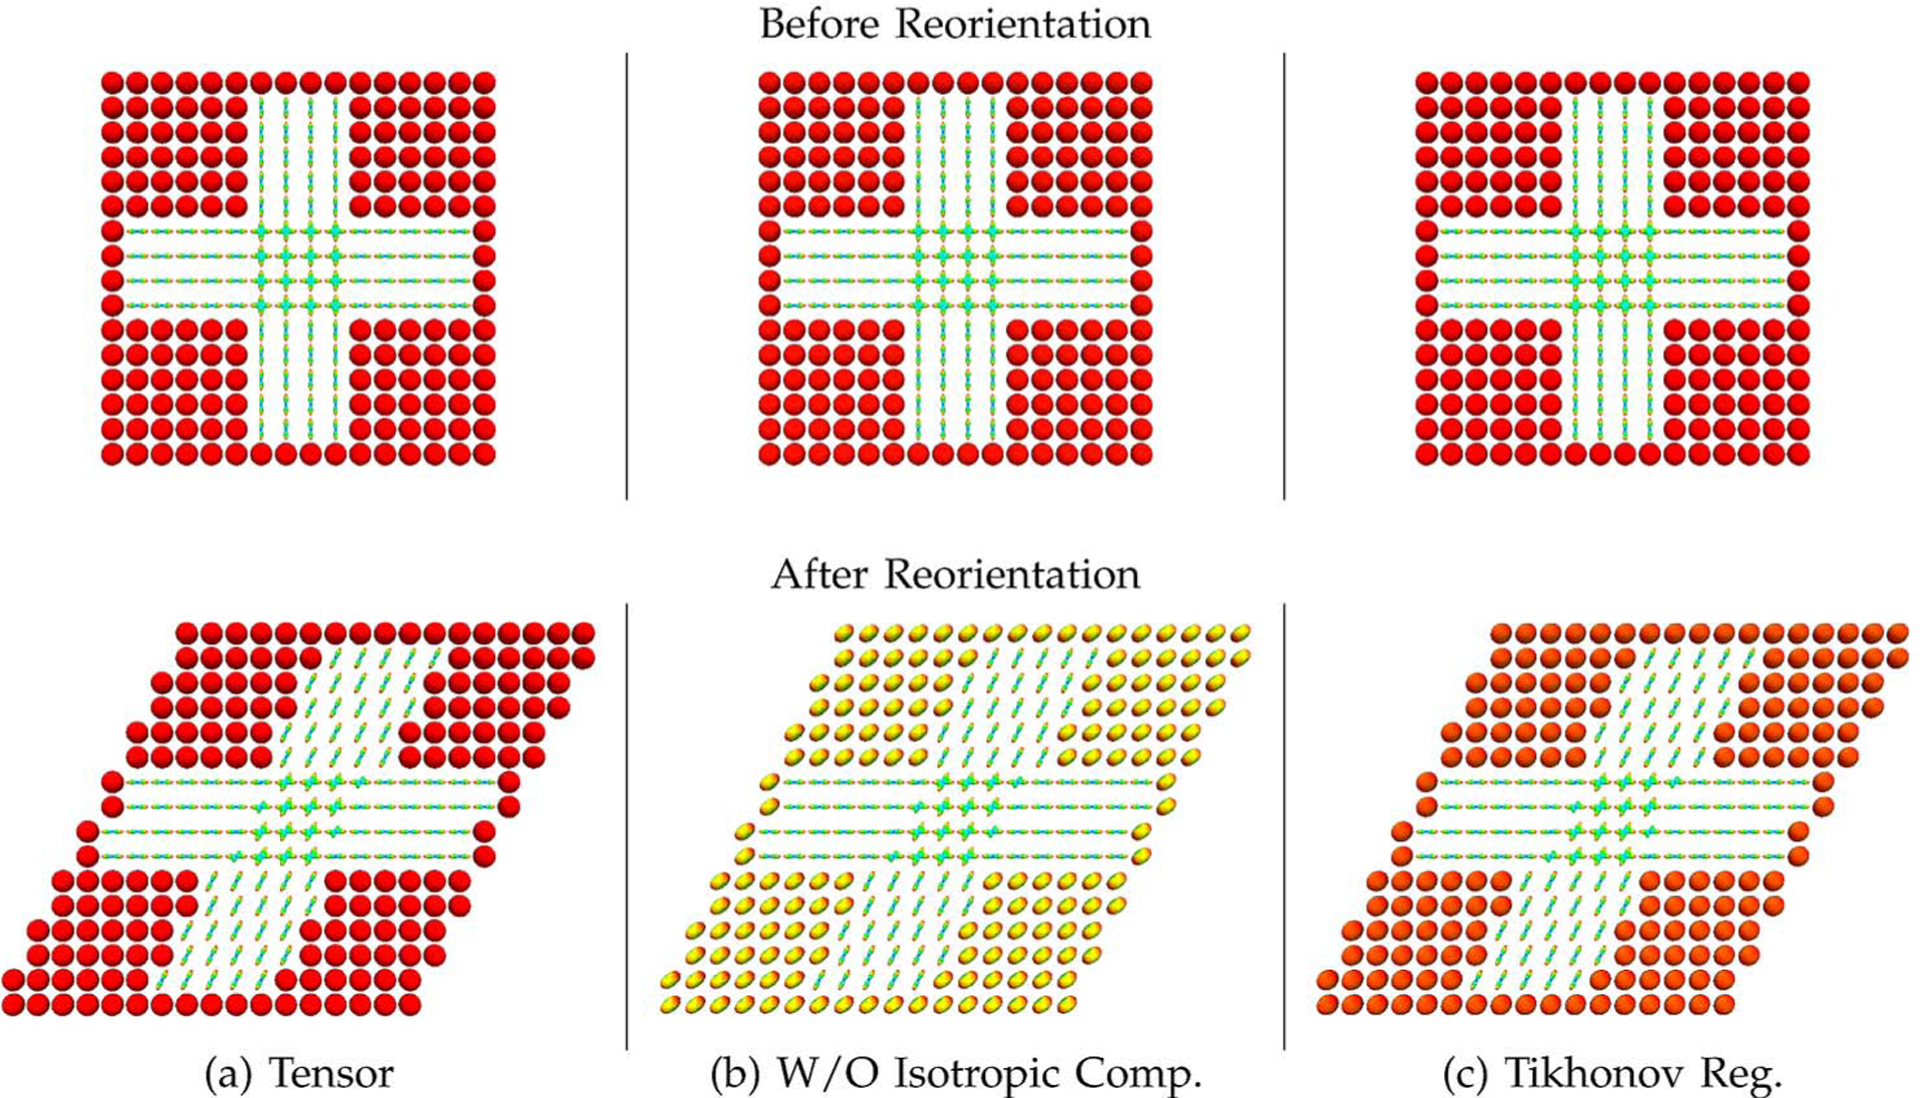
Example reorientation results—ODFs. ODFs corresponding to the results shown in Fig. 5.
C. Evaluation—Synthetic Data
In this section, we report the results of our evaluation of the proposed framework based on synthetic data. For comparison, we applied the proposed sparse representation-based reorientation framework utilizing various DBFs, generated using the tensor models, the Watson distribution functions (also known as the “ball-and-stick” model [27]) as well as the method proposed by Dhollander et al. [21]. Results using the tensor DBFs with the Tikhonov-regularized least-squares method, the non-negative least-squares method, and with the isotropic component excluded were also generated.
To the best of our knowledge, the Dhollander method [21] is currently the only other existing method that performs reorientation directly on the diffusion-attenuated signals. The DBFs used by the Dhollahder method are generated by inverse-transforming the SH point-spread functions (PSFs) of Dirac delta functions, which were proposed in [19]. The inverse transform is composed of the inverse Funk-Radom transform (FRT) [16] and the inverse spherical deconvolution transform (SDT) [32]. We adapted the Dhollander DBFs to the data by setting the eigenvalues λ1 and λ2 = λ3 associated with the SDT [32] to be exactly the same as those used in generating the synthetic data. SHs up to order of 6 were used, as in [21], to generate the DBFs. The zeroth-order SH term was retained and the negative lobes were truncated before applying the Dhollander DBFs for reorientation. Note that instead of using the least-norm solver, we used the sparse solver to obtain more reliable estimates of the weights for the Dhollander DBFs. The estimation was done in the signal space instead of using the SH coefficients as done in [21]. This is to avoid information loss due to truncation of the SH series.
To evaluate how the reconstruction error varies with the extent of transformation, we quantified the reorientation RMS error with respect to different amount of shearing, i.e., we set the transformation matrix to
| (28) |
where the shearing factor h varies from 0 to 1. This was applied to a signal profile that was generated using two equally-weighted tensors; one tensor was oriented in the horizontal (x-axis) direction and the other in the vertical (y-axis) direction. The parameters for the tensors were identical to those described in Section III–A. The experiment was repeated 100 times for each noise level.
The results for various SNRs, shown in Fig. 7, indicate that the tensor DBFs give the least reorientation errors when evaluated against the ground truth. The mean signal value for the ground truth profile is indicated in the figure caption to help gauge the significance of a unit change in the RMS value. Unsurprisingly, the error generally increases with the extent of transformation. The tensor DBFs, however, yield consistent reorientation accuracy throughout different degree of shearing. It can be also observed that in this experiment the isotropic component is not essential since the data were generated with no isotropic diffusion.
Fig. 7.
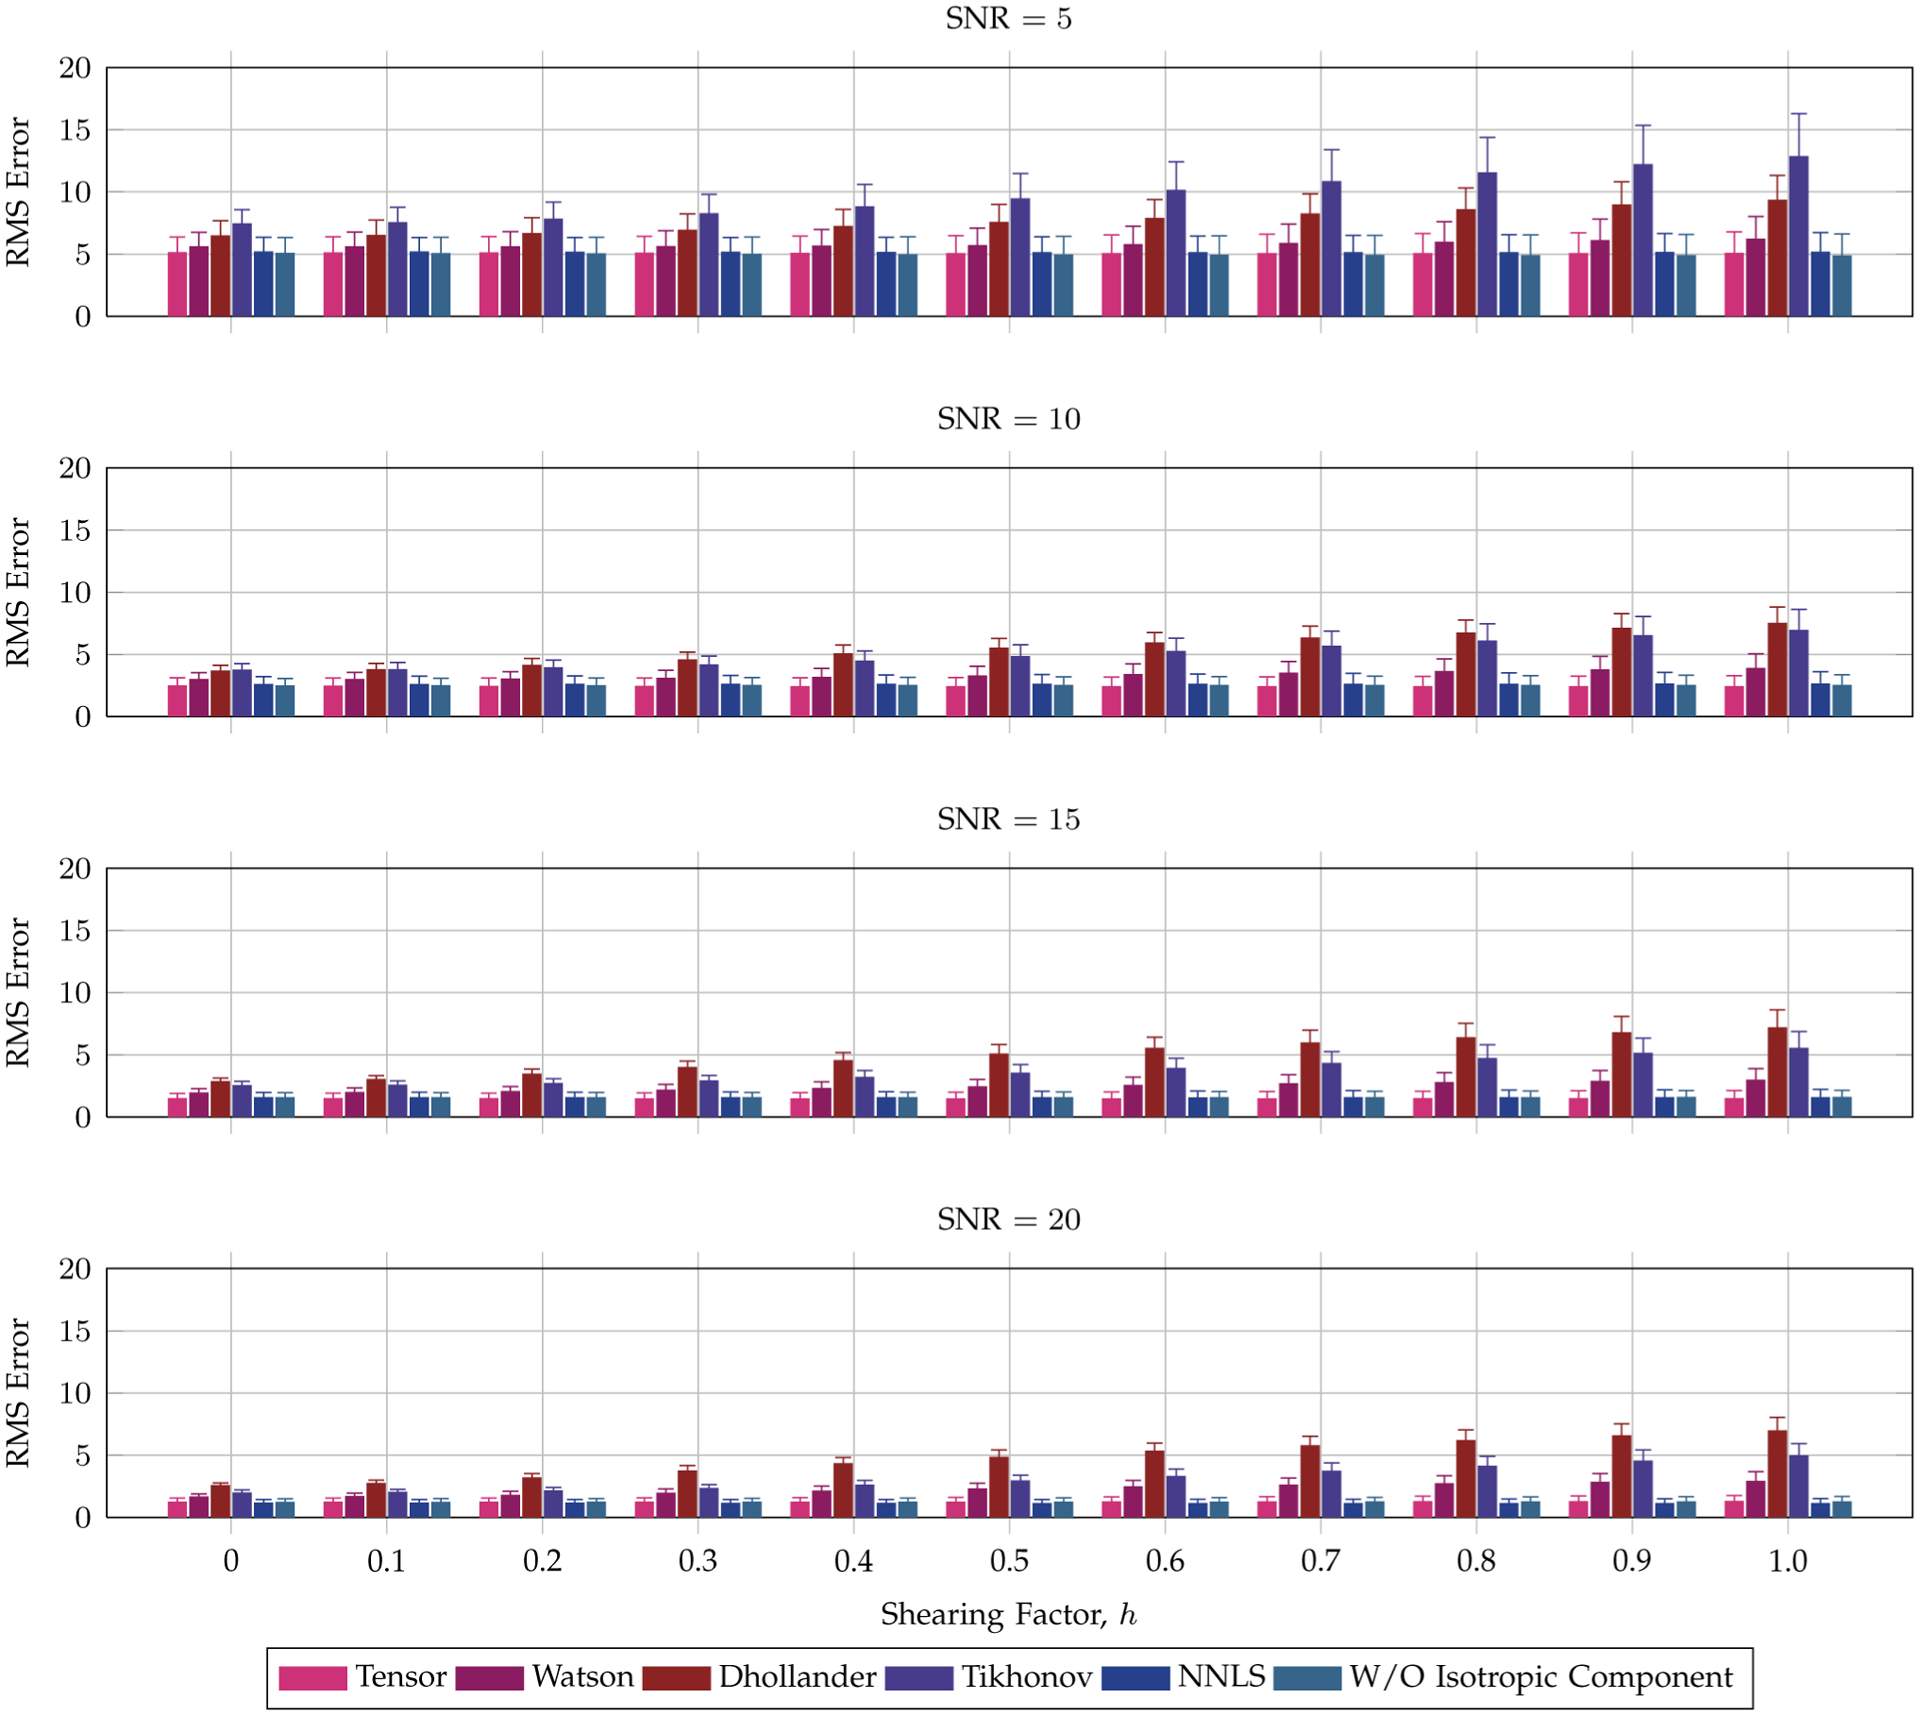
Reorientation accuracy—Anisotropic synthetic data. Average reorientation RMS errors for an anisotropic signal profile, generated using two crossing fiber populations, with respect to the shearing factor h. The error bars indicate the standard deviations. The mean signal value for the ground truth profile is 91.22.
In Fig. 8, we show typical ODFs of the signal profiles that were reoriented using the tensor, Watson, and Dhollander DBFs. The ground truth ODFs were generated from the noiseless (SNR = ∞) signal profile. The reorientation results for the various methods are shown for case of SNR = 10, an SNR that is typical of the in vivo data. It can be observed from the figure that reorientation using the Dhollander DBFs causes significant distortion to the ODF.
Fig. 8.
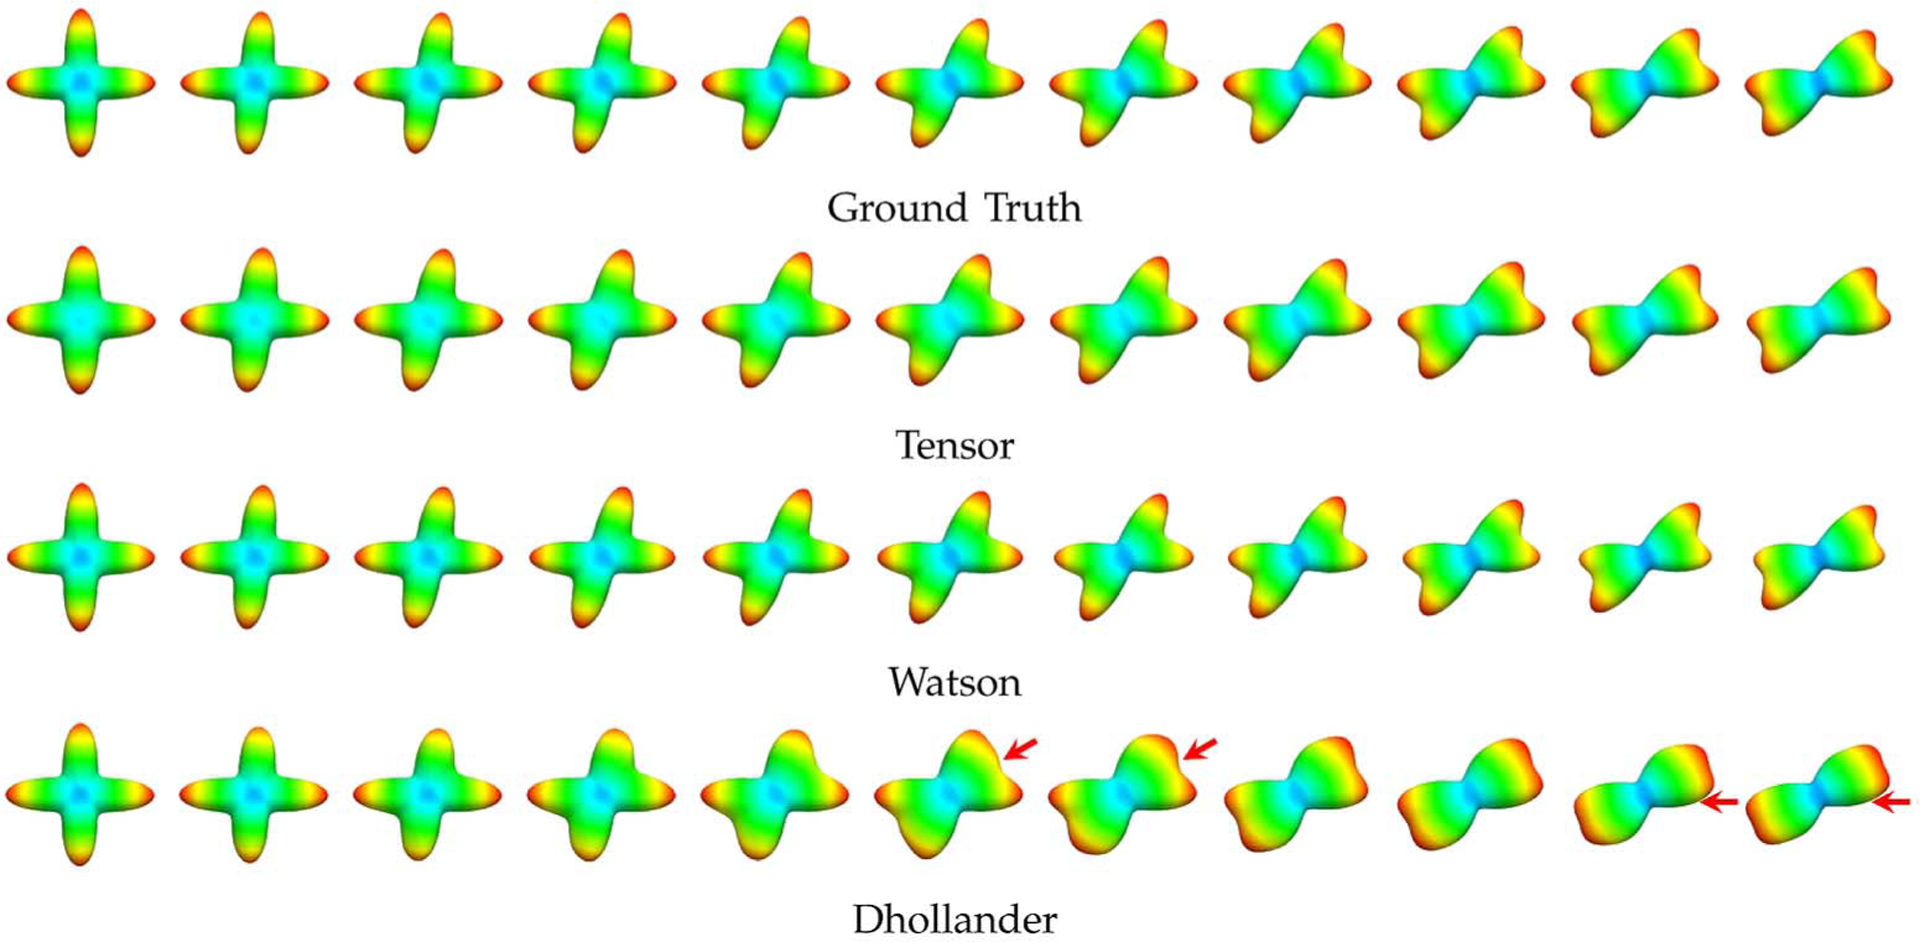
ODFs of reoriented anisotropic profiles. ODFs of reorientated signal profiles (SNR = 10) generated with different amount of shearing (h = 0 on the left-most and h = 1 on the right-most, in steps of 0.1). The red arrows mark problematic areas of the results generated with the Dhollander DBFs.
We also generated an isotropic signal profile with constant signal magnitude S0 exp(−bλ), where b = 2000 s/mm2, λ = 2.5 × 10⁻³ mm2/s, and S0 = 1500. These parameters were chosen to simulate the profile of a typical cerebrospinal fluid voxel. The same transformations above were applied to the profile, giving the results shown in Fig. 9, demonstrating that the tensor, Watson, and Dhollander DBFs give comparable results when sparse representation is employed. Non-sparse solvers, however, do not give satisfactory results. Example ODFs, shown in Fig. 10, again demonstrate that, without explicitly modeling the isotropic diffusion or when the Tiknonov-regularized least-squares or non-negative least-squares solver is used, reorientation of an isotropic profile will result in an anisotropic profile that is inconsistent with the ground truth.
Fig. 9.
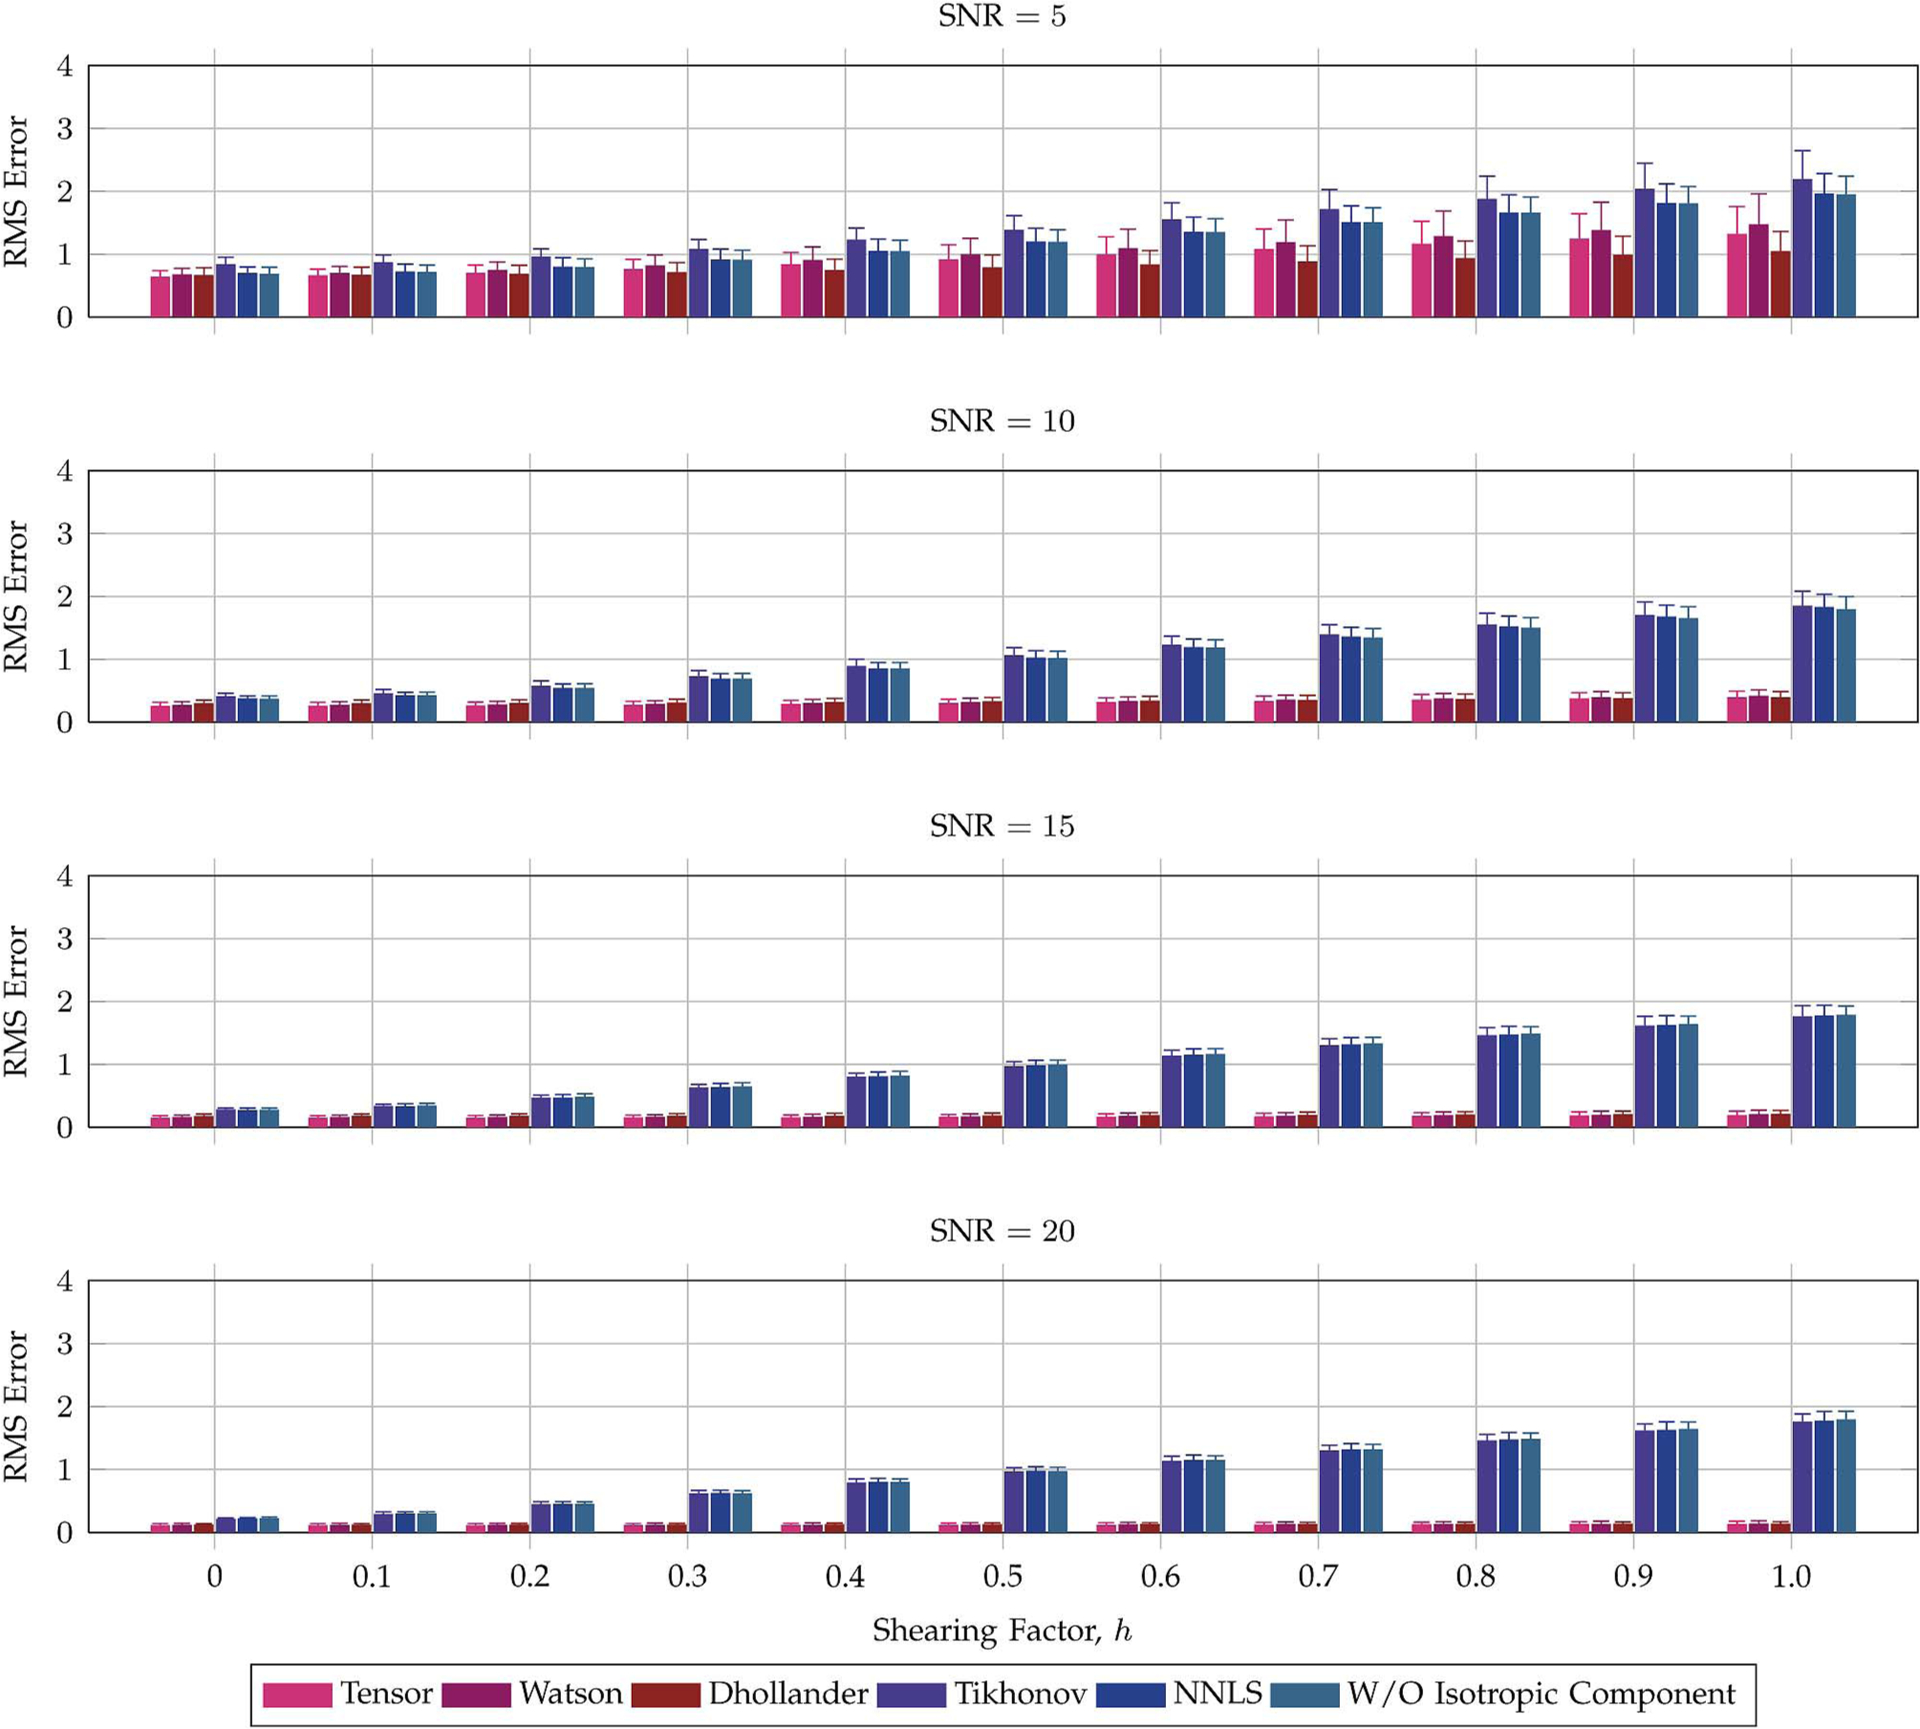
Reorientation accuracy—Isotropic synthetic data. Average reorientation RMS errors for an isotropic profile with respect to the shearing factor h. The error bars indicate the standard deviations. The mean signal value for the ground truth profile is 10.11.
Fig. 10.
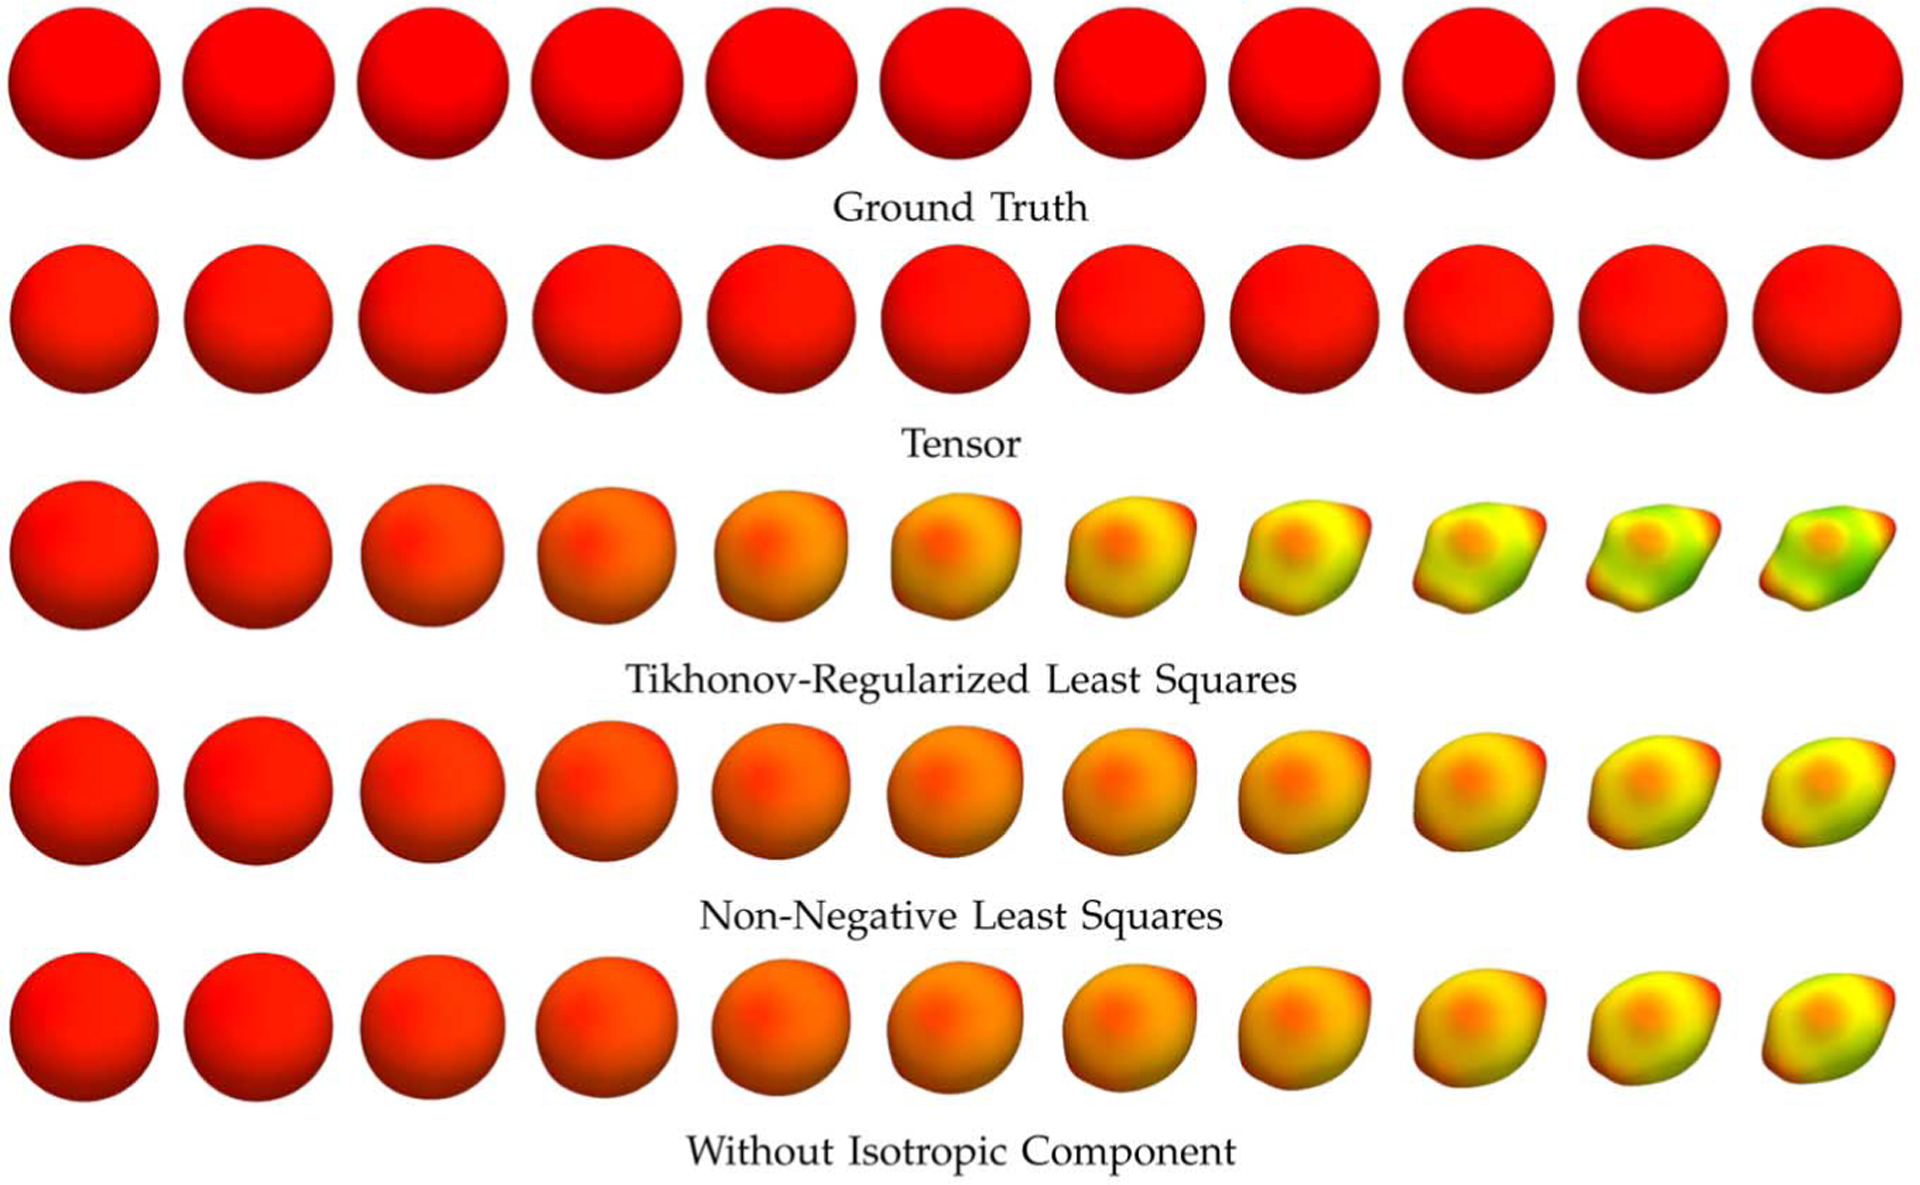
ODFs of reoriented isotropic profiles. ODFs of signal profiles generated by reorientation of an isotropic profile (SNR = 10) in association with different amount of shearing (h = 0 on the left-most and h = 1 on the right-most, in steps of 0.1). Results for the Watson and Dhollander DBFs are omitted since they are very similar to those of the tensor DBFs.
D. Evaluation—In Vivo Data
1). Data Acquisition:
Diffusion-weighted images were acquired for an adult subject using a Siemens 3T TIM Trio MR Scanner with an EPI sequence. Diffusion gradients were applied in 120 noncollinear directions with diffusion weighting b = 2000 s/mm2, repetition time (TR) = 12,400 ms, and echo time (TR) = 116 ms. The imaging matrix was 128 × 128 with a rectangular FOV of 256 × 256 mm2. The slice thickness was 2 mm.
2). Method of Evaluation:
The effectiveness of the tensor, Watson, and Dhollander DBFs in reorientation was evaluated by applying 10 random transformations (see Section III–A) to the in vivo data and then computing a number of metrics to quantify the performance. We measured the change in anisotropy, the change in mean signal, as well as the accuracy in reorienting the local fiber orientations.
The anisotropy of a signal profile is defined as the standard deviation to RMS ratio of the signal values
| (29) |
The mean signal value is computed as
| (30) |
We measured the change of these quantities in association with reorientation. The values of these quantities should ideally be preserved; failure to do so will cause ambiguity in identifying the white matter, grey matter, and cerebrospinal fluid voxels after reorientation. The changes in these quantities were measured using
| (31) |
and
| (32) |
where Δ(·) denotes the difference of the quantity estimated with and without reorientation. The difference was normalized with respect to the mean value of the quantity (before reorientation) throughout the brain region.
We also evaluated the accuracy of the various DBFs in reorienting the local fiber orientations. Local fiber orientations were detected before and after reorientation using the method described in Section II–F. The orientations detected before reorientation were reoriented using the generated transformations so that they can be compared with the orientations that were estimated from the signal profiles after reorientation. Assuming that U is the set of transformed orientations and V is the corresponding set of orientations estimated after profile transformation, the orientational discrepency is defined as
| (33) |
where dθ (u, v) gives the angle difference between u and v, i.e.,
| (34) |
The absolute value is taken since diffusion is assumed to be antipodal symmetric. In cases of multiple local maxima, the term
| (35) |
returns the angle difference between u and a direction v in V that is most closely aligned with u.
3). Results:
The values for ϵanisotropy, ϵmean, and Λ, averaged over all transformations, are shown visually in the form of colored maps in Fig. 11. It can be observed that the tensor and Watson DBFs are more capable than the Dhollander DBFs in preserving the anisotropy of the signal profiles after reorientation. All three types of DBFs preserve the mean signal values very well. Not altering these quantities is important for voxel-based morphometry [33]. Using the tensor and Watson DBFs for reorientation also results in more accurate reorientation of local fiber orientations, which is essential for studies involving white matter tractography [34]–[39].
Fig. 11.
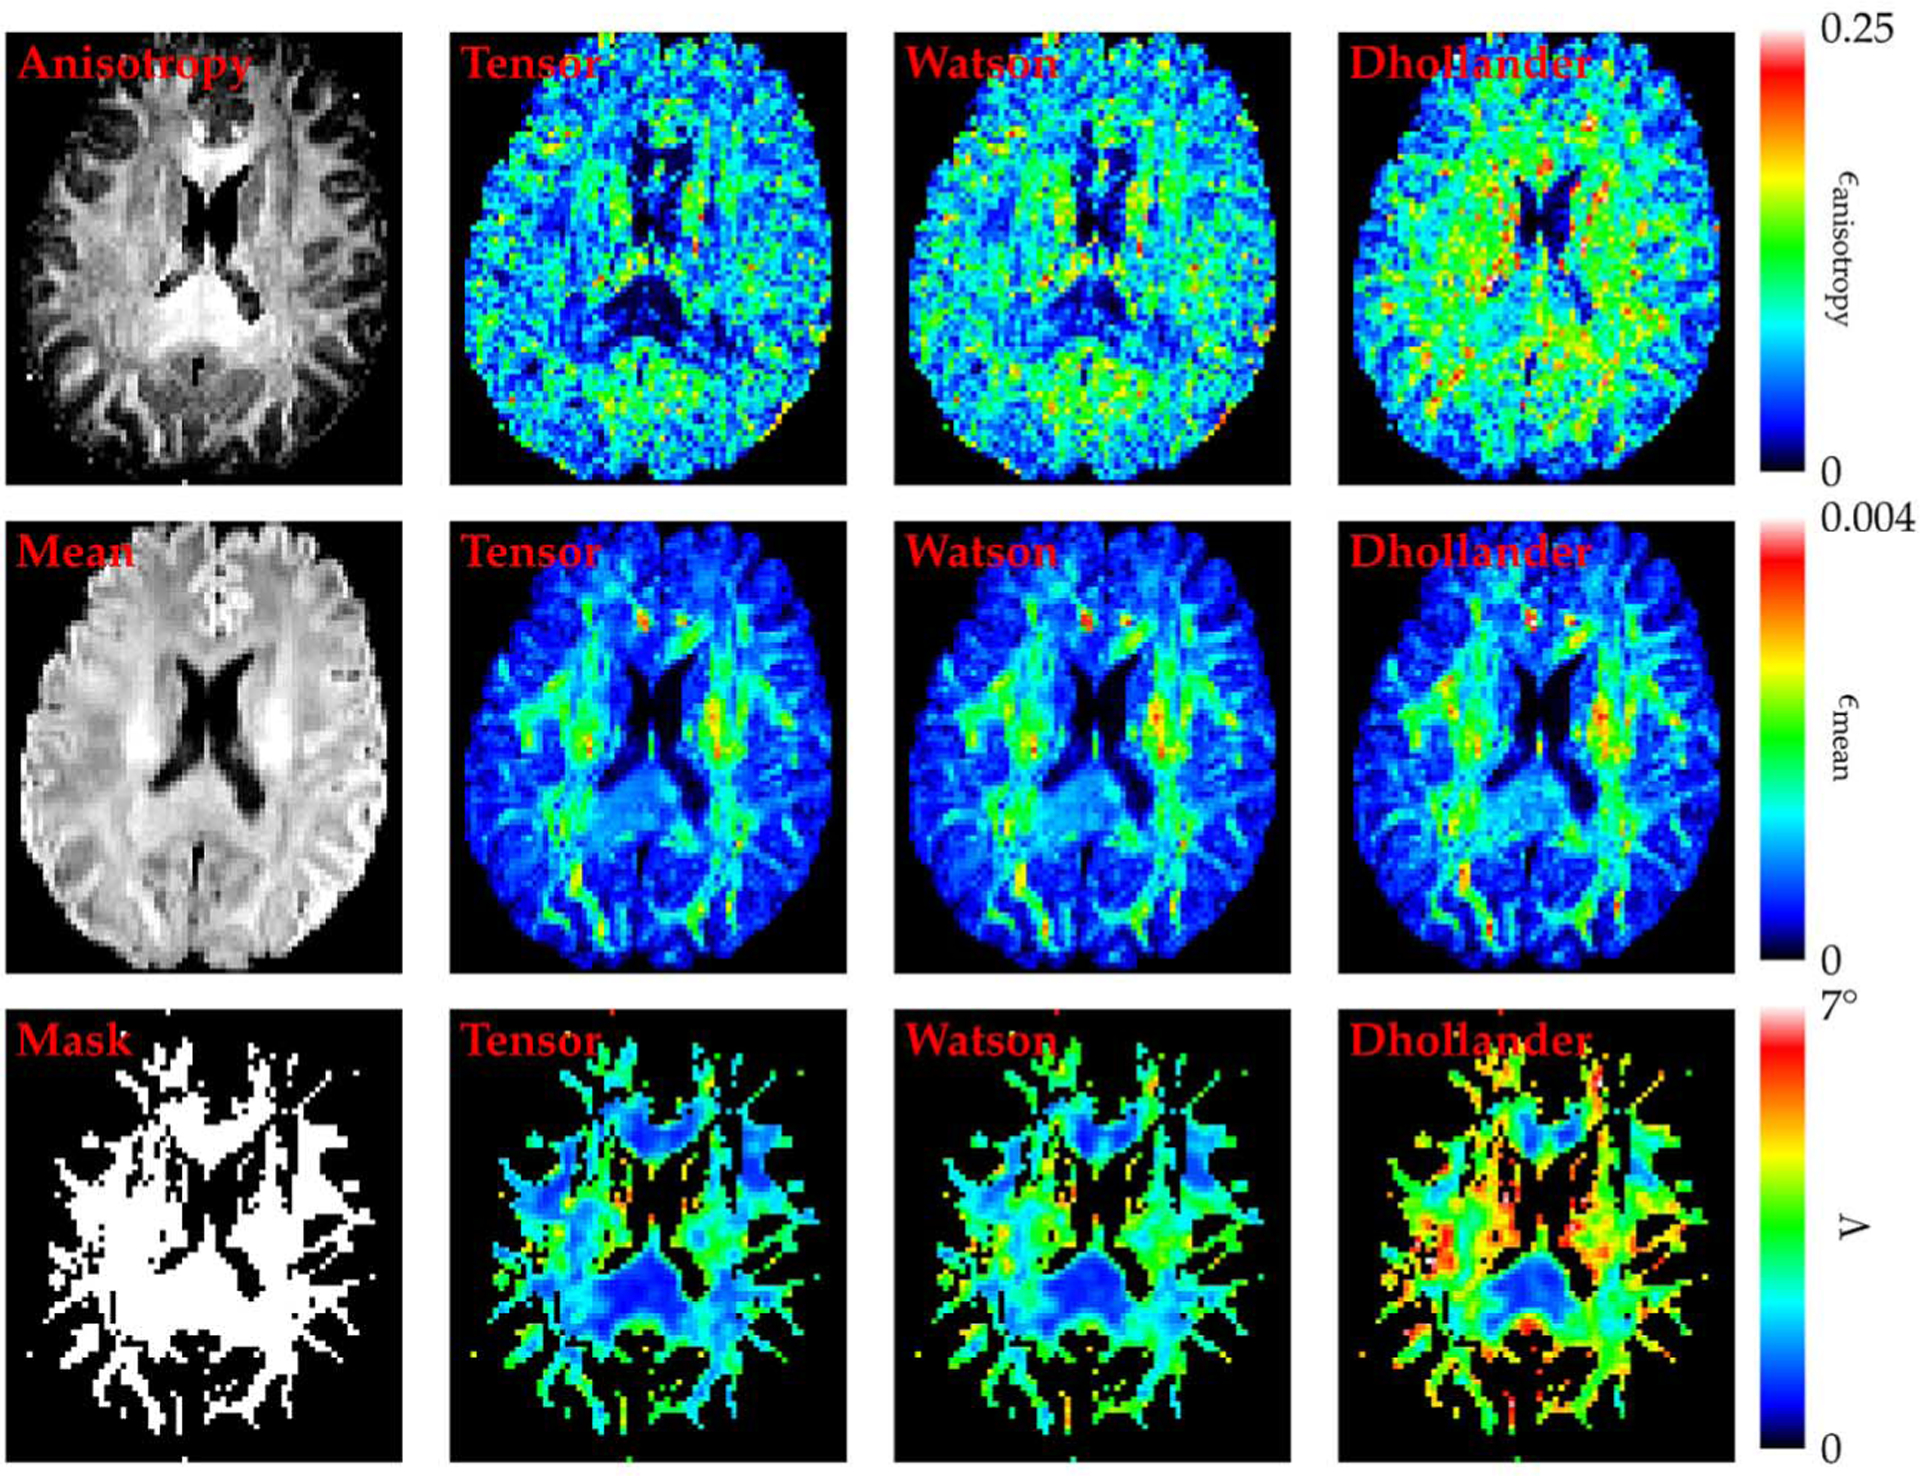
Reorientation performance—in vivo data. The change in anisotropy, the change in mean signal, and the orientational discrepancy in association with the reorientation are shown in the first, second, and third rows, respectively, for the tensor, Watson, and Dhollander DBFs. From top to bottom in the left-most column are the anisotropy image of the DWI data for anatomical reference, the mean signal image, and the mask that were used to ensure that the orientational discrepancy values were only computed for the white matter region.
Fig. 12 shows via box plots the distributions of the brain-region-averaged ϵanisotropy, ϵmean, and Λ over all the applied transformations. The results here are consistent with that shown in Fig. 11, again validating that the tensor and Watson DBFs are able to preserve the anisotropy and the mean signal better than the Dhollander DBFs, and at the same time reorient local fiber orientations with greater accuracy. Paired t-tests indicate that all differences are statistically significant with p < 0.005.
Fig. 12.
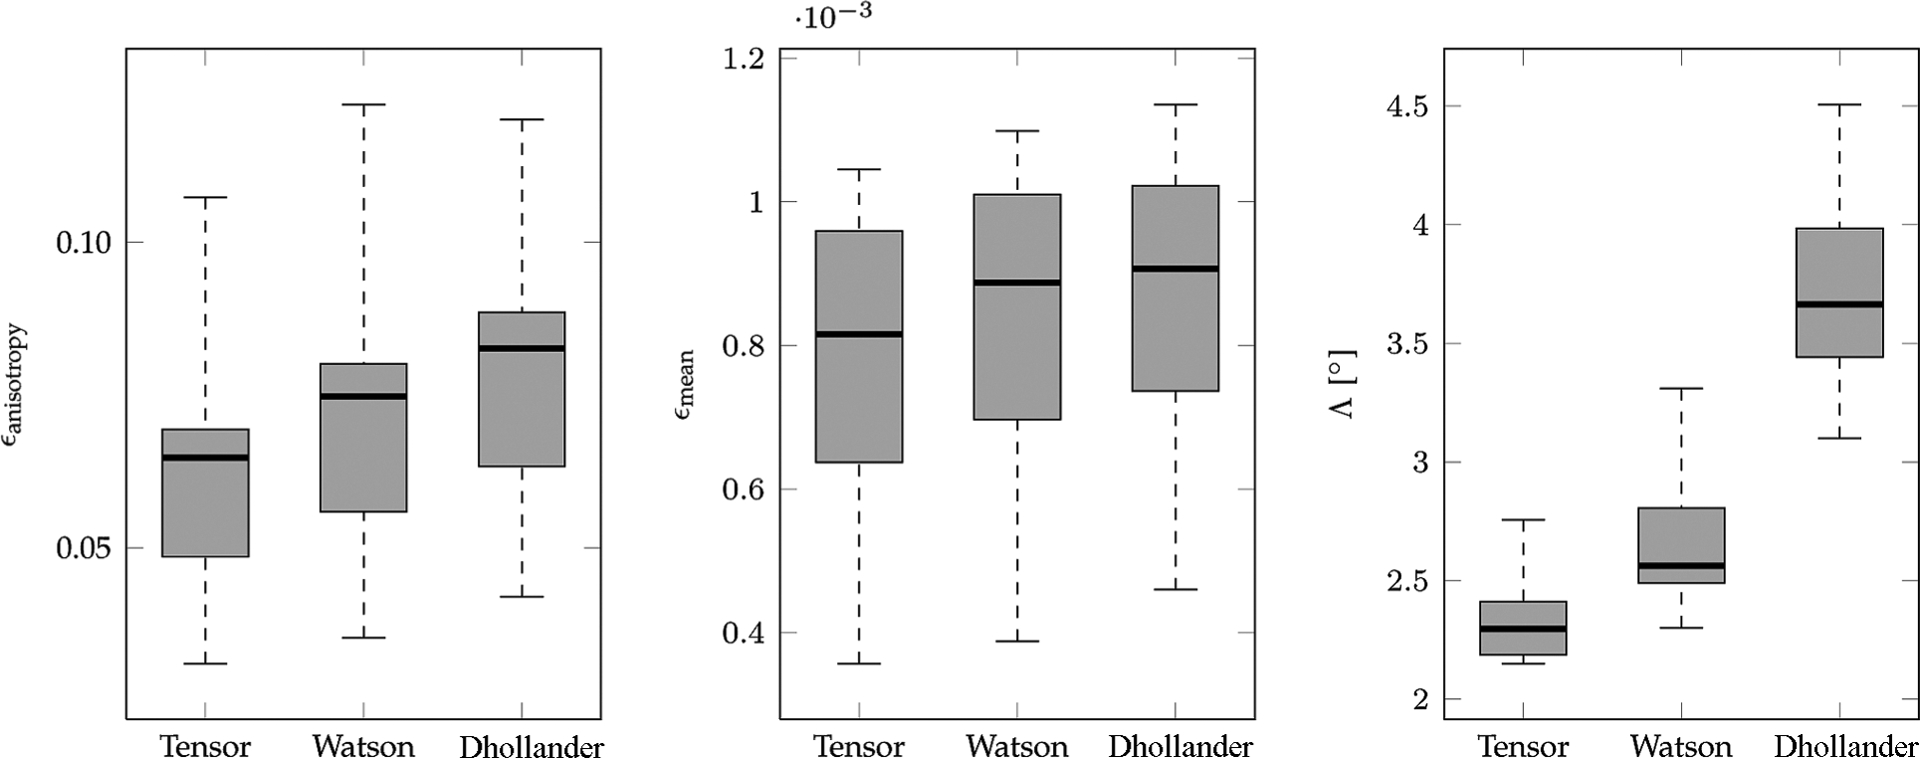
Reorientation performance statistics. The change in anisotropy, the change in isotropy, and the orientational discrepancy in association with reorientation are shown in box plots. The bottom and top of the box are the lower and upper quartiles, respectively. The band near the middle of the box is the median. The ends of the whiskers are the minimum and maximum values.
To show that the isotropic component in the model is indeed effective, we show in Fig. 13 a typical spatial map of the weights associated with the isotropic term. The tensor DBFs are used for the computation of the map. It can be observed that the isotropic diffusion is significant mainly for the gray matter and cerebrospinal fluid voxels, as expected.
Fig. 13.
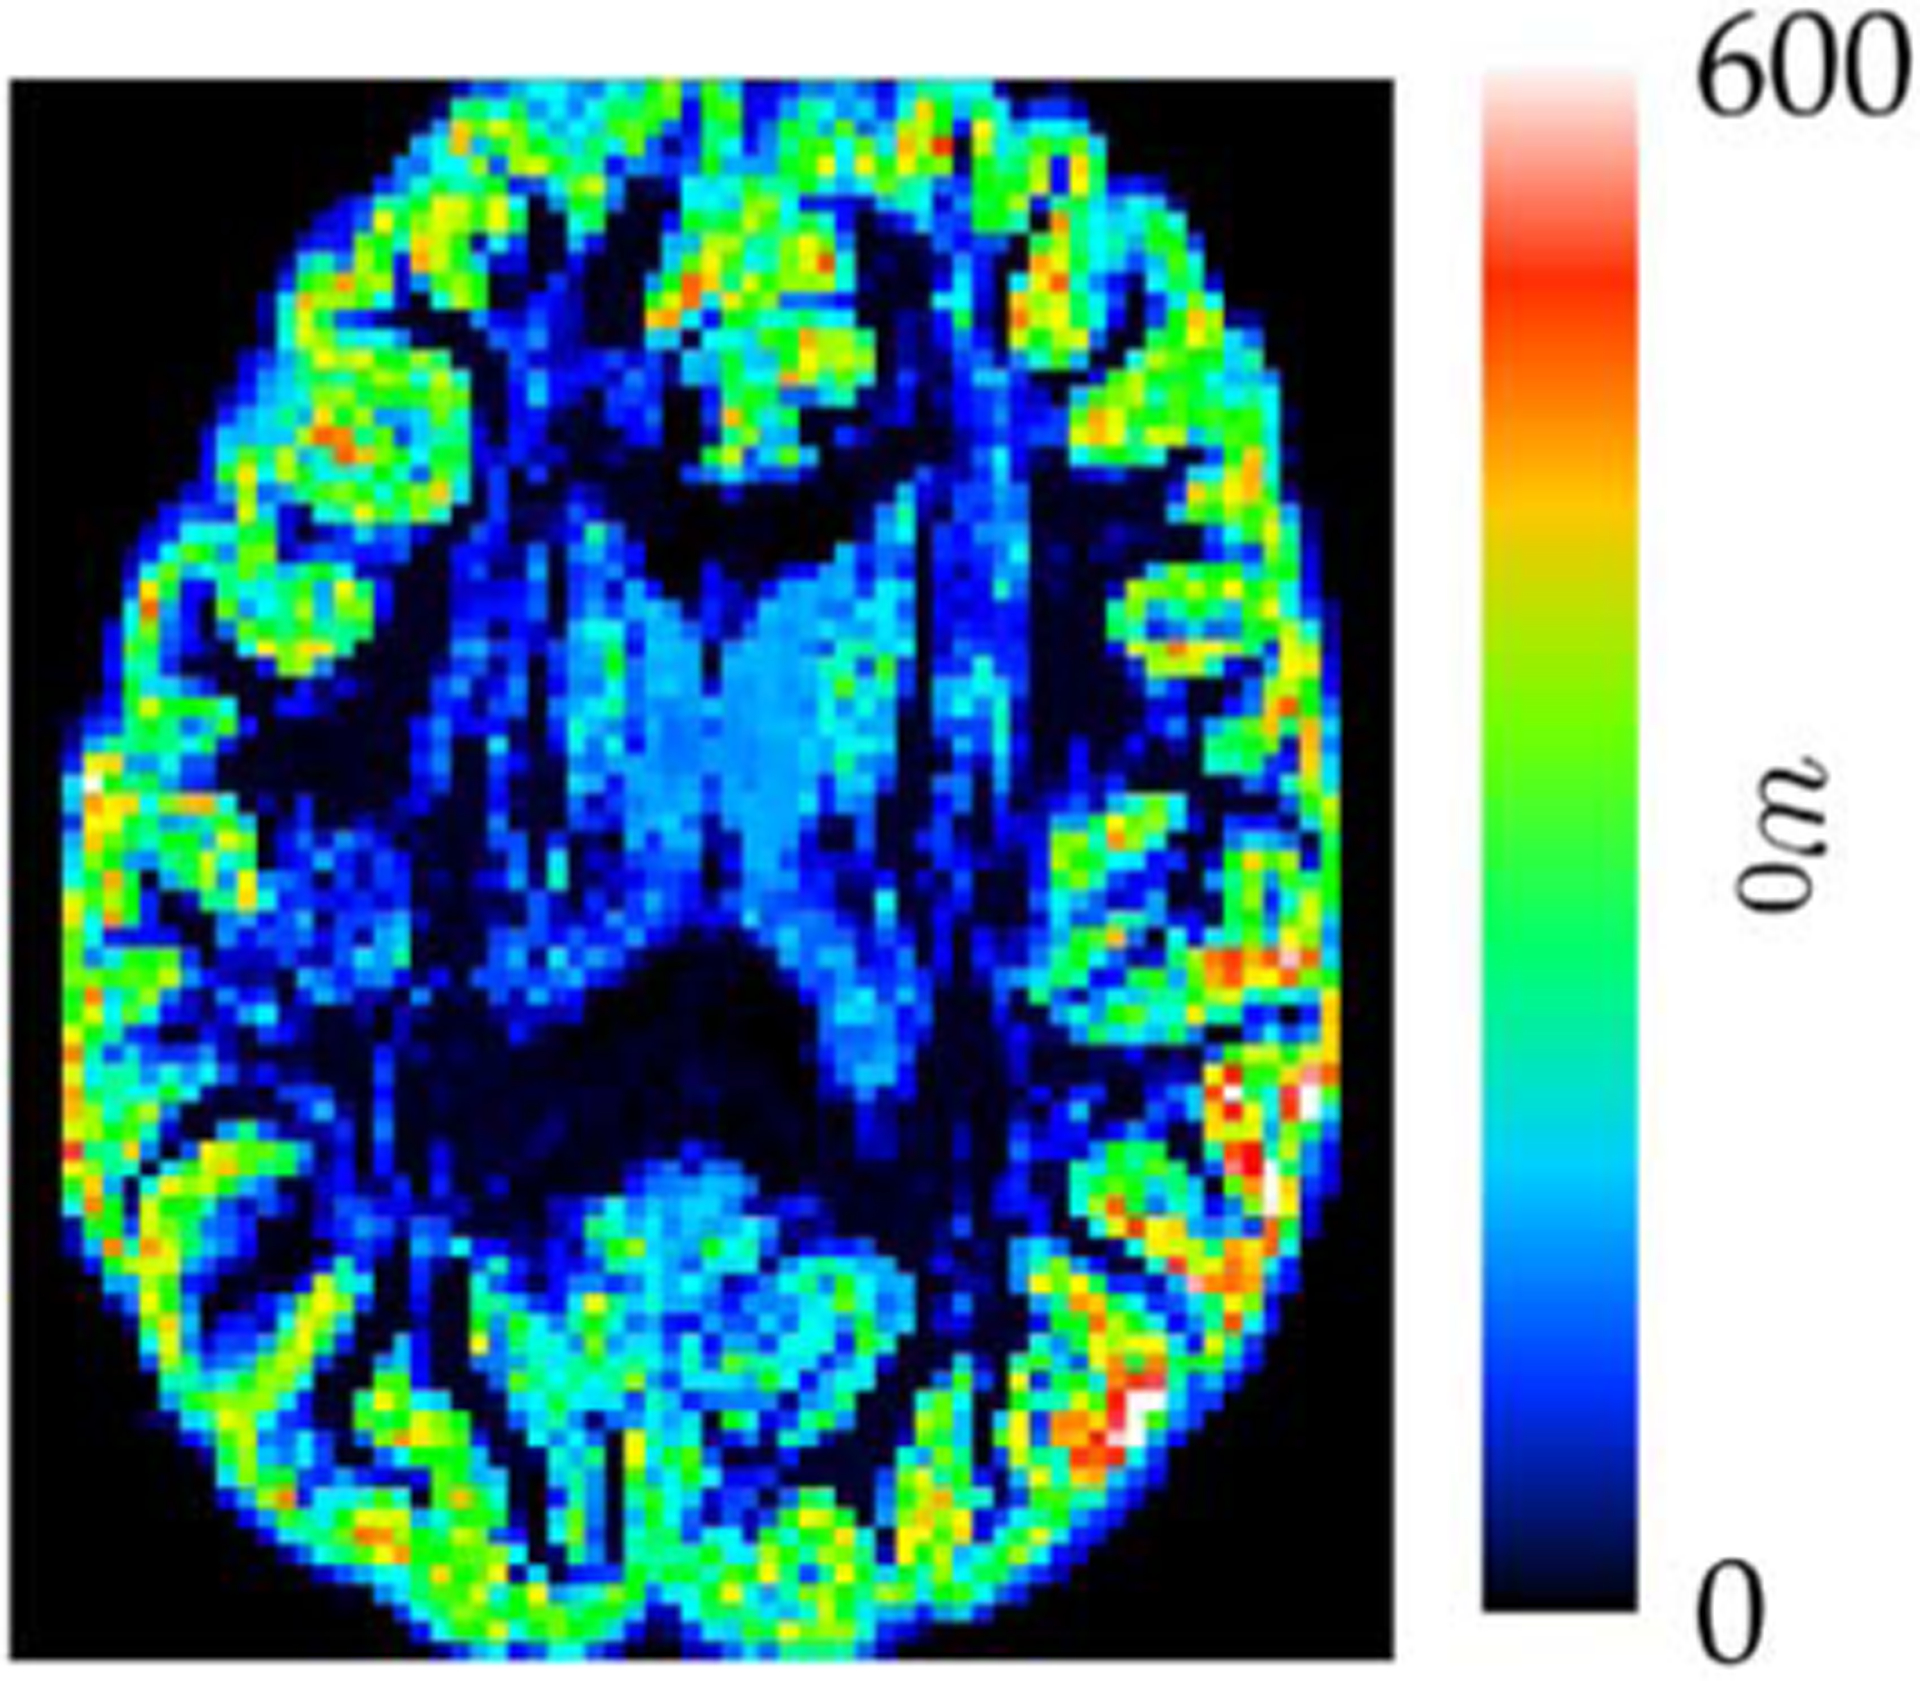
Isotropy. A spatial map of weights associated with the isotropic component. The same slice as that in Fig. 11 is shown.
To assure that the proposed reorientation algorithm produces results that are consistent with brain anatomy, we demonstrate in Fig. 14 that, after reorientation (using the tensor DBFs), the orientations corresponding to the ODF peaks are indeed aligned with the white matter structures.
Fig. 14.

Consistency of orientations with anatomical structures. Consistency of the orientations of the ODF peaks with the anatomical structures is preserved after reorientation in association with a horizontal shear transformation.
IV. Discussion and Conclusion
In this work, we introduced a sparse representation-based DWI data reorientation algorithm. We showed that the decompose-reorient-recompose approach using the tensor DBFs yields the best performance in various aspects, including the preservation of the anisotropy and the mean signal of the diffusion-attenuated signal profile as well as the reorientation accuracy of the local fiber orientations. The Watson DBFs, as approximations of the tensor DBFs, give slightly decreased reorientation performance, but offer the advantage of having a lesser number of parameters to be estimated. The Dhollander DBFs, however, are significantly less effective than the tensor and Watson DBFs.
Generating the Dhollander DBFs involves applying the inverse FRT and the inverse SDT to the SH PSFs of Dirac delta functions [19]. However, since the FRT of the diffusion-attenuated signals gives only an approximation to the ODF, the involvement of the inverse FRT in the process will result in only a set of approximated DBFs. This is aggravated by the fact that the DBFs have to be reconstructed using a truncated SH series. On top of causing approximation error, this will cause artifacts, as shown in Fig. 2. Although this artifact can possibly be reduced by adapting the method described in [20], the accuracy of the resulting DBFs remains uncertain.
The experimental results indicate that good signal representation does not necessarily imply good reorientation performance; methods with similar representation accuracy may result in vastly different reorientation performance. Fig. 9 for example shows that all methods give reasonable representation of the data (see left-most results for no transformation); but as the degree of transformation increases, we can start to observe the inadequacy of some methods in properly reorienting the signal profile.
The current framework can be extended by using multi-compartmental diffusion models that allow for a more elaborate description of the anisotropic and isotropic diffusion contents of tissue micro-structures [40]. Appropriate considerations can then be made for hindered diffusion in the extra-axonal space and restricted diffusion in the intra-axonal space [41]. This will also enable more accurate treatment of the cerebral cortex and subcortical gray matter structures, which are characterized by dendritic processes sprawling in all directions.
In conclusion, we have presented in this paper a novel algorithm for the direct transformation of DWI data. The algorithm takes into account the isotropic diffusion component and can therefore be applied to any voxels without requiring explicitly masking out gray matter and cerebospinal fluid voxels. The ability of the algorithm to work directly with the diffusion-attenuated signal profiles implies that the myriad of existing diffusion models can be fitted to the transformed data for multi-faceted analysis. It is not difficult to envision that future works involving registration, segmentation, and voxel-based analysis using diffusion-weighted images will benefit fundamentally from the current work.
Acknowledgments
This work was supported in part by a University of North Carolina start-up fund and in part by the National Institutes of Health under Grant EB006733, Grant EB008374, Grant EB009634, Grant MH088520, and Grant AG041721.
References
- [1]., Johansen-Berg H and Behrens TE, Eds., Diffusion MRI—From Quantitative Measurement to In vivo Neuroanatomy. New York: Elsevier, 2009. [Google Scholar]
- [2].Yap P-T, Wu G, and Shen D, “Human brain connectomics: Networks, techniques, and applications,” IEEE Signal Process. Mag, vol. 27, no. 4, pp. 131–134, July. 2010. [Google Scholar]
- [3].Yap P-T, Fan Y, Chen Y, Gilmore JH, Lin W, and Shen D, “Development trends of white matter connectivity in the first years of life,” PLoS ONE, vol. 6, no. 9, p. e24678, 2011. [DOI] [PMC free article] [PubMed] [Google Scholar]
- [4].Wee C-Y, Yap P-T, Li W, Denny K, Browndyke JN, Potter GG, Welsh-Bohmer KA, Wang L, and Shen D, “Enriched white matter connectivity networks for accurate identification of MCI patients,” NeuroImage, vol. 54, no. 3, pp. 1812–1822, 2010. [DOI] [PMC free article] [PubMed] [Google Scholar]
- [5].Wee C-Y, Yap P-T, Zhang D, Denny K, Browndyke JN, Potter GG, Welsh-Bohmer KA, Wang L, and Shen D, “Identification of mci individuals using structural and functional connectivity networks,” NeuroImage, vol. 59, no. 3, pp. 2045–2056, 2012. [DOI] [PMC free article] [PubMed] [Google Scholar]
- [6].Klein A, Andersson J, Ardekani BA, Ashburner J, Avants B, Chiang M-C, Christensen GE, Collins DL, Gee J, Hellier P, Song JH, Jenkinson M, Lepage C, Rueckert D, Thompson P, Vercauteren T, Woods RP, Mann JJ, and Parsey RV, “Evaluation of 14 non-linear deformation algorithms applied to human brain MRI registration,” NeuroImage, vol. 46, no. 3, pp. 786–802, 2009. [DOI] [PMC free article] [PubMed] [Google Scholar]
- [7].Yap P-T, Wu G, Zhu H, Lin W, and Shen D, “TIMER: Tensor image morphing for elastic registration,” NeuroImage, vol. 47, pp. 549–563, 2009. [DOI] [PMC free article] [PubMed] [Google Scholar]
- [8].Yap P-T, Chen Y, An H, Yang Y, Gilmore JH, Lin W, and Shen D, “SPHERE: Spherical harmonic elastic registration of HARDI data,” NeuroImage, vol. 55, no. 2, pp. 545–556, 2011. [DOI] [PMC free article] [PubMed] [Google Scholar]
- [9].Yap P-T, Wu G, Zhu H, Lin W, and Shen D, “F-TIMER: Fast tensor image morphing for elastic registration,” IEEE Trans. Med. Imag, vol. 29, no. 5, pp. 1192–1203, May 2010. [DOI] [PMC free article] [PubMed] [Google Scholar]
- [10].Basser P, Mattiello J, and LeBihan D, “MR diffusion tensor spectroscopy and imaging,” Biophys. J, vol. 66, no. 1, pp. 259–267, 1994. [DOI] [PMC free article] [PubMed] [Google Scholar]
- [11].Alexander DC, Pierpaoli C, Basser PJ, and Gee JC, “Spatial transformations of diffusion tensor magnetic resonance images,” IEEE Trans. Med. Imag, vol. 20, no. 11, pp. 1131–1139, November. 2001. [DOI] [PubMed] [Google Scholar]
- [12].Alexander AL, Hasan KM, Lazar M, Tsuruda JS, and Parker DL, “Analysis of partial volume effects in diffusion-tensor MRI,” Magn. Reson. Med, vol. 45, pp. 770–780, 2001. [DOI] [PubMed] [Google Scholar]
- [13].Alexander D, Barker G, and Arridge S, “Detection and modeling of non-Gaussian apparent diffusion coefficient profiles in human brain data,” Magn. Reson. Med, vol. 48, pp. 331–340, 2002. [DOI] [PubMed] [Google Scholar]
- [14].Tuch D, Reese T, Wiegell M, Makris N, Belliveau J, and Wedeen V, “High angular resolution diffusion imaging reveals intravoxel white matter fiber heterogeneity,” Magn. Reson. Med, vol. 48, pp. 577–582, 2002. [DOI] [PubMed] [Google Scholar]
- [15].Ozarslan E and Mareci T, “Generalized diffusion tensor imaging and analytical relationships between diffusion tensor imaging and high angular resolution diffusion imaging,” Magn. Reson. Med, vol. 50, no. 5, pp. 955–965, 2003. [DOI] [PubMed] [Google Scholar]
- [16].Descoteaux M, Angelino E, Fitzgibbons S, and Deriche R, “Regularized, fast, and robust analytical q-ball imaging,” Magn. Reson. Med, vol. 58, pp. 497–510, 2007. [DOI] [PubMed] [Google Scholar]
- [17].Barmpoutis A, Hwang MS, Howland D, Forder JR, and Vemuri BC, “Regularized positive-definite fourth order tensor field estimation from DW-MRI,” NeuroImage, vol. 45, pp. S153–S162, 2009. [DOI] [PMC free article] [PubMed] [Google Scholar]
- [18].Hong X, Arlinghaus L, and Anderson A, “Spatial normalization of the fiber orientation distribution based on high angular resolution diffusion imaging data,” Magn. Reson. Med, vol. 61, no. 6, pp. 1520–1527, 2009. [DOI] [PMC free article] [PubMed] [Google Scholar]
- [19].Raffelt D, Tournier J-D, Fripp J, Crozier S, Connelly A, and Salvado O, “Non-linear spatial normalisation of high angular resolution diffusion imaging data using fiber orientation distributions,” in Diffusion Modelling and the Fibre Cup, MICCAI, 2009. [Google Scholar]
- [20].Raffelt D, Tournier J-D, Crozier S, Connelly A, and Salvado O, “Reorientation of fiber orientation distributions using apodized point spread functions,” Magn. Reson. Med, vol. 67, no. 3, pp. 844–855, 2012. [DOI] [PubMed] [Google Scholar]
- [21].Dhollander T, Van Hecke W, Maes F, Sunaert S, and Suetens P, “Spatial transformations of high angular resolution diffusion imaging data in -space,” in MICCAI CDMRI Workshop, September. 2010, pp. 73–83. [Google Scholar]
- [22].Tournier J-D, Calamante F, Gadian DG, and Connelly A, “Direct estimation of the fiber orientation density function from diffusion-weighted MRI data using spherical deconvolution,” NeuroImage, vol. 23, no. 3, pp. 1176–1185, 2004. [DOI] [PubMed] [Google Scholar]
- [23].Tournier J-D, Calamante F, and Connelly A, “Robust determination of the fibre orientation distribution in diffusion MRI: Non-negativity constrained super-resolved spherical deconvolution,” NeuroImage, vol. 35, no. 4, pp. 1459–1472, 2007. [DOI] [PubMed] [Google Scholar]
- [24].Ramirez-Manzanares A, Rivera M, Vemuri BC, Carney P, and Mareci T, “Diffusion basis functions decomposition for estimating white matter intra-voxel fiber geometry,” IEEE Trans. Med. Imag, vol. 26, no. 8, pp. 1091–1102, August. 2007. [DOI] [PubMed] [Google Scholar]
- [25].Jian B and Vemuri BC, “A unified computational framework for deconvolution to reconstruct multiple fibers from diffusion weighted MRI,” IEEE Trans. Med. Imag, vol. 26, no. 11, pp. 1464–1471, November. 2007. [DOI] [PMC free article] [PubMed] [Google Scholar]
- [26].Watson G, “Equatorial distributions on a sphere,” Biometrika, vol. 52, pp. 193–201, 1965. [Google Scholar]
- [27].Behrens T, Woolrich M, Jenkinson M, Johansen-Berg H, Nunes R, Clare S, Matthews P, Brady J, and Smith S, “Characterization and propagation of uncertainty in diffusion-weighted MR imaging,” Magn. Reson. Med, vol. 50, no. 5, pp. 1077–1088, 2003. [DOI] [PubMed] [Google Scholar]
- [28].Chen SS, Donoho DL, and Saunders MA, “Atomic decomposition by basis pursuit,” SIAM Rev, vol. 43, no. 1, pp. 129–159, 2001. [Google Scholar]
- [29].Lee H, Battle A, Raina R, and Ng AY, “Efficient sparse coding algorithms,” in NIPS, 2007, pp. 801–808. [Google Scholar]
- [30].Alexander DC, “An Introduction to Computational Diffusion MRI: The Diffusion Tensor and Beyond,” in Visualization and Processing of Tensor Fields. Berlin, Germany: Springer, 2006, pp. 83–106. [Google Scholar]
- [31].Aganj I, Lenglet C, and Sapiro G, “ODF reconstruction in Q-ball imaging with solid angle consideration,” in IEEE International Symposium on Biomedical Imaging, 2009, pp. 1398–1401. [DOI] [PMC free article] [PubMed] [Google Scholar]
- [32].Descoteaux M, Deriche R, Knösche TR, and Anwander A, “Deterministic and probabilistic tractography based on complex fibre orientation distributions,” IEEE Trans. Med. Imag, vol. 28, no. 2, pp. 269–285, February. 2009. [DOI] [PubMed] [Google Scholar]
- [33].Ashburner J and Friston KJ, “Voxel-based morphometry—The methods,” NeuroImage, vol. 11, no. 6, pp. 805–821, 2000. [DOI] [PubMed] [Google Scholar]
- [34].Yap P-T, Gilmore JH, Lin W, and Shen D, “POPTRACT: Population-based tractography,” IEEE Trans. Med. Imag, vol. 30, no. 10, pp. 1829–1840, October. 2011. [DOI] [PMC free article] [PubMed] [Google Scholar]
- [35].Yap P-T, Gilmore JH, Lin W, and Shen D, “Longitudinal tractography with application to neuronal fiber trajectory reconstruction in neonates,” in MICCAI, Toronto, ON, Canada, September. 2011, vol. 14, pp. 66–73. [DOI] [PMC free article] [PubMed] [Google Scholar]
- [36].Wang Q, Yap P-T, Wu G, and Shen D, “Diffusion tensor image registration with combined tract and tensor features,” in MICCAI, Toronto, ON, Canada, September. 2011, pp. 200–208. [DOI] [PubMed] [Google Scholar]
- [37].Wang Q, Yap P-T, Wu G, and Shen D, “Fiber modeling and clustering based on neuroanatomical features,” in MICCAI, Toronto, ON, Canada, 2011, pp. 17–24. [DOI] [PubMed] [Google Scholar]
- [38].Nie J, Guo L, Li K, Wang Y, Chen G, Li L, Chen H, Deng F, Jiang X, Zhang T, Huang L, Faraco C, Zhang D, Guo C, Yap P-T, Hu X, Li G, Lv J, Yuan Y, Zhu D, Han J, Sabatinelli D, Zhao Q, Miller LS, Xu B, Shen P, Platt S, Shen D, Hu X, and Liu T, “Axonal fiber terminations concentrate on Gyri,” Cerebral Cortex, 2012, to be published. [DOI] [PMC free article] [PubMed] [Google Scholar]
- [39].Wang Q, Yap P-T, Wu G, and Shen D, “Application of neuroanatomical features to tractography clustering,” Human Brain Mapp., 2012, to be published. [DOI] [PMC free article] [PubMed] [Google Scholar]
- [40].Panagiotaki E, Schneider T, Siow B, Hall MG, Lythgoe MF, and Alexander DC, “Compartment models of the diffusion mr signal in brain white matter: A taxonomy and comparison,” NeuroImage, vol. 59, no. 3, pp. 2241–2254, 2012. [DOI] [PubMed] [Google Scholar]
- [41].Assaf Y and Basser PJ, “Composite hindered and restricted model of diffusion (charmed) MR imaging of the human brain,” NeuroImage, vol. 27, no. 1, pp. 48–58, 2005. [DOI] [PubMed] [Google Scholar]


