

Abstract
Background
Glomerular filtration rate (GFR) decline ≥30% over 2 years can substitute for the conventional ‘doubling of serum creatinine’ to predict end-stage renal disease in patients with native kidneys. While chronic kidney disease trajectory is less predictable in transplanted patients, recent data have suggested that similar GFR decline might be an acceptable surrogate for long-term transplant outcome. We sought (i) to confirm the prognostic value of an early GFR decline in kidney transplant recipients and (ii) to determine whether using direct measurement of GFR with inulin improves the performance of this surrogate.
Methods
We retrospectively analysed all recipients transplanted between 1989 and 2000 in our centre, with inulin-measured and Chronic Kidney Disease Epidemiology Collaboration (CKD-EPI)-estimated GFR at 1 and 5 years post-transplant, and evaluated the performance [time-dependent area under the receiver operating characteristic curve (ROC AUC) and subdistribution hazard ratio (sdHR) with competing risk model] of GFR change to predict graft failure and all-cause mortality.
Results
Out of 417 kidney transplant recipients, 116 patients had lost their graft and 77 had died 16 years after transplantation. While being significantly associated with graft failure [sdHR = 2.37 (95% confidence interval 1.47–3.83)], CKD-EPI-GFR decline ≥30% failed to appropriately predict long-term graft survival (C-statistics of 0.63). Concordance between inulin-GFR and CKD-EPI-GFR to detect similar GFR change was only 53%. Inulin-GFR change was, however, not a better predictor (C-statistics of 0.59). Comparable results were observed for mortality.
Conclusions
Our data suggest that early GFR decline is a poor surrogate for long-term transplant outcome, even when change in GFR is directly measured by a reference method.
Keywords: CKD-EPI equation, glomerular filtration rate decline, inulin, kidney transplantation, prognosis
INTRODUCTION
The ultimate goal of any therapeutic strategy in transplantation is to increase both graft and patient survivals. In the context of clinical trials, those so-called hard endpoints are problematic. They usually occur very late in the course of a kidney transplantation and are thus not easy to capture during the short observational period of most trials. One solution is to develop surrogate markers that are easily assessed during the early post-transplant period and reliably substitute for long-term outcome [1–4]. In kidney transplantation, the 1-year post-transplant graft function evaluated by serum creatinine (SCr) concentration or even better, by creatinine-estimated glomerular filtration rate (eGFR), has long been and is still used as a primary endpoint in many transplant trials [5]. However, its value as a proxy for late complications has been seriously questioned. While significantly associated with graft loss [3, 6–8], the level of renal graft function at a fixed time point post-transplant remains a poor predictor of long-term outcome. This is primarily due to its static nature. Not surprisingly, alternative dynamic approaches taking into account GFR change over a certain period of time provide better prediction. We and others have previously reported that slope of GFR over time was much more strongly associated to graft and recipients’ survival than the GFR value observed at the end of the first-year post-transplant [9–11]. More recently, Clayton et al. gave further credence to the longitudinal evaluation of GFR as an operational surrogate marker for kidney transplant-related long-term complications [12]. Following the demonstration that in patients with chronic native kidneys disease, an eGFR decline ≥30% over 2 years was a sharp indicator as the classical ‘doubling of SCr concentration’ [13], they proposed to validate this 30% cut point for predicting long-term adverse outcome in kidney transplant recipients.
Commonly used creatinine-based estimating GFR equations [i.e. the Modification of Diet in Renal Disease (MDRD) Study equation and the Chronic Kidney Disease Epidemiology Collaboration (CKD-EPI) equation] have been derived from non-transplant patients and may lack accuracy in the context of kidney transplantation [14–16]. The inability of those equations to optimally reflect true GFR might be concerning, especially in the context of clinical trials using renal graft function as an endpoint. In this situation, the systematic utilization of a reference method to directly measure GFR can be justified [17–19]. As for longitudinal GFR change, Gera et al. showed that GFR estimating equations greatly underestimate the true decline of renal graft function [20]. Extended to the notion that a GFR decline ≥30% could be an appropriate surrogate endpoint in transplant trials, those considerations suggest that measuring, rather than estimating, GFR decline might even further improve its prognosis performance. Whether a direct measurement of GFR confers a better prediction of long-term morbidities associated with kidney transplantation is, however, not certain. Creatinine eGFR might actually integrate prognosis information that is not captured by reference methods using exogenous GFR markers [21]. Interestingly, two recent studies have reported that, as compared with eGFR, decline in measured GFR (mGFR) did not consistently show stronger association with the risk of mortality and end-stage renal disease (ESRD) in patients with native kidneys [22, 23]. To our knowledge, similar comparison has never been carried out for kidney transplant recipients.
Herein, we sought to evaluate, in kidney transplantation, the performance of the creatinine-based CKD-EPI equation to detect a decline in GFR ≥30% and to test its ability to predict 16-year post-transplant graft and patient survival in comparison with a GFR decline of the same magnitude but measured by inulin clearance.
MATERIALS AND METHODS
Study population
We analysed all single kidney transplantations performed in the transplant centre of Saint-Etienne (France) between January 1989 and December 2000 (n = 621). We selected patients having a functioning graft at 5 years post-transplant and for whom inulin-mGFR was available, corresponding to the 1 and 5 years post-transplant, with concomitant SCr dosage (n = 417). Patients were followed-up to death or to 31 December 2016. The study protocol was approved by our Institutional Review Board and was conducted in accordance with good international clinical practice guidelines.
Evaluation of GFR
GFR measurement by inulin clearance
Urinary clearance of inulin was conducted according to the continuous infusion method. After a loading dose of 300 mg/kg (half-dose if SCr concentration was >160 µmol/L) of INUTEST™ 25% (Fresenius, Linz, Austria), continuous infusion of 400 mg/kg of inulin diluted in a 10% mannitol solution was started. After an equilibration period of 45 min, two or three clearance periods of 30 min each were analysed. Urine samples were collected by spontaneous voiding. Blood samples, drawn from the arm opposite the infusion site, were obtained at the midpoint of each clearance period. Inulin concentrations were quantified according to standard colorimetric assay (resorcinol method) on a UV1205 spectrophotometer (Shimadzu, Kyoto, Japan). GFR was measured as the mean of at least two urinary clearances of inulin with the formula UV/P, where U and P are inulin concentrations in urine and plasma, respectively, and V is urine flow rate (mL/min). GFR was corrected per 1.73 m2 of body surface area. In our centre, the mean intra-individual coefficient of variation for this inulin clearance procedure has been previously determined at 8.4%.
GFR estimation by CKD-EPI formula
SCr was collected at the same day of the inulin clearance measurement. GFR was estimated using the CKD-EPI 2009 creatinine-based equation:
where Scr is serum creatinine in mg/dL; κ = 0.7 for females and 0.9 for males; α = −0.329 for females and −0.411 for males; min indicates the minimum of Scr/κ or 1 and max indicates the maximum of Scr/κ or 1.
SCr concentrations were quantified by an isotope dilution mass spectrometry (IDMS)-traceable enzymatic method (Crea Vitros, Ortho-Clinical Diagnostics, Issy-les-Moulineaux, France).
Evaluation of GFR decline
GFR change was calculated as the relative variation between 1 and 5 years post-transplant: (5-year post-transplant GFR – 1-year post-transplant GFR)/(1-year post-transplant GFR) × 100%. Percent change in GFR was evaluated over a 4-year period since inulin clearance determination is routinely performed in our centre at 1 and 5 years after transplantation.
Outcomes
Two outcomes were considered: graft loss defined as initiation of dialysis or pre-emptive retransplantation and all-cause mortality. For each patient, occurrence of those two outcomes was monitored over a fixed, pre-specified follow-up period of 16-year post-transplantation.
Statistics
Distribution and agreement between mGFR versus eGFR variation between 1 and 5 years post-transplant were analysed by the Bland and Altman method.
Prognostic evaluation of GFR change between Years 1 and 5 as a risk factor for transplant outcomes was conducted for a fixed follow-up of 11 years after the fifth anniversary of transplantation. Three thresholds for mGFR or eGFR decline were tested: −20, −30 and −50%. We primarily chose the threshold of −30% since it was recently validated in both the general and transplant populations. Additionally, to test the robustness of our result, we wanted to test also a more stringent (−50%) and a more liberal threshold (−20%). For each of these thresholds, patients were distributed into three categories of risk: GFR increase, GFR decline inferior to the threshold and GFR decline superior to the threshold.
Firstly, we compared the risk of cumulative incidences of all-cause mortality and graft loss with a subdistribution hazard competing risk model (Fine and Gray).
Secondly, respective performances of mGFR and eGFR changes as predictors of 16-year post-transplant outcomes were analysed by comparing:
(i) In terms of discrimination, C-statistics from time-dependent ROC AUC.
(ii) In terms of calibration, subdistribution hazard ratio (HR) of all-cause mortality and graft failure.
A P-value of 0.05 was the level for statistical significance in all analyses.
Patients lost to follow-up were censored at latest news.
SAS software version 9 (SAS Institute, Cary, NC, USA) and R package ‘https://cran.r-project.org/web/packages/timeROC/timeROC.pdf’ were used to calculate and compare C-statistics.
RESULTS
Study population
Out of 621 kidney transplantations performed between 1989 and 2000 in our centre, 491 recipients had a functioning graft at 1 year post-transplant and had undergone an inulin clearance evaluation. Among them, 417 had a functioning graft at 5 years post-transplant along with a usable value of inulin clearance. Flow chart and characteristics of the study population are displayed in Figure 1 and Table 1, respectively.
FIGURE 1:

Flowchart detailing the exclusion and inclusion criteria for the creation of the population study cohort.
Table 1.
Characteristics of the study population
| Recipients (n = 417)—at the time of transplant | |
|---|---|
| Age (mean ± SD), years | 45.2 ± 12.5 |
| Male gender, n (%) | 290 (69) |
| Cause of renal disease, n (%) | |
| Glomerulopathy | 140 (34) |
| Diabetes | 4 (1) |
| Polycystic kidney disease | 59 (14) |
| Hypertension | 30 (7) |
| Interstitial nephritis | 30 (7) |
| Other | 52 (13) |
| Unknown | 102 (24) |
| Pre-emptive transplantation, n (%) | 37 (9) |
| Retransplantation, n (%) | 65 (15) |
| Donors | |
| Age (mean ± SD), years | 38.2 ± 13.7 |
| Male, n (%) | 295 (72) |
| Living donor, n (%) | 13 (3) |
| Transplantation—baseline and 1 year of transplantation | |
| Cold ischaemia (mean ± SD), h | 26.72 ± 9.3 |
| HLA mismatches >3, n (%) | 280 (67) |
| PRA >80% | 34 (8) |
| Delayed graft function, n (%) | 102 (24) |
| 1-year rejection, n (%) | 169 (41) |
| Steroid sensitive | 98 (24) |
| Recipients—at 1-year post-transplantation | |
| ≥1 Antihypertensive drug, n (%) | 327 (79) |
| Inulin clearance (mean ± SD), mL/min/1.73 m2 | 47.7 ± 13.1 |
| Urinary protein creatinine ratio (mean ± SD), mg/g | 184 ± 528.8 |
| Proteinuria <300, n (%) | 312 (75) |
| 300 ≤ proteinuria < 1000, n (%) | 47 (11) |
| 1000 ≤ proteinuria, n (%) | 18 (4) |
| Not available | 40 (10) |
| Immunosuppressive regimen, n (%) | |
| Without CNI | 12 (3) |
| With CNI | 405 (97) |
PRA: panel reactive antibodies; HLA: human leucocyte antigen; CNI: calcineurin inhibitor.
Concordance between eGFR and mGFR changes
Overall, inulin clearance value increased between 1 and 5 years post-transplant with a median change of +2.9% [interquartile range (IQR) −17.9 to +28.6]. In contrast, the CKD-EPI estimation resulted in a slight GFR decline with a median change of −0.2% (IQR −19.0 to +17.6; P = 0.0004). Bland and Altman analysis showed a poor concordance between eGFR and mGFR change with limits of agreement ranging from −90.1 to 72.1%. Among the 70 recipients with an inulin clearance decline ≥30%, only 37 patients were detected as such when GFR change was estimated using the CKD-EPI equation. Among them, 30 (81%) had experienced the event graft failure (n = 20) or all-cause mortality (n = 10). Out of the 62 patients with a CKD-EPI-eGFR decline ≥30%, 45 had experienced the event graft failure/all-cause mortality. Among the latter, one-third had an inulin clearance decline <30% (Table 2).
Table 2.
Contingency table according to eGFR and mGFR decline (threshold of 30%) with subsequent graft failure and all-cause mortality
| eGFR decline ≥30% | mGFR decline ≥30% | mGFR decline <30% | Total |
|---|---|---|---|
| n = 37 | n = 25 | n = 62 | |
| Graft loss: 20 | Graft loss: 11 | Graft loss: 31 | |
| All-cause mortality: 10 | All-cause mortality: 4 | All-cause mortality: 14 | |
| eGFR decline <30% | n = 33 | n = 322 | n = 355 |
| Graft loss: 15 | Graft loss: 70 | Graft loss: 85 | |
| All-cause mortality: 8 | All-cause mortality: 55 | All-cause mortality: 63 | |
| Total | n = 70 | n = 347 | n = 417 |
| Graft loss: 35 | Graft loss: 81 | Graft loss: 116 | |
| All-cause mortality: 18 | All-cause mortality: 59 | All-cause mortality: 77 |
Association of GFR change with graft and patient survival
Over the 11 years of follow-up, 116 graft failures (28%) and 77 deaths (18%) were recorded corresponding to a rate of graft loss of 46%. Figure 2 displays adjusted survival curves for long-term outcome according to eGFR and mGFR decline and considering graft loss and patient death as competing events. As for the outcome ‘all-cause mortality’, a decline in eGFR superior to 30% 5 years after transplantation was associated to a relatively constant excess risk of mortality as early as 80 months post-transplantation. A virtually identical relationship was observed when the same decline in GFR was considered based on inulin evaluation (Figure 2A). Similarly, eGFR and mGFR decline exhibited comparable association with the risk for graft failure.
FIGURE 2:

Cumulative incidence function curves of graft failure (A) and all-cause mortality (B) according to GFR decline, either estimated (red) or measured (blue) from 1 to 5 years post-transplant.
Considering the threshold of 30%, strength of associations of GFR change with subsequent risk for graft failure and all-cause mortality was not different when GFR was measured by inulin clearance or estimated with the CKD-EPI equation (Figure 3). A decline in GFR ≥30% was associated to, approximately, a 2.4-fold increased risk of graft loss irrespective of the method used for GFR evaluation {HR of 2.40 [95% confidence interval (CI) 1.44–4.00] and HR of 2.37 (1.47–3.83) for inulin-mGFR and CKD-EPI-eGFR decline, respectively}. Alternative thresholds of 20 and 50% were also significantly associated to higher risk for graft loss with, here again, no difference in the strength of this association according to the way GFR change was evaluated (Table 3). Whether inulin clearance or the CKD-EPI equation was used to categorize patients also did not significantly impact the value of HRs for all-cause mortality (Table 3).
FIGURE 3:
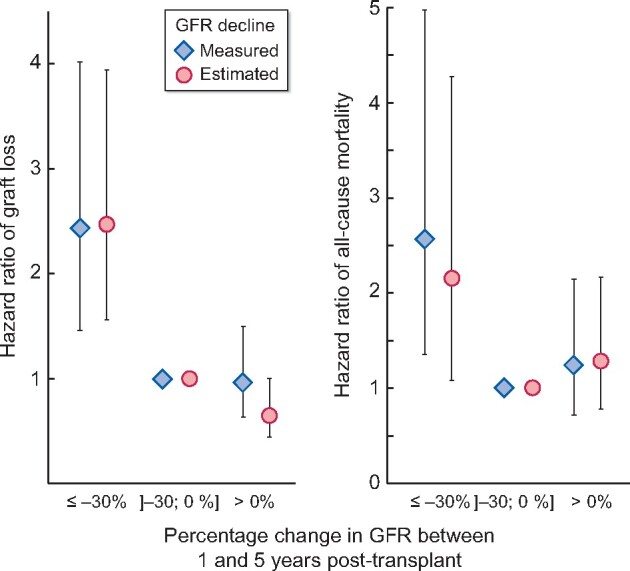
Subdistribution HR (and 95% CI) for graft failure and all-cause mortality according to GFR decline, either estimated (circle) or measured (diamond) from 1 to 5 years post-transplant.
Table 3.
Subdistribution HRs for graft failure and all-cause mortality according to different thresholds of eGFR or mGFR decline
| Graft failure |
Mortality |
|||||||
|---|---|---|---|---|---|---|---|---|
| mGFR change |
eGFR change |
mGFR change |
eGFR change |
|||||
| HR (95% CI) | P-value | HR (95% CI) | P-value | HR (95% CI) | P-value | HR (95% CI) | P-value | |
| 20% GFR decline | ||||||||
| ≤−20% | 1.91 (1.13–3.24) | 0.02 | 1.75 (1.11–2.76) | 0.02 | 1.48 (0.76–2.87) | 0.25 | 2.25 (1.15–4.40) | 0.02 |
| −20 to 0 | 1 | 0.003 | 1 | <0.0001 | 1 | 0.40 | 1 | 0.06 |
| >0 | 0.98 (0.60–1.60) | 0.91 | 0.66 (0.42–1.01) | 0.06 | 1.06 (0.60–1.87) | 0.87 | 1.58 (0.87–2.87) | 0.13 |
| 30% GFR decline | ||||||||
| ≤−30% | 2.40 (1.44–4.00) | 0.0008 | 2.37 (1.47–3.83) | 0.0004 | 2.55 (1.32–4.95) | 0.006 | 2.10 (1.06–4.15) | 0.03 |
| −30 to 0 | 1 | 0.0001 | 1 | <0.0001 | 1 | 0.01 | 1 | 0.10 |
| >0 | 0.96 (0.62–1.49) | 0.87 | 0.66 (0.44–0.99) | 0.05 | 1.24 (0.72–2.16) | 0.44 | 1.31 (0.79–2.18) | 0.30 |
| 50% GFR decline | ||||||||
| ≤−50% | 4.79 (2.58–8.90) | <0.0001 | 4.04 (2.31–7.05) | <0.0001 | 1.81 (0.59–5.52) | 0.30 | 1.40 (0.43–4.59) | 0.58 |
| −50 to 0 | 1 | <0.0001 | 1 | <0.0001 | 1 | 0.46 | 1 | 0.84 |
| >0 | 0.87 (0.59–1.28) | 0.47 | 0.59 (0.40–0.88) | 0.009 | 0.91 (0.58–1.44) | 0.69 | 1.08 (0.69–1.70) | 0.74 |
Performance of mGFR and eGFR changes to predict 16-year post-transplant outcomes
In terms of performance to predict 16-year post-transplant graft failure, CKD-EPI equation decline ≥30% exhibited a relatively low C-statistic of 0.628 (0.568–0.688). Evaluation of GFR decline by inulin clearance was not significantly different, with C-statistics of 0.584 (0.523–0.646) (P = 0.18; Table 4). As regard to prediction of all-cause mortality, performances of the two approaches were very close, with C-statistics of 0.548 (0.476–0.620) and 0.528 (0.458–0.599) (P = 0.55) for inulin-measured and CKD-EPI estimated 30% decline, respectively. Exploration of alternative thresholds (20 and 50%) did not permit to identify a situation where inulin clearance-based approach significantly outperformed the one based on the CKD-EPI equation.
Table 4.
Performance of different thresholds of eGFR or mGFR decline to predict graft failure and all-cause mortality at 16 years post-transplantation
| Graft failure |
Mortality |
|||||||||
|---|---|---|---|---|---|---|---|---|---|---|
| mGFR change |
eGFR change |
mGFR change |
eGFR change |
|||||||
| C-statistic | 95% CI | C-statistic | 95% CI | P-value | C-statistic | 95% CI | C-statistic | 95% CI | P-value | |
| 20% GFR decline | 0.577 | 0.516–0.638 | 0.622 | 0562–0.682 | 0.17 | 0.534 | 0.464–0.604 | 0.533 | 0.462–0.605 | 0.98 |
| 30% GFR decline | 0.584 | 0.523–0.646 | 0.628 | 0.568–0.688 | 0.18 | 0.548 | 0.476–0.620 | 0.528 | 0.458–0.599 | 0.55 |
| 50% GFR decline | 0.578 | 0.518–0.638 | 0.622 | 0.564–0.680 | 0.18 | 0.526 | 0.459–0.594 | 0.513 | 0.447–0.580 | 0.70 |
DISCUSSION
Our results challenge the notion that early GFR decline could be a good predictor for long-term outcome in renal transplantation. With a C-statistic around 0.6, the criterion ‘30% GFR decline’ shows only suboptimal diagnostic performance and does not appear as a valuable surrogate marker for subsequent graft loss and/or mortality. This is at odds with the recent analysis conducted by Clayton and colleagues from the Australia and New Zealand Dialysis and Transplant Registry [12]. By analysing more than7900 renal transplant recipients, the authors found that 30% GFR decline was significantly associated to graft loss and patient death, more strongly than any other traditional surrogates, and concluded that it should be considered for use as a proxy in transplant trials. We believe that the discrepancy between Clayton’s conclusion and ours is mainly driven by differences in follow-up duration.
While median follow-up was 8.5 years in Clayton’s study, we pre-specified a fixed longer follow-up of 16 years for all our patients, allowing us to validate the diagnostic performance of the factor ‘30% GFR decline’ against a higher, and probably more clinically relevant, number of ‘events’ (46% of uncensored graft loss as opposed to 15% in Clayton’s study).
When considering longer follow-up, it may be not totally surprising that early GFR decline lost its predictive ability, especially given the natural trajectory of CKD in transplant patients, which is probably less linear and less predictable than what is usually observed in patients with native kidneys [24]. Irrespective of the underlying explanation, the overall performance of the ‘30% GFR decline’ has to be improved, at least in the context of transplantation trials. In this respect, albuminuria change over time has recently been shown to be independently associated with ESRD and mortality in patients with chronic native kidney disease [25]. Additionally, proteinuria and albuminuria are associated to graft and recipients’ survival in kidney transplantation [26, 27]. Taken together, those results call for testing a combined surrogate endpoints including changes in both GFR and proteinuria/albuminuria.
The second important result of our study is that assessing decline in renal graft function with a reference method of GFR measurement does not improve our capacity to predict long-term outcome as compared with a simple creatinine-based GFR estimation. Albeit negative, this result is certainly not meaningless considering the recent interest on validating ‘GFR decline’ as a surrogate marker for CKD-related complications [2, 4, 13]. While the futility of using a reference method of direct GFR measurement in this specific setting has been suggested in the CKD population with native kidneys [22], it is the first time that this is reported in a transplant population. We observed this result for the 30% GFR decline, which is the threshold of interest in the recent literature [12, 13], but also for the thresholds of 20 and 50%. Given the well-known tendency of creatinine-based estimating to underestimate longitudinal GFR changes in transplantation [20, 28], one could have anticipated a better sensitivity of a reference method in detecting patients with steep declines. This tended actually to be the case in our cohort with roughly 17% of patients detected as having a decline ≥30% by inulin clearance as compared with 15% by the CKD-EPI equation. This difference was, however, marginal and more importantly did not translate into an improved predictive performance for inulin clearance.
Importantly, our results should not be interpreted as a definitive refutation of the utility of reference methods. On the contrary, we report an extremely limited concordance between mGFR and eGFR decline. This is well-illustrated by the fact that 47% of patients with an inulin-measured decline ≥30% are actually missed by the CKD-EPI equation. In situations where an accurate evaluation of GFR change is mandatory, reference methods are probably still useful. For example, in the pivotal trial comparing belatacept to cyclosporine in renal transplantation, short-term superiority of belatacept in preserving renal function was only significant when GFRs were measured by iohexol clearance and not when they were simply estimated by the MDRD study equation [29]. Similarly, while reference methods may not provide any added value for outcome prediction at the population level, they are probably more reliable for longitudinal follow-up of individuals when the goal is to intervene as early as possible, especially for patients with characteristics known to impair applicability of creatinine-based equations [16]. Finally, inulin-based approaches could still have some predictive advantage as part of combined surrogate markers (e.g. inulin clearances decline combined to albuminuria change). Likewise, a more accurate estimation of GFR combining SCr and serum cystatin C might be of interest in this context.
Strengths of our study are the use of a well-validated reference method for GFR measurement, the homogeneous management and the detailed phenotype of a monocentric cohort with very few patients lost of follow-up, the use of a statistical approach deemed appropriate for prognosis research question [30, 31] and finally, the deliberate choice of assessing outcome after a fixed, pre-determined follow-up period to parallel the analysis plan of a clinical trial.
Our study also has some limitations that warrant mention. While the interest of a GFR decline ≥30% as a surrogate endpoint has been validated over a 2-year period [4, 12, 13], we only had the opportunity to carry out our analysis over a 4-year period since in our centre, inulin clearance is routinely performed at 1 year and every 5 years post-transplant, and was thus not available at intermediate time points. Whether our results would hold true for a shorter period of time is theoretically questionable. Moreover, because our cohort is of limited size (especially in comparison of study population originated from the merging of large numbers of multinational cohorts [13]), we cannot totally rule out a lack of statistical power that would have precluded us from detecting a significant advantage of the inulin-mGFR decline. Finally, one may argue that the MDRD study equation is the best creatinine-based estimator for renal transplant recipients [15, 32]. The CKD-EPI equation is, however, currently the estimator recommended by the majority of international guidelines and was accordingly the equation used to test the validity of 30% GFR decline in previous studies [12, 13].
In conclusion, a decline in GFR ≥30% estimated by creatinine-based equation early in the course of renal transplantation does not permit accurate prediction of long-term graft failure and all-cause mortality. Switching to a reference method for directly measuring GFR decline does not improve the overall predictive performance. Our data suggest that in the context of a clinical trial, using early GFR decline alone as a surrogate endpoint for long-term outcome might be misleading and that alternative combined surrogates should be tested.
CONFLICT OF INTEREST STATEMENT
None declared. The results presented in this article have not been published previously in whole or part, except in abstract format.
REFERENCES
- 1. Stevens LA, Greene T, Levey AS.. Surrogate end points for clinical trials of kidney disease progression. Clin J Am Soc Nephrol 2006; 1: 874–884 [DOI] [PubMed] [Google Scholar]
- 2. Badve SV, Palmer SC, Hawley CM. et al. Glomerular filtration rate decline as a surrogate end point in kidney disease progression trials. Nephrol Dial Transplant 2016; 31: 1425–1436 [DOI] [PubMed] [Google Scholar]
- 3. Srinivas TR, Oppenheimer F.. Identifying endpoints to predict the influence of immunosuppression on long-term kidney graft survival. Clin Transplant 2015; 29: 644–653 [DOI] [PubMed] [Google Scholar]
- 4. Levey AS, Inker LA, Matsushita K. et al. GFR Decline as an end point for clinical trials in CKD: a scientific workshop sponsored by the National Kidney Foundation and the US Food and Drug Administration. Am J Kidney Dis 2014; 64: 821–835 [DOI] [PubMed] [Google Scholar]
- 5. White CA, Siegal D, Akbari A. et al. Use of kidney function end points in kidney transplant trials: a systematic review. Am J Kidney Dis 2010; 56: 1140–1157 [DOI] [PubMed] [Google Scholar]
- 6. Coupel S, Giral-Classe M, Karam G. et al. Ten-year survival of second kidney transplants: impact of immunologic factors and renal function at 12 months. Kidney Int 2003; 64: 674–680 [DOI] [PubMed] [Google Scholar]
- 7. Hariharan S, Mcbride MA, Cherikh WS. et al. Post-transplant renal function in the first year predicts long-term kidney transplant survival. Kidney Int 2002; 62: 311–318 [DOI] [PubMed] [Google Scholar]
- 8. Kasiske BL, Israni AK, Snyder JJ. et al. The relationship between kidney function and long-term graft survival after kidney transplant. Am J Kidney Dis 2011; 57: 466–475 [DOI] [PubMed] [Google Scholar]
- 9. Moranne O, Maillard N, Fafin C. et al. Rate of renal graft function decline after one year is a strong predictor of all-cause mortality: GFR decline associates with mortality. Am J Transplant 2013; 13: 695–706 [DOI] [PubMed] [Google Scholar]
- 10. Wu J, Li H, Huang H. et al. Slope of changes in renal function in the first year post-transplantation and one-yr estimated glomerular filtration rate together predict long-term renal allograft survival: GFR changes in the first year post-transplantation predict survival. Clin Transplant 2010; 24: 862–868 [DOI] [PubMed] [Google Scholar]
- 11. Inker LAL, Heerspink HJ, Mondal H. et al. GFR decline as an alternative end point to kidney failure in clinical trials: a meta-analysis of treatment effects from 37 randomized trials. Am J Kidney Dis 2014; 64: 848–859 [DOI] [PubMed] [Google Scholar]
- 12. Clayton PA, Lim WH, Wong G. et al. Relationship between eGFR decline and hard outcomes after kidney transplants. J Am Soc Nephrol 2016; 27: 3440–3446 [DOI] [PMC free article] [PubMed] [Google Scholar]
- 13. Coresh J, Turin TC, Matsushita K. et al. Decline in estimated glomerular filtration rate and subsequent risk of end-stage renal disease and mortality. JAMA 2014; 311: 2518–2531 [DOI] [PMC free article] [PubMed] [Google Scholar]
- 14. Mariat C, Alamartine E, Barthelemy J-C. et al. Assessing renal graft function in clinical trials: can tests predicting glomerular filtration rate substitute for a reference method? Kidney Int 2004; 65: 289–297 [DOI] [PubMed] [Google Scholar]
- 15. Masson I, Flamant M, Maillard N. et al. MDRD versus CKD-EPI equation to estimate glomerular filtration rate in kidney transplant recipients. Transplant J 2013; 95: 1211–1217 [DOI] [PubMed] [Google Scholar]
- 16. Delanaye P, Mariat C.. The applicability of eGFR equations to different populations. Nat Rev Nephrol 2013; 9: 513–522 [DOI] [PubMed] [Google Scholar]
- 17. Maillard N, Alamartine E, Berthoux F. et al. On the demanding necessity of properly evaluating renal graft function in clinical trials: letter to the editor. Transpl Int 2009; 22: 247–248 [DOI] [PubMed] [Google Scholar]
- 18. Ruggenenti P, Gaspari F, Cannata A et al.; for the GFR-ADPKD Study Group. Measuring and estimating GFR and treatment effect in ADPKD patients: results and implications of a longitudinal cohort study. PLoS One 2012; 7: e32533. [DOI] [PMC free article] [PubMed] [Google Scholar]
- 19. Delanaye P, Melsom T, Ebert N. et al. Iohexol plasma clearance for measuring glomerular filtration rate in clinical practice and research: a review. Part 2: why to measure glomerular filtration rate with iohexol? Clin Kidney J 2016; 9: 700–704 [DOI] [PMC free article] [PubMed] [Google Scholar]
- 20. Gera M, Slezak JM, Rule AD. et al. Assessment of changes in kidney allograft function using creatinine-based estimates of glomerular filtration rate. Am J Transplant 2007; 7: 880–887 [DOI] [PubMed] [Google Scholar]
- 21. Warnock DG. Estimated glomerular filtration rate: fit for what purpose? Nephron 2016; 134: 43–49 [DOI] [PubMed] [Google Scholar]
- 22. Ku E, Xie D, Shlipak M et al.; the CRIC Study Investigators. Change in measured GFR versus eGFR and CKD outcomes. J Am Soc Nephrol 2016; 27: 2196–2204 [DOI] [PMC free article] [PubMed] [Google Scholar]
- 23. Methven S, Gasparini A, Carrero JJ. et al. Routinely measured iohexol glomerular filtration rate versus creatinine-based estimated glomerular filtration rate as predictors of mortality in patients with advanced chronic kidney disease: a Swedish Chronic Kidney Disease Registry cohort study. Nephrol Dial Transplant 2017; 32: ii170–ii179 [DOI] [PubMed] [Google Scholar]
- 24. Gill JS, Tonelli M, Mix CH. et al. The change in allograft function among long-term kidney transplant recipients. J Am Soc Nephrol 2003; 14: 1636–1642 [DOI] [PubMed] [Google Scholar]
- 25. Carrero JJ, Grams ME, Sang Y. et al. Albuminuria changes are associated with subsequent risk of end-stage renal disease and mortality. Kidney Int 2017; 91: 244–251 [DOI] [PMC free article] [PubMed] [Google Scholar]
- 26. Halimi J-M, Buchler M, Al-Najjar A. et al. Urinary albumin excretion and the risk of graft loss and death in proteinuric and non-proteinuric renal transplant recipients. Am J Transplant 2007; 7: 618–625 [DOI] [PubMed] [Google Scholar]
- 27. Nauta FL, Bakker SJL, van Oeveren W. et al. Albuminuria, proteinuria, and novel urine biomarkers as predictors of long-term allograft outcomes in kidney transplant recipients. Am J Kidney Dis 2011; 57: 733–743 [DOI] [PubMed] [Google Scholar]
- 28. Mariat C, Alamartine E, Afiani A. et al. Predicting glomerular filtration rate in kidney transplantation: are the K/DOQI guidelines applicable? Am J Transplant 2005; 5: 2698–2703 [DOI] [PubMed] [Google Scholar]
- 29. Vincenti F, Larsen C, Durrbach A et al.; Belatacept Study Group. Costimulation blockade with belatacept in renal transplantation. N Engl J Med 2005; 353: 770–781 [DOI] [PubMed] [Google Scholar]
- 30. Tripepi G, Heinze G, Jager KJ. et al. Risk prediction models. Nephrol Dial Transplant 2013; 28: 1975–1980 [DOI] [PubMed] [Google Scholar]
- 31. Noordzij M, Leffondre K, van Stralen KJ. et al. When do we need competing risks methods for survival analysis in nephrology? Nephrol Dial Transplant 2013; 28: 2670–2677 [DOI] [PubMed] [Google Scholar]
- 32. Buron F, Hadj-Aissa A, Dubourg L. et al. Estimating glomerular filtration rate in kidney transplant recipients: performance over time of four creatinine-based formulas. Transplantation 2011; 92: 1005–1011 [DOI] [PubMed] [Google Scholar]