

Abstract
Macrophages generate mitochondrial reactive oxygen and electrophilic species (mtROS, mtRES) as antimicrobials during Toll-like receptor (TLR)-dependent inflammatory responses. Whether mitochondrial stress caused by these molecules impacts macrophage function is unknown. Here, we demonstrate that both pharmacologically- and lipopolysaccharide (LPS)-driven mitochondrial stress in macrophages triggers a stress response called mitohormesis. LPS-driven mitohormetic stress adaptations occur as macrophages transition from an LPS-responsive to LPS-tolerant state where stimulus-induced proinflammatory gene transcription is impaired, suggesting tolerance is a product of mitohormesis. Indeed, like LPS, hydroxyestrogen-triggered mitohormesis suppresses mitochondrial oxidative metabolism and acetyl-CoA production needed for histone acetylation and proinflammatory gene transcription, and is sufficient to enforce an LPS-tolerant state. Thus, mtROS and mtRES are TLR-dependent signaling molecules that trigger mitohormesis as a negative feedback mechanism to restrain inflammation via tolerance. Moreover, bypassing TLR signaling and pharmacologically triggering mitohormesis represents a novel anti-inflammatory strategy that co-opts this stress response to impair epigenetic support of proinflammatory gene transcription by mitochondria.
Macrophage inflammatory responses are important for host defense, but if not tightly controlled, can be detrimental to the host in acute and chronic inflammatory diseases1. Macrophage tolerance is a form of trained immunity that evolved to protect the host from overproduction of inflammatory mediators2; however, this immunoparalyzed state impairs the ability of macrophages to clear pathogens, tumors, and perform tissue homeostatic functions3–5. Thus, understanding how the balance between responsiveness versus tolerance is regulated has far-reaching implications in health and disease.
Mitochondria are critical for macrophage-mediated immunity. Upon encountering a pathogen, toll-like receptor (TLR) ligands such as lipopolysaccharide (LPS) increase macrophage production of mitochondrial reactive oxygen species (mtROS) for bactericidal purposes6. Moreover, TLR-driven expression of Irg1 results in TCA cycle remodeling and production of itaconate, a mitochondrial reactive electrophilic species (mtRES) with antimicrobial properties7. Rapid production of mtROS and mtRES following TLR engagement coincides with oxidative damage8, glutathione (GST) depletion9, and activation of cytoprotective genes (e.g. Nfe2l2, Atf4)8–10, suggesting acute oxidative and electrophilic mitochondrial stress is caused by local production of these reactive molecules. Whether this stress impacts macrophage function long-term is unknown.
Mitochondrial integrity is closely monitored by quality control systems. This includes nuclear-encoded transcriptional factors that respond to mitochondrial stress (e.g. increased mtROS11, impaired mitochondrial proteostasis12) and alter gene expression via retrograde mito-nuclear signaling. Most thoroughly studied in model organisms such as Caenorhabditis elegans and Saccharomyces cerevisiae, stress-induced activation of these transcription factors can promote persistent cyto- and mito-protective adaptations and stress resistance in a process known as mitohormesis, which influences organismal metabolism, health, and longevity13. Whether mitohormesis influences immunity is unknown.
Here we demonstrate that both pharmacological and TLR-driven mitochondrial stress triggers mitohormesis in macrophages. Mitohormetic adaptions, including enhanced mitochondrial proteostasis, mitochondrial oxidative stress resistance, and the suppression of oxidative metabolism, leave macrophages in an immunoparalyzed, LPS-tolerant state. Furthermore, by pharmacologically triggering mitohormesis with reactive, lipophilic small molecules that mimic the actions of endogenously-generated mtROS and mtRES, we show the transition to an LPS-tolerant state can occur independent of TLR signaling and other mechanisms previously proposed to enforce tolerance. Thus, mtROS and mtRES trigger mitohormesis as a negative feedback mechanism to restrain macrophage inflammation via tolerance, and this process can be exploited therapeutically to counteract acute and chronic inflammation.
Results
Hydroxyestrogens are anti-inflammatory in vitro
Biological sex affects immune responses, and estrogens have conflicting immunomodulatory effects on macrophages14, 15. Estrogens can have direct, estrogen receptor (ER)-independent effects on mitochondria16, which control macrophage inflammatory responses. While most studies focus on 17β-estradiol (E2), the most abundant estrogen, metabolism can alter the structure and immunomodulatory properties of sterols17. We screened a panel of 14 endogenous estrogens (Supplementary Table 1) to identify metabolites with anti-inflammatory activity in macrophages that might have therapeutic utility. Bone marrow-derived macrophages (BMDMs) were pretreated with estrogen metabolites for 1 hour, followed by 6 hour LPS stimulation and Nos2 quantitative real-time PCR (qPCR). This revealed the hydroxyestrogens 2-hydroxyestrone (2-OHE1), 4-hydroxyestrone (4-OHE1), and 2-hydroxyestradiol (2-OHE2), significantly repressed Nos2 induction, while other estrogens including E2 and 16-Epiestriol (16-Epi) lacked this activity (Fig. 1a). RNA-seq identified 253 genes repressed by hydroxyestrogen pretreatment in LPS-stimulated BMDMs (Supplementary Table 2), and Gene Ontology (GO) analysis revealed enrichment for categories including “Inflammatory response” (Fig. 1b). Hierarchical clustering revealed a broad set of proinflammatory cytokines and chemokines repressed by hydroxyestrogens (Fig. 1c, Extended Data Fig. 1a). We chose Il1b as our model hydroxyestrogen-repressed gene as its transcriptional induction was potently repressed in a dose-dependent manner by 4-OHE1 pretreatment (Fig. 1d). 4-OHE1 and other hydroxyestrogens repressed Il1b in RAW macrophages (Extended Data Fig. 1b), making them suitable for mechanistic studies. 4-OHE1 also repressed IL1B in THP-1 and U937 human monocytic cell lines (Extended Data Fig.1c). In agreement with these transcriptional effects, 4-OHE1, but not E2, repressed LPS-induced pro-IL-1β protein levels in BMDMs (Fig. 1e) and RAW macrophages (Extended Data Fig. 1d), and inhibited IL-1β release from BMDMs and THP-1s (Fig. 1f,g).
Figure 1. Hydroxyestrogens are anti-inflammatory in macrophages in vitro.

a. BMDMs pretreated with EtOH vehicle control or 1μM estrogens for 1h, followed by 6h LPS stimulation (100ng/mL) and Nos2 qPCR.
b. Gene ontology (GO) analysis of 253 genes repressed by 1h hydroxyestrogen pretreatment (1μM) in 6h LPS-stimulated BMDMs identified by RNA-seq.
c. RNA-seq hierarchical clustering dendrogram, with heatmap highlighting genes with reduced relative expression* in hydroxyestrogen-pretreated, LPS-stimulated BMDMs (*log2-transformed RPKM centered on the mean of each gene).
d. BMDMs pretreated with EtOH or indicated concentrations of 4-OHE1 for 1h, followed by 6h LPS stimulation and Il1b qPCR. Percentages indicate induction relative to max (100%) in “EtOH +LPS” control BMDMs.
e. BMDMs pretreated with EtOH, E2, or 4-OHE1 (both 5μM) for 1h, followed by 6h LPS stimulation before pro-IL-1β western blot.
f. BMDMs pretreated with EtOH, E2, or 4-OHE1 (both 5μM) for 1h, followed by 6h LPS stimulation (with 2.5μM nigericin added the last hour) before ELISA for secreted IL-1β.
g. THP-1s pretreated with EtOH, E2, or 4-OHE1 (both 10μM) for 1h, followed by 6h LPS stimulation (alone, or with 2.5μM nigericin added the last 1h) before IL-1β ELISA.
h. BMDMs from ERαfl/fl LysM-Cre mice pretreated with EtOH or 1μM estrogens for 1h, followed by 6h LPS stimulation and Il1b qPCR.
For bar graphs, each data point is an independent biological replicate. For n=2, data represented as mean; for n=3, mean ± SEM. P values are from unpaired, two-sided Student’s T Test (planned comparisons). All qPCR and THP-1 ELISA data representative of at least 2 independent experiments. BMDM western blot (e, n=2 independent biological replicates per condition) and ELISA (f, n=3 independent biological replicates per condition) were each performed once.
4-OHE1, but not E2, repressed Il1b induction by multiple TLR agonists (Extended Data Fig. 1e), suggesting that a common pathway downstream of TLRs is targeted. To test if these effects were dependent on ERα, the primary ER in macrophages17, we repeated these experiments using BMDMs from ERαfl/fl LysM-Cre mice. Surprisingly, the anti-inflammatory activity of the hydroxyestrogens was intact (Fig. 1h). Moreover, cotreatment with the high-affinity ERα antagonist ICI 182780 had no effect on the ability of hydroxyestrogens to repress Il1b (Extended Data Fig.1f). Together, these results demonstrate hydroxyestrogens are ERα-independent repressors of macrophage proinflammatory gene transcription in vitro.
Hydroxyestrogens are anti-inflammatory in vivo
To test if hydroxyestrogens have anti-inflammatory activity in vivo during acute inflammation, we intraperitoneally (IP) injected mice with EtOH, E2, or 4-OHE1, followed by LPS. 4-OHE1, but not E2, significantly repressed the LPS-induced increase in serum IL-1β, and spleenocyte proinflammatory gene expression (Fig. 2a, b). Thus, 4-OHE1 can antagonize acute LPS-induced inflammation in vivo.
Figure 2. Hydroxyestrogens are anti-inflammatory in vivo.

a. Experimental setup (top), and serum IL-1β levels (bottom) in 8-week-old male C57BL/6 mice injected IP with EtOH vehicle control or estrogens (10mg/kg) prior to IP LPS injection (2mg/kg). n=2,4,5, and 4 mice for the EtOH, EtOH +LPS, 4-OHE1 +LPS, and E2 +LPS groups, respectively.
b. qPCR for proinflammatory gene expression in splenocytes isolated from mice in a.
c. Experimental setup (top), and hierarchical clustering of vWAT macrophage RNA-seq data (bottom) from 8-week-old male C57BL/6 mice fed a high-fat diet (HFD) and injected subcutaneously every 6 days with EtOH, E2, or 4-OHE1 (10mg/kg). Relative expression heatmap displays the log2-transformed RPKM centered on the mean of each gene. n=5 mice per treatment group.
d. Venn Diagram displaying overlap between genes significantly repressed by E2 or 4-OHE1 in vWAT macrophages from HFD-fed mice.
e. GO analysis of genes uniquely repressed by E2 (left) or 4-OHE1 (right) in vWAT macrophages from HFD-fed mice.
f. Glucose tolerance test in 12-week old male C57BL/6 mice after 30 days of NC or HFD feeding and SQ injection with either EtOH or 4-OHE1 (10mg/kg). n=10, 10, and 11 for NC +EtOH, HFD +EtOH, and HFD +4-OHE1 groups, respectively. P values from NC +EtOH vs. HFD +EtOH comparisons (top), and HFD +EtOH vs. HFD +4-OHE1 comparisons (bottom).
g. Serum insulin ELISA measuring glucose-stimulated insulin secretion in fasted mice from f at 15 minutes post-glucose injection. N reduced from f due to random sample collection errors (n=9,8 for NC +EtOH, n=9,10 for HFD +EtOH, and n=9,9 for HFD +4-OHE1 groups for each respective timepoint).
h. Serum IL-1β levels in subset of mice from f. 4.5h after IP LPS injection (3mg/kg). n=3, 5, 5, and 6 mice per condition, respectively.
For bar graphs, all data represented as mean ± SEM. P values from unpaired, two-sided Student’s T Test (planned comparisons). Acute inflammation model was performed once. HFD chronic inflammation model was performed once for transcriptional profiling, and once for metabolic studies.
To test if hydroxyestrogens have anti-inflammatory effects in vivo in a chronic inflammatory setting, we examined effects on gene expression in visceral white adipose tissue (vWAT) macrophages during the early stages of high-fat diet (HFD)-induced inflammation and metabolic dysfunction. Mice were placed on HFD and EtOH, E2, or 4-OHE1 were administered subcutaneously (SQ) every 6 days. After 30 days, vWAT macrophages were profiled by RNA-seq (Fig. 2c, Extended Data Fig. 2a). While both E2 and 4-OHE1 reduced adiposity and vWAT macrophage cellularity (Extended Data Fig. 2b,c), vWAT macrophages from 4-OHE1-treated mice displayed a distinct gene expression signature compared to macrophages from EtOH- and E2-treated mice (Fig. 2c). 4-OHE1 repressed expression of a distinct set of genes compared to E2 (Fig. 2d, Supplementary Table 3). GO analysis of genes uniquely repressed by 4-OHE1 revealed enrichment for categories including “Inflammatory response”, while genes uniquely repressed by E2 showed no enrichment for inflammatory processes (Fig. 2e). Many genes repressed in macrophages in vitro were repressed by 4-OHE1, but not E2, in vWAT macrophages (Extended Data Fig. 2d).
To test if 4-OHE1’s anti-inflammatory effects coincided with improved metabolic control, we subjected mice fed a normal chow (NC) or HFD and SQ-injected with EtOH or 4-OHE1 for 30 days to a glucose tolerance test (GTT). 4-OHE1 significantly enhanced glucose disposal in HFD-fed mice compared to HFD and even NC controls (Fig. 2f, Extended Data Fig. 2e). This occurred despite reduced glucose-stimulated insulin secretion (GSIS) in 4-OHE1-treated HFD-fed mice (Fig. 2g), raising the possibility of enhanced insulin sensitivity and glucose uptake in tissue(s) due to reduced inflammation. Thus, 4-OHE1 both repressed inflammation and improved metabolic control during HFD-induced metabolic dysfunction in vivo. Interestingly, challenging these mice with LPS 48 hours after their last injection revealed that this extended, intermittent dosing of 4-OHE1 via the SQ route provided protection against systemic LPS-induced inflammation (Fig. 2h, Extended Data Fig. 2f). Thus, a 4-OHE1 dosing schedule with more relevance to human drug administration can protect mice from inflammatory insults at a dosage with potential for clinical translation.
Hydroxyestrogens do not require NRF2 to repress inflammation
Given their ERα-independent anti-inflammatory effects, we considered other mechanisms by which hydroxyestrogens might act given what is known about their natural production and metabolism (Fig. 3a). Hydroxylation of estrone (E1) or E2 by CYP1 family cytochrome P450 monooxygenases creates a catechol moiety, giving hydroxyestrogens their “catechol estrogens” nickname18. Present in a variety of approved drugs and natural compounds, this catechol moiety can cause cellular stress in two ways. First, it can be oxidized to its quinone form, and redox cycling between these forms (which involves a semiquinone free radical intermediate) can produce reactive oxygen species (ROS). Second, because the quinone form possesses α,β-unsaturated carbonyls and is highly electrophilic, it can be attacked by nucleophiles, such as reactive cysteines in proteins, forming covalent adducts. Accordingly, cells detoxify hydroxyestrogens via catechol methylation by COMT (which reduces redox cycling), and glutathione (GST) conjugation of the quinone. Given that hydroxyestrogens, but not their precursors or methylated metabolites, repressed LPS-induced proinflammatory gene transcription (Fig. 3b, Extended Data Fig. 1b), we hypothesized their anti-inflammatory effects depend on their ability to cause oxidative and electrophilic stress.
Figure 3. Hydroxyestrogens activate NRF2, but NRF2 is dispensable for their anti-inflammatory effects.

a. In vivo production and metabolism of 4-OHE1, highlighting detoxification via methylation and glutathione (GSH) conjugation, and mechanisms by which 4-OHE1 may cause oxidative and electrophilic stress.
b. BMDMs pretreated with EtOH or 5μM estrogens for 1h, followed by 4h LPS stimulation and Il1b qPCR.
c. HOMER promoter motif analysis showing NRF2 as a top transcription factor binding motif enriched in promoters of the 341 genes upregulated in LPS-stimulated BMDMs pretreated with hydroxyestrogens, but not control estrogens.
d. Relative expression* of putative NRF2 target genes in estrogen pretreated, LPS-stimulated BMDM RNA-seq dataset (*log2-transformed RPKM centered on the mean of each gene).
e. RAW macrophages treated with E2 or 4-OHE1 (10μM) for 1h (with or without 30min 5mM NAC pretreatment) and intracellular oxidative stress measured by CellROX staining and flow cytometry. H2O2 (500μM) serves as positive control.
f. RAW macrophages treated with E2 (5μM), 4-OHE1 (5μM), or DEM (100μM), for indicated times before NRF2 stabilization was assessed by western blot.
g. RAW macrophages treated with E2 or 4-OHE1 (5μM) for 1h (with or without 30min 5mM NAC pretreatment) before Hmox1 qPCR.
h. WT and Nrf2 KO BMDMs were pretreated 1h with EtOH or indicated concentrations of 4-OHE1 before 6h LPS stimulation and Il1b qPCR. Percentages indicate induction relative to max (100%) in “EtOH +LPS” control BMDMs for each genotype. WT BMDM data is from Fig. 1d.
For bar graphs, each data point is an independent biological replicate. For n=2, data represented as mean; for n=3, mean ± SEM. P values are from unpaired, two-sided Student’s T Test (planned comparisons). Flow cytometry and qPCR data representative of 2 independent experiments; western blot was performed once.
The Keap1-Nrf2 system regulates cytoprotection in response to oxidative and electrophilic stress. Our LPS-treated BMDM RNA-seq dataset identified 341 genes significantly upregulated in hydroxyestrogen-pretreated cells versus control pretreatments (Supplementary Table 2). GO analysis revealed enrichment of categories including “Response to oxidative stress” and “Glutathione metabolism”, (Extended Data Fig. 3a), and the NRF2 binding motif was enriched in the gene promoters (Fig. 3c). Expression of NRF2 targets Hmox1, Nqo1, ROS detoxification, and GST biosynthesis genes were significantly upregulated in hydroxyestrogen-pretreated, LPS-stimulated BMDMs (Fig. 3d). In non-LPS-stimulated macrophages, treatment with 4-OHE1 alone, but not E2, was sufficient to rapidly increase intracellular oxidative stress that is sensitive to N-acetyl cysteine (NAC), which generates hydropersulfides with both direct antioxidant activity, and the ability to protect protein thiols from oxidation by electrophiles19 (Fig. 3e). This oxidative stress coincides with NRF2 stabilization, and NAC-sensitive upregulation of Hmox1 expression by 4-OHE1, but not E2 (Fig. 3f,g). Given NRF2 has been described as a negative regulator of LPS-induced inflammation, we tested if NRF2 was required for 4-OHE1’s anti-inflammatory activity. Impaired Hmox1 induction confirmed lack of NRF2 function in BMDMs from Nfe2l2–/– mice (NRF2 KO BMDMs) (Extended Data Fig. 3b). However, 4-OHE1 still repressed LPS-induced Il1b these macrophages (Fig. 3h), demonstrating NRF2 is dispensable for 4-OHE1’s repression of proinflammatory gene transcription.
Hydroxyestrogens cause mitochondrial stress
A recent report demonstrated E2 is highly abundant in mitochondrial membranes, and that E2 from distal and exogenous sources localizes to mitochondria in target cells and tissues16. Given NRF2 monitors mitochondrial integrity20, we hypothesized NRF2 activation by hydroxyestrogens might be indicative of mitochondrial stress caused by these lipophilic electrophiles as they localize to mitochondria, producing ROS and covalently modifying mitochondrial proteins. In support of this hypothesis, Hmox1 induction by 4-OHE1 was sensitive to the mitochondrial matrix-targeted antioxidant MitoQ (Extended Data Fig. 4a). Deeper mining of the GO analysis of the 341 genes upregulated in hydroxyestrogen-pretreated, LPS-stimulated BMDMs revealed three additional transcriptional signatures indicative of mitochondrial stress (Fig. 4a–c, Extended Data Fig. 4b–d.). The Heat Shock Factor 1 (HSF1) signature includes putative HSF1 target genes21, suggesting HSF1 activation in response to mitochondrial stress22. The ATF4/mitochondrial damage signature includes Atf4, which coordinates cytoprotection in response to mitochondrial stress in mammalian cells23, and the ATF4 target Gdf15, encoding a mitokine indicative of mitochondrial dysfunction. Finally, the Glycolysis/Pentose Phosphate Pathway (PPP) signature includes enzymes in these pathways known to be upregulated in response to mitochondrial stress in other systems12, 24, 25.
Figure 4. Hydroxyestrogens cause mitochondrial stress.

a.b.c. Relative expression* of genes indicative of mitochondrial stress in 1h estrogen pretreated, 6h LPS-stimulated BMDM RNA-seq dataset (*log2-transformed RPKM centered on the mean of each gene).
d. IsoTOP-ABBP strategy to identify covalent targets of 4-OHE1 acting through reactive cysteines. BMDMs were treated with EtOH or 1μM 4-OHE1 for 1h (n=3 independent biological replicates per condition).
e. f. All targets (left) and mitochondrial targets (right) of 4-OHE1 identified by isoTOP-ABPP. Cysteine-containing peptides above dashed line have light/heavy ratio>2.0, indicating at least a 50% reduction in cysteine-reactive probe targeting of these cysteines in 4-OHE1-treated BMDMs relative to control BMDMs. 18 of 20 mitochondrial targets are in MitoCarta 2.0. FKBP4 and GCLC mitochondrial localization prediction from UniProt.
We performed steroid extraction and liquid chromatography/mass spectrometry (LC-MS) to determine if 4-OHE1 was enriched in mitochondrial fractions relative to whole cells (Extended Data Fig. 4e,f). However, we were unable to detect free 4-OHE1 in macrophages treated for 1 hour (Extended Data Fig. 4g), suggesting 4-OHE1 is rapidly covalently conjugated by GST and/or proteins (Fig. 3a). To identify covalent 4-OHE1 protein targets acting through reactive cysteines, we performed competitive isotopic tandem orthogonal proteolysis-enabled activity-based protein profiling (isoTOP-ABPP) in 4-OHE1-treated BMDMs (Fig. 4d). This revealed 127 cysteines on 118 proteins targeted by 4-OHE1 (Fig. 4e). Cross-referencing this target list with MitoCarta 2.0 revealed 18 targets are mitochondrial proteins (Fig. 4f). A chi-square test comparing the observed frequency of mitochondrial targets with the expected frequency of mitochondrial proteins confirmed significant enrichment of mitochondrial proteins in the target list (Extended Data Fig. 4h). Together, these transcriptional and proteomic studies suggest hydroxyestrogens cause mitochondrial stress via local ROS production and covalent targeting of mitochondrial proteins.
Hydroxyestrogens impair mitochondrial acetyl-CoA production
We next considered how oxidative and electrophilic mitochondrial stress caused by hydroxyestrogens might exert anti-inflammatory effects. Mitochondria utilize oxidized glucose for acetyl-CoA production, which in turn is used to acetylate histones, a process crucial for Il1b upregulation in LPS-stimulated macrophages26, 27. Pharmacological inhibition of glucose utilization in LPS-stimulated macrophages has selective repressive effects on Il1b, but not cytokines such as Il6 and Tnf, suggesting the glucose-to-acetyl-CoA axis is more important for transcription of the former gene28. 4-OHE1 had stronger repressive effects on Il1b than Il6 and Tnf in RAW macrophages (Fig. 5a) and BMDMs (Extended Data Fig. 5a), suggesting 4-OHE1 interferes with this axis.
Figure 5. Hydroxyestrogens impair mitochondrial acetyl-CoA production and histone acetylation required for LPS-induced proinflammatory gene transcription.

a. RAW macrophages pretreated for 1h with indicated concentrations 4-OHE1 before 6h LPS stimulation and Il1b, Il6, and Tnf qPCR.
b. BMDM metabolomics and 13C6-glucose labeling strategy (n=3 independent biological replicates per condition).
c. Normalized metabolite abundance in 4-OHE1-treated BMDMs (5μM) relative to EtOH control BMDMs (where metabolite level was set to 1.0). Red highlighted metabolites above dashed line showed significant change (one-way ANOVA, P<0.05).
d. e. Absolute abundance of acetyl-CoA (left) and CoA (right) in EtOH and 4-OHE1-treated BMDMs. P values are from unpaired, two-sided Student’s T Test.
f. ChIP-seq for p65 (left) and H3K27ac (right) in BMDMs pretreated for 1h with 1μM of the indicated hydroxyestrogen, followed by 30min LPS stimulation. Histograms represent read density at LPS-inducible p65 peaks/H3K27ac regions in each of the 3 conditions. H3K27ac regions were centered on the nucleosome-free region (NFR) of associated promoters/enhancers, yielding a classic “2 peak” histogram.
g. Model for how mitochondrial stress caused by 4-OHE1 acutely impairs metabolic and epigenetic support of proinflammatory gene transcription.
h. BMDMs cultured in absence or presence of CoA (250μM) or acetyl-CoA (Ac-CoA, 200μM) (red bars) for 3h prior to 1h 4-OHE1 pretreatment (5μM), 1.5h LPS stimulation, and Il1b qPCR.
i. RAW macrophages cultured in absence or presence of acetyl-CoA (Ac-CoA, 200μM, red bars) for 2h prior to 1h electrophile pretreatment, 1.5h LPS stimulation, and Il1b qPCR. Concentrations: 250nM Celastrol, 100μM DEM, 10μM FCCP.
For bar graphs, each data point is an independent biological replicate. For n=2, data represented as mean; for n=3, mean ± SEM. All qPCR data representative of at least 2 independent experiments. Metabolomics and ChIP-seq studies were performed once.
To test this hypothesis, we performed metabolomics to identify metabolites whose levels were acutely affected by 4-OHE1. BMDMs were treated with EtOH or 4-OHE1 for two hours, followed by 30 minute 13C6-glucose labeling and metabolite extraction (Fig. 5b). Of the 136 metabolites measured, just eight were significantly changed by 4-OHE1 (Fig. 5c). Free GSH levels were reduced (Fig. 5c), supporting the notion that 4-OHE1 is rapidly glutathione-conjugated after treatment (Fig. 3a). In line with our hypothesis, the metabolite with the most statistically significant change was acetyl-CoA, as levels in 4-OHE1-treated BMDMs decreased by 45% (Fig. 5c,d). Interestingly, Coenzyme A (CoA) levels were also significantly reduced (41%)(Fig. 5c,e). As CoA biosynthesis occurs within mitochondria, and 80–90% of intracellular CoA is intra-mitochondrial29, this suggests mitochondrial stress caused by 4-OHE1 disrupts CoA homeostasis, and in turn, acetyl-CoA production. For TCA cycle metabolites quantified, total levels of citrate and aconitate (immediately downstream of acetyl-CoA) showed the largest decreases in abundance (Extended Data Fig. 5b). 13C6-glucose tracing revealed increased labeling of TCA cycle metabolites (and amino acids derived from these metabolites) except citrate and aconitate, upon 4-OHE1 treatment (Extended Data Fig. 5c), suggesting alternative entry routes of glucose-derived carbon into the TCA cycle in response to 4-OHE1-induced mitochondrial stress and disruption of CoA homeostasis. Together, this data demonstrates mitochondrial stress caused by 4-OHE1 impairs mitochondrial acetyl-CoA production.
Since acetyl-CoA is required for histone acetylation and proinflammatory gene transcription, we performed ChIP-seq to take an unbiased, genome-wide look at how LPS-induced transcription factor binding and histone acetylation were affected by hydroxyestrogens. For the NFκB subunit p65, we identified 6,149 peaks induced by 30 minute LPS stimulation (Fig. 5f, left). Pretreatment with the hydroxyestrogen 2-OHE2 had minimal effects on NFκB binding, as only 13% of LPS-induced p65 binding peaks were significantly reduced in read density. For histone acetylation, we identified 10,999 regions of H3K27ac, a mark of active promoters and enhancers, induced by 30 minute LPS stimulation (Fig. 5f, right). In contrast with NFκB binding, pretreatment with the hydroxyestrogen 2-OHE1 strongly impaired H2K27ac deposition, as nearly two-thirds (65%) of LPS-induced H3K27ac regions were significantly reduced in read density (Fig. 5f, Extended Data Fig. 5d). Thus, while hydroxyestrogens largely leave TLR4 signaling and transcription factor nuclear translocation/DNA binding intact, they strongly impair histone acetylation required for proinflammatory gene transcription, further supporting the hypothesis that hydroxyestrogens impair mitochondrial acetyl-CoA production (Fig. 5g).
Exogenous CoA can rescue histone acetylation and gene expression defects in cells with impaired CoA homeostasis30, 31. Indeed, exogenous CoA and acetyl-CoA fully rescued LPS-induced Il1b in 4-OHE1-pretreated macrophages at early timepoints (Fig. 5h), and partially at 6 hours (Extended Data Fig. 5e). Acetate supplementation failed to rescue Il1b (Extended Data Fig. 5f), suggesting nucleocytosolic acetyl-CoA generation by ASCC2 does not contribute to histone acetylation in this context. These rescue experiments further support a model where impairment of mitochondrial acetyl-CoA production by hydroxyestrogens underlies their anti-inflammatory activity.
Finally, we wondered if this mechanism might extend to other anti-inflammatory electrophiles. DEM and celastrol are electrophiles that repress Il1b transcription in myeloid cells32, 33. The uncoupler carbonyl cyanide 4-(trifluoromethoxy)phenylhydrazone (FCCP) dissipates mitochondrial membrane potential (mtMP) and reduces mtROS, the mechanism thought to underlie its repression of Il1b since mtROS is considered an inflammatory signal34. However, uncouplers are electrophilic35, and FCCP significantly reduces intracellular acetyl-CoA23 (Extended Data Fig. 5g). Itaconate is an endogenous electrophile that represses Il1b (Extended Data Fig. 5h). Indeed, supplying acetyl-CoA prior to pretreatment with these electrophiles restored Il1b induction (Fig. 5i, Extended Data Fig. 5i), suggesting their anti-inflammatory activity may lie in their ability to disrupt mitochondrial acetyl-CoA production.
Hydroxyestrogen-driven mitochondrial stress triggers mitohormesis
We next wondered how the mitochondrial stress caused by hydroxyestrogens might influence macrophage function beyond these acute anti-inflammatory effects. Mitochondrial stress can trigger apoptosis; however, we observed no changes in oxygen consumption (Extended Data Fig. 6a), mtMP (Extended Data Fig. 6b), or cell viability during acute (<1h) hydroxyestrogen treatment when stress is first detectable (Fig. 3e–g). Alternatively, mild doses of mitochondrial stress can trigger persistent stress adaptations that provide cyto-/mito-protection during subsequent stress exposure in a process known as mitohormesis13. Two hallmarks of mitohormesis are mitochondrial biogenesis, and increased mitochondrial chaperone activity. To test if acute hydroxyestrogen-driven mitochondrial stress triggered these adaptations, we expressed a mitochondrial matrix-targeted, oxidation-resistant green fluorescent protein in RAW macrophages, creating the RAW matrix-oxGFP reporter cell line. Treatment with 4-OHE1, but not E1 or 4-MeOE1, induced a transient decrease at 1 hour, followed by a steady increase in RAW matrix-oxGFP fluorescence at 8 and 24 hours as measured by flow cytometry (Fig. 6a). This dose-dependent effect occurred with no change in matrix-oxGFP transcription from the integrated reporter construct (Extended Data Fig. 6c, d). Quantification of the mitochondrial DNA/genomic DNA (mtDNA/gDNA) ratio ruled out increased mitochondrial DNA replication (Extended Data Fig. 6e). As matrix-oxGFP is a mitochondrial chaperone client that must be folded upon mitochondrial import36, this suggests RAW matrix-oxGFP cells report mitochondrial chaperone activity. Increased matrix ox-GFP fluorescence was sensitive to NAC, MitoQ, and inhibition of HSF1 transcriptional activity with KRIBB11, suggesting HSF1-dependent chaperone expression is required for this stress adaptation37 (Extended Data. 6f, g). Increased mitochondrial chaperone activity occurred concurrent with increased mitochondrial volume and/or surface area, as 4-OHE1, but not E1 or 4-MeOE1, increased MitoTracker Green signal in RAW macrophages and BMDMs (Extended Data Fig. 6h,i). THP-1 and U937 matrix-oxGFP reporter cells responded similarly to 4-OHE1, demonstrating this stress adaptation is conserved in human cells (Extended Data Fig. 6j). Thus, acute hydroxyestrogen-driven mitochondrial stress triggers an adaptive increase in mitochondrial chaperone activity to protect mitochondrial proteostasis.
Figure 6. Hydroxyestrogen-driven mitochondrial stress triggers mitohormesis.

a. RAW matrix-oxGFP macrophages were treated with EtOH or 5μM estrogens for indicated times and matrix-oxGFP florescence quantified by flow cytometry.
b. Basal (left) and LPS-induced (right) mitochondrial H2O2 levels in EtOH and estrogen (pre)treated (5μM) RAW macrophages quantified with MitoPY1 staining and flow cytometry. Menadione (50μM) and H2O2 (500μM) serve as positive controls.
c. left – Schematic describing RAW macrophages expressing roGFP proteins targeted to cytosol, mitochondrial inner membrane space (IMS), and mitochondrial matrix. roGFP oxidation favors excitation by 405nm violet laser relative to 488nm blue laser.
right – 405nm/488nm excitation ratio measured by flow cytometry (510nM emission) in roGFP RAW macrophages untreated (NT) or stimulated with LPS for 6h.
d. IMS-roGFP macrophages pretreated with EtOH or estrogens (5μM) for 1h and stimulated 6h with LPS before 405/488nm excitation ratio was measured by flow cytometry (510nM emission).
e. left – Schematic describing menadione resistance assay. RAW macrophages were treated overnight (18–24h) with EtOH or 4-OHE1 (5μM) before next day treatment with EtOH vehicle control or menadione (50μM, 4h) and viability assessment by flow cytometry.
right – Flow cytometry forward scatter/side scatter plots (FS/SS) of RAW macrophages. DAPI exclusion demonstrates cells in “live” FS/SS gate are viable, whereas “dead” FS/SS gate cells have increased cell membrane permeability and DAPI uptake. Percentages represent events in “live” and “dead” FS/SS gates relative to total events.
f. RAW macrophages treated overnight with EtOH or 5μM estrogens were treated the following day with EtOH (left) or 50μM menadione for 4h before viability was assessed by flow cytometry. Viability is represented as percentage of “live” FS/SS gate positive, DAPI negative cells per total events collected for each sample.
Each data point is an independent biological replicate For n=2, data represented as mean; for n=3, mean ± SEM. P values are from unpaired, two-sided Student’s T Test (planned comparisons) comparing indicated treatments versus appropriate “EtOH” control timepoint in a., or versus appropriate control sample indicated by bars/arrows in b, d, and f. All data representative of at least 2 independent experiments.
Another hallmark of mitohormesis is mitochondrial oxidative stress resistance (OSR)38 in which mild oxidative stress triggers redox adaptations that both lower steady-state levels of mtROS, and provide defense against subsequent oxidative stress insults. Like all cells, macrophages produce mtROS from the electron transport chain (ETC), and LPS enhances mtROS production for bactericidal purposes6. Thus, we tested if acute hydroxyestrogen-driven mitochondrial stress influenced basal and LPS-induced mtROS levels using the mitochondrial-targeted H2O2 sensor MitoPY1. Macrophages treated with 4-OHE1, but not E1 or 4-MeOE1, showed reduced basal MitoPY1 fluorescence (Fig. 6b, left). LPS enhanced mtROS levels as expected (Fig. 6b, right). However, in macrophages pretreated with hydroxyestrogens, but not with their precursor or methylated metabolites, there was a significant decrease in LPS-induced mtROS (Fig. 6b, right, and BMDMs Extended Data Fig. 6k). To corroborate this effect, we expressed redox sensitive-GFPs (roGFPs) in the cytosol (cyto-roGFP), mitochondrial inner membrane space (IMS-roGFP), and mitochondrial matrix (matrix-roGFP) to quantify subcellular redox status in RAW macrophages (Fig. 6c, left). H2O2 and DTT treatment confirmed responsiveness of the roGFPs to altered redox states (Extended Data Fig. 6l). LPS triggered oxidation of IMS-roGFP, but not matrix-roGFP or cyto-roGFP (Fig. 6c, right), demonstrating roGFPs can monitor compartment-specific redox changes in macrophages, and supporting the hypothesis that LPS-induced mtROS is primarily produced by Complex III into the IMS8, 39, 40. Corroborating the MitoPY1 data, pretreatment with hydroxyestrogens, but not their precursor or methylated metabolites, significantly reduced IMS-roGFP oxidation by LPS (Fig. 6d). Together, these results demonstrate acute hydroxyestrogen-driven mitochondrial stress triggers mitohormetic mitochondrial OSR adaptations in macrophages, reducing basal and LPS-driven mtROS production.
We also tested whether mitohormetic OSR adaptations could protect macrophages against subsequent oxidative stress insults. For murine macrophages, our strategy is outlined in Fig. 6e. Following overnight vehicle or 4-OHE1 treatment, macrophage viability assessment by flow cytometry revealed most cells fell into a live forward scatter/side scatter (FS/SS) gate and excluded DAPI (Fig. 6e, right, top row). We then treated these macrophages with menadione, a redox cycling quinone that produces toxic levels of mitochondrial superoxide38. While an apoptotic cell population (indicated by FS/SS shift and DAPI uptake) appeared in our control cultures, this population did not appear in 4-OHE1-pretreated macrophages (Fig. 6e, right, bottom row). Menadione resistance was specifically conferred by 4-OHE1, and not E1 or 4-MeOE1 (Fig. 6f), was sensitive to NAC but not MitoQ pretreatment (Extended Data Fig. 6m), and occurred in BMDMs (Extended Data Fig. 6n). THP1 and U937 cells (which we found to be menadione-resistant) treated with 4-OHE1 acquired resistance to increased intracellular oxidative stress caused by exogenous H2O2, demonstrating this OSR adaptation is conserved in human cells (Extended Data Fig. 6o). Thus, mitohormesis triggered by acute hydroxyestrogen-driven mitochondrial stress confers macrophages with increased mitochondrial OSR and lasting “vaccine-like protection”13 against subsequent oxidative stress insults.
LPS-driven mitochondrial stress also triggers mitohormesis
Having characterized the adaptations to hydroxyestrogen-driven mitochondrial stress, we next wondered what this pharmacologically-induced mitohormesis could teach us about how macrophages respond to acute LPS-driven mitochondrial stress. Oxidative damage, GST depletion, and upregulation of cytoprotective genes occurs rapidly (1–6 hours) following LPS treatment8–10, likely in response to a combination of increased mitochondrial oxygen consumption and mtROS production6, 8, 26, 27, and increased mitochondrial production of electrophilic itaconate. However, whether LPS-driven oxidative and electrophilic mitochondrial stress triggers mitohormesis is unknown.
To test the similarity between the mitochondrial stress caused by 4-OHE1 and LPS at the transcriptional level, we performed RNA-seq on BMDMs treated for 6 and 24 hours with either 4-OHE1 or LPS. This revealed an extremely high degree of overlap for both activated and repressed genes at each timepoint (Fig. 7a, Supplementary Table 7). Chi-square tests confirmed such overlap would be extremely unlikely by chance (Supplementary Table 8), suggesting 4-OHE1 closely mimics physiological oxidative and electrophilic mitochondrial stress induced by LPS. GO analysis of genes upregulated by both 4-OHE1 and LPS revealed enrichment for categories including “Regulation of cellular response to stress”, “Protein folding”, and “Detoxification of ROS” (Fig. 7b, Extended Data Fig. 7a). Examination of genes in these categories revealed upregulation of HSF1-regulated chaperones that control mitochondrial protein folding37, and enzymes of the peroxiredoxin/thioredoxin system that scavenge mitochondrial H2O2, by both 4-OHE1 and LPS (Fig. 7c, Extended Data Fig. 7b). 4-OHE1/LPS co-treatment further enhanced upregulation of many of these genes (Fig. 7d).
Figure 7. LPS-driven mitochondrial stress triggers mitohormesis.
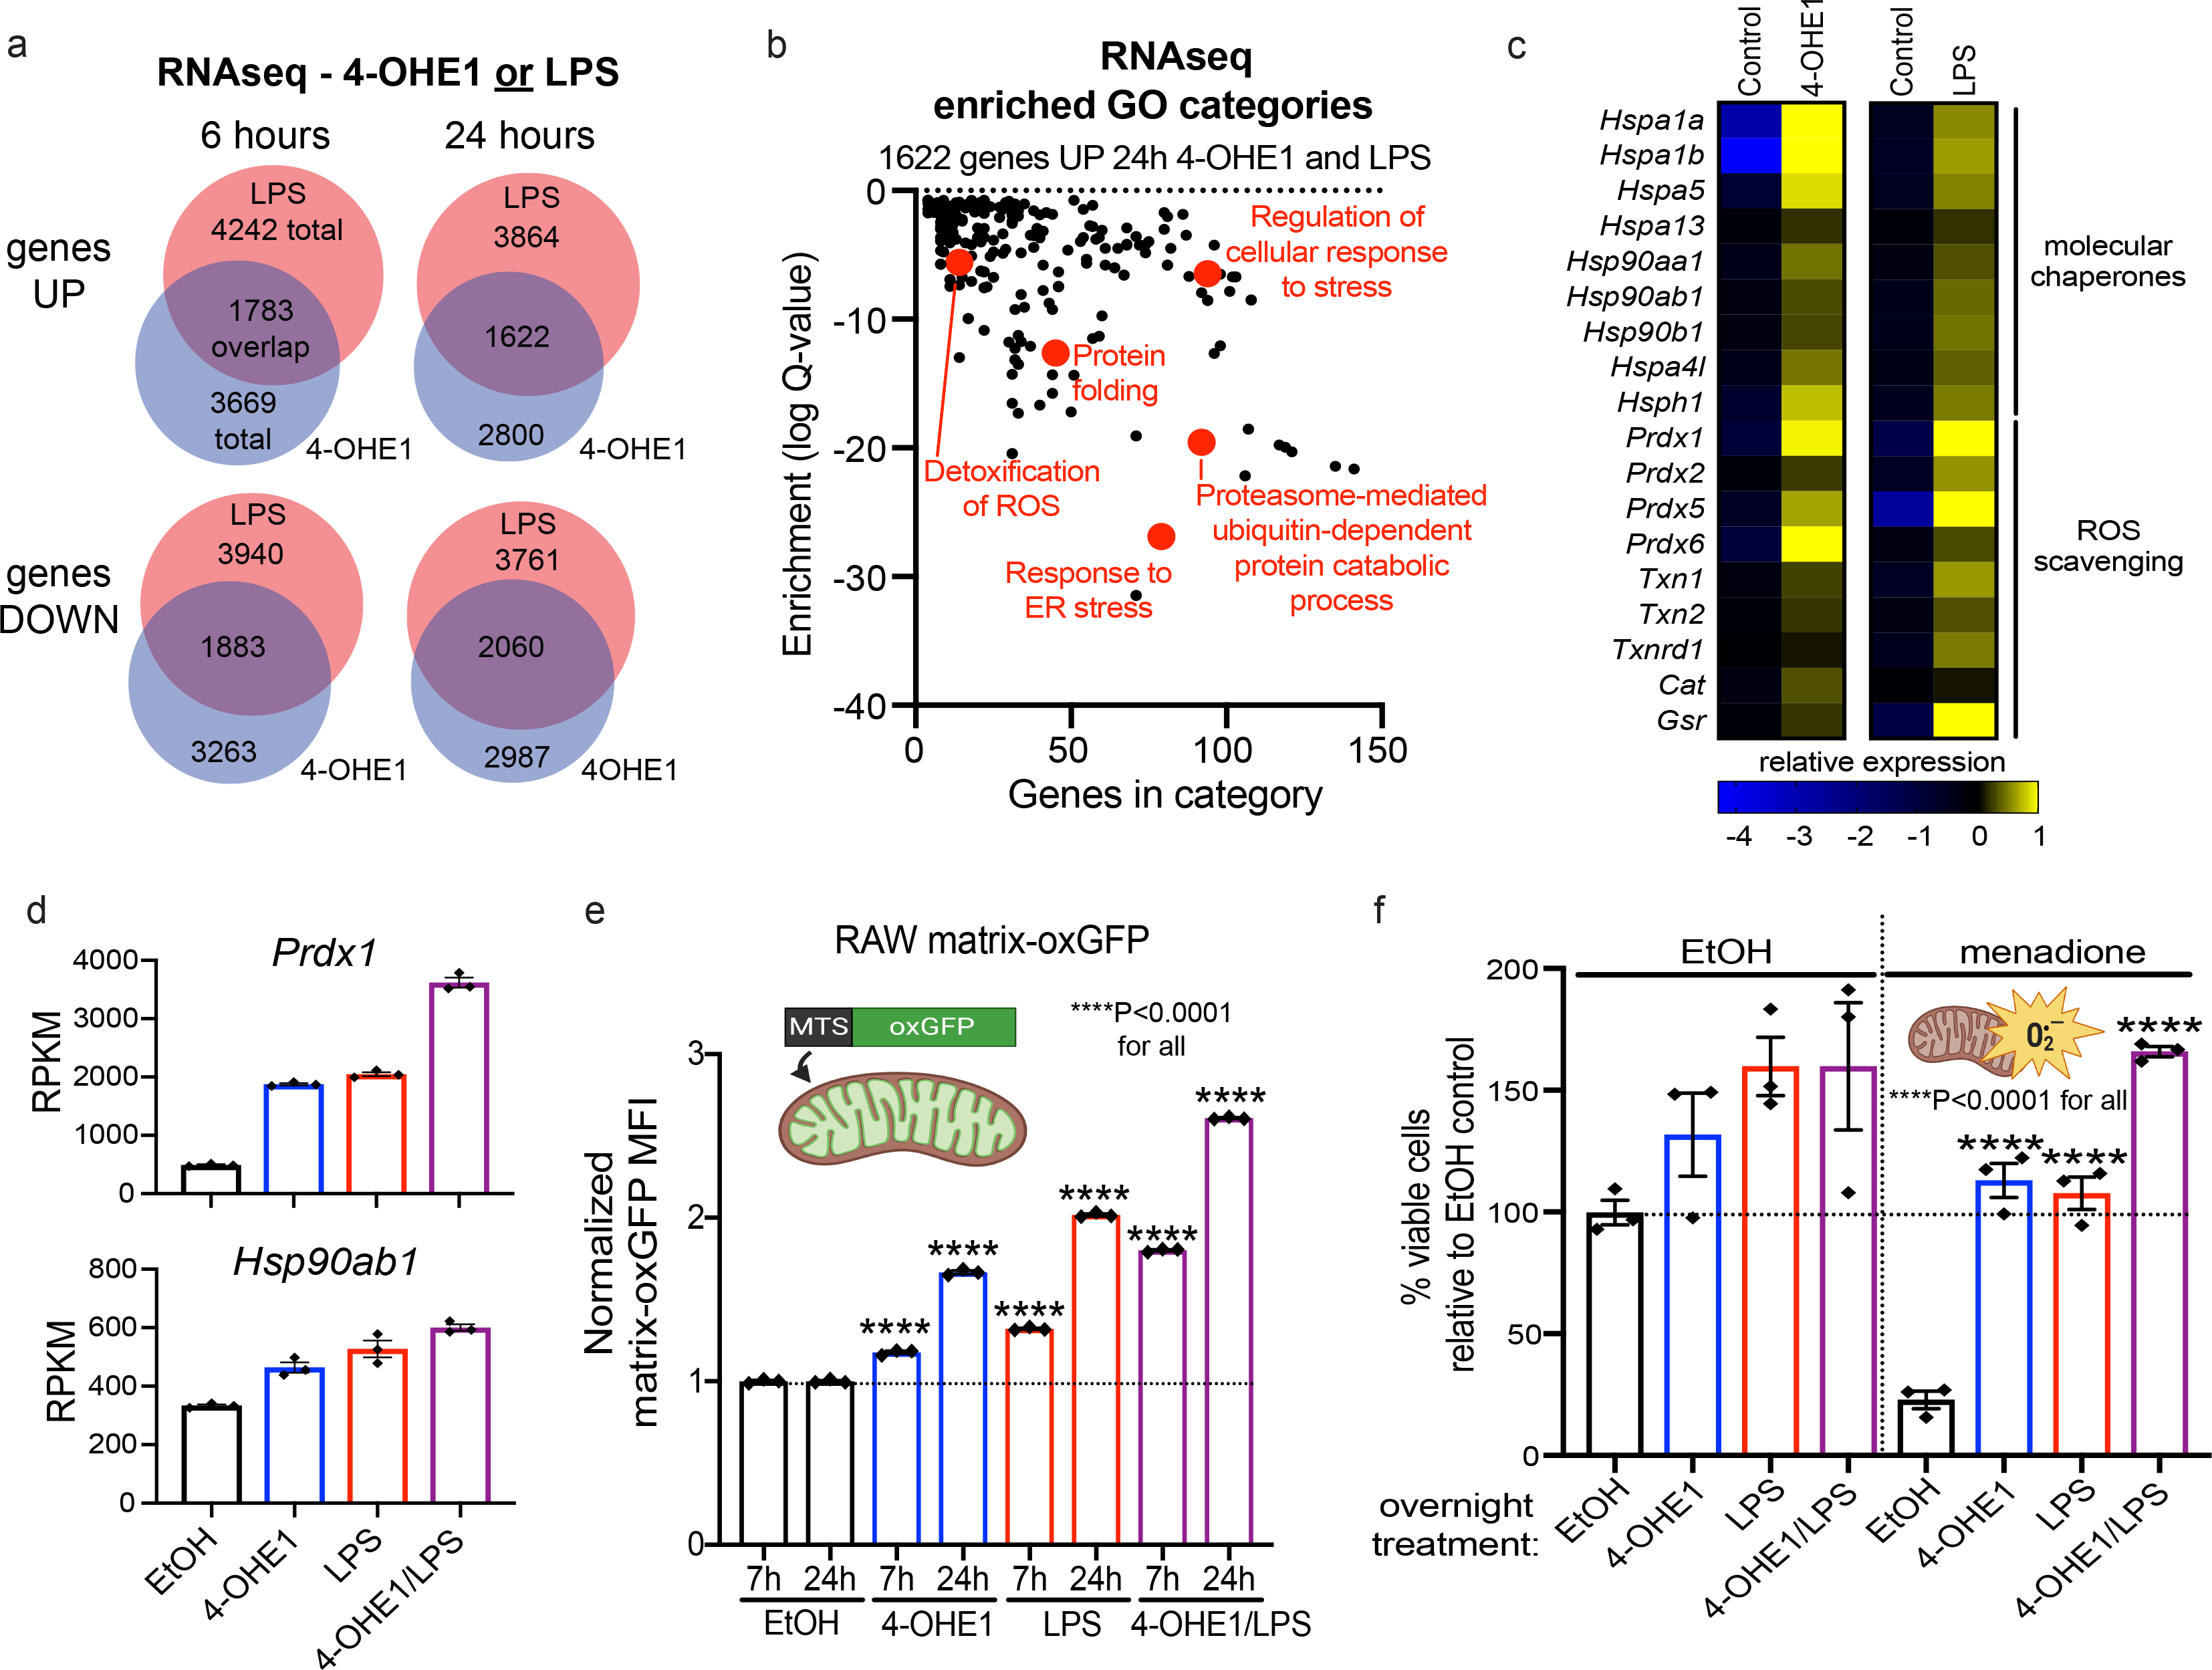
a. BMDMs were treated with 4-OHE1 (5μM) or LPS alone for 6 or 24h, and RNA-seq was performed. Venn diagrams show overlap between genes significantly upregulated or downregulated by either treatment relative to controls.
b. GO analysis of 1622 genes upregulated by both 4-OHE1 and LPS at 24h.
c. Heatmap showing relative expression* of select genes upregulated by both 4-OHE1 and LPS at 24h. (*DESeq2 counts centered on the mean of each gene)
d. Expression of Prdx1 and Hsp90ab1 (RPKM) at 24h from RNA-seq.
e. Matrix-oxGFP RAW macrophages treated with EtOH, 4-OHE1 (5μM), LPS, or both, for indicated times and matrix-oxGFP florescence quantified by flow cytometry. ****P<0.001 by unpaired, two-sided Student’s T Test (planned comparisons) versus time-matched EtOH control sample.
f. Menadione resistance assay in BMDMs treated overnight (18–24h) with EtOH, 4-OHE1 (5μM), LPS, or both, before treatment with EtOH vehicle control or menadione (50μM, 4h) and viability assessment by flow cytometry. ****P<0.001 by unpaired, two-sided Student’s T Test (planned comparisons) versus EtOH +menadione sample.
RNA-seq RPKM and flow cytometry data represented as mean ± SEM. Each data point is an independent biological replicate (n=3 for each condition). RNA-seq study was performed once. Flow cytometry data representative of at least 2 independent experiments.
Given the highly similar transcriptional response to mitochondrial stress caused by 4-OHE1 and LPS, we tested if LPS treatment triggered mitohormesis. With regards to mitochondrial chaperone activity, treatment of RAW matrix-oxGFP reporter cells with LPS drove a progressive increase in fluorescence in a manner identical to 4-OHE1 treatment (Fig. 7e). And like stress-induced gene expression, 4-OHE1/LPS co-treatment enhanced this effect. This suggests that the increased chaperone expression in response to both 4-OHE1 and LPS contributes to increased mitochondrial chaperone activity. Indeed, HSF1 transcriptional inhibition blunted increased matrix-oxGFP fluorescence in response to both 4-OHE1 and LPS (Extended Data Fig. 7c). And like 4-OHE1, LPS enhanced MitoTracker Green signal in macrophages without a significant increase in mtDNA content (Extended Data Fig. 7d, e), suggesting enhanced mitochondrial volume and/or surface area for dye uptake. Finally, LPS enhanced matrix-oxGFP fluorescence in THP-1 and U937 reporter cells, demonstrating conservation of this response across species (Extended Data Fig. 7f).
To test if acute LPS-driven mitochondrial stress resulted in adaptive OSR, we repeated our menadione resistance experiments. Overnight treatment with either 4-OHE1 or LPS increased BMDM viability relative to controls, with 4-OHE1/LPS co-treatment enhancing this effect (Fig. 7f, left). Menadione significantly decreased viability in control cells; however, both 4-OHE1- and LPS-treated macrophages were resistant to menadione-induced toxicity, with 4-OHE1/LPS co-treatment enhancing resistance (Fig. 7f, right). This suggests the increased expression of mtROS scavenging enzymes in response to both 4-OHE1 and LPS contributes to adaptive OSR. Induction of mtROS scavengers by 4-OHE1/LPS was impaired in NRF2 KO BMDMs, suggesting NRF2 controls this program (Extended Data. Fig. 7g). LPS treatment afforded THP-1 cells resistance against oxidative stress, showing conservation of this response in human cells (Extended Data Fig. 7h). Together, this data demonstrates that 4-OHE1-driven mitochondrial stress closely mimics physiological, LPS-driven mitochondrial stress, and that both trigger classic mitohormetic adaptations in macrophages.
Mitohormetic metabolic reprogramming enforces LPS tolerance
Following primary LPS exposure, macrophages transition to an LPS-tolerant state where proinflammatory gene induction is refractory to upregulation by secondary LPS treatment (Fig. 8a). Many mechanistic explanations for LPS tolerance have been proposed41, including upregulation of negative regulators of TLR4 signaling, and production of anti-inflammatory cytokines. However, recent evidence suggests that suppression of mitochondrial oxidative metabolism following LPS exposure limits acetyl-CoA production required for proinflammatory gene transcription27 (Fig. 8a). ETC inhibition by LPS-induced nitric oxide (NO) has been proposed to drive this suppression; however, Nos2-defficient macrophages still show significant suppression of mitochondrial oxidative metabolism following LPS treatment42. Metabolic reprogramming is often a part of mitohormetic responses to mitochondrial stress, as a shift away from mitochondrial oxidative metabolism towards aerobic glycolysis provides a damaged mitochondrial network an opportunity to recover from stress, while simultaneously augmenting ATP and NADPH production for energy and antioxidant defense, respectively12, 24, 25. Thus, we wondered if the mitohormesis we characterized in LPS-treated macrophages, which includes increased mitochondrial chaperone activity and OSR, also includes metabolic reprogramming that enforces tolerance via suppression of mitochondrial oxidative metabolism (Fig. 8a). In other words, we hypothesized that mitochondrial stress is a key signal that triggers the transition from an LPS-responsive to LPS-tolerant state via mitohormesis.
Figure 8. Mitohormesis in macrophages involves metabolic reprogramming that enforces an LPS-tolerant state.

a. Schematic describing how mitochondrial oxidative metabolism (blue line) supports proinflammatory gene expression (orange line) after LPS treatment, but is suppressed as macrophages transition to an LPS-tolerant state where proinflammatory genes are refractory to upregulation by secondary LPS exposure. Mitohormetic adaptations (red line) occur in parallel with this process, but whether suppression of mitochondrial oxidative metabolism is a coincident mitohormetic adaptation is unknown.
b. Seahorse energy map plotting basal oxygen consumption rate (OCR) versus basal extracellular acidification rate (ECAR) in RAW macrophages treated overnight (18–24h) with EtOH, 4-OHE1 (5μM), LPS, or both.
c. Seahorse mitochondrial stress test in RAW macrophages treated overnight (18–24h) with EtOH, 4-OHE1 (5μM), LPS, or both.
d. Il1b qPCR in RAW macrophages treated overnight (18–24h) with EtOH, 4-OHE1 (5μM), LPS, or both before treatments were washed out and cells allowed to recover (1–2h) before secondary LPS stimulation for 6h.
e. Same as d., with CoA (2.5mM) provided to cells during the washout/recovery period before secondary LPS stim.
f. Relative expression* of select genes in BMDMs treated with EtOH, 4-OHE1 (5μM), or LPS for 24h (*log2-transformed RPKM centered on the mean of each gene).
g. Model depicting how oxidative and electrophilic stress in LPS-stimulated macrophages drives mitohormesis and tolerance, and how hydroxyestrogens co-opt this stress response.
h. RAW macrophages pretreated 1h with vehicle or MitoQ (1μM), then treated overnight (18–24h) with primary LPS before treatments were washed out and cells allowed to recover (1–2h) before 6h secondary LPS stimulation and Il1b qPCR.
For qPCR, each data point is an independent biological replicate (n=2, data represented as mean), and data is representative of 2 independent experiments. Seahorse data is representative of 2 independent experiments with n=5 independent biological replicates per condition (represented as mean ± SEM). Energy map represents the average of 3 consecutive basal OCR and ECAR measurements.
If this hypothesis is true, then mitochondrial stress alone, separate from other TLR4-dependent events, should be sufficient to trigger metabolic reprogramming to an LPS-tolerant state. Given 4-OHE1-driven mitochondrial stress closely mimicked LPS-driven mitochondrial stress, we tested if 4-OHE1 was sufficient to trigger mitohormetic metabolic reprogramming. Macrophages were treated with vehicle control, 4-OHE1, LPS, or both 4-OHE1/LPS for a tolerizing duration before treatments were washed out and cells subjected to Seahorse respirometry. Plotting extracellular acidification rate (ECAR, a proxy for glycolysis) versus oxygen consumption rate (OCR, a proxy for mitochondrial oxidative metabolism) showed that while control macrophages are relatively aerobic, both 4-OHE1 and LPS treatment shifted the macrophages away from mitochondrial oxidative metabolism and towards aerobic glycolysis, with 4-OHE1/LPS cotreatment enhancing this metabolic shift (Fig. 8b). Mitochondrial stress testing revealed both 4-OHE1 and LPS significantly reduced basal and maximal OCR, with 4-OHE1/LPS cotreatment causing an even stronger reduction (Fig. 8c, Extended Data Fig. 8a,b). Thus, 4-OHE1-driven mitochondrial stress is sufficient to trigger metabolic reprogramming similar to that observed in LPS-treated macrophages.
To test if macrophages metabolically reprogrammed by 4-OHE1 were LPS-tolerant, cells were treated with vehicle, 4-OHE1, LPS, or both for a tolerizing duration (18–24h) before treatments were washed out and cells allowed to recover before secondary LPS stimulation and Il1b qPCR (Fig. 8d, Extended Data 8c). While naïve macrophages responded robustly, cells treated with primary LPS showed classic tolerance and impaired Il1b upregulation during restimulation. Cells treated with 4-OHE1 also displayed impaired Il1b induction, demonstrating that 4-OHE1-induced metabolic reprogramming coincides with transition to an LPS-tolerant state. And in agreement with 4-OHE1/LPS cotreatment driving a stronger metabolic shift, cotreated macrophages displayed a more severely impaired secondary LPS response. Cells tolerized with LPS, 4-OHE1 or both 4-OHE1/LPS displayed impaired upregulation of mtROS in response to secondary LPS compared to naïve macrophages (Extended Data Fig. 8d), likely due to reduced OCR, and the OSR program upregulated during mitohormesis. As mtROS regulates inflammasome activation, we confirmed that 4-OHE1, but not E2, induced tolerance that impaired IL-1β secretion (Extended Data Fig. 8e). 4-OHE1 also induced tolerance in THP-1 cells, demonstrating this effect is conserved (Extended Data Fig. 8f). CoA supplementation during the washout and recovery period boosted secondary LPS responsiveness in tolerized macrophages, suggesting impaired CoA/acetyl-CoA homeostasis in the tolerized state (Fig. 8e). Together, these data demonstrate that in addition to increased mitochondrial chaperone activity and OSR, 4-OHE1-induced mitohormesis involves metabolic reprogramming to an LPS-tolerant state essentially identical to that induced by LPS. Our RNA-seq data revealed that unlike LPS, 4-OHE1-induced LPS tolerance occurs in the absence of transcriptional upregulation of negative regulators of TLR4 signaling (Tnfaip3), anti-inflammatory cytokines (Il10), and without Nos2 induction (Fig. 8f). Thus, mitohormetic metabolic reprogramming to an LPS-tolerant state can be uncoupled from TLR4 signaling, and mitochondrial stress is a sufficient signal to trigger this reprogramming in the absence of TLR4-dependent events that have been proposed to enforce tolerance.
We propose a model where mtROS- and mtRES-induced mitochondrial stress trigger mitohormesis, and in turn, a state of “mitohormetic tolerance” (Fig. 8g). One prediction of this model is that reducing mtROS/mtRES during primary LPS exposure would impair the oxidative stress signaling that leads to tolerance, and enhance secondary LPS responsiveness. mtMP has been reported to increase following LPS treatment, inducing reverse electron transport (RET) to drive mtROS production34; however, ratiometric mtMP measurements with JC-9 revealed no increase post-LPS treatment (Extended Data Fig. 8g), suggesting mtROS is a product of increased mitochondrial ETC flux and oxygen consumption that occurs 0.5–2 hours post-LPS8, 27. Scavenging superoxide with MitoQ during primary LPS exposure resulted in a small, but significant, rescue of secondary LPS responsiveness (Fig. 8h). This suggest mtROS is partially responsible for mitohormetic tolerance and restraining macrophage inflammatory responsiveness, a model that we propose warrants further investigation.
Discussion
Whether intrinsically-generated oxidative and electrophilic mitochondrial stress affects macrophage function is unknown. Moreover, the mechanisms controlling macrophage tolerance are unclear. We identified hydroxyestrogens as potent anti-inflammatories, and through study of their pharmacological effects, we demonstrate that both hydroxyestrogen- and LPS-driven mitochondrial stress trigger a set of stress adaptations known as mitohormesis. One of these adaptations, the suppression of mitochondrial oxidative metabolism, suppresses the macrophage response to secondary LPS, revealing mitohormesis as a stress response that enforces LPS tolerance to prevent excessive inflammation. Thus, in addition to their anti-microbial roles, mtROS/mtRES are signaling molecules that trigger negative feedback to restrain inflammation via mitohormesis, a process that can be pharmacologically targeted (Fig. 8g).
While we provide evidence that HSF1 and NRF2 regulate specific mitohormetic adaptations (increased mitochondrial chaperone activity and OSR, respectively), the identity of the transcription factor(s) coordinating suppression of mitochondrial oxidative metabolism remains unclear. ATF4 is an attractive candidate, as its C. elegans orthologue ATFS-1 simultaneously suppresses ETC genes and upregulates glycolytic genes in response to mitochondrial stress24. For LPS-induced mitohormesis, the relative contributions of mtROS, itaconate, and other mtRES (e.g. 4-hydroxynonenal) in triggering mitohormesis and enforcing tolerance will require further investigation. While we provide evidence suggesting mtROS is partially required for mitohormetic tolerance, macrophages with reduced Irg1 expression are resistant to LPS-induced suppression of mitochondrial oxidative metabolism7 and tolerance43, suggesting multiple reactive molecules contribute to triggering mitohormesis. Overall, we speculate that metabolic reprogramming involves both transcriptional changes, along with post-transcriptional alterations in mitochondrial composition by the ubiquitin-proteasome system, which can tune mitochondrial composition and function in response to oxidative and metabolic stress44. Importantly, whether ROS/RES trigger mitohormetic tolerance in clinical situations of immunosuppression where restoring myeloid inflammatory responses would be beneficial will be important to investigate. Transcriptional profiling of myeloid cells from sepsis and cancer patients has revealed overlapping signatures of reduced proinflammatory gene expression45 and increased aerobic glycolysis46, and ROS/RES production have been linked to myeloid cell metabolic alterations and immunosuppression47, 48. We propose myeloid cells performing high levels of aerobic glycolysis as a consequence of undergoing mitohormesis may represent “exhausted” cells unable to convert glucose-derived carbon into acetyl-CoA to epigenetically activate inflammatory responses. Further work with preclinical models and clinical samples is needed to test the relevance of mitohormesis to in vivo immunosupression. Better defining the transcriptomic, proteomic, metabolic, and functional adaptations associated with macrophage mitohormesis can help determine whether this stress response occurs in vivo, and whether it can be used to stratify outcomes, as a diagnostic to inform clinical decisions, or targeted therapeutically.
From an anti-inflammatory therapeutic perspective, these findings demonstrate that beyond acute depletion of acetyl-CoA, inducing mitohormetic tolerance represents a mechanism by which the reactive, lipophilic hydroxyestrogens achieve lasting immunosuppression. We propose triggering mitohormesis in macrophages by causing oxidative and electrophilic mitochondrial stress with lipophilic electrophiles represents a novel therapeutic strategy to combat inflammation that works by co-opting the physiological response to mitochondrial stress that occurs naturally after TLR engagement and during transition to a tolerant state. In other words, by promoting eustress49 (i.e. moderate mitochondrial stress), a benefit is achieved (i.e. reduced inflammation). This concept of a mitochondria-targeted, pro-oxidant therapy to repress inflammation via triggering mitohormetic metabolic reprogramming stands in direct opposition to the concept of using mitochondria-targeted anti-oxidants as anti-inflammatories8, 34, 39, 40. In situations where mitochondrially-targeted anti-oxidants show anti-inflammatory effects, it will be important to delineate whether this activity is due to quenching of redox signals, or secondary effects of mitochondrial stress adaptations triggered by the small molecule50. More broadly, given the failures of anti-oxidants in clinical trials, perhaps in inflammation and other pathologies (e.g. aging), transiently increasing oxidative eustress to trigger the body’s own stress defenses (as occurs during physical activity and caloric restriction) represents a more tractable therapeutic approach than trying to mimic endogenous defense systems that have evolved over millions of years with loosely-targeted anti-oxidants.
Methods
Animals
All experiments were approved by the UC Berkeley Animal Care and Use Committee (ACUC) to ensure ethical use of animals (AUP-2017–02-9539–1), and performed under the supervision of the UC Berkeley Office of Laboratory and Animal Care (OLAC). Nrf2 KO (017009) and C57BL/6J (000664) mice were purchased from Jackson, and C57BL/6N (027) mice from Charles River. ERα flox mice and LysM-Cre mice were generous gifts from Dr. Kenneth Korach (NIH) and Dr. Greg Barton (UC Berkeley), respectively. Animals were housed under standard conditions (20–23°C, 50% humidity, 12h/12h light/dark cycle).
Cell culture
Bone marrow-derived macrophages (BMDMs) were prepared from 6–12-week-old female C57BL/6N or C57BL/6J mice by plating bone marrow in DMEM (Corning 10–013-CV) supplemented with 10% FBS (HyClone SH30071.03), pen/strep (Gibco), and 20ng/mL murine M-CSF (Shenandoah) in non-TC treated Petri dishes, refreshing media every 3 days. Cells were harvested by scraping and plated in TC-treated plates/dishes on days 7–10. For initial estrogen metabolite experiments, phenol red-free DMEM (Corning 17–205-CV) and 10% charcoal-stripped FBS (HyClone SH30068.03) were used to eliminate estrogenic effects of phenol red and serum estrogens. RAW 264.7 macrophages and HEK293T cells were cultured in DMEM with 10% FBS and pen/strep. The latter were used to produce lentivirus with psPAX2 (Addgene 12260), pMD2.G (Addgene 12259), and lentiviral constructs described hereafter.
U937s and THP-1s were cultured in RPMI 1640 (Gibco) supplemented with 10% FBS, pen/strep, 1mM sodium pyruvate (Gibco), and non-essential amino acids (Gibco). Media was adjusted to 4.5g/L glucose and 50μM 2-mercaptoethanol (both Gibco) for THP-1s. All cell lines from ATCC via the UC Berkeley Cell Culture Facility.
Chemicals
Estrogens were from Steraloids Inc. (Supplementary Table 1). KRIBB11 was from EMD Millipore (385570). Pam3CSK4 (tlrl-pms) and ODN (tlr1–1826-1) were from InvivoGen. LPS (L3024), poly IC (P0913), diethyl maleate (D97703), sodium acetate (S5636), celastrol (C0869), NAC (A7250), itaconate (I29204), oligomycin (495455), FCCP (C2920), and antimycin A (A8674) were from Sigma. MitoQ (89950), nigericin (11437), and rotenone (13995) were from Cayman. Coenzyme A and acetyl-CoA were from Sigma (C4780, A2056) and Cayman (16147, 16160). LPS, Pam3CSK4, pIC, and ODN were used at 100ng/mL, 100ng/mL, 25μg/mL, and 1μM, respectively.
Quantitative real-time PCR (qPCR) for gene expression
Cells were lysed in Trizol (Invitrogen) and total RNA isolated using Direct-zol kit (Zymo). cDNA was prepared with Superscript III (Invitrogen). qPCR was performed on a QuantStudio6 qPCR machine (Thermo Fisher) using ROX low SYBR FAST mastermix (KAPA/Roche). Data was quantified using QuantStudio Real Time PCR Software v1.3. Primers (IDT, Supplementary Table 9) were designed using Primer-BLAST. All data is normalized to Hprt expression using the delta-delta Ct method.
mtDNA qPCR
Cells were lysed in DNA isolation buffer (10 mM Tris-HCl pH 7.5, 50 mM NaCl, 6.25 mM MgCl2, 0.045% NP-40, 0.45% Tween-20). Lysate was supplemented with Proteinase K (NEB) and incubated 1 h at 56°C. Proteinase K was inactivated and 5μL of lysate used in qPCR reactions for mitochondrial and genomic DNA amplicons (see Supplemental Table 6 for primers).
RNA-seq
See GSE169731 for detailed experimental design and sample information. Libraries were prepared from total RNA using mRNA HyperPrep kit (KAPA/Roche) and unique dual index adaptors (IDT), qPCR quantified, and pooled for sequencing (Illumina HiSeq2500 or HiSeq4000). Reads were aligned using STAR and counted with HOMER. EdgeR and DESeq2 were used for differential expression analysis. Hierarchical clustering was performed using Cluster and visualized with Java TreeView. Heatmaps were produced using Java TreeView and GraphPad Prism 8. Gene ontology (GO) analysis was performed with Metascape. Promoter motif finding was performed using HOMER.
Western blotting
Cells/mitochondrial fractions were lysed in RIPA buffer with protease inhibitor cocktail (Roche) for 20 min on ice, followed by centrifugation 10,000g x 10 min at 4°C. Supernatant was quantified with DC Protein Assay (BioRad), 15–30μg of protein mixed with 5x NuPAGE loading dye and 2x NuPAGE reducing reagent (Life Technologies), and samples heated 10 min at 70°C. Samples were separated on NuPAGE 4–12% Bis-Tris gels (Life Technologies) against SeeBlue Plus2 prestained protein ladder (Thermo Fisher) using NuPAGE MOPS buffer (Life Technologies). Proteins were transferred to PVDF membrane (GE Healthcare), which was blocked (SuperBlock, Thermo Fisher) for 1 hour. Membranes were probed with primary antibodies overnight at 4°C, followed by 0.1% TBS-T washes and fluorophore-conjugated secondary antibody probing at room temperature for 1 hour. After additional washes, fluorescence was visualized using Licor Odyssey imaging system. Primary antibodies: Tubulin (CP06, Cal Biochem, 1:1000), pro-IL-1β (AF-401-NA, R&D Systems, 1:500), NRF2 (MABE1799, EMD Millipore, 1:500), vinculin (sc-73614, Santa Cruz, 1:2000), VDAC (ab154856, Abcam, 1:2000). Secondary antibodies (1:10,000 for all): AlexaFluor 680 conjugates from Invitrogen, and IRDye 800CW conjugates from Rockland. All antibodies were diluted in 0.1% TBS-T with 5% BSA.
IL-1β ELISA
Detection of murine and human IL-1β in serum and cell supernatants was performed using ELISA kits according to manufacturer’s instructions (Invitrogen cat. Nos. 88–7013-22 and 88–7261-22, respectively). For supernatants, BMDMs (7.5×10⁴ cells) and THP-1s (1.5×10⁵ cells) were plated in 24-well plates, and 200μL media harvested for ELISA.
Acute in vivo inflammation
8-week-old male C57BL/6J mice were injected intraperitoneally (IP) with EtOH or estrogens (10mg/kg), followed by IP injection of PBS or LPS (2mg/kg) 1 hour later. After 3 hours, submandibular bleeding was performed for measurement of serum IL-1β. At 4 hours, mice were sacrificed and splenocytes isolated by crushing spleen through 40μm filter, RBC lysis, and cell pellet lysis in Trizol.
Chronic in vivo inflammation
For RNA-seq studies, 8-week-old male C57BL/6N mice were placed on high-fat diet (HFD) (Research Diets Inc., D12492, 60 kcal% fat, Fisher NC0004611) with subcutaneous (SQ) EtOH or estrogen injections (10mg/kg) every 6 days in rear flank. After 30 days, visceral white adipose tissue (vWAT) was isolated and stromal vascular fraction (SVF) prepared by digesting vWAT in DMEM with 0.1% collagenase (Sigma C6885) and 5% BSA for 1 hour at room temperature with gentle shaking. Sample was passed through a 70μm filter, RBCs lysed, and SVF stained on ice in FACs buffer (PBS with 10mM HEPES and 5% BSA). After Fc Block (BD Biosciences), cells were labeled with anti-CD45-PerCP-Cy5.5 (clone 30-F11, BioLegend), anti-F4/80-PE (clone BM8, eBioscience), and anti-CD11b-APC (clone M1/70, eBioscience)(all 1:100 dilutions). Cells were resuspended in FACs buffer with DAPI (Thermo Fisher D1306, used at 1:1×10⁵) and F4/80+CD11b+ macrophages sorted directly into Trizol-LS (Invitrogen). Total live cell counts were also determined using hemocytometer and Trypan Blue.
For metabolic studies using 8-week-old male C57BL/6J mice, after 30 days of normal chow (NC) or HFD-feeding and injections, mice were fasted overnight with water. The next morning, blood samples were collected from tail tips to measure fasting blood glucose (Accu-Chek glucometer, Aviva Plus test strips). Mice were then IP injected with 2% glucose solution (2g glucose/kg bodyweight) and blood glucose measurements recorded over time. For glucose-stimulated insulin secretion, this process was repeated for only the 0 and 15min timepoints, with larger blood samples collected from the lateral tail vein for serum insulin ELISA (Crystal Chem 90080). 48 hours after final SQ injections, mice were IP-injected with PBS or LPS (3 mg/kg), and cardiac puncture performed at 4.5 hours to collect blood for serum IL-1β ELISA. Splenocytes were isolated as described above.
Mitochondrial fractions for steroid extraction and LC-MS
RAW macrophages (15–30 million total) were treated with EtOH or 5μM 4-OHE1 for 1 hour before PBS wash and harvest. For whole cell steroid extraction, 1×10⁶ macrophages were pelleted (800g x 5 minutes, 4°C), flash frozen, and stored at −80°C. From remaining cells, mitochondrial fractions were isolated using a previously described method with modification51. Briefly, cells were resuspended in 2mL cell isolation buffer (IBc) in a 15mL conical and disrupted with sonication (Bioruptor, Diagenode). Mitochondrial fractions were isolated by differential centrifugation, flash frozen, and stored at −80°C. Fractions were checked for mitochondrial protein enrichment versus whole cell lysates by western blot.
For steroid extraction52, whole cell and mitochondrial fraction pellets were thawed and resuspended in 1 mL of acetonitrile (to confirm the method could extract 4-OHE1, we also performed extraction from 20μL cell culture media to which 2μL of 5mM 4-OHE1 was added). Samples were stored for 30 min at −20°C, then centrifuged for 5 min at 12000 × g at 4°C. Supernatant was transferred to a glass round-bottom tube and evaporated under N2 stream. Residue was resuspended in 2mL of 0.2M sodium acetate buffer (pH 5.0) and mixed with 10mL of hexane. The mixture was centrifuged for 2 min at 1200 × g, and the upper hexane layer transferred to a glass tube and evaporated under N2 with gentle heating at 25–30°C in a water bath (N-EVAP 112, Organomation Associates). The residue was reconstituted in 50μL of MeOH.
Samples were analyzed using a liquid chromatography system (LC; 1200 series, Agilent Technologies, Santa Clara, CA) equipped with a reversed-phase analytical column (length: 150 mm, inner diameter: 1.0 mm, particle size: 5 μm, Viva C18, Restek, Bellefonte, PA). The LC system was connected in line with an LTQ-Orbitrap-XL mass spectrometer equipped with an electrospray ionization (ESI) source and operated in the positive ion mode (Thermo Fisher Scientific, Waltham, MA). Mass spectrometry data acquisition and processing were performed using Xcalibur software (version 2.0.7, Thermo). Injection volumes between 2–5μL for all samples. The LC-MS is located in the QB3/Chemistry Mass Spectrometry Facility at the University of California, Berkeley.
isoTOP-ABPP
IsoTOP-ABPP was performed as previously described53. Briefly, proteomes (prepared from BMDMs treated with EtOH or 1μM 4-OHE1 for 1 hour) were labeled with IAyne (100μM) for 1 hour at room temperature, and subsequently treated with 100μM isotopically light (control) or heavy (treated) TEV-biotin and click chemistry was performed. Proteins were precipitated, washed, resolubilized and insoluble components were precipitated. Soluble proteome was diluted and labeled proteins were bound to avidin-agarose beads while rotating overnight at 4°C. Bead-linked proteins were enriched, then resuspended, alkylated with iodoacetamide, then washed and resuspended with sequencing grade trypsin overnight. Non-bead-linked tryptic peptides were washed away, and the TEV-biotin tag was digested overnight in TEV buffer containing and Ac-TEV protease at 29°C. Liberated peptides were diluted in water, acidified, and stored at −80°C.
Analysis was performed using Multidimensional Protein Identification Technology (MudPIT) with an Orbitrap Q Exactive Plus mass spectrometer (Thermo Fisher). Data was extracted in the form of MS1 and MS2 files using Raw Extractor 1.9.9.2 (Scripps Research Institute) and searched against the UniProt mouse database using ProLuCID search methodology in IP2 v.3 (Integrated Proteomics Applications, Inc). ProLUCID data was filtered through DTASelect to achieve a peptide false-positive rate below 1% and cysteine residues were searched with a static modification for carboxyaminomethylation (+57.02146 Da) and up to two differential modifications for the light or heavy TEV tags (+464.28596 or +470.29977 Da, respectively). Mitochondrial target enrichment was analysis was performed by comparing the isoTOP-ABPP target list to MitoCarta 2.054.
Metabolomics
BMDMs were cultured in DMEM (Corning 17–207-CV) supplemented with One Shot dialyzed FBS (Thermo Fisher), 1mM sodium pyruvate, 4mM L-glutamine, and 25mM glucose (all from Gibco). 5×10⁵ cells were treated with EtOH or 5μM 4-OHE1. After two hours, cells were washed with unsupplemented media, and provided DMEM described above except with 25mM 13C6-glucose (Cambridge Isotope Laboratories, CLM-1396-PK). After 30 minutes of labeling, cells were washed with PBS and moved to dry ice for addition of 1mL ice cold 80% MeOH. Cells were incubated at −80°C for 15 minutes, scraped on dry ice, and moved to Safe Lock 1.5mL Eppendorf tubes (cat.022363204). After centrifugation 20,000g x 10 min at 4°C, the cell pellet was saved for protein quantification, while the MeOH extract was transferred to a new tube and evaporated overnight at RT using a SpeedVac. Dried extracts were stored at −80°C.
Extracts were resuspended in 50% ACN:water and 1/10th was loaded onto a Luna 3um NH2 100A (150 × 2.0 mm) column (Phenomenex). The chromatographic separation was performed on a Vanquish Flex (Thermo Scientific) with mobile phases A (5 mM NH4AcO pH 9.9) and B (ACN) and a flow rate of 200μL/min. A linear gradient from 15% A to 95% A over 18 min was followed by 9 min isocratic flow at 95% A and reequilibration to 15% A. Metabolites were detected with a Thermo Scientific Q Exactive mass spectrometer run with polarity switching (+3.5 kV/− 3.5 kV) in full scan mode with an m/z range of 65–975. TraceFinder 4.1 (Thermo Scientific) was used to quantify the targeted metabolites by area under the curve using expected retention time and accurate mass measurements (< 5 ppm). Values were normalized to sample protein concentration. Relative amounts of metabolites were calculated by summing up the values for all isotopologues of a given metabolite. Fraction contributional (FC) of 13C carbons to total carbon for each metabolite was calculated as previously described55. Data analysis was performed using in-house R scripts.
ChIP-seq
Approximately 30 million BMDMs were treated with EtOH or 1μM hydroxyestrogen for 1 hour, followed by PBS or LPS (100ng/mL) stimulation for 30 minutes. Cells were washed with PBS and fixed with 0.67mg/mL DSG (Thermo Fisher) in PBS for 30 minutes at room temperature with shaking, followed by addition of paraformaldehyde (Electron Microscopy Sciences) to 1% and an additional 15 minutes of fixation. Fixation was quenched with 125mM glycine and shaking 10 min, after which cells were scraped and washed with PBS. Cell pellet was resuspended in 1.5mL ChIP RIPA buffer (20mM Tris HCl pH 8.0, 150mM NaCl, 2mM EDTA, 0.1% SDS, 1% Triton X-100) with protease inhibitors (Roche) and sonicated at 4°C for 60 minutes (Bioruptor sonicator, continuous cycles of 20 seconds ON/40 seconds OFF, “medium” setting). Samples were spun 20 min max speed at 4°C to remove insoluble material, and supernatant containing soluble sheared chromatin transferred to new tube, saving 1% volume for input library preparation. Immunoprecipitation was performed overnight at 4°C with 2μg of primary antibody (p65: Santa Cruz sc-372, H3K27ac: Abcam ab4729), or species-appropriate IgG control antibody (GenScript), conjugated to Protein A Dynabeads (Invitrogen). The next day, beads were captured with magnet and washed with wash buffer II (20mM Tris HCl pH 8.0, 150mM NaCl, 2mM EDTA, 1% Triton X-100, 0.5% NaDOC) 3 times, wash buffer III (10mM Tris HCl pH 8.0, 250mM LiCl, 2mM EDTA, 1% NP-40, 0.5% NaDOC) 3 times, and TE with 50mM NaCl two times (all supplemented with protease inhibitors, all washes on ice). Beads were then resuspended in 200μL elution buffer (50mM Tris HCl pH 8.0, 10mM EDTA, 1% SDS) for 30 minutes at 37°C to elute immunoprecipitated complexes. Eluent was collected, 10μL of 5M NaCl added, and DNA-protein crosslinks reversed overnight at 65°C. Samples were then treated with RNAse A (Thermo Fisher) for 1 hour at 37°C, Proteinase K (NEB) for 1 hour at 50°C, and DNA recovered with Zymo ChIP DNA Clean & Concentrator kit.
Sequencing libraries were prepared using an in-house protocol. Briefly, DNA was blunted, A-tailed, and ligated to NEXTFlex adaptors (Bioo). Libraries were PCR amplified, quantified, pooled, and sequenced (Illumina HiSeq2500). Reads were aligned using STAR, and HOMER findPeaks used to call peaks/regions relative to inputs. HOMER getDifferentialPeaks was used to identify peaks/regions with significantly altered read density, and HOMER annotatePeaks.pl was used to make read density histograms. Data is available at GSE169731.
Flow cytometry and cell sorting
All analysis was performed using LSR II, LSR Fortessa, or LSR Fortessa X20 analyzers (BD). All sorting was done on Influx or Aria Fusion sorters (BD). Data was collected using BD FACSDiva software and analyzed with FlowJo 10.5.2 (Tree Star).
Pro-IL-1β intracellular staining for flow cytometry
Cells were stained using FIX & PERM Kit (Thermo Fisher) according to manufacturer’s instructions with anti-pro-IL-1β (AF-401-NA, R&D Systems) and anti-goat AlexaFluor 647 (Invitrogen) antibodies.
matrix-oxGFP and roGFP RAW macrophages
Matrix-oxGFP macrophages: cells were transduced with lentivirus encoding oxGFP56 with N-terminally fused COX4L mitochondrial matrix targeting sequence and selected with 10μg/mL blasticidin (Thermo Fisher). roGFP macrophages: cells were transduced with lentiviral constructs encoding N-terminal fusions of roGFP to COX4L targeting sequence (matrix-roGFP), LACTB targeting sequence (inner membrane space- or IMS-roGFP), or nuclear export sequence (cyto-roGFP), and selected with 10ug/mL puromycin (Thermo Fisher). For flow cytometry analysis, cells were treated as described, placed on ice, washed with PBS, and scraped into PBS + DAPI. For roGFP macrophages, emission after excitation with 405nm (violet) and 488nm (blue) lasers was collected using a 505nm longpass:525/50 bandpass filter combination coupled to each respective laser. 10min treatment with H2O2 (1mM, Fisher H325) and DTT (10mM, Fisher BP172–5) were used to confirm roGFP responsiveness.
MitoTracker Green staining
Cells were treated as described and MitoTracker Green (Invitrogen M7514, 100nM) added directly to culture media for 45 min at 37°C. Cells were placed on ice, washed with PBS, and scraped into PBS + DAPI for flow cytometry analysis.
CellROX, MitoPY1, and CMH2DCFDA staining
CellROX Deep Red (Invitrogen C10422, 1.25μM, 30min), MitoPY1 (Tocris 4428, 10μM, 1h), and CM-H2DCFDA (Invitrogen C6827, 1.25μM, 30min) were added directly to culture media for staining at 37°C, with 500μM H2O2 (Fisher H325) added the last 5–10 minutes as positive control. Cells were placed on ice, washed with PBS, and scraped into PBS + viability dye (DAPI or TO-PRO-3, Thermo Fisher) for flow cytometry.
TMRE and JC-9 staining
TMRE (Sigma 87917, 10nM) and JC-9 (Thermo Fisher D22421, 500nM) were added directly to cell culture media for staining at 37°C for 30 minutes. Control samples were treated with oligomycin or FCCP (5μM each) for last 20 minutes of staining. Cells were placed on ice, washed with PBS, and scraped into PBS + viability dye for flow cytometry. JC-9 emission after excitation with 405nm (violet) laser was collected in two channels: red BV605 channel (595 LP, 610/20 BP filters), and green AmCyan channel (495 LP, 525/50 BP filters). The JC-9 ratio (red aggregate/green monomer) was calculated and plotted.
Menadione toxicity/mitochondrial superoxide resistance assay
Cells were treated 18–24 hours with EtOH, estrogens, or LPS. The next day, cells were treated with EtOH or 50μM menadione for 2–6 hours before being placed on ice, washed with PBS, and scraped into PBS + DAPI for flow cytometry. Cell viability was quantified as a percentage of total events collected for each sample, with viable cells defined as “live scatter gate” positive, DAPI negative events (with gates defined in EtOH control samples).
Seahorse respirometry
For mitochondrial stress test, cells were plated in XF24 microplates (50K per well) in a small volume of media (100μL) to promote attachment. After attachment, media volume was brought to 250μL, and cells were treated 18–24 hours as described. The next day, fresh XF Assay media (supplemented with 1mM sodium pyruvate and 25mM glucose) was prepared and brought to pH 7.4. Cells were washed once with media, after which 500μL of media was added and cells incubated at 37°C (no CO2) for 45–60 minutes. During this time, XF24 sensor cartridge (in calibrant overnight at 37°C) was loaded with Oligomycin, FCCP, Antimycin A, and Rotenone, and loaded into Agilent Seahorse XF24 analyzer. After cartridge calibration, cells were loaded for stress test with sequential injections of inhibitors (all at 1.5μM final concentration). For measurement of 4-OHE1’s acute effects on basal oxygen consumption, cells were moved into XF assay media as described, and treated with EtOH or 4-OHE1 immediately prior to loading into Seahorse analyzer. Data were analyzed using Wave v2.4 and extracted for plotting in GraphPad Prism 8.
Statistical analysis
All statistical analysis for qPCR and flow cytometry experiments was performed using GraphPad Prism 8 software. Metabolomics statistical analysis was performed using R. RNA-seq and ChIP-seq statistical analysis were performed using HOMER as a wrapper for R programs DESeq2 and EdgeR.
Illustrations
Images were created using BioRender (license to G.A.T.).
Data Availability Statement
All data sets generated and analyzed in this study are available from G.A.T. upon reasonable request. Raw mass spectrometry data are provided in Supplementary Tables 4–6. Processed isoTOP-ABPP and metabolomics data are provided as source data. RNA-seq and ChIP-seq data is available at the Gene Expression Omnibus (GSE169731).
Code Availability Statement
Code used in isoTOP-ABPP (https://github.com/NomuraRG) and metabolomics (https://github.com/graeberlab-ucla/MetabR) data processing and analysis are available at Github.
Extended Data
Extended Data Fig. 1. Hydroxyestrogens are anti-inflammatory in macrophages in vitro.

a. BMDMs pretreated for 1h with vehicle or 1μM hydroxyestrogens before 6h LPS stimulation and qPCR to validate targets identified in RNA-seq data. b. RAW macrophages pretreated for 1h with vehicle or 5μM estrogens before 6h LPS stimulation and Il1b qPCR. c. THP-1s and U937s pretreated for 1h with vehicle control or 10μM estrogens before 6h LPS stimulation and qPCR for indicated transcripts. d. RAW macrophages pretreated with EtOH or 5μM 4-OHE1 for 1h, followed by 6h LPS stimulation before pro-IL-1β measurement by western blot (left, n=2 biological replicates), or by intracellular staining and flow cytometry (right, representative data from 1 independent biological replicate for each condition shown). e. RAW macrophages pretreated with EtOH or 2.5μM estrogens for 1h, followed by 3h stimulation with LPS (TLR4), Pam3CSK4 (PAM, TLR2), polyinosinic-polycytidylic acid (pIC, TLR3), or CpG oligodeoxynucleotides (CpG, TLR9), and Il1b qPCR. Percentages indicate induction relative to max (100%) in the “EtOH +TLR ligand” control BMDMs for each ligand. f. BMDMs pretreated with EtOH or 1μM hydroxyestrogens in the absence (left) or presence (right) of 10μM ICI 182780 for 1h, followed by 6h LPS stimulation and Il1b qPCR. Each data point is an independent biological replicate. For n=2, data represented as mean; for n=3, mean ± SEM. P values from unpaired, two-sided Student’s T Test versus “EtOH +LPS” sample (planned comparison). qPCR and flow cytometry representative of 2 independent experiments. Western blot was performed once.
Extended Data Fig. 2. Hydroxyestrogens are anti-inflammatory in vivo.

a. Representative gating strategy for identifying forward scatter/side scatter (FS/SS) live gate+, DAPI-, CD45+, F4/80+CD11b+ visceral white adipose tissue (vWAT) macrophages for sorting and flow cytometry analysis. b. vWAT mass in mice after 30 days HFD feeding and EtOH control or estrogen injections. n=5 mice per group. c. vWAT macrophage cellularity in mice after 30 days HFD feeding and EtOH control or estrogen injections. n=5 mice per group. d. Relative expression* of select proinflammatory genes in vWAT macrophages from HFD-fed mice injected with EtOH, 4-OHE1, or E2 (*log2-transformed RPKM centered on the mean of each gene). n=5 mice per group. e. Blood glucose levels at 30min and 1h post-glucose injection in mice from Fig. 2f. n=10, 10, and 11 mice per condition. f. qPCR for Nos2 expression in splenocytes isolated from mice in Fig. 2h. n=3, 5, 5, and 5 mice per condition. For bar graphs, each data point is an independent biological replicate, and data is represented as mean ± SEM. All P values from unpaired, two-sided Student’s T Test (planned comparisons). HFD chronic inflammation model was performed once for transcriptional profiling (a-d), and a second time for metabolic studies (e,f).
Extended Data Fig. 3. Hydroxyestrogens activate NRF2, but NRF2 is dispensable for their anti-inflammatory effects.

a. GO analysis of 341 genes significantly upregulated in hydroxyestrogen-pretreated, LPS-stimulated BMDMs relative to control pretreatments. Red highlights GO categories involved in oxidative stress resistance (OSR) and detoxification of reactive oxygen species (ROS). b. WT and Nrf2 KO BMDMs were pretreated 1h with EtOH or indicated concentrations of 4-OHE1 before 6h LPS stimulation and qPCR for the NRF2 target gene Hmox1. Data represented as mean ± SEM. n=3 independent biological replicates per condition. P values from unpaired, two-sided Student’s T Test against corresponding WT sample (planned comparisons). Data representative of 2 independent experiments.
Extended Data Fig. 4. Hydroxyestrogens cause mitochondrial stress.

a. RAW macrophages treated with 5μM E2, or 5μM 4-OHE1 (with or without 30min MitoQ pretreatment, 1μM) for 1h before Hmox1 qPCR. n=3 independent biological replicates per condition. Data represented as mean ± SEM. P values from unpaired, two-sided Student’s T Test (planned comparisons). Data representative of 2 independent experiments. b-d. GO analysis of 341 genes significantly upregulated in hydroxyestrogen-pretreated, LPS-stimulated BMDMs relative to control pretreatments. Red highlights GO categories indicative of HSF1 and ATF4 activity, and upregulation of glycolysis/pentose phosphate pathway (PPP) genes. e. Experimental setup for steroid extraction and liquid chromatography/mass spectrometry (LC-MS) to measure 4-OHE1 extracted from cell culture media (top, control), or from whole cell and mitochondrial fractions prepared from RAW macrophages treated with 5μM 4-OHE1 for 1h (n=2 independent biological replicates per condition). f. Uncropped western blot confirming enrichment of mitochondrial marker VDAC, and depletion of cytoplasmic marker vinculin, in mitochondrial fractions versus whole cell lysates prepared from RAW macrophages. Blot is representative of two independent fractionations for LC-MS. g. top – Extracted ion chromatograms for 4-OHE1 (m/z = 287.1642). Peaks at retention time (RT, minutes) = 13.14 and RT=13.23 for the 4-OHE1 standard and media +4-OHE1 sample (denoted by red arrows) confirm our ability to extract and detect 4-OHE1. Lack of a defined, quantifiable chromatographic peak at RT = 13.1–13.2 for whole cell or mitochondrial extracts prepared from RAW macrophages indicates lack detectable, free 4-OHE1 in these samples. Data is representative of two independent fractionations and LC-MS runs with n=2 independent biological replicates per condition. bottom – Mass spectrum (positive ion mode) measured for 1mg/mL 4-OHE1 standard (injection volume = 2μL) showing detail for the [M+H]+ ion of 4-OHE1 at m/z = 287.1642. Mass range displayed: m/z = 287.1624–287.1660. h. Chi-square test comparing the observed frequency of mitochondrial targets (18) in our isoTOP-ABPP target list (118 total targets) versus the expected frequency of mitochondrial targets from MitoCarta 2.0.
Extended Data Fig. 5. Hydroxyestrogens impair mitochondrial acetyl-CoA production and histone acetylation required for LPS-induced proinflammatory gene transcription.

a. BMDMs pretreated 1h with EtOH or 4-OHE1 before 6h LPS stimulation and qPCR. The average percent induction at each 4-OHE1 concentration relative to control for each gene was calculated (n=3 independent biological replicates) and plotted. b. Abundance (area under the curve, AUC) of TCA cycle metabolites in EtOH versus 4-OHE1-treated BMDMs. c. Fractional contribution (FC) of 13C6-glucose-derived carbons to TCA cycle metabolites and amino acids in EtOH versus 4-OHE1-treated BMDMs (significant labeling in bold). d. UCSC genome browser H3K27ac ChIP-seq tracks displaying regions of decreased read density (arrows) in the Il1b, Cd69, Ifitm3, and Nfkbid loci. Read density was locally scaled, and black bar added to provide common reference point across tracks. e. RAW macrophages cultured in CoA (500μM, top) or acetyl-CoA (Ac-CoA, 500μM, bottom) (red bars) for 3h prior to 1h EtOH or 5μM 4-OHE1 pretreatment, 6h LPS stimulation, and Il1b qPCR. f. RAW macrophages cultured in sodium acetate (5mM, purple bar) or CoA (500μM, red bar) for 15 minutes prior to 1h EtOH or 5μM 4-OHE1 pretreatment, 1h LPS stimulation, and Il1b qPCR. g. Data from reference 33. Acetyl-CoA levels in HeLa cells treated with vehicle or 10μM FCCP for 24h. n=7 independent biological replicates per condition. h. RAW macrophages pretreated with vehicle or itaconate (7.5mM) for 1h before 3h LPS stimulation and Il1b qPCR. i. RAW macrophages cultured in acetyl-CoA (Ac-CoA, 200μM, bottom) for 2h prior to pretreatment with vehicle or itaconate for 1h before 3h LPS stimulation and Il1b qPCR. Each data point is an independent biological replicate. For n=2, data represented as mean; for n=3 or more, data represented as mean ± SEM. All P values from unpaired, two-sided Student’s T Test (planned comparisons). qPCR data representative of at least 2 independent experiments. Metabolomics and ChIP-seq studies were performed once.
Extended Data Fig. 6. Hydroxyestrogen-driven mitochondrial stress triggers mitohormesis.

a. Oxygen consumption in RAW macrophages after treatment with vehicle or 4-OHE1. 5 repeated measurements per condition were taken over 45min and averaged (n=4 independent biological replicates). b. Mitochondrial membrane potential in RAW macrophages treated 20min with vehicle, oligomycin, FCCP, or 4-OHE1 (5μM). c. RAW matrix-oxGFP macrophages treated 8h with vehicle or 4-OHE1 and fluorescence quantified by flow cytometry. d. qPCR for matrix-oxGFP transcript in parental macrophages and RAW matrix-oxGFP macrophages treated 8h with vehicle or estrogens (5μM). e. Mitochondrial DNA content in RAW macrophages treated with vehicle or 5μM 4-OHE1. f. RAW matrix-oxGFP macrophages pretreated 1h with NAC (5mM) or MitoQ (1μM) prior to 8h vehicle or 5μM 4-OHE1 treatment. g. RAW matrix-oxGFP macrophages pretreated 1h with KRIBB11 (10, 7.5, 5μM) before 8h treatment with 5μM 4-OHE1. h. i. RAW macrophages and BMDMs treated 8h with vehicle or estrogens (5μM) before MitoTracker Green staining and flow cytometry. j. THP-1 and U937 matrix-oxGFP cells treated 24h with vehicle or estrogens (5μM). k. BMDMs pretreated 1h with vehicle or estrogens (5μM) before 6h LPS stimulation, MitoPY1 staining, and flow cytometry. l. left – roGFP experimental strategy. right – RAW matrix-roGFP 405nm/488nM excitation ratio after H2O2 and DTT treatment. m. RAW macrophages pretreated 1h with NAC (5mM) or MitoQ (1μM) prior to vehicle or 5μM 4-OHE1 treatment (18h). Cells were then treated 2.5h with vehicle or 50μM menadione before viability assessment by flow cytometry. n. BMDMs treated overnight with vehicle or 5μM 4-OHE1 before vehicle (4h) or 50μM menadione (2,4h) treatment and viability assessment. o. THP-1 and U937s treated 7h with vehicle or estrogens (5μM) before H2O2 challenge, CM-H2DCFDA staining, and flow cytometry. Each data point is an independent biological replicate. For n=2, data represented as mean; for n=3 or more, data represented as mean ± SEM. All P values from unpaired, two-sided Student’s T Test (planned comparisons). All data representative of at least 2 independent experiments.
Extended Data Fig. 7. LPS-driven mitochondrial stress triggers mitohormesis.

a. GO analysis of 1622 genes upregulated by both 4-OHE1 and LPS at 6h in BMDMs. b. Heatmap showing relative expression* of select genes upregulated by both 4-OHE1 and LPS at 6h in BMDMs. (*DESeq2 counts centered on the mean of each gene). c. RAW matrix-oxGFP macrophages pretreated with vehicle or 10μM KRIBB11 for 1h before treatment with 4-OHE1 (5μM, left) or LPS (right) for 8h. Matrix-oxGFP fluorescence was quantified by flow cytometry. d. MitoTracker Green signal in RAW macrophages and BMDMs measured by flow cytometry after 24h LPS simulation. e. Mitochondrial DNA/genomic DNA (mtDNA/gDNA) ratio in RAW macrophages treated with PBS vehicle control or LPS for indicated times. f. THP-1 and U937 matrix-oxGFP reporter cells treated 24h with LPS before matrix-oxGFP fluorescence was quantified by flow cytometry. g. WT (left) and Nrf2 KO (right) BMDMs were treated with EtOH vehicle control, or 4-OHE1/LPS (5μM/100ng/mL) for 7h before Prdx6 qPCR. h. THP-1 cells were left untreated, or stimulated with LPS for 7h, before H2O2 treatment (500μM, 5min) and intracellular oxidative stress measurement via CM-H2DCFDA staining and flow cytometry. Each data point is an independent biological replicate. For n=2, data represented as mean; for n=3, mean ± SEM. P values from unpaired, two-sided Student’s T Test (planned comparisons). RNA-seq study was performed once. Flow cytometry and qPCR data representative of 2 independent experiments.
Extended Data Fig. 8. Mitohormesis in macrophages involves metabolic reprogramming that enforces an LPS-tolerant state.

a. Basal and maximal OCR from RAW macrophage mitochondrial stress test Fig. 8c. Data is average of 3 repeated measurements prior to oligomycin injection, or following FCCP injection, respectively. b. Mitochondrial stress test in BMDMs treated 20h with EtOH, 4-OHE1 (5μM), LPS, or both. n=5 independent biological replicates per condition. c. Il1b qPCR in BMDMs treated overnight (18–24h) with EtOH, 4-OHE1 (5μM), LPS, or both, before treatment wash out, recovery (1–2h), and 6h secondary LPS stimulation. Data is plotted as secondary LPS fold-induction versus cells with the same primary treatment but no secondary LPS. d. RAW macrophages treated overnight with EtOH, 4-OHE1 (5μM), LPS, or both, before wash out, recovery, and 6h secondary LPS stimulation for MitoPY1 staining and flow cytometry. Data plotted as percent change in MitoPY1 fluorescence versus no secondary LPS control for each primary treatment. P values are from comparison of treatment vs. naïve control. e. BMDMs treated overnight with EtOH or estrogens (5μM) before wash out, recovery, and 6h secondary LPS stimulation (100ng/mL, 2.5μM nigericin added the last hour) for IL-1β ELISA. f. IL1B qPCR in THP-1s treated overnight with EtOH, LPS, or 4-OHE1 (5μM) before wash out, recovery, and 6h secondary LPS stimulation. Data plotted as LPS fold-induction for cells with the same primary treatment but no secondary LPS. g. Mitochondrial membrane potential (mtMP) in RAW macrophages treated with LPS and stained with JC-9 for flow cytometry. Except for b, each data point is an independent biological replicate. For n=2, data represented as mean; for n=3 or greater, mean ± SEM. P values are from unpaired, two-sided Student’s T Test (planned comparisons). BMDM Seahorse and ELISA were performed once. All other data representative of 2 independent experiments.
Supplementary Material
Acknowledgements
We thank the following people for their essential contributions to this manuscript: Hector Nolla and Alma Valeros for assistance with cell sorting and flow cytometry; the Dillin Lab for JC-9 reagent; Dr. Ching Fang Chang, Pete Zushin, and Garret Dempsey for reagents, assistance with Seahorse respirometry, and helpful discussion; Dr. Hong Sik Yoo and Dr. Joseph Napoli for assistance with steroid extraction; Dr. Moritz Gaidt for helpful advice and reagents; members of the UC Berkeley Functional Genomics Laboratory and Vincent J. Coates Genomic Sequencing Laboratory for assistance with next-generation sequencing; Alison Killilea and the UC Berkeley Cell Culture facility for cell lines, Claudia Rosso, Kevin Shohat, Jordan Uyeki, and Daniel Tan of the UCLA Metabolomics Center for LC-MS data processing and analysis; members of the Welch Lab for assistance with SpeedVac; members of the Saijo Lab and UC Berkeley immunology community for helpful feedback; Dr. Andrew Dillin and Dr. Samantha Lewis for critical reading of the manuscript; Dr. Laura Lau for emotional support/baked goods. This work was supported by: UC Berkeley/Aduro Immunotherapeutics and Vaccine Research Initiative (IVRI) award and Pew Scholar Award to K.S.; American Diabetes Association Postdoctoral Fellowship #1–19-PDF-058 to G.A.T.; 1F32CA236156–01A1 (NIH F32 Postdoctoral Award), 5T32CA108462–15 (NIH T32), and Sandler Program for Breakthrough Biomedical Research (postdoctoral independence award) to K.M.T. This work used: the Vincent J. Coates Genomics Sequencing Laboratory at UC Berkeley, supported by NIH S10 OD018174 Instrumentation Grant; the QB3/Chemistry Mass Spectrometry Facility, supported by support by NIH 1S10OD020062–01; the UCLA Metabolomics Center, supported by NIH Instrumentation Grant S10 OD016387.
Footnotes
Competing Interests Statement
G.A.T. and K.S. are co-inventors on provisional patent application no. 63/091,217 filed by UC Berkeley describing methods of use of hydroxyestrogen for treatment of inflammatory and metabolic disease. G.A.T. is co-founder of a startup focused on therapeutic applications of hydroxyestrogen derivatives. D.K.N. is a share-holder and adviser for Frontier Medicines. The other authors declare no competing interests.
References
- 1.Medzhitov R Origin and physiological roles of inflammation. Nature 454, 428–435 (2008). [DOI] [PubMed] [Google Scholar]
- 2.Netea MG et al. Trained immunity: A program of innate immune memory in health and disease. Science 352, aaf1098 (2016). [DOI] [PMC free article] [PubMed] [Google Scholar]
- 3.Hotchkiss RS, Monneret G & Payen D Sepsis-induced immunosuppression: from cellular dysfunctions to immunotherapy. Nat. Rev. Immunol. 13, 862–874 (2013). [DOI] [PMC free article] [PubMed] [Google Scholar]
- 4.Sun L et al. Activating a collaborative innate-adaptive immune response to control breast and ovarian cancer metastasis. bioRxiv, 2020.07.13.200477 (2020). [Google Scholar]
- 5.Baik SH et al. A Breakdown in Metabolic Reprogramming Causes Microglia Dysfunction in Alzheimer’s Disease. Cell. Metab. 30, 493–507.e6 (2019). [DOI] [PubMed] [Google Scholar]
- 6.West AP et al. TLR signalling augments macrophage bactericidal activity through mitochondrial ROS. Nature 472, 476–480 (2011). [DOI] [PMC free article] [PubMed] [Google Scholar]
- 7.Lampropoulou V et al. Itaconate Links Inhibition of Succinate Dehydrogenase with Macrophage Metabolic Remodeling and Regulation of Inflammation. Cell. Metab. 24, 158–166 (2016). [DOI] [PMC free article] [PubMed] [Google Scholar]
- 8.Cameron AM et al. Inflammatory macrophage dependence on NAD(+) salvage is a consequence of reactive oxygen species-mediated DNA damage. Nat. Immunol. 20, 420–432 (2019). [DOI] [PubMed] [Google Scholar]
- 9.Yu W et al. One-Carbon Metabolism Supports S-Adenosylmethionine and Histone Methylation to Drive Inflammatory Macrophages. Mol. Cell 75, 1147–1160.e5 (2019). [DOI] [PubMed] [Google Scholar]
- 10.Regdon Z et al. LPS protects macrophages from AIF-independent parthanatos by downregulation of PARP1 expression, induction of SOD2 expression, and a metabolic shift to aerobic glycolysis. Free Radic. Biol. Med. 131, 184–196 (2019). [DOI] [PubMed] [Google Scholar]
- 11.Shadel GS & Horvath TL Mitochondrial ROS signaling in organismal homeostasis. Cell 163, 560–569 (2015). [DOI] [PMC free article] [PubMed] [Google Scholar]
- 12.Shpilka T & Haynes CM The mitochondrial UPR: mechanisms, physiological functions and implications in ageing. Nat. Rev. Mol. Cell Biol. 19, 109–120 (2018). [DOI] [PubMed] [Google Scholar]
- 13.Ristow M & Schmeisser K Mitohormesis: Promoting Health and Lifespan by Increased Levels of Reactive Oxygen Species (ROS). Dose Response 12, 288–341 (2014). [DOI] [PMC free article] [PubMed] [Google Scholar]
- 14.Calippe B et al. 17Beta-estradiol promotes TLR4-triggered proinflammatory mediator production through direct estrogen receptor alpha signaling in macrophages in vivo. J. Immunol. 185, 1169–1176 (2010). [DOI] [PubMed] [Google Scholar]
- 15.Ghisletti S, Meda C, Maggi A & Vegeto E 17beta-estradiol inhibits inflammatory gene expression by controlling NF-kappaB intracellular localization. Mol. Cell. Biol. 25, 2957–2968 (2005). [DOI] [PMC free article] [PubMed] [Google Scholar]
- 16.Torres MJ et al. 17beta-Estradiol Directly Lowers Mitochondrial Membrane Microviscosity and Improves Bioenergetic Function in Skeletal Muscle. Cell. Metab. 27, 167–179.e7 (2018). [DOI] [PMC free article] [PubMed] [Google Scholar]
- 17.Saijo K, Collier JG, Li AC, Katzenellenbogen JA & Glass CK An ADIOL-ERbeta-CtBP transrepression pathway negatively regulates microglia-mediated inflammation. Cell 145, 584–595 (2011). [DOI] [PMC free article] [PubMed] [Google Scholar]
- 18.Eliassen AH et al. Urinary estrogens and estrogen metabolites and subsequent risk of breast cancer among premenopausal women. Cancer Res. 72, 696–706 (2012). [DOI] [PMC free article] [PubMed] [Google Scholar]
- 19.Ezeriņa D, Takano Y, Hanaoka K, Urano Y & Dick TP N-Acetyl Cysteine Functions as a Fast-Acting Antioxidant by Triggering Intracellular H(2)S and Sulfane Sulfur Production. Cell. Chem. Biol. 25, 447–459.e4 (2018). [DOI] [PMC free article] [PubMed] [Google Scholar]
- 20.Holmstrom KM, Kostov RV & Dinkova-Kostova AT The multifaceted role of Nrf2 in mitochondrial function. Curr. Opin. Toxicol. 1, 80–91 (2016). [DOI] [PMC free article] [PubMed] [Google Scholar]
- 21.Mendillo ML et al. HSF1 drives a transcriptional program distinct from heat shock to support highly malignant human cancers. Cell 150, 549–562 (2012). [DOI] [PMC free article] [PubMed] [Google Scholar]
- 22.Boos F et al. Mitochondrial protein-induced stress triggers a global adaptive transcriptional programme. Nat. Cell Biol. 21, 442–451 (2019). [DOI] [PubMed] [Google Scholar]
- 23.Quiros PM et al. Multi-omics analysis identifies ATF4 as a key regulator of the mitochondrial stress response in mammals. J. Cell Biol. 216, 2027–2045 (2017). [DOI] [PMC free article] [PubMed] [Google Scholar]
- 24.Nargund AM, Fiorese CJ, Pellegrino MW, Deng P & Haynes CM Mitochondrial and nuclear accumulation of the transcription factor ATFS-1 promotes OXPHOS recovery during the UPR(mt). Mol. Cell 58, 123–133 (2015). [DOI] [PMC free article] [PubMed] [Google Scholar]
- 25.Jazwinski SM & Kriete A The yeast retrograde response as a model of intracellular signaling of mitochondrial dysfunction. Front. Physiol. 3, 139 (2012). [DOI] [PMC free article] [PubMed] [Google Scholar]
- 26.Lauterbach MA et al. Toll-like Receptor Signaling Rewires Macrophage Metabolism and Promotes Histone Acetylation via ATP-Citrate Lyase. Immunity 51, 997–1011.e7 (2019). [DOI] [PubMed] [Google Scholar]
- 27.Langston PK et al. Glycerol phosphate shuttle enzyme GPD2 regulates macrophage inflammatory responses. Nat. Immunol. 20, 1186–1195 (2019). [DOI] [PMC free article] [PubMed] [Google Scholar]
- 28.Tannahill GM et al. Succinate is an inflammatory signal that induces IL-1beta through HIF-1alpha. Nature 496, 238–242 (2013). [DOI] [PMC free article] [PubMed] [Google Scholar]
- 29.Chen WW, Freinkman E, Wang T, Birsoy K & Sabatini DM Absolute Quantification of Matrix Metabolites Reveals the Dynamics of Mitochondrial Metabolism. Cell 166, 1324–1337.e11 (2016). [DOI] [PMC free article] [PubMed] [Google Scholar]
- 30.Divakaruni AS et al. Etomoxir Inhibits Macrophage Polarization by Disrupting CoA Homeostasis. Cell. Metab. 28, 490–503.e7 (2018). [DOI] [PMC free article] [PubMed] [Google Scholar]
- 31.Srinivasan B et al. Extracellular 4’-phosphopantetheine is a source for intracellular coenzyme A synthesis. Nat. Chem. Biol. 11, 784–792 (2015). [DOI] [PubMed] [Google Scholar]
- 32.Jung HW, Chung YS, Kim YS & Park YK Celastrol inhibits production of nitric oxide and proinflammatory cytokines through MAPK signal transduction and NF-kappaB in LPS-stimulated BV-2 microglial cells. Exp. Mol. Med. 39, 715–721 (2007). [DOI] [PubMed] [Google Scholar]
- 33.Kobayashi EH et al. Nrf2 suppresses macrophage inflammatory response by blocking proinflammatory cytokine transcription. Nat. Commun. 7, 11624 (2016). [DOI] [PMC free article] [PubMed] [Google Scholar]
- 34.Mills EL et al. Succinate Dehydrogenase Supports Metabolic Repurposing of Mitochondria to Drive Inflammatory Macrophages. Cell 167, 457–470.e13 (2016). [DOI] [PMC free article] [PubMed] [Google Scholar]
- 35.Drobnica L & Sturdik E The reaction of carbonyl cyanide phenylhydrazones with thiols. Biochim. Biophys. Acta 585, 462–476 (1979). [DOI] [PubMed] [Google Scholar]
- 36.Bie AS et al. A cell model to study different degrees of Hsp60 deficiency in HEK293 cells. Cell Stress Chaperones 16, 633–640 (2011). [DOI] [PMC free article] [PubMed] [Google Scholar]
- 37.Katiyar A et al. HSF1 is required for induction of mitochondrial chaperones during the mitochondrial unfolded protein response. FEBS Open Bio (2020). [DOI] [PMC free article] [PubMed] [Google Scholar]
- 38.Cox CS et al. Mitohormesis in Mice via Sustained Basal Activation of Mitochondrial and Antioxidant Signaling. Cell. Metab. 28, 776–786.e5 (2018). [DOI] [PMC free article] [PubMed] [Google Scholar]
- 39.Herb M et al. Mitochondrial reactive oxygen species enable proinflammatory signaling through disulfide linkage of NEMO. Sci. Signal. 12, 10.1126/scisignal.aar5926 (2019). [DOI] [PubMed] [Google Scholar]
- 40.Ahmed D et al. Differential remodeling of the electron transport chain is required to support TLR3 and TLR4 signaling and cytokine production in macrophages. Sci. Rep. 9, 18801–4 (2019). [DOI] [PMC free article] [PubMed] [Google Scholar]
- 41.Seeley JJ & Ghosh S Molecular mechanisms of innate memory and tolerance to LPS. J. Leukoc. Biol. 101, 107–119 (2017). [DOI] [PubMed] [Google Scholar]
- 42.Bailey JD et al. Nitric Oxide Modulates Metabolic Remodeling in Inflammatory Macrophages through TCA Cycle Regulation and Itaconate Accumulation. Cell. Rep. 28, 218–230.e7 (2019). [DOI] [PMC free article] [PubMed] [Google Scholar]
- 43.Li Y et al. Immune responsive gene 1 (IRG1) promotes endotoxin tolerance by increasing A20 expression in macrophages through reactive oxygen species. J. Biol. Chem. 288, 16225–16234 (2013). [DOI] [PMC free article] [PubMed] [Google Scholar]
- 44.Lavie J et al. Ubiquitin-Dependent Degradation of Mitochondrial Proteins Regulates Energy Metabolism. Cell. Rep. 23, 2852–2863 (2018). [DOI] [PubMed] [Google Scholar]
- 45.Bergenfelz C et al. Systemic Monocytic-MDSCs Are Generated from Monocytes and Correlate with Disease Progression in Breast Cancer Patients. PLoS One 10, e0127028 (2015). [DOI] [PMC free article] [PubMed] [Google Scholar]
- 46.Washburn ML et al. T Cell- and Monocyte-Specific RNA-Sequencing Analysis in Septic and Nonseptic Critically Ill Patients and in Patients with Cancer. J. Immunol. 203, 1897–1908 (2019). [DOI] [PMC free article] [PubMed] [Google Scholar]
- 47.Baumann T et al. Regulatory myeloid cells paralyze T cells through cell-cell transfer of the metabolite methylglyoxal. Nat. Immunol. 21, 555–566 (2020). [DOI] [PubMed] [Google Scholar]
- 48.Yang W et al. Neutrophils promote the development of reparative macrophages mediated by ROS to orchestrate liver repair. Nat. Commun. 10, 1076–8 (2019). [DOI] [PMC free article] [PubMed] [Google Scholar]
- 49.Sies H & Jones DP Reactive oxygen species (ROS) as pleiotropic physiological signalling agents. Nat. Rev. Mol. Cell Biol. (2020). [DOI] [PubMed] [Google Scholar]
- 50.Gottwald EM et al. The targeted anti-oxidant MitoQ causes mitochondrial swelling and depolarization in kidney tissue. Physiol. Rep. 6, e13667 (2018). [DOI] [PMC free article] [PubMed] [Google Scholar]
Methods References
- 51.Frezza C, Cipolat S & Scorrano L Organelle isolation: functional mitochondria from mouse liver, muscle and cultured fibroblasts. Nat. Protoc. 2, 287–295 (2007). [DOI] [PubMed] [Google Scholar]
- 52.Yoo HS & Napoli JL Quantification of Dehydroepiandrosterone, 17beta-Estradiol, Testosterone, and Their Sulfates in Mouse Tissues by LC-MS/MS. Anal. Chem. 91, 14624–14630 (2019). [DOI] [PMC free article] [PubMed] [Google Scholar]
- 53.Roberts AM et al. Chemoproteomic Screening of Covalent Ligands Reveals UBA5 As a Novel Pancreatic Cancer Target. ACS Chem. Biol. (2017). [DOI] [PubMed] [Google Scholar]
- 54.Calvo SE, Clauser KR & Mootha VK MitoCarta2.0: an updated inventory of mammalian mitochondrial proteins. Nucleic Acids Res. 44, 1251 (2016). [DOI] [PMC free article] [PubMed] [Google Scholar]
- 55.Buescher JM et al. A roadmap for interpreting (13)C metabolite labeling patterns from cells. Curr. Opin. Biotechnol. 34, 189–201 (2015). [DOI] [PMC free article] [PubMed] [Google Scholar]
- 56.Costantini LM et al. A palette of fluorescent proteins optimized for diverse cellular environments. Nat. Commun. 6, 7670 (2015). [DOI] [PMC free article] [PubMed] [Google Scholar]
Associated Data
This section collects any data citations, data availability statements, or supplementary materials included in this article.
Supplementary Materials
Data Availability Statement
All data sets generated and analyzed in this study are available from G.A.T. upon reasonable request. Raw mass spectrometry data are provided in Supplementary Tables 4–6. Processed isoTOP-ABPP and metabolomics data are provided as source data. RNA-seq and ChIP-seq data is available at the Gene Expression Omnibus (GSE169731).