Abstract
Lanthipeptides are characterized by thioether crosslinks formed by post-translational modifications. The cyclization process that favors a single ring pattern over many other possible ring patterns has been the topic of much speculation. Recent studies suggest that for some systems the cyclization pattern and stereochemistry is determined not by the enzyme, but by the sequence of the precursor peptide. However, the factors that govern the outcome of the cyclization process are not understood. This study presents the three-dimensional structures of seven lanthipeptides determined by nuclear magnetic resonance spectroscopy, including five prochlorosins and the two peptides that make up cytolysin, a virulence factor produced by Enterococcus faecalis that is directly linked to human disease. These peptides were chosen because their substrate sequence determines either the ring pattern (prochlorosins) or the stereochemistry of cyclization (cytolysins). We present the structures of prochlorosins 1.1, 2.1, 2.8, 2.10 and 2.11, the first three-dimensional structures of prochlorosins. Our findings provide insights into the molecular determinants of cyclization as well as why some prochlorosins may be better starting points for library generation than others. The structures of the large and small subunits of the enterococcal cytolysin show that these peptides have long helical stretches, a rare observation for lanthipeptides characterized to date. These helices may explain their pore forming activity and suggest that the small subunit may recognize a molecular target followed by recruitment of the large subunit to span the membrane.
To understand factors that determine ring pattern and stereochemistry of thioether cyclization of lanthipeptide natural products, the structures of five prochlorosins (blue) and two enterococcal cytolysins (red) were determined by NMR spectroscopy.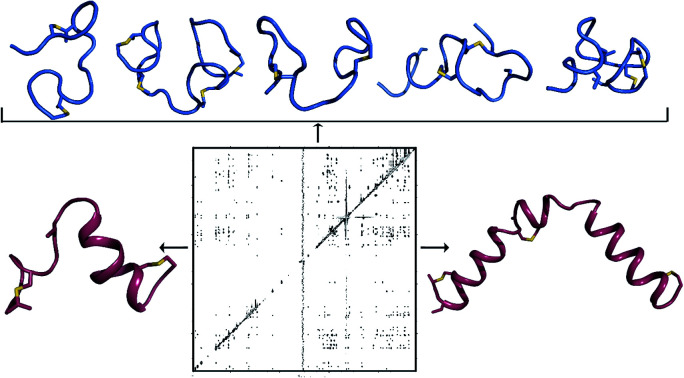
Introduction
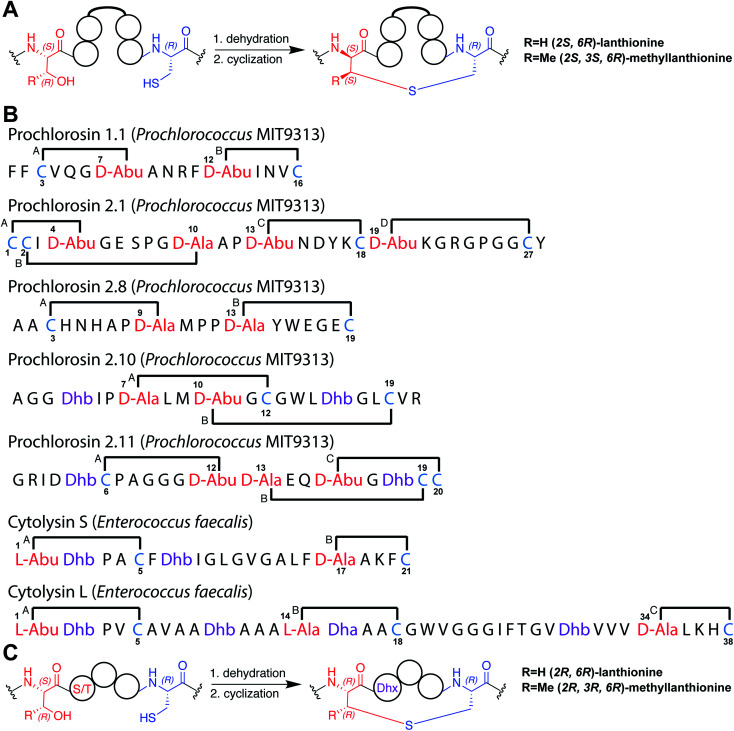
Lanthipeptides are ribosomally synthesized and post-translationally modified peptides (RiPPs) that are generated from a precursor peptide containing an N-terminal leader peptide and a C-terminal core peptide.1,2 Lanthipeptide synthetases dehydrate serine or threonine residues in the core peptide to form dehydroalanine (Dha) or dehydrobutyrine (Dhb), respectively, and then catalyze the intramolecular Michael-type addition of a cysteine thiol to the β-carbon of the dehydrated amino acid (Fig. 1A).3 The product of this process is typically a polycyclic peptide with a well-defined ring pattern formed by the (methyl)lanthionine [(Me)Lan] thioether crosslinks (e.g.Fig. 1B). The cyclization process has been enigmatic because a single enzyme with one cyclization active site catalyzes the formation of a single product with one specific ring pattern, when many other ring patterns are possible and with each successive cyclization step greatly changing the conformation of the peptide for the subsequent cyclization step.2 The factors that determine the ring pattern of the product and the means used by the enzyme to arrive at this final ring pattern are not known. This question is not only relevant for lanthipeptide cyclization processes but for many RiPP classes where multiple macrocycles are introduced by a single enzyme. At present the three-dimensional structures of only a relatively small number of lanthipeptides are known.4–16 We report here the three-dimensional structures of seven lanthipeptides determined by nuclear magnetic resonance (NMR) spectroscopy as part of a multipronged approach to better understand the factors that might govern the cyclization process. Such insights would not only provide mechanistic information but potentially also aid in the engineering of lanthipeptides, most of whom have potent and diverse bioactivities that include antimicrobial,17 antinociceptive,10 and antiviral activities.18 Furthermore, such insights could facilitate efforts in which the lanthipeptide biosynthetic machinery is used to make libraries of polycyclic peptides to select for diverse new functions.19–22
Fig. 1. (A) General pathway to (methyl)lanthionine formation in lanthipeptides. (B) Ring patterns of the seven peptides examined in this work. Cys residues are colored in blue, former Ser/Thr residues are colored in red, dehydroamino acids are colored in purple. Each thioether ring is marked with a letter A–D. The stereochemistry of the (Me)Lan structures of Pcn 1.1, Pcn 2.8, Pcn 2.11, and the cytolysins S and L has been experimentally determined.32,34 The stereochemistry for Pcn 2.1 and Pcn 2.10 is inferred based on the stereochemistry determined for seven other prochlorosins.34 Abu, 2-aminobutyric acid. (C) Formation of (methyl)lanthionine with different stereochemistry from precursors with a S/T-S/T-X-X-C motif.
At least five different pathways to lanthipeptides have evolved.3,23 Class II lanthipeptides are formed by bifunctional LanM synthetases with an N-terminal dehydratase domain and a C-terminal cyclase domain. The N-terminal domain dehydrates Ser and Thr residues via a phosphorylated intermediate generated from ATP, while the C-terminal domain subsequently catalyzes the Michael-type addition of the Cys thiol to the dehydrated intermediate.24–26 ProcM is an unusual class II lanthipeptide synthetase in that it acts on 30 different ProcA substrate peptides in its natural host Prochlorococcus MIT9313.27 Because the prochlorosin (Pcn) products have very diverse ring patterns (e.g.Fig. 1B) and because non-enzymatic cyclization has been excluded for all ProcA peptides studied to date,28,29 it has been suggested that the substrate sequence rather than the enzyme may determine the final outcome of catalysis.30 As such, knowing the three-dimensional structures of prochlorosins would be an important starting point to understand the cyclization process.
Another example where the outcome of lanthipeptide biosynthesis is determined by the substrate sequence and not the enzyme was found in cytolysin biosynthesis in Enterococcus faecalis (Fig. 1B and C). Cytolysin is composed of two peptides,  and
and 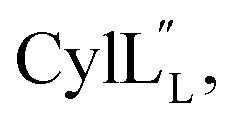 which act synergistically as a virulence factor during human infection.31 A Dhx–Dhx–Xxx–Xxx–Cys (where Dhx is a Dha or Dhb) sequence in the peptides leads to the formation of thioether rings by the cytolysin synthetase CylM with stereochemistry that is different from the stereochemistry of all previously reported lanthipeptides (Fig. 1Avs.Fig. 1C).32 Detailed mechanistic studies have demonstrated that the substrate sequence determines the stereochemistry of cyclization for these peptides.33
At present, the three-dimensional structures in solution are not known for the two cytolysin peptides or any of the prochlorosin peptides. Because their structures might provide insights into the factors that lead to substrate control over ring pattern or stereochemistry, in this study we determined the three-dimensional structures of the two cytolysin peptides and five prochlorosin peptides using NMR spectroscopy (Fig. 1B). The cytolysins are the first reported structures of lanthipeptides with ll stereochemistry.32
Results and discussion
Selection of prochlorosins for structure determination
The prochlorosin peptides investigated in this study (Fig. 1B) are part of a collection of 30 peptides that are all modified by one lanthionine synthetase ProcM producing unique ring patterns.27 For all seven prochlorosin products for which the stereochemistry has been determined, ProcM installed dl-(Me)Lan (d stereochemistry at the former Ser/Thr residue, l stereochemistry at the former Cys residue; Fig. 1A),34 and at present no evidence exists that the enzyme makes ll-(Me)Lan linkages. A subset of these 30 procA genes (procA1.1-1.7) is encoded near the lanthionine synthetase gene, whereas more than 20 are clustered in different parts of the genome (procA2.1-2.11, procA3.1-3.5 and procA4.1-4.3). A recent large-scale genome and metagenome mining effort identified 1.6 million procA-like open reading frames. Remarkably, whereas the leader peptide sequences displayed high sequence identity, almost all core peptide sequences in this set are unique, drawing attention to the highly diverse collection of precursor peptides co-occurring with a ProcM-type enzyme.35 The low conservation in the core peptide region means that these clusters are likely producing large numbers of cyclic peptides with diverse ring patterns and with a biological or environmental function yet to be identified.35 The high diversity of the core peptides, combined with the very high sequence conservation of their cognate ProcM-like enzymes,35 again suggests that the core peptides may contain the information that determines the ring patterns.
To provide the first information on the three-dimensional structures of prochlorosins, which may hold clues regarding the factors that determine their ring patterns, in this study we chose to investigate five Pcns. We chose Pcn 2.10 and Pcn 2.1 because their structures had not been determined previously. Pcn 2.1 contains four Cys residues, the highest number of Cys residues in a Pcn from Prochlorococcus MIT9313 (along with Pcn 1.3 and 1.6 that also have four Cys residues). We chose Pcn 2.11 because its ring pattern had only been deduced from tandem mass spectrometry (MS) analysis of a series of Cys-to-Ala mutations in the core peptide.27 Determining ring patterns of lanthipeptides using mutants has proven treacherous in previous studies as sometimes the cyclization outcome for such variants is altered compared to that of the wild-type core peptide sequence.27 Therefore, we decided to check assignments previously determined using tandem MS by using NMR spectroscopy in this work. Finally, both Pcn 1.1 and 2.8 contain two non-overlapping rings (Fig. 1B) and were chosen as they have been used for polycyclic peptide library generation. Whereas ProcM was able to convert millions of ProcA2.8 variants to the corresponding bicyclic products,22 for reasons that are currently not understood, ProcM proved a poor catalyst for converting ProcA1.1 variants.36 Whereas the enzyme was able to dehydrate ProcA1.1-derived library members, the cyclization reactions were incomplete.
Structure of prochlorosin 2.10
The ProcA2.10 core peptide contains three Thr and one Ser as well as two Cys residues. Co-expression of His6-ProcA 2.10 with ProcM in E. coli in rich media (TB) resulted in four-fold dehydrated peptide (Fig. S1†), which was purified by immobilized metal affinity chromatography (IMAC). Assays with the Cys selective alkylating agent N-ethylmaleimide (NEM) demonstrated that neither Cys residue contained a free thiol, suggesting that they were engaged in thioether rings in the ProcM product. The leader peptide of the modified ProcA2.10 was successfully removed with the substrate tolerant protease domain from the LahT protease-transporter,37 and Pcn 2.10 was purified by reversed phase high performance liquid chromatography (RP-HPLC). Production of lanthipeptides in minimal media in E. coli results in poor yields and often incomplete post-translational modification. Therefore, unless specified otherwise, we were not able to obtain isotopically labeled peptides and all spectroscopic data presented herein was obtained on peptides with natural abundance isotopic distributions.
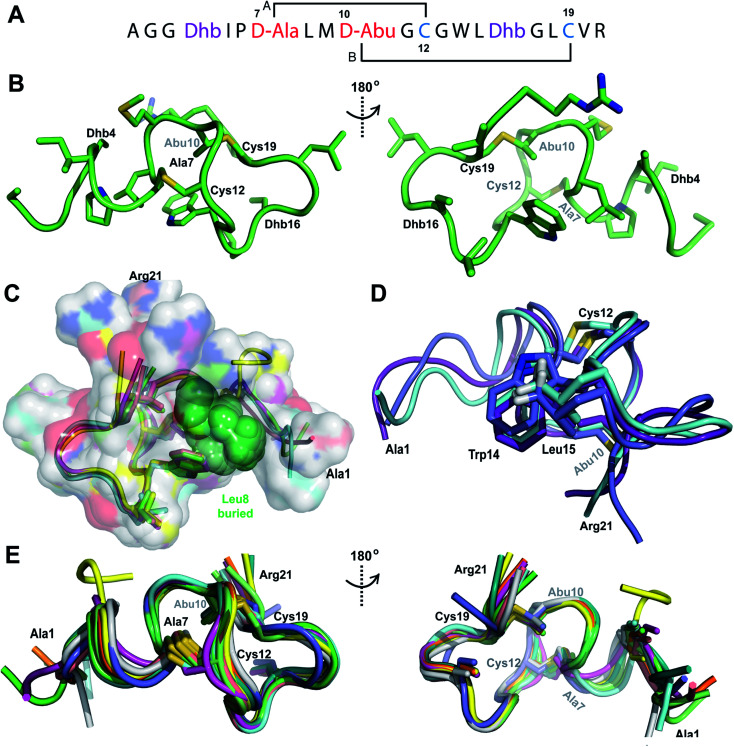
A 1H TOCSY spectrum of Pcn 2.10 showed that the amide protons were well-dispersed (Fig. S2†) suggesting the peptide is well-structured under the acquisition conditions. The TOCSY spectrum was used to assign all spin systems (Table S1†). Two dehydrobutyrine residues were detected and their positions were established from a NOESY spectrum using sequential amide proton assignment (Fig. S3†). The NOESY data was also used to assign the ring pattern in Pcn 2.10, revealing crosslinks between former Ser7 and Cys12 and former Thr10 and Cys19 (Fig. 2A) by medium NOE peaks between the α and β protons of the former Cys residue and the α, β and γ (in the case of cyclized aminobutyrine (Abu)) protons of the former Ser/Thr residues (Fig. S4†). Hydrogen–deuterium exchange experiments for Pcn 2.10 resulted in full amide proton exchange in the time required to place the sample into the spectrometer. Hence, no well-defined hydrogen bonds are present in the structure.
Fig. 2. (A) Pcn 2.10 ring pattern determined in this work. (B) Representation of the minimum energy structure of the Pcn 2.10 ensemble. Former Cys and Ser/Thr amino acids making up the (Me)Lan rings and dehydroamino acids are highlighted. (C) Superimposition of a five-structure ensemble showing the molecular surface and burial of the hydrophobic side chain of Leu8, colored in green. The N- and C- terminal residues are marked. (D) Superimposition of a three-structure ensemble showing the alignment of the upfield shifted δ protons of Leu15 over the aromatic side chain of Trp14. Trp14 is almost fully solvent inaccessible. (E) Superimposition of the ensemble of the 10 minimum energy structures of prochlorosin 2.10 with the residues involved in thioethers annotated. For a superimposition of the ensemble of the 20 minimum energy structures of Pcn 2.10, see Fig. S6.†.
A total of 49 sequential, and 61 medium- and 50 long-range distance restraints derived from nuclear Overhauser effect (NOE) interactions were used in the structure calculation. The minimum energy structure is shown in Fig. 2B. The peptide is well-structured in the region spanning the two intertwined thioether rings with the ensemble of 20 minimum energy structures having an RMSD of 0.61 Å for ring A and 0.83 Å for ring B. The N-terminal six amino acids are less constrained with a backbone RMSD of 1.95 Å (Fig. 2E, S6 and Table S2†). One potential means for substrate control is preorganization of the peptide through burial of hydrophobic residues, which has not only been reported in globular protein folding,38 but also in small peptides such as lacticin Q, aureocin A53, and sublancin.39,40 Evidence of such a model is seen in the structure of Pcn 2.10 as illustrated in Fig. 2C for five members of the ensemble of 20 minimum energy structures and in Fig. S6† for the entire ensemble. Trp14 and the peptide backbone flank the side chain of Leu8 that is tucked inside the fold (Fig. 2D). The γ and δ protons of Leu15 are shifted 0.1–0.4 ppm upfield compared to the other Leu δ protons in the peptide, likely due to the observed alignment of the Leu15 side chain over the π system of Trp14 (Fig. 2D).
Structure of prochlorosin 2.1
Pcn 2.1 is another prochlorosin for which the ring pattern was not known prior to this study. His6-ProcA 2.1 was co-expressed with ProcM in E. coli and purified by IMAC, resulting in a four-fold dehydrated peptide (Fig. S1†), consistent with previous in vitro data.27 The precursor peptide contains five Ser/Thr residues (Fig. 1B) indicating that one of these residues escapes dehydration. Treatment of the ProcM-modified ProcA2.1 peptide with NEM demonstrated that all four Cys residues were involved in thioether rings. After removal of the leader peptide with the LahT peptidase domain, Pcn 2.1 was purified by RP-HPLC.
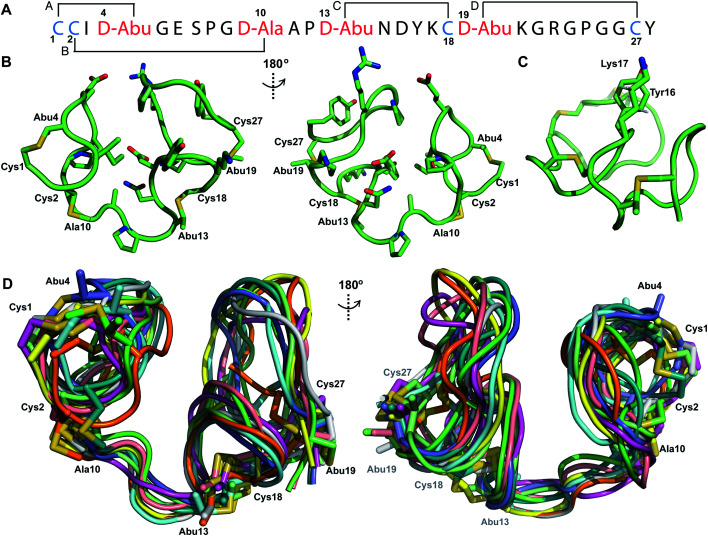
TOCSY data (Fig. S7†) were used to identify the spin systems of Pcn 2.1 and sequential assignments were made using a NOESY spectrum (Fig. S8 and S9†). A total of 118 sequential, and 41 medium- and 48 long-range distance restraints derived from NOEs were used in the structure calculation. The NOESY data also established the connectivity of the (methyl)lanthionine linkages between residues 1–4, 2–10, 13–18 and 19–27 (Fig. 3A), as illustrated by medium NOE interactions between the α and β protons of the former Cys and the α, β and γ (in the case of Abu) protons of the former Ser/Thr residues (Fig. S10 and S11†). Consistent with previous in vitro experiments with ProcM and a ProcA 2.1-S7A mutant,27 the NMR data clearly shows that Ser7 escapes dehydration. The amide protons in Pcn 2.1 are in rapid exchange with solvent based on hydrogen–deuterium exchange experiments that showed that all amide protons exchanged within the time required to introduce the sample into the spectrometer, indicating the structure does not contain well-defined hydrogen bonds.
Fig. 3. (A) Ring pattern of Pcn 2.1. (B) Representation of the minimum energy structure of the Pcn 2.1 ensemble. (C) Representation of the stacking of the Lys17 γ and δ protons onto the aromatic side chain of Tyr16, which results in an upfield shift of the lysine side chain protons. (D) Superimposition of the ensemble of the 10 minimum energy structures for Pcn 2.1. Residues involved in thioether linkages are marked in panels B and D. For a superimposition of the minimum energy 20-structure ensemble, see Fig. S13.†.
The region of the peptide spanning rings A, B and C is more ordered with an RMSD of 1.23 to 1.38 Å, while more flexibility is observed in the Gly rich region of ring D between positions 19 and 28 with an RMSD of 2.74 Å (Fig. 3D, Table S4†). The minimum energy structure is shown in Fig. 3B. Notably, the γ and δ protons of Lys17 are shifted approximately 0.3 ppm upfield consistent with a cation–π interaction with the side chain of Tyr16 (Fig. 3C).41–43
Structure of prochlorosin 2.11
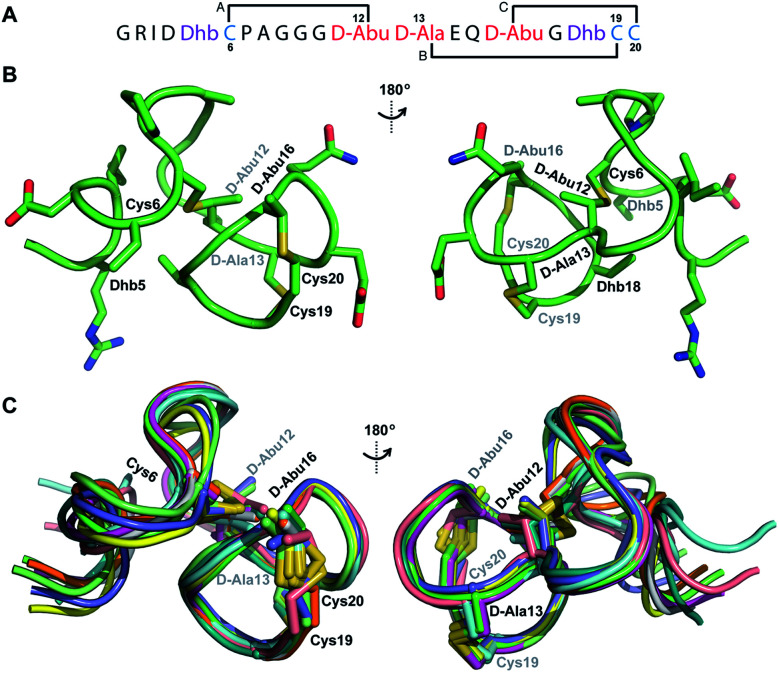
His6-ProcA 2.11-G−1K was co-expressed with ProcM, resulting in dehydration of all five Ser/Thr residues in its core peptide (Fig. 1B and S1†). The peptide was purified by IMAC, the e LysC,44 and the resulting Pcn 2.11 was purified by HPLC. Similar to the previous examples, sequential NOE signals (Fig. S15†) and TOCSY (Fig. S14†) data were used for spin system assignment. A strong NOE between an amide proton at 9.76 ppm (Table S5, Fig. S15†), a chemical shift typical of dehydroamino acids, and the Cys19 amide proton indicated that position 18 is a Dhb residue. This conclusion is corroborated by the thioether connectivity assignment. The β and γ protons of the former Thr at position 16 displayed medium NOEs with the α and β protons of Cys20 indicating this residue is involved in a MeLan (Fig. 4A, S16B and C†). This assignment for the C-terminal ring is in contrast to a previous report where tandem MS analysis of a series of Cys-to-Ala variants was used to determine the ring pattern of the overlapping ring system.27 In that study, the Dhb was tentatively assigned to position 16 with a thioether crosslink between Cys20 and the former Thr18. This case, in which mutations led to different ring patterns, illustrates that small changes in the peptide substrate, and presumably its evolving secondary structure during modification, can have important effects on the outcome of the maturation process.
Fig. 4. (A) Ring pattern of Pcn 2.11. (B) Representation of the minimum energy structure of Pcn 2.11. (C) Superimposition of the ensemble of the 10 minimum energy structures for Pcn 2.11. Residues involved in thioether linkages are indicated in both panels. For a superimposition of the minimum energy 20-structure ensemble, see Fig. S18.†.
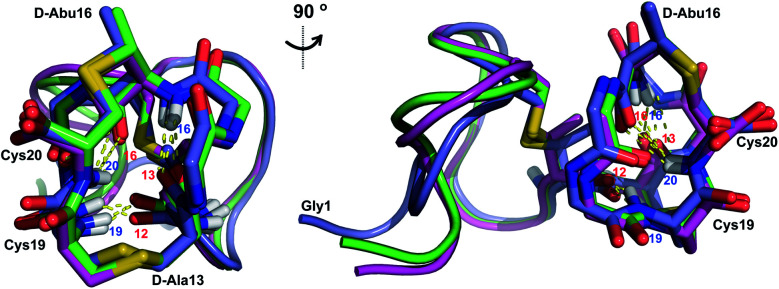
Similar to Pcn 2.10, Pcn 2.11 has a well-defined structure for part of the peptide. The structure ensemble displays a backbone RMSD of 0.85 Å for ring A, and RMSDs of 0.72 and 0.83 Å for the two interlocking thioether rings B and C (Fig. 4A and B), respectively, with a more flexible N-terminus (residues 1–5 displayed an RMSD of 2.20 Å; Fig. 4C, Table S6†). Three hydrogen bonding interactions were observed in hydrogen–deuterium exchange experiments. The amide protons of Ala20 (formerly Cys20), Ala19 (formerly Cys19), and d-Abu16 (formerly Thr16) form hydrogen bonds with the oxygen atoms of d-Abu16 (formerly Thr16), d-Abu12 (formerly Thr12), and d-Ala13 (formerly Ser13), respectively (Fig. 5). These hydrogen bonds in the final structure may have stabilized the transition states leading to the formation of each ring, as the carbonyl groups of d-Abu16, d-Abu12, and d-Ala13 would have born negative charges in the enolate intermediates during the Michael-type addition reactions. Thus, these hydrogen bonds are likely at least in part responsible for the cyclization pattern (the cyclization process catalyzed by ProcM has been previously shown to use kinetic and not thermodynamic control28,29).
Fig. 5. Two views of the hydrogen bonding interactions in Pcn 2.11. The NH donor residue numbers are marked in blue and the oxygen acceptor residue numbers are marked in red. Three structures are shown.
Structure of prochlorosin 1.1
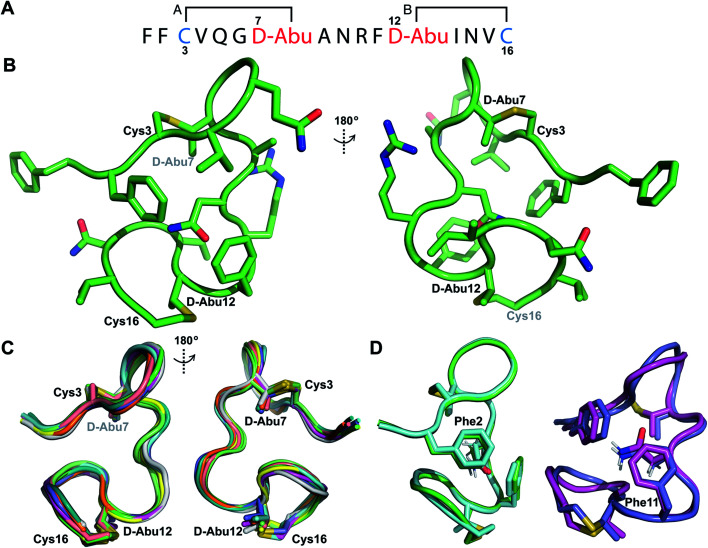
His6-ProcA 1.1-G−1E was co-expressed in E. coli with ProcM and the fully modified peptide with two dehydrations was purified by IMAC. The leader peptide was removed with endoproteinase GluC as described previously.34 TOCSY data (Fig. S19†) and sequential NOE signals (Fig. S20†) were used to assign the spin systems of Pcn 1.1, which confirmed the non-overlapping ring pattern previously assigned by tandem MS involving thioether crosslinks between residues 3 and 7 and between residues 12 and 16 (Fig. 6A and S21†). Hydrogen–deuterium exchange experiments for Pcn 1.1 resulted in full amide proton exchange in the time required to place the sample into the spectrometer. Thus, no well-defined hydrogen bonds are present in the structure.
Fig. 6. (A) Ring pattern of Pcn 1.1. (B) Representation of the minimum energy structure of Pcn 1.1. (C) Superimposition of the ensemble of the 10 minimum energy structures of Pcn 1.1. For the ensemble of the 20 minimum energy structures, see Fig. S23A.† (D) Two views showing the interactions of the β-protons of Asn9 and the aromatic rings of Phe2 and Phe11 illustrated for two structures. For the same panels with the ensemble of the 20 minimum energy structures, see Fig. S23B.†.
The ensemble of the 20 minimum energy structures was obtained using 72 sequential, and 65 medium- and 42 long-range distance restraints derived from NOE data. Two views of the minimum energy structure (Fig. 6B) and the minimum energy structure ensemble (Fig. 6C for 10 structures) reveal an overall RMSD of 0.94 Å (Table S8†) with slightly more rigidity in ring A and the region between the thioether rings (RMSD 0.78–0.85 Å, Table S8†), than in the C-terminal methyllanthionine ring (RMSD 1.22 Å, Table S8†). Several NOEs between the β protons of Asn9 and δ/ε protons of Phe2 and Phe11 corroborate the positioning of Asn9 flanked by the aromatic side chains of Phe2 and Phe11, where the two phenylalanine residues may act as weak hydrogen bond acceptors (Fig. 6D)45–47 that are not detectable in hydrogen-deuterium exchange experiments. A view of this interaction in the ensemble of the 20 minimum energy structures is provided in Fig. S23B.†
Structure of prochlorosin 2.8
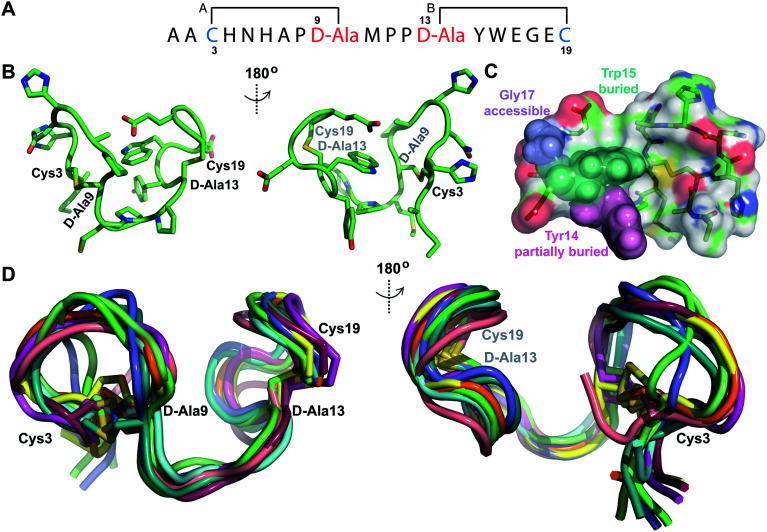
The second example of a prochlorosin with two non-overlapping rings studied in this work is Pcn 2.8. His6-Proc A2.8 was co-expressed with ProcM resulting in two dehydrations. The peptide was purified by IMAC and treated with the protease LahT150 to remove its leader peptide. Sequential NOEs (Fig. S25A–E†) and TOCSY data (Fig. S24†) were used to assign the spin systems of the resulting Pcn2.8. Lanthionine assignments (Fig. 7A and S25F†) were in agreement with previous tandem MS characterization of this peptide, with medium NOE peaks observed between the α protons of the former Ser3 and Ser13 and the β protons of the former Cys9 and Cys19, respectively (Fig. S25F†). Prochlorosin 2.8 was obtained in much better yield than the other peptides and is quite soluble allowing collection of the natural abundance 1H-15N HMQC and 1H-13C-HSQC spectra (Fig. S26†). 15N HMQC and 13C HSQC assignments were used to generate TALOS+ restraints48 based on amide HN, Cα and Hα chemical shifts for residues Ala2, Cys9, Pro11, Tyr14 and Trp15. Hydrogen bonding restraints were determined from hydrogen deuterium exchange experiments and amide protons that persisted for approximately 3 hours were included in the refinement stages of the structure calculation. Hydrogen bonding restraints were placed between the amide protons of d-Ala13 and Tyr14 and the carbonyl oxygen of Pro11 and the amide proton of Glu16 and the carbonyl oxygen of d-Ala13. Natural abundance 15N HMQC revealed that the sample attained predominantly one conformation (Fig. S26A†). However, analysis of the 13C HSQC data revealed that Pro8 displays two sets of peaks. The major set of peaks was assigned to the cis conformation based on the NOESY spectrum recorded at 25 °C, which showed a cross peak between the α proton of Ala7 and the α proton of Pro8. To better isolate this NOE, TOCSY and NOESY data were also acquired at 37 °C, resulting in improved resolution of this peak from the nearby Trp15 α proton (Fig. S26D†). A set of minor peaks observed for Pro8 suggests that a subpopulation of the peptide contains a trans conformation for this residue (Fig. S26B and C†). Pro11 and Pro12 only displayed NOEs characteristic of trans conformations.
Fig. 7. (A) Ring pattern of Pcn 2.8. (B) Depiction of the minimum energy structure of Pcn 2.8. Residues involved in thioether linkages are marked. (C) Surface view of the minimum energy structure of Pcn 2.8 with Tyr14 and Trp15 shown as spheres to explain the lack of proteolytic degradation by chymotrypsin in the buried inter-lanthionine ring region and the proteolytic degradation by chymotrypsin in ring B. Elastase cleaves after Gly17,49 which is indeed solvent exposed. (D) Depiction of the 10 minimum energy structures of Pcn 2.8. Residues involved in thioether linkages are marked. For the ensemble of the 20 minimum energy structures, see Fig. S28.†.
The ensemble of Pcn 2.8 structures was generated from 59 sequential, and 44 medium- and 9 long-range distance restraints derived from NOE intensities, along with the aforementioned dihedral and H-bond restraints. Two views of the minimum energy structure (Fig. 7B) show a fully buried Trp15 residue flanked by the peptide backbone and thioether linkages, as well as a partially buried Tyr14 residue. This structure, visualized as a surface rendition with the Trp highlighted in teal and the Tyr highlighted in pink (Fig. 7C and S28B†), explains the lack of proteolytic activity by chymotrypsin on fully cyclized Pcn 2.8 in previous work.49 Overall, the structure has a rigid C-terminus and inter-ring region determined by the trans, trans Met10–Pro11–Pro12 sequence with an RMSD of 0.67 Å. Ring B with an RMSD of 1.07 Å is more well-defined than ring A with an RMSD of 1.57 Å with most variation located N-terminal to Pro8 (Table S10†, Fig. 7D for the ensemble of the 10 minimum energy structures). The rigidity of the Met10–Pro11–Pro12 region also facilitates two hydrogen bonding interactions between the amide protons of d-Ala13 and Tyr14 and the amide carbonyl of Pro11. Additionally, a hydrogen bonding interaction between the amide proton of Glu16 and the oxygen atom of d-Ala13 across ring B contributes to the lower RMSD of the C-terminal lanthionine.
As noted in the introduction, the Pcn 2.8 scaffold proved amenable to the generation of >106 bicyclic peptides in which the residues within rings A and B were randomized with eight amino acids (notably not including Ser, Thr, Cys, Gly and Pro).22 This success is in contrast to the Pcn 1.1 scaffold, which displayed relative intolerance when the residues within the rings were randomized.36 This difference could possibly be a consequence of the native Met10–Pro11–Pro12 sequence in Pcn 2.8 that may facilitate the formation of the A and the B rings, through pre-organization of the linear peptide. Alternatively, it is possible that the larger rings in Pcn 2.8 (seven amino acids for both A and B rings, Fig. 7A) are more tolerant to amino acid substitution than the smaller rings in Pcn 1.1 (five amino acids for both the A and B rings. Fig. 6A). Indeed, the RMSD values observed here for the rings are larger for Pcn 2.8 than for Pcn 1.1 suggesting the latter may be more rigid, which may have disfavored analog formation.
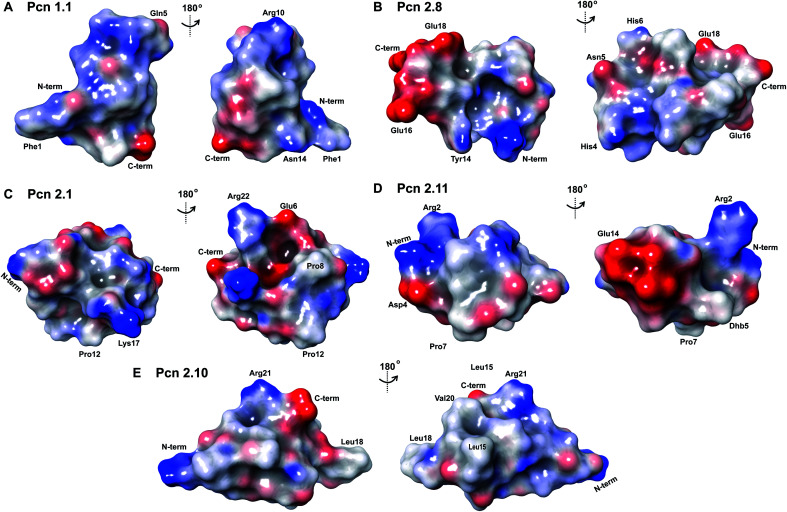
The electrostatic surface maps of the five prochlorosin peptides are shown in Fig. 8. As would be expected from the sequence diversity of these peptides, there is no preferred fold, but the presence of thioether linkages makes the cyclized sequence globular in all cases. It does not seem that there is a specific charge organization on the surface of the peptide and the proportion of hydrophobic surface that is exposed varies. A negatively charged patch formed by glutamate residues and the solvent accessible C-terminus is evident in Pcn 2.8 (Fig. 8B) and Pcn 2.11 (Fig. 8D), and a negatively charged cleft is observed in Pcn 2.1 (Fig. 8C).
Fig. 8. Electrostatic surface maps of the prochlorosin peptides. (A–E) The prochlorosin structures presented in this work adopt globular structures in the regions cyclized by thioethers, while in Pcn 2.10 and 2.11, there is a more flexible, and in some structures of the ensemble, more extended N-terminus.
Structures of the cytolysin peptides
The cytolysin peptides have been studied since the 1930s because of their importance in enhancing the virulence of enterococcal infections.50–54 The two peptides ( and
and  ) display synergistic cytolytic activity toward erythrocytes, mouse neutrophils, and macrophages, as well as antibacterial activity against many Gram-positive bacteria.55,56E. faecalis strains that produce the cytolysin peptides have been associated with deleterious patient outcomes in infections. However, their ring patterns were unknown until recently,32 their mechanism of action is unknown, and their three-dimensional structures have not been determined. In this study, both peptides were produced in E. coli as previously described.32
Structure of 
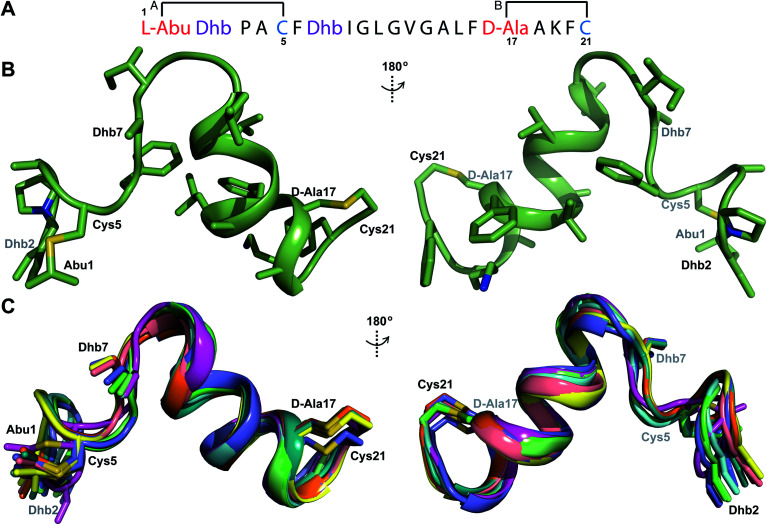
Both cytolysin peptides are poorly soluble in aqueous solution, limiting the concentrations that could be achieved for NMR study. This poor solubility is not unexpected as they target the cellular membrane.31 Therefore, their structures were determined in methanol. Furthermore, for  we needed to prepare a 13C,15N-labeled peptide to obtain well-dispersed data for assignments (see Materials and methods). TOCSY data (Fig. S29†) and sequential NOE signals (Fig. S30 and S31A and B†) were used for spin system assignment of the small subunit
  confirming the ring pattern (Fig. 9A) previously proposed based on tandem MS data.32 The A ring was assigned based on NOEs of the β and γ protons of Abu1 with the α and β protons of Cys5 (Fig. S31C†) as well as between the Cys5 amide proton and the α, β, and γ protons of Abu1 (Fig. S31D†). The B ring was assigned on the basis of NOEs between the α and β protons of Cys21 and the α proton of d-Ala17 (Fig. S31C†), and between the Cys21 amide proton and the α proton of d-Ala17 (Fig. S31E†).
Fig. 9. (A) Ring pattern of  (B) Minimum energy structure of
  Residues involved in thioether linkages and dehydroamino acids are indicated. (C) Superimposition of the 10 minimum energy structures of
  For the ensemble of the 20 minimum energy structures, see Fig. S33A.†.
The three-dimensional structure of  was determined based on 92 sequential, and 60 medium- and 8 long-range distance restraints derived from NOE data (Table S12†). Hydrogen bonding restraints were determined by hydrogen–deuterium exchange experiments using CD3OD as solvent. The amide proton signals of the following residues were still present at 48 hours: Val12, Gly13, Ala14, Leu15, Phe16, d-Ala17, Ala18, and Lys19. Amide protons of residues Ala4, Cys5, Phe6, Gly11 and Cys21 were exchanged for deuterium in 20 hours, and the amide proton of Dhb7 was exchanged for deuterium after 2 hours. 15N,13C-labeled
  was used to collect 3D HNCACB, 3D HNCA and 2D 1H-15N HSQC spectra (Table S11†). The assignments were used as TALOS+ input to generate dihedral restraints48 (N, Cα, Cβ, NH, and Hα) for residues Ala4, Phe6, Ile8, Ala14, Phe16, Ala18, Lys19 and Phe20. The structure of
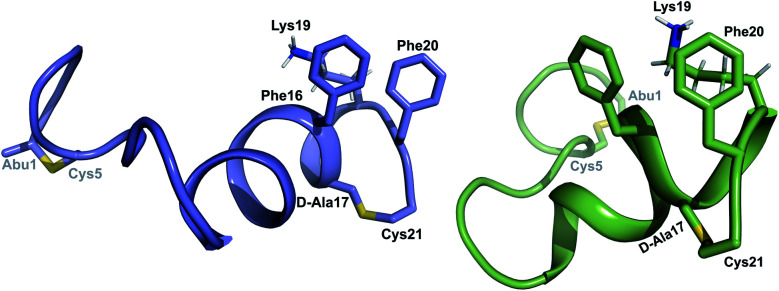
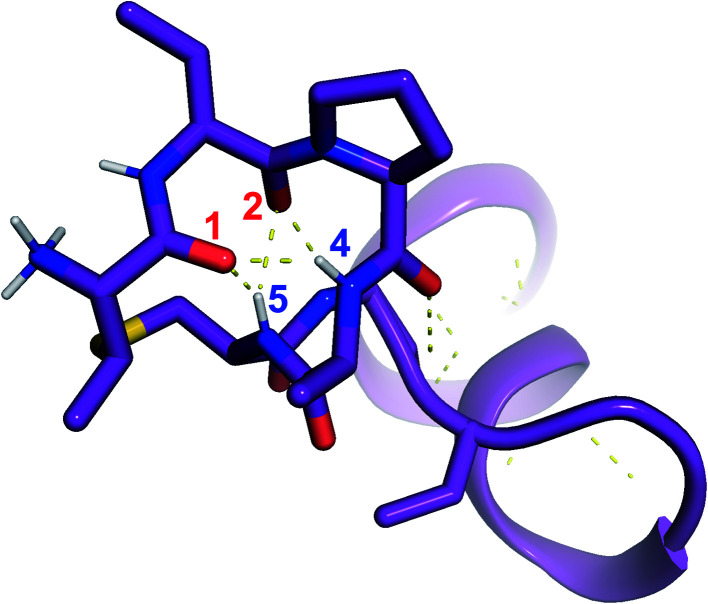
  (Fig. 9B) is helical with a slight bend between residues 8 and 21 with most dihedral angles φ and ψ characteristic of an α helix. The residues neighboring d-Ala17 and Cys21 display dihedral angles slightly less typical of an α helix. Rings A and B displayed similar convergence with an RMSD of 1.18 and 1.24 Å, respectively, with a slightly lower RMSD of 0.86 Å between residues 6 and 16 (Fig. 9C, Table S12†). The side chain protons of Lys19 are shifted 0.4 ppm upfield because they interact with the π systems of Phe16 and Phe20 (Fig. 10).41–43 The bifurcated hydrogen bonding interactions within ring A that were suggested in a previous computational study to be important for the preorganization of the peptide sequence to generate the less common ll-stereochemistry33 were observed in the NMR data and are shown in Fig. 11. This interaction involves the amide protons of residues Ala4 and Cys5 and the carbonyl oxygen atoms of residues Abu1 and Dhb2. Anticipated hydrogen bonds between residues i and i + 4 were present in the helical sequence between residues 9 and 19 (Fig. S33B†).
Fig. 10. View of the stacking of the aromatic side chains of Phe16 and Phe20 and the cation–π interaction that results in upfield shifts for the γ and δ protons of Lys19.
Fig. 11. View of the hydrogen bonding network present in ring A of  that contributes to preorganization of the substrate to form the ll stereochemistry. Hydrogen bond donor residue numbers are in blue font, while hydrogen bond acceptor residue numbers are in red font.
Structure of 
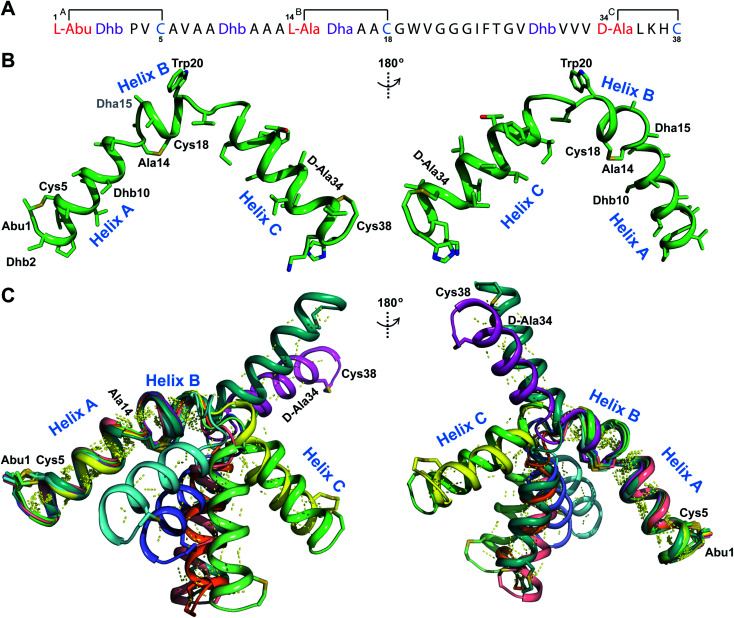
TOCSY data (Fig. S34†) and sequential NOESY assignments (Fig. S35†) were used for identification of the spin systems in the large subunit 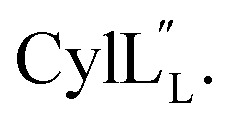 Assignments of the thioether linkages were based on cross peaks between the α proton of Abu1 and the β protons of the former Cys5 (Fig. S36B†), between the amide, α and β protons of l-Ala14 and the amide, α and β protons of the former Cys18 (Fig. S36C and D†), and between the α and β protons of d-Ala34 and the amide, α and β protons of the former Cys38 (Fig. S36E and F†). This ring pattern (Fig. 12A) is in agreement with previous tandem MS data.32 The three-dimensional structure was calculated using 95 sequential, and 98 medium- and zero long-range distance restraints derived from NOE data (Table S14†). Hydrogen bond restraints were determined through hydrogen deuterium exchange experiments using CD3OD as a solvent and were included in the refinement of the structure calculation. A total of 20 amide proton donors were present 6 hours after the start of the experiment (Cys5, Ala6, Val7, Ala8, Ala9, Ala11, Ala12, Ala13, Ala14, Ala17, Cys18, Trp20, Val21, Thr27, Val29, Val31, Val32, Val33, d-Ala34 and Leu35), with the amide protons of Ala6, Trp20, Val21, Thr27, Val29, d-Ala34 and Leu35 partially exchanged after 44 hours. Dihedral restrains were determined from vicinal amide proton Cα proton coupling constant 3JNH–αCH57 from the 1H spectrum of
  for Cys5, Ala6, Val7, Ala16, Cys18, Val31, Val32, d-Ala34 and Cys38. The
  structure is comprised of three helices spanning residues 2 to 12 (helix A), 16 to 20 (helix B), and 34 to 38 (helix C) (Fig. 12B). Each helical region is well-defined with RMSD values of 0.42, 0.68 and 0.70 Å, respectively (Table S14†). Hydrogen bonds typical of an α helix (i, i + 4) were observed for all amide protons between residues 5 and 20, and 27 and 38 as demonstrated by no or very slow exchange in hydrogen–deuterium exchange experiments, whereas the amide protons of residues 22–26 readily underwent hydrogen–deuterium exchange, indicating the absence of structurally stabilizing hydrogen bonds (Fig. 12C and S39†).
Fig. 12. (A) Ring pattern of 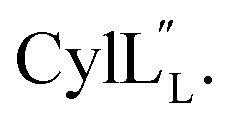 (B) Minimum energy structure of
 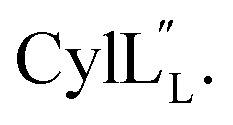 Residues involved in thioether linkages and dehydroamino acid residues are marked. The helix at the N-terminus has been termed helix A, the helix spanning the hinge region has been termed helix B, while the C-terminal helix has been named helix C. (C) Superimposition of the minimum energy 10 structure ensemble for
  with the portion of the peptide corresponding to helix A aligned. Hydrogen bonds are shown in yellow dashed lines.
The secondary structures of both cytolysin peptides display common features with other structurally characterized small hemolytic peptides such as melittin,58,59 magainin,60–63 pardaxin,64 MSI-594,60 and LL-37,65 namely 1–2 helical regions with a slight bend and a more flexible hinge region. In 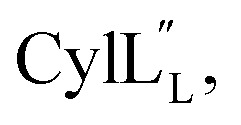 the ll-lanthionine spanning residues 14–18 immediately precedes such a hinge region. However, unlike these previously studied examples, both cytolysin peptides have a higher ratio of hydrophobic residues to cationic residues, which may explain the broader spectrum of membranes these peptides interact with.56
Helical peptides favorably interact with lipid membranes because their amide hydrogens and carbonyl groups are involved in intramolecular hydrogen bonding interactions and are sequestered away from the surface.66 A cationic patch on the peptide often serves as a first point of binding to the lipid head group (functions that could possibly be fulfilled by Lys19 in  and Lys36–His37 in
  ), after which the hydrophobic stretches of the peptides can insert in the membrane. Deletion of the hinge region was previously shown to be deleterious to hemolytic activity of melittin, although the precise role of the hinge region has not been elucidated.58 Membrane interacting peptides often contain a Trp that may facilitate interaction with the lipid bilayer.59,67–70 In the case of
 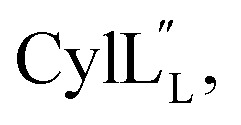 a Trp is located at position 20, at the interface with the hinge region.
Half of the structures in the ensemble adopt a more packed conformation, where the N-terminal region preceding the hinge spans a length of approximately 25–27 Å, while the C-terminal region measures approximately 20 Å and the two helices are oriented at an angle ranging from 40° to 60°. The other half of the structures adopt a more extended conformation. In some of these structures, helix A and C are co-linear and span a distance of 45–49 Å (Fig. 13), which is of a comparable size to a lipid bilayer.71,72 These conformations along with its amino acid sequence suggest that  has the characteristics to traverse a lipid membrane and it may be responsible for the observed pore formation activity when
  and
and  are both added to target cells.56 In support of a model in which the linear conformation may be the active form, the N-terminal region of a defensin peptide has been shown to undergo a structural rearrangement from a two-helix-one-sheet conformation to a primarily helical fold in the presence of micelles.73 We note that two-component lanthipeptides that have been investigated previously bind to a specific membrane target.74,75 Since currently the target of cytolysin is not known, our NMR experiments were done in the absence of any target and the structure ensemble may not represent active conformations of
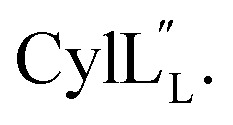
Fig. 13. (A) Superimposition of the 10-structure ensemble of  that adopts a more compact organization with an acute angle between helices A and C. (B) Superimposition of the 10-structure ensemble of
  that adopts a more linear conformation with an obtuse angle between helices A and C.
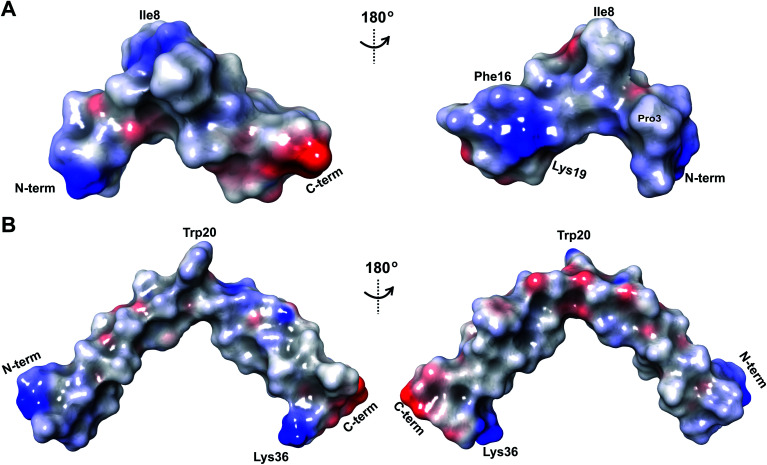
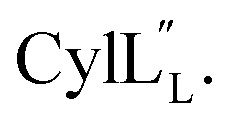
The electrostatic potential surface maps for the two cytolysin peptides are shown in Fig. 14. Consistent with the amphipathic character of membrane penetrating peptides,  has a more hydrophobic surface and a more positively charged surface on either side of its helix (Fig. 14A).
  has a positively charged patch close to the C-terminus at Lys36 potentially important for interacting with the negatively charged phosphate group on membranes. The remainder of the helical peptide is mostly hydrophobic residues with only the carbonyl oxygens in the glycine rich area of the hinge region (Fig. 14B) exposed.
Fig. 14. Electrostatic potential surface maps for (A)  and (B)
  .
.
Conclusions
This study determined the three-dimensional structures of five prochlorosins and the two peptides of the enterococcal cytolysin. For two of the prochlorosins, the ring pattern was not known prior to this work and for one prochlorosin the ring pattern previously proposed based on mutagenesis studies proved to be incorrect. The five prochlorosin structures along with the two cytolysin structures displayed some structural features that may support and/or explain the previous model that the substrate sequence determines the ring pattern and stereochemistry of the cyclization process.
For the prochlorosins, several intra-ring hydrogen bonding interactions were observed, that, if also present in the transition states for cyclization, would lower their energy and could explain their preferential formation over alternative ring patterns. In addition, hydrophobic packing, stacking of aromatic rings, and cation–π interactions may help bring the nucleophilic Cys closer to the electrophilic dehydroamino acid with which it reacts. It should be duly noted that the current structures are in the absence of the enzyme, and interactions with the protein may also affect the conformational energy landscape of the substrate. With the structures of the products now determined, this information may be combined with computational approaches such as molecular dynamics and machine learning to further investigate the enigmatic question of how the site-selectivity of the cyclization process is controlled.
The structures of the cytolysin peptides also provide new information, in regards to both their potential mode of action and the cyclization process that produces these peptides. It is likely that the rigid helices may already be present in the substrate peptide when bound to the enzyme. This would explain the site-selectivity of cyclization, as the Cys residues would be held in close proximity to the dehydroamino acids with which they react. Intra-ring hydrogen bonds that were suggested in a previous computational approach to explain the observed stereochemistry of cyclization were detected experimentally in the final product in the current study. The extended helicity of  is rare amongst lanthipeptides, which usually do not display long helical structures in previously determined structures4–10,12–16 as well as in the five prochlorosins investigated herein. To the best of our knowledge, the only other example is the β-peptide of the two-component lanthipeptide lichenicidin VK21, which displays a single long central helix.11 Thus, it is possible that two-component lantibiotics use a general mechanism in which one peptide recognizes a molecular target74,75 and a second long helical peptide is then recruited for pore formation or membrane disruption.
Materials and methods
Materials
Oligonucleotides were purchased from Integrated DNA Technologies. NEB Turbo competent E. coli, restriction endonucleases, DNA polymerases and Gibson Assembly Master Mix were purchased from New England Biolabs. Media for bacterial cell culture were purchased from Fisher Scientific. Isopropyl β-d-1-thiogalactopyranoside (IPTG) and kanamycin monosulfate were purchased from GoldBio. DNA sequencing was performed by ACGT Inc. Matrix-assisted laser desorption/ionization time-of-flight mass spectrometry (MALDI ToF MS) was conducted at the Mass Spectrometry Laboratory (UIUC) using ZipTip C18 (Millipore) for desalting of peptides and 2,5-dihydroxybenzoic acid (Sigma Aldrich) as matrix on a Bruker UltraFlextreme or Autoflex instrument. NMR solvents used were deuterium oxide spiked with 4,4-dimethyl-4-silapentane-1-sulfonic acid (DSS) (1 mL ampule, Cambridge Isotope Laboratories) and CD3OH (Sigma Aldrich).
Cloning of the pRSFDuet LanA/LanM constructs
The genes encoding ProcA2.1 and ProcA2.10 were amplified from purchased synthetic genes using primers ProcA2.1EcoR1_fp/ProcA2.1NotI_rp and ProcA2.10EcoR1_fp/ProcA2.10NotI_rp (Tables S15 and S16†) using touchdown PCR with the annealing temperature decreasing from 70 °C to 54 °C over 80 cycles (−0.2 °C per cycle). An example PCR amplification cycle consisted of denaturing (98 °C for 10 s), annealing (from 70 °C to 55 °C, 0.2 °C lower every cycle for a total of 80 cycles) for 30 s, and extension (72 °C for 30 s).76 PCR products containing homologous regions for Gibson assembly77 and an EcoRI/NotI digested pRSFDuet with procM in multiple cloning site II (MCSII) were purified by agarose gel electrophoresis and extracted using a QIAquick Gel Extraction kit. The inserts were assembled into the EcoRI/NotI-linearized pRSFDuet ProcM (MCSII) using a molar ratio of 10 : 1 (insert : backbone) using the Gibson method. The final construct was confirmed by sequencing.
Gibson assembly to generate pRSFDuet 2.10/M (procA2.10 in MCSI, procM in MCSII) was performed successfully only using NEB Turbo competent E. coli (C2984). Constructs pRSFDuet 1.1/M, 2.8/M, 2.11/M, CylLL-1/CylM-2 and CylLS-1/CylM-2 were described in previous work and cloned using E. coli DH5α.32,34
Peptide expression and purification
E. coli BL21T1R (DE3) cells were transformed with pRSFDuet-1 plasmids encoding N-terminally His-tagged ProcA1.1-G−1E, 2.1, 2.8, 2.10 or 2.11-G−1K as well as ProcM. An overnight culture was added to a culture flask containing Terrific Broth (TB) with 2% glucose (1 : 50 v/v; overnight culture : overexpression culture), kanamycin (50 μg mL−1) and 2.0 mM MgCl2. The culture was incubated in a 37 °C shaker until the OD600 reached 1.2–1.5. The cultures were cooled to 22 °C and induced with IPTG (500 μM final concentration). Following 20 h incubation at 22 °C, the cells were harvested at 5000 × g for 10 min and resuspended in 30–50 mL of LanA B1 Buffer (6.0 M guanidine hydrochloride, 0.5 mM imidazole, 20 mM NaH2PO4, pH 7.5) for each liter of culture. Resuspended cells were stored at −80 °C until purification by IMAC. Freeze-thawing in 6.0 M guanidine hydrochloride led to lysis of the cells, and the thawed cells were directly centrifuged at 30 000 × g for 30 min at 4 °C. The supernatants were applied to 4–6 mL of His60 Clontech Ni superflow resin (catalog number 635660) that had been charged with 2 column volumes (CV) of 0.1 M aqueous NiSO4, washed with 10 CV of water, and equilibrated with 10 CV of LanA B1 Buffer. The column was washed with ten CV of LanA B2 Buffer (4.0 M guanidine hydrochloride, 20 mM NaH2PO4, 30 mM imidazole, 300 mM NaCl, pH 7.5), and then 10 CV of Wash Buffer without guanidinium chloride (20 mM NaH2PO4, 30 mM imidazole, 300 mM NaCl, pH 7.5). Between five and seven CV of Elution Buffer without guanidinium (20 mM NaH2PO4, 500 mM imidazole, 300 mM NaCl, pH 7.5) was used to elute the peptide.49,78
For  a 13C,15N-labeled peptide was prepared by coexpressing His-tagged CylLS with CylM in isotopically labeled media. E. coli BL21 (DE3) were transformed with pRSFDuet-CylLS-1/CylM-2. A single colony was picked to start an overnight culture in 20 mL of LB supplied with 50 μg mL−1 kanamycin. The turbid overnight bacterial culture was spun down and the supernatant was discarded. The pellet was resuspended in 1 L of 13C,15N-labeled growth media containing 1 g 15NH4Cl; 2 g d-glucose-13C6; 1 g ISOGRO-13C,15N powder (Sigma); 7 g Na2HPO4; 3 g KH2PO4; 10.5 g K2HPO4; 0.5 g NaOH; 2.5 g NaCl; 50 mg thiamine; 10 mg biotin; 10 μM FeCl3; 2 μM ZnSO4; 2 μM MnCl2; 0.4 μM CuCl2; 0.4 μM CoCl2; 0.4 μM NiCl2; 0.4 μM H3BO3; 2 mM MgSO4; and 100 μM CaCl2. The culture was grown at 37 °C with agitation until the OD600 reached 0.6 and was immediately cooled to 18 °C. IPTG was added to a final concentration of 200 μM. Bacteria were cultured for additional 23 h at 18 °C with agitation before harvest. Peptide purification followed a similar procedure as described for prochlorosins.
Protease cleavage and purification of ProcM-modified core peptides
The elution fraction from the Ni-NTA column was diluted two-fold with 100 mM Tris pH 8.0 and an aliquot of 100 μL of the protease LahT150 (500 μM) purified as previously described,37 was added to cleave the leader peptide from ProcA 2.1, 2.8 and 2.10. The cleavage reactions were incubated overnight at room temperature. Cleavage of ProcA 2.8 was complete after the first overnight incubation. Two more LahT150 aliquots were added to the ProcA 2.1 and 2.10 reactions and again incubated overnight at room temperature. Removal of the leader peptide from His-tagged ProcA 2.11-G−1K was achieved with endoproteinase LysC (Roche).27
An aliquot of the leader peptide proteolysis reaction (30 μL) was combined with 5 μL of 500 mM HEPES buffer (pH 6.5) and 5 μL of 10 mM tris(2-carboxyethyl)phosphine hydrochloride (TCEP) dissolved in 500 mM HEPES buffer (pH 6.5) to reduce any unmodified cysteine thiols. The reduction reaction was incubated in a 50 °C water bath for 30 min, then 5 μL of 100 mM N-ethyl maleimide (NEM) dissolved in ethanol were added and the reaction was incubated at room temperature for 1 h. The reaction was desalted using ZipTip C18 (Millipore) according to the manufacturer's instructions. No alkylation adducts (+125 Da) were observed for any of the peptides by MALDI ToF MS analysis.
To prepare for RP-HPLC, the protease was precipitated by acidifying to 1% final concentration trifluoroacetic acid (TFA) and centrifuging at 30 000 × g for 10 min at 4 °C. The supernatants were injected onto a C18 column (Macherey-Nagel, VP 250/10 Nucleodur C18 HTec, 5 μM). Fractions containing core peptide were identified by MALDI-ToF MS (Fig. S1†) and lyophilized. The yields of the modified core peptides from 4.5 L of culture were as follows: 23 mg of Pcn 2.8 (full cleavage), 5 mg of Pcn 2.10 (incomplete LahT150 cleavage, 60 mg of full length uncleaved His-tagged peptide recovered), 7 mg of Pcn 2.1 (incomplete LahT150 cleavage, 30 mg of full length uncleaved His-tagged peptide recovered). The yield of purified Pcn 2.11 was lower due to suboptimal LC separation (1.7 mg from 27 L of culture).
A preliminary analysis of the 1H NMR spectrum of Pcn 2.1 did not show sharp amide proton signals and therefore the peptide was further purified. One milliliter His60 Clontech Ni superflow resin was pre-equilibrated with 20 mL of equilibration buffer (20 mM NaH2PO4, 30 mM imidazole, 1 M NaCl, pH 7.5). The resin was then transferred into a 15 mL conical tube using 2 mL of the equilibration buffer. The lyophilized 7 mg of partially purified Pcn 2.1 was dissolved in 5 mL of the equilibration buffer and added to the tube containing the Ni-NTA resin, incubated with gentle rocking for 1 h, then centrifuged at 600 × g for 10 min and the supernatant was collected. Another 7 mL of equilibration buffer was used to wash the resin again and centrifugation was repeated. The combined supernatants were purified by RP-HPLC using a C18 column (Macherey-Nagel, VP 250/10 Nucleodur C18 HTec, 5 μM) to result in 4 mg of Pcn 2.1. The cytolysin peptides and Pcn 1.1 were prepared and purified as previously reported using CylA protease for leader peptide removal in the case of the cytolysin peptides and a mixture of GluC and LysC for leader peptide removal from Pcn 1.1-G−1E.32,34
NMR data acquisition, annotation and peak integration
Prochlorosins were first dissolved in 320–350 μL of 10% D2O (Cambridge Isotope Laboratories)/90% H2O and transferred to a Shigemi D2O matched tube (BMS-005V, purchased from Wilmad-LabGlass) and a 1H, double pulsed field gradient spin-echo (DPFSGE) TOCSY with 30 and 70 ms mixing time and DPFSGE NOESY with 300 ms mixing time were acquired at 25 °C. For Pcn 2.11 a 300 ms mixing time NOESY spectrum was also acquired at 10 °C. After the first suite of experiments was completed, the peptide solution was lyophilized and the Shigemi tube was rinsed with D2O and dried in a 50 °C oven. After drying, the peptides were redissolved in D2O with 0.1 mg mL−1 DSS (Cambridge Isotope Laboratories), the solution was transferred into the dry Shigemi tube and data acquisition was repeated (70 ms mixing time TOCSY and 300 ms mixing time NOESY). The cytolysin peptides are poorly soluble in aqueous solution, likely reflecting their membrane target. Therefore, they were dissolved in 210 μL of CD3OH and transferred to a New Era NMR H5/3 NMR sample tube. 1H, DPFSGE TOCSY with 70 ms mixing time and DPFSGE NOESY with 300 ms mixing time were acquired at 4 °C for  1H, DPFSGE TOCSY with 70 ms mixing time and DPFSGE NOESY with 350 ms were acquired at 20 °C for
 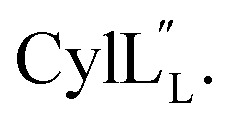 NMR data acquisition contained 2048 direct and 300 indirect data points and 16 or 32 scans for all spectra. For the deuterium exchange experiments, the peptide was dissolved in H2O or CH3OH, lyophilized, then dissolved in D2O with 0.1 mg mL−1 DSS or in CD3OD for the cytolysins, the sample was quickly transferred to a Wilmad P535 tube, placed in the spectrometer and repeated 1H spectra were acquired. Well-resolved amide protons protected from deuterium exchange were identified. For Pcn 1.1 and
 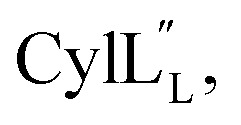 the data were acquired on a Varian INOVA 600 MHz spectrometer using the VNMRJ 2.1B software, whereas for Pcn 2.1, 2.8, 2.10, 2.11 and
  the data were acquired on an Agilent VNMRS 750 MHz spectrometer using the VNMRJ 4.2A software with the BioPack suite of pulse sequences for the 10% D2O/90% H2O acquisitions, and the ChemPack suite of pulse sequences for the 100% D2O acquisitions. The methyl protons of DSS were referenced as 0.0 ppm. For Pcn 2.8 and
  chemical shifts were used for predicting protein backbone torsion angles using the program TALOS+.48 When TALOS-N79,80 was used to also determine a subset of sidechain χ(1) dihedral angles, use of these additional restraints in the structural calculations did not improve the RMSD. TALOS-N provided two χ(1) dihedral angles (His4 and His6) for Pcn 2.8 and five χ(1) dihedral angles for
  (Cys5, Phe6, Leu15, Lys19, Phe20) based on chemical shifts of 15N, 13Cα, 13Cβ, Hα and HN.
Raw NMR data were processed in NMRPipe81 and analyzed in NMRFAM-Sparky.82 The amide protons were well dispersed in all samples, suggesting defined structures for all peptides under the acquisition conditions. The TOCSY and NOESY spectra were used for sequential assignment of all spin systems. Annotated cross peaks in the NOESY spectrum were integrated, sorted by intensity and exported in XPLOR format83 from Sparky.
NIH XPLOR parameter definition of the thioether linkages and dehydroamino acids
The files protein-3.2.top and protein-3.2.par in the XPLOR-NIH84,85 2.51 base package were edited to incorporate definitions for the thioether-cyclized residues as well as for the dehydroamino acids based on the force field parameters published by Turpin et al.,86 and are provided as ESI.† An ensemble of 20 minimum energy structures is reported for each peptide in the ESI.† All ensembles were deposited to the Protein Data Bank and all chemical shift assignments were deposited in the Biological Magnetic Resonance Data Bank. Accession codes are listed in Table 1. Chemical shift assignments are available in the ESI† in the following tables: Table S1† (Pcn 2.10), Table S3† (Pcn 2.1), Table S5† (Pcn 2.11), Table S7† (Pcn 1.1), Table S9† (Pcn 2.8), Table S11†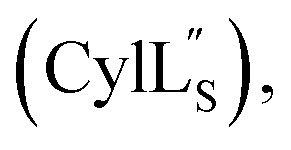 Table S13†
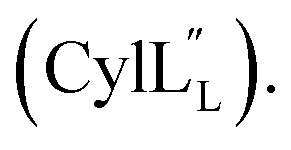 The following spectra were used for thioether ring assignments and the diagnostic NOE cross peaks are marked: Fig. S4† (Pcn 2.10), Fig. S10 and S11† (Pcn 2.1), Fig. S16† (Pcn 2.11), Fig. S21† (Pcn 1.1), Fig. S25† (Pcn 2.8), Fig. S32†
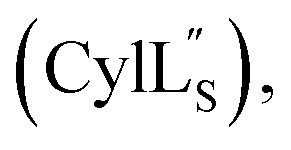 and Fig. S37†
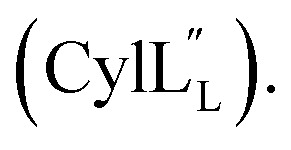 Ramachandran plots including all residues and excluding residues with d-stereochemistry and dehydroamino acid residues are provided in the ESI:† Fig. S5† (Pcn 2.10), Fig. S12† (Pcn 2.1), Fig. S17† (Pcn 2.11), Fig. S22† (Pcn 1.1), Fig. S27† (Pcn 2.8), Fig. S31†
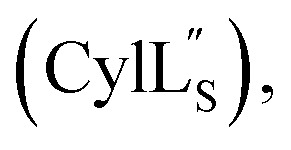 and Fig. S36†
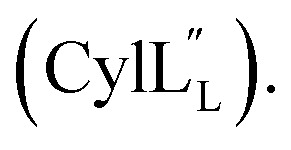 Structural statistics including Procheck Ramachandran analysis, root mean square deviation (RMSD) and number/type of NOE restraints for each ensemble are available in Table S2† (Pcn 2.10), Table S4† (Pcn 2.1), Table S6† (Pcn 2.11), Table S8† (Pcn 1.1), Table S10† (Pcn 2.8), Table S12†
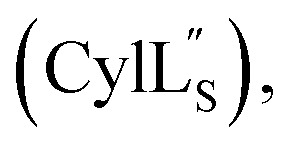 and Table S14†
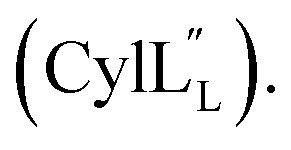
Accession codes for the peptide structure ensembles reported in this work.
| PDB accession number | BMRB accession number | |
|---|---|---|

|
6VE9 | 30702 |

|
6VGT | 30710 |
| Pcn 1.1 | 6VHJ | 30712 |
| Pcn 2.1 | 6VJQ | 30714 |
| Pcn 2.8 | 6VLJ | 30718 |
| Pcn 2.10 | 6VIQ | 30713 |
| Pcn 2.11 | 6VGP | 30709 |
Conflicts of interest
The authors declare no conflicts of interest.
Author contributions
The manuscript was written by S. C. B and W. A. V. S. C. B produced Pcn2.1, 2.8, 2.10, and 2.11, analyzed NMR data and refined structures. W. T. produced the cytolysin peptides. L. Z. assisted in NMR experiment setup, defined XPLOR-NIH parameters for the unnatural amino acids, and analyzed the cytolysin NMR data. S. C. B. refined the cytolysin structures. J. Z. A. analyzed the ProcA 2.8 NMR data. All authors have given approval to the final version of the manuscript.
Supplementary Material
Acknowledgments
This work was supported by the Howard Hughes Medical Institute (to W. A. v. d. D). A Bruker UltrafleXtreme MALDI ToF/ToF mass spectrometer was purchased in part with a grant from the National Institutes of Health (Grant S10 RR027109 A).
Electronic supplementary information (ESI) available: NMR and mass spectra and tables with peak assignments. XPLOR parameter and topology files, Fig. S1–S39, Tables S1–S16. See DOI: 10.1039/d0sc01651a
References
- Arnison P. G. Bibb M. J. Bierbaum G. Bowers A. A. Bugni T. S. Bulaj G. Camarero J. A. Campopiano D. J. Challis G. L. Clardy J. Cotter P. D. Craik D. J. Dawson M. Dittmann E. Donadio S. Dorrestein P. C. Entian K. D. Fischbach M. A. Garavelli J. S. Göransson U. Gruber C. W. Haft D. H. Hemscheidt T. K. Hertweck C. Hill C. Horswill A. R. Jaspars M. Kelly W. L. Klinman J. P. Kuipers O. P. Link A. J. Liu W. Marahiel M. A. Mitchell D. A. Moll G. N. Moore B. S. Müller R. Nair S. K. Nes I. F. Norris G. E. Olivera B. M. Onaka H. Patchett M. L. Piel J. Reaney M. J. Rebuffat S. Ross R. P. Sahl H. G. Schmidt E. W. Selsted M. E. Severinov K. Shen B. Sivonen K. Smith L. Stein T. Süssmuth R. D. Tagg J. R. Tang G. L. Truman A. W. Vederas J. C. Walsh C. T. Walton J. D. Wenzel S. C. Willey J. M. van der Donk W. A. Nat. Prod. Rep. 2013;30:108–160. doi: 10.1039/C2NP20085F. [DOI] [PMC free article] [PubMed] [Google Scholar]
- Yang X. van der Donk W. A. Chem.–Eur. J. 2013;19:7662–7677. doi: 10.1002/chem.201300401. [DOI] [PMC free article] [PubMed] [Google Scholar]
- Repka L. M. Chekan J. R. Nair S. K. van der Donk W. A. Chem. Rev. 2017;117:5457–5520. doi: 10.1021/acs.chemrev.6b00591. [DOI] [PMC free article] [PubMed] [Google Scholar]
- Zimmermann N. Freund S. Fredenhagen A. Jung G. Eur. J. Biochem. 1993;216:419–428. doi: 10.1111/j.1432-1033.1993.tb18159.x. [DOI] [PubMed] [Google Scholar]
- Hosoda K. Ohya M. Kohno T. Maeda T. Endo S. Wakamatsu K. J. Biochem. 1996;119:226–230. doi: 10.1093/oxfordjournals.jbchem.a021226. [DOI] [PubMed] [Google Scholar]
- Zimmermann N. Jung G. Eur. J. Biochem. 1997;246:809–819. doi: 10.1111/j.1432-1033.1997.00809.x. [DOI] [PubMed] [Google Scholar]
- Schneider T. R. Karcher J. Pohl E. Lubini P. Sheldrick G. M. Acta Crystallogr., Sect. D: Biol. Crystallogr. 2000;56(Pt 6):705–713. doi: 10.1107/S0907444900003711. [DOI] [PubMed] [Google Scholar]
- Hsu S. T. Breukink E. Bierbaum G. Sahl H. G. de Kruijff B. Kaptein R. van Nuland N. A. Bonvin A. M. J. Biol. Chem. 2003;278:13110–13117. doi: 10.1074/jbc.M211144200. [DOI] [PubMed] [Google Scholar]
- Ekkelenkamp M. B. Hanssen M. Danny Hsu S. T. de Jong A. Milatovic D. Verhoef J. van Nuland N. A. FEBS Lett. 2005;579:1917–1922. doi: 10.1016/j.febslet.2005.01.083. [DOI] [PubMed] [Google Scholar]
- Meindl K. Schmiederer T. Schneider K. Reicke A. Butz D. Keller S. Guhring H. Vertesy L. Wink J. Hoffmann H. Bronstrup M. Sheldrick G. M. Süssmuth R. D. Angew. Chem., Int. Ed. 2010;49:1151–1154. doi: 10.1002/anie.200905773. [DOI] [PubMed] [Google Scholar]
- Shenkarev Z. O. Finkina E. I. Nurmukhamedova E. K. Balandin S. V. Mineev K. S. Nadezhdin K. D. Yakimenko Z. A. Tagaev A. A. Temirov Y. V. Arseniev A. S. Ovchinnikova T. V. Biochemistry. 2010;49:6462–6472. doi: 10.1021/bi100871b. [DOI] [PubMed] [Google Scholar]
- Munch D. Muller A. Schneider T. Kohl B. Wenzel M. Bandow J. E. Maffioli S. Sosio M. Donadio S. Wimmer R. Sahl H. G. J. Biol. Chem. 2014;289:12063–12076. doi: 10.1074/jbc.M113.537449. [DOI] [PMC free article] [PubMed] [Google Scholar]
- Zhang J. Feng Y. Teng K. Lin Y. Gao Y. Wang J. Zhong J. Biochem. J. 2014;461:497–508. doi: 10.1042/BJ20131524. [DOI] [PubMed] [Google Scholar]
- Fujinami D. Mahin A. A. Elsayed K. M. Islam M. R. Nagao J. I. Roy U. Momin S. Zendo T. Kohda D. Sonomoto K. Commun. Biol. 2018;1:150. doi: 10.1038/s42003-018-0150-3. [DOI] [PMC free article] [PubMed] [Google Scholar]
- Fujinami D. Motomura H. Oshima H. Mahin A. A. Elsayed K. M. Zendo T. Sugita Y. Sonomoto K. Kohda D. J. Phys. Chem. Lett. 2020;11:1934–1939. doi: 10.1021/acs.jpclett.9b03591. [DOI] [PubMed] [Google Scholar]
- Acedo J. Z. Bothwell I. R. An L. Trouth A. Frazier C. van der Donk W. A. J. Am. Chem. Soc. 2019;141:16790–16801. doi: 10.1021/jacs.9b07396. [DOI] [PMC free article] [PubMed] [Google Scholar]
- Cotter P. D. Hill C. Ross R. P. Curr. Protein Pept. Sci. 2005;6:61–75. doi: 10.2174/1389203053027584. [DOI] [PubMed] [Google Scholar]
- Smith T. E. Pond C. D. Pierce E. Harmer Z. P. Kwan J. Zachariah M. M. Harper M. K. Wyche T. P. Matainaho T. K. Bugni T. S. Barrows L. R. Ireland C. M. Schmidt E. W. Nat. Chem. Biol. 2018;14:179–185. doi: 10.1038/nchembio.2537. [DOI] [PMC free article] [PubMed] [Google Scholar]
- Bosma T. Kuipers A. Bulten E. de Vries L. Rink R. Moll G. N. Appl. Environ. Microbiol. 2011;77:6794–6801. doi: 10.1128/AEM.05550-11. [DOI] [PMC free article] [PubMed] [Google Scholar]
- Urban J. H. Moosmeier M. A. Aumüller T. Thein M. Bosma T. Rink R. Groth K. Zulley M. Siegers K. Tissot K. Moll G. N. Prassler J. Nat. Commun. 2017;8:1500. doi: 10.1038/s41467-017-01413-7. [DOI] [PMC free article] [PubMed] [Google Scholar]
- Hetrick K. J. Walker M. C. van der Donk W. A. ACS Cent. Sci. 2018;4:458–467. doi: 10.1021/acscentsci.7b00581. [DOI] [PMC free article] [PubMed] [Google Scholar]
- Yang X. Lennard K. R. He C. Walker M. C. Ball A. T. Doigneaux C. Tavassoli A. van der Donk W. A. Nat. Chem. Biol. 2018;14:375–380. doi: 10.1038/s41589-018-0008-5. [DOI] [PMC free article] [PubMed] [Google Scholar]
- Ortiz-López F. J. Carretero-Molina D. Sánchez-Hidalgo M. Martín J. González I. Román-Hurtado F. de la Cruz M. García-Fernández S. Reyes F. Deisinger J. P. Müller A. Schneider T. Genilloud O. Angew. Chem., Int. Ed. 2020 doi: 10.1002/anie.202005187. [DOI] [PubMed] [Google Scholar]
- Chatterjee C. Miller L. M. Leung Y. L. Xie L. Yi M. Kelleher N. L. van der Donk W. A. J. Am. Chem. Soc. 2005;127:15332–15333. doi: 10.1021/ja0543043. [DOI] [PubMed] [Google Scholar]
- Xie L. Miller L. M. Chatterjee C. Averin O. Kelleher N. L. van der Donk W. A. Science. 2004;303:679–681. doi: 10.1126/science.1092600. [DOI] [PubMed] [Google Scholar]
- Dong S. H. Tang W. Lukk T. Yu Y. Nair S. K. van der Donk W. A. eLife. 2015;4:e07607. doi: 10.7554/eLife.07607. [DOI] [PMC free article] [PubMed] [Google Scholar]
- Li B. Sher D. Kelly L. Shi Y. Huang K. Knerr P. J. Joewono I. Rusch D. Chisholm S. W. van der Donk W. A. Proc. Natl. Acad. Sci. U. S. A. 2010;107:10430–10435. doi: 10.1073/pnas.0913677107. [DOI] [PMC free article] [PubMed] [Google Scholar]
- Yu Y. Mukherjee S. van der Donk W. A. J. Am. Chem. Soc. 2015;137:5140–5148. doi: 10.1021/jacs.5b01409. [DOI] [PMC free article] [PubMed] [Google Scholar]
- Mukherjee S. van der Donk W. A. J. Am. Chem. Soc. 2014;136:10450–10459. doi: 10.1021/ja504692v. [DOI] [PMC free article] [PubMed] [Google Scholar]
- Thibodeaux C. J. Ha T. van der Donk W. A. J. Am. Chem. Soc. 2014;136:17513–17529. doi: 10.1021/ja5089452. [DOI] [PMC free article] [PubMed] [Google Scholar]
- Van Tyne D. Martin M. J. Gilmore M. S. Toxins. 2013;5:895–911. doi: 10.3390/toxins5050895. [DOI] [PMC free article] [PubMed] [Google Scholar]
- Tang W. van der Donk W. A. Nat. Chem. Biol. 2013;9:157–159. doi: 10.1038/nchembio.1162. [DOI] [PMC free article] [PubMed] [Google Scholar]
- Tang W. Jiménez-Osés G. Houk K. N. van der Donk W. A. Nat. Chem. 2015;7:57–64. doi: 10.1038/nchem.2113. [DOI] [PMC free article] [PubMed] [Google Scholar]
- Tang W. van der Donk W. A. Biochemistry. 2012;51:4271–4279. doi: 10.1021/bi300255s. [DOI] [PMC free article] [PubMed] [Google Scholar]
- Cubillos-Ruiz A. Berta-Thompson J. W. Becker J. W. van der Donk W. A. Chisholm S. W. Proc. Natl. Acad. Sci. U. S. A. 2017;114:E5424–E5433. doi: 10.1073/pnas.1700990114. [DOI] [PMC free article] [PubMed] [Google Scholar]
- Yang X., Ph.D. thesis, University of Illinois at Urbana-Champaign, 2015 [Google Scholar]
- Bobeica S. C. Dong S. H. Huo L. Mazo N. McLaughlin M. I. Jimenéz-Osés G. Nair S. K. van der Donk W. A. eLife. 2019;8:e42305. doi: 10.7554/eLife.42305. [DOI] [PMC free article] [PubMed] [Google Scholar]
- Zhou H. Zhou Y. Proteins. 2004;54:315–322. doi: 10.1002/prot.10584. [DOI] [PubMed] [Google Scholar]
- Acedo J. Z. van Belkum M. J. Lohans C. T. Towle K. M. Miskolzie M. Vederas J. C. Biochemistry. 2016;55:733–742. doi: 10.1021/acs.biochem.5b01306. [DOI] [PubMed] [Google Scholar]
- Garcia De Gonzalo C. V. Zhu L. Oman T. J. van der Donk W. A. ACS Chem. Biol. 2014;9:796–801. doi: 10.1021/cb4008106. [DOI] [PMC free article] [PubMed] [Google Scholar]
- Gallivan J. P. Dougherty D. A. Proc. Natl. Acad. Sci. U. S. A. 1999;96:9459–9464. doi: 10.1073/pnas.96.17.9459. [DOI] [PMC free article] [PubMed] [Google Scholar]
- Riemen A. J. Waters M. L. Biochemistry. 2009;48:1525–1531. doi: 10.1021/bi801706k. [DOI] [PMC free article] [PubMed] [Google Scholar]
- Dougherty D. A. Acc. Chem. Res. 2013;46:885–893. doi: 10.1021/ar300265y. [DOI] [PMC free article] [PubMed] [Google Scholar]
- Shi Y. Yang X. Garg N. van der Donk W. A. J. Am. Chem. Soc. 2011;133:2338–2341. doi: 10.1021/ja109044r. [DOI] [PMC free article] [PubMed] [Google Scholar]
- Steiner T. Koellner G. J. Mol. Biol. 2001;305:535–557. doi: 10.1006/jmbi.2000.4301. [DOI] [PubMed] [Google Scholar]
- Levitt M. Perutz M. F. J. Mol. Biol. 1988;201:751–754. doi: 10.1016/0022-2836(88)90471-8. [DOI] [PubMed] [Google Scholar]
- Newberry R. W. Raines R. T. ACS Chem. Biol. 2019;14:1677–1686. doi: 10.1021/acschembio.9b00339. [DOI] [PMC free article] [PubMed] [Google Scholar]
- Shen Y. Delaglio F. Cornilescu G. Bax A. J. Biomol. NMR. 2009;44:213–223. doi: 10.1007/s10858-009-9333-z. [DOI] [PMC free article] [PubMed] [Google Scholar]
- Hegemann J. D. Bobeica S. C. Walker M. C. Bothwell I. R. van der Donk W. A. ACS Synth. Biol. 2019;8:1204–1214. doi: 10.1021/acssynbio.9b00080. [DOI] [PMC free article] [PubMed] [Google Scholar]
- Huycke M. M. Sahm D. F. Gilmore M. S. Emerging Infect. Dis. 1998;4:239–249. doi: 10.3201/eid0402.980211. [DOI] [PMC free article] [PubMed] [Google Scholar]
- Richards M. J. Edwards J. R. Culver D. H. Gaynes R. P. Infect. Control Hosp. Epidemiol. 2000;21:510–515. doi: 10.1086/501795. [DOI] [PubMed] [Google Scholar]
- Duan Y. Llorente C. Lang S. Brandl K. Chu H. Jiang L. White R. C. Clarke T. H. Nguyen K. Torralba M. Shao Y. Liu J. Hernandez-Morales A. Lessor L. Rahman I. R. Miyamoto Y. Ly M. Gao B. Sun W. Kiesel R. Hutmacher F. Lee S. Ventura-Cots M. Bosques-Padilla F. Verna E. C. Abraldes J. G. Brown Jr R. S. Vargas V. Altamirano J. Caballeria J. Shawcross D. L. Ho S. B. Louvet A. Lucey M. R. Mathurin P. Garcia-Tsao G. Bataller R. Tu X. M. Eckmann L. van der Donk W. A. Young R. Lawley T. D. Starkel P. Pride D. Fouts D. E. Schnabl B. Nature. 2019;575:505–511. doi: 10.1038/s41586-019-1742-x. [DOI] [PMC free article] [PubMed] [Google Scholar]
- Booth M. C. Bogie C. P. Sahl H. G. Siezen R. J. Hatter K. L. Gilmore M. S. Mol. Microbiol. 1996;21:1175–1184. doi: 10.1046/j.1365-2958.1996.831449.x. [DOI] [PubMed] [Google Scholar]
- Coburn P. S. Pillar C. M. Jett B. D. Haas W. Gilmore M. S. Science. 2004;306:2270–2272. doi: 10.1126/science.1103996. [DOI] [PubMed] [Google Scholar]
- Miyazaki S. Ohno A. Kobayashi I. Uji T. Yamaguchi K. Goto S. Microbiol. Immunol. 1993;37:265–270. doi: 10.1111/j.1348-0421.1993.tb03209.x. [DOI] [PubMed] [Google Scholar]
- Cox C. R. Coburn P. S. Gilmore M. S. Curr. Protein Pept. Sci. 2005;6:77–84. doi: 10.2174/1389203053027557. [DOI] [PubMed] [Google Scholar]
- Pardi A. Billeter M. Wüthrich K. J. Mol. Biol. 1984;180:741–751. doi: 10.1016/0022-2836(84)90035-4. [DOI] [PubMed] [Google Scholar]
- Saravanan R. Bhunia A. Bhattacharjya S. Biochim. Biophys. Acta. 2010;1798:128–139. doi: 10.1016/j.bbamem.2009.07.014. [DOI] [PubMed] [Google Scholar]
- Bhunia A. Domadia P. N. Bhattacharjya S. Biochim. Biophys. Acta. 2007;1768:3282–3291. doi: 10.1016/j.bbamem.2007.07.017. [DOI] [PubMed] [Google Scholar]
- Ramamoorthy A. Thennarasu S. Lee D. K. Tan A. Maloy L. Biophys. J. 2006;91:206–216. doi: 10.1529/biophysj.105.073890. [DOI] [PMC free article] [PubMed] [Google Scholar]
- Matsuzaki K. Sugishita K. Harada M. Fujii N. Miyajima K. Biochim. Biophys. Acta. 1997;1327:119–130. doi: 10.1016/S0005-2736(97)00051-5. [DOI] [PubMed] [Google Scholar]
- Gesell J. Zasloff M. Opella S. J. J. Biomol. NMR. 1997;9:127–135. doi: 10.1023/A:1018698002314. [DOI] [PubMed] [Google Scholar]
- Hamada T. Matsunaga S. Fujiwara M. Fujita K. Hirota H. Schmucki R. Guntert P. Fusetani N. J. Am. Chem. Soc. 2010;132:12941–12945. doi: 10.1021/ja104616z. [DOI] [PubMed] [Google Scholar]
- Porcelli F. Buck B. Lee D. K. Hallock K. J. Ramamoorthy A. Veglia G. J. Biol. Chem. 2004;279:45815–45823. doi: 10.1074/jbc.M405454200. [DOI] [PMC free article] [PubMed] [Google Scholar]
- Wang G. J. Biol. Chem. 2008;283:32637–32643. doi: 10.1074/jbc.M805533200. [DOI] [PubMed] [Google Scholar]
- Beevers A. J. Dixon A. M. Chem. Soc. Rev. 2010;39:2146–2157. doi: 10.1039/B912944H. [DOI] [PubMed] [Google Scholar]
- Rasul R. Cole N. Balasubramanian D. Chen R. Kumar N. Willcox M. D. Int. J. Antimicrob. Agents. 2010;35:566–572. doi: 10.1016/j.ijantimicag.2010.02.005. [DOI] [PubMed] [Google Scholar]
- Chan D. I. Prenner E. J. Vogel H. J. Biochim. Biophys. Acta. 2006;1758:1184–1202. doi: 10.1016/j.bbamem.2006.04.006. [DOI] [PubMed] [Google Scholar]
- Yau W. M. Wimley W. C. Gawrisch K. White S. H. Biochemistry. 1998;37:14713–14718. doi: 10.1021/bi980809c. [DOI] [PubMed] [Google Scholar]
- Torcato I. M. Huang Y. H. Franquelim H. G. Gaspar D. Craik D. J. Castanho M. A. Troeira Henriques S. Biochim. Biophys. Acta. 2013;1828:944–955. doi: 10.1016/j.bbamem.2012.12.002. [DOI] [PubMed] [Google Scholar]
- Hsu S. T. Breukink E. Tischenko E. Lutters M. A. De Kruijff B. Kaptein R. Bonvin A. M. Van Nuland N. A. Nat. Struct. Mol. Biol. 2004;11:963–967. doi: 10.1038/nsmb830. [DOI] [PubMed] [Google Scholar]
- Rawicz W. Olbrich K. C. McIntosh T. Needham D. Evans E. Biophys. J. 2000;79:328–339. doi: 10.1016/S0006-3495(00)76295-3. [DOI] [PMC free article] [PubMed] [Google Scholar]
- Kouno T. Mizuguchi M. Aizawa T. Shinoda H. Demura M. Kawabata S. Kawano K. Biochemistry. 2009;48:7629–7635. doi: 10.1021/bi900756y. [DOI] [PubMed] [Google Scholar]
- Wiedemann I. Bottiger T. Bonelli R. R. Wiese A. Hagge S. O. Gutsmann T. Seydel U. Deegan L. Hill C. Ross P. Sahl H. G. Mol. Microbiol. 2006;61:285–296. doi: 10.1111/j.1365-2958.2006.05223.x. [DOI] [PubMed] [Google Scholar]
- Oman T. J. van der Donk W. A. ACS Chem. Biol. 2009;4:865–874. doi: 10.1021/cb900194x. [DOI] [PMC free article] [PubMed] [Google Scholar]
- Korbie D. J. Mattick J. S. Nat. Protoc. 2008;3:1452–1456. doi: 10.1038/nprot.2008.133. [DOI] [PubMed] [Google Scholar]
- Gibson D. G. Young L. Chuang R. Y. Venter J. C. Hutchison 3rd C. A. Smith H. O. Nat. Methods. 2009;6:343–345. doi: 10.1038/nmeth.1318. [DOI] [PubMed] [Google Scholar]
- Bobeica S. C. van der Donk W. A. Methods Enzymol. 2018;604:165–203. doi: 10.1016/bs.mie.2018.01.038. [DOI] [PubMed] [Google Scholar]
- Shen Y. Bax A. J. Biomol. NMR. 2013;56:227–241. doi: 10.1007/s10858-013-9741-y. [DOI] [PMC free article] [PubMed] [Google Scholar]
- Shen Y. Bax A. Methods Mol. Biol. 2015;1260:17–32. doi: 10.1007/978-1-4939-2239-0_2. [DOI] [PMC free article] [PubMed] [Google Scholar]
- Delaglio F. Grzesiek S. Vuister G. W. Zhu G. Pfeifer J. Bax A. J. Biomol. NMR. 1995;6:277–293. doi: 10.1007/BF00197809. [DOI] [PubMed] [Google Scholar]
- Lee W. Tonelli M. Markley J. L. Bioinformatics. 2015;31:1325–1327. doi: 10.1093/bioinformatics/btu830. [DOI] [PMC free article] [PubMed] [Google Scholar]
- Schwieters C. D. Kuszewski J. J. Tjandra N. Clore G. M. J. Magn. Reson. 2003;160:65–73. doi: 10.1016/S1090-7807(02)00014-9. [DOI] [PubMed] [Google Scholar]
- Schwieters C. D. Bermejo G. A. Clore G. M. Protein Sci. 2018;27:26–40. doi: 10.1002/pro.3248. [DOI] [PMC free article] [PubMed] [Google Scholar]
- Schwieters C. D. Kuszewski J. J. Tjandra N. Clore G. M. Prog. Nucl. Magn. Reson. Spectrosc. 2006;48:47–62. doi: 10.1016/j.pnmrs.2005.10.001. [DOI] [Google Scholar]
- Turpin E. R. Mulholland S. Teale A. M. Bonev B. B. Hirst J. D. RSC Adv. 2014;4:48621–48631. doi: 10.1039/C4RA09897H. [DOI] [Google Scholar]
Associated Data
This section collects any data citations, data availability statements, or supplementary materials included in this article.


