Summary:
Brain-computer interfaces (BCIs) can restore communication to people who have lost the ability to move or speak. To date, a major focus of BCI research has been on restoring gross motor skills, such as reaching and grasping1–5 or point-and-click typing with a 2D computer cursor 6,7. However, rapid sequences of highly dexterous behaviors, such as handwriting or touch typing, might enable faster communication rates. Here, we demonstrate an intracortical BCI that decodes attempted handwriting movements from neural activity in motor cortex and translates it to text in real-time, using a novel recurrent neural network decoding approach. With this BCI, our study participant, whose hand was paralyzed from spinal cord injury, achieved typing speeds that exceed those of any other BCI yet reported: 90 characters per minute at 94.1% raw accuracy online, and >99% accuracy offline with a general-purpose autocorrect. These speeds are comparable to able-bodied smartphone typing speeds in our participant’s age group (115 characters per minute)8. Finally, new theoretical considerations explain why temporally complex movements, such as handwriting, may be fundamentally easier to decode than point-to-point movements. Our results open a new approach for BCIs and demonstrate the feasibility of accurately decoding rapid, dexterous movements years after paralysis.
Neural representation of handwriting
Prior BCI studies have shown that the motor intention for gross motor skills, such as reaching, grasping or moving a computer cursor, remains neurally encoded in motor cortex after paralysis1–7. However, it is still unknown whether the neural representation for a rapid and highly-dexterous motor skill, such as handwriting, also remains intact. We tested this by recording neural activity from two microelectrode arrays in the hand “knob” area of precentral gyrus (a premotor area)9,10 while our BrainGate study participant, T5, attempted to handwrite individual letters and symbols (Fig. 1a). T5 has a high-level spinal cord injury (C4 AIS C) and was paralyzed from the neck down; his hand movements were entirely non-functional and limited to twitching and micromotion. We instructed T5 to “attempt” to write as if his hand was not paralyzed, while imagining that he was holding a pen on a piece of ruled paper.
Figure 1. Neural representation of attempted handwriting.
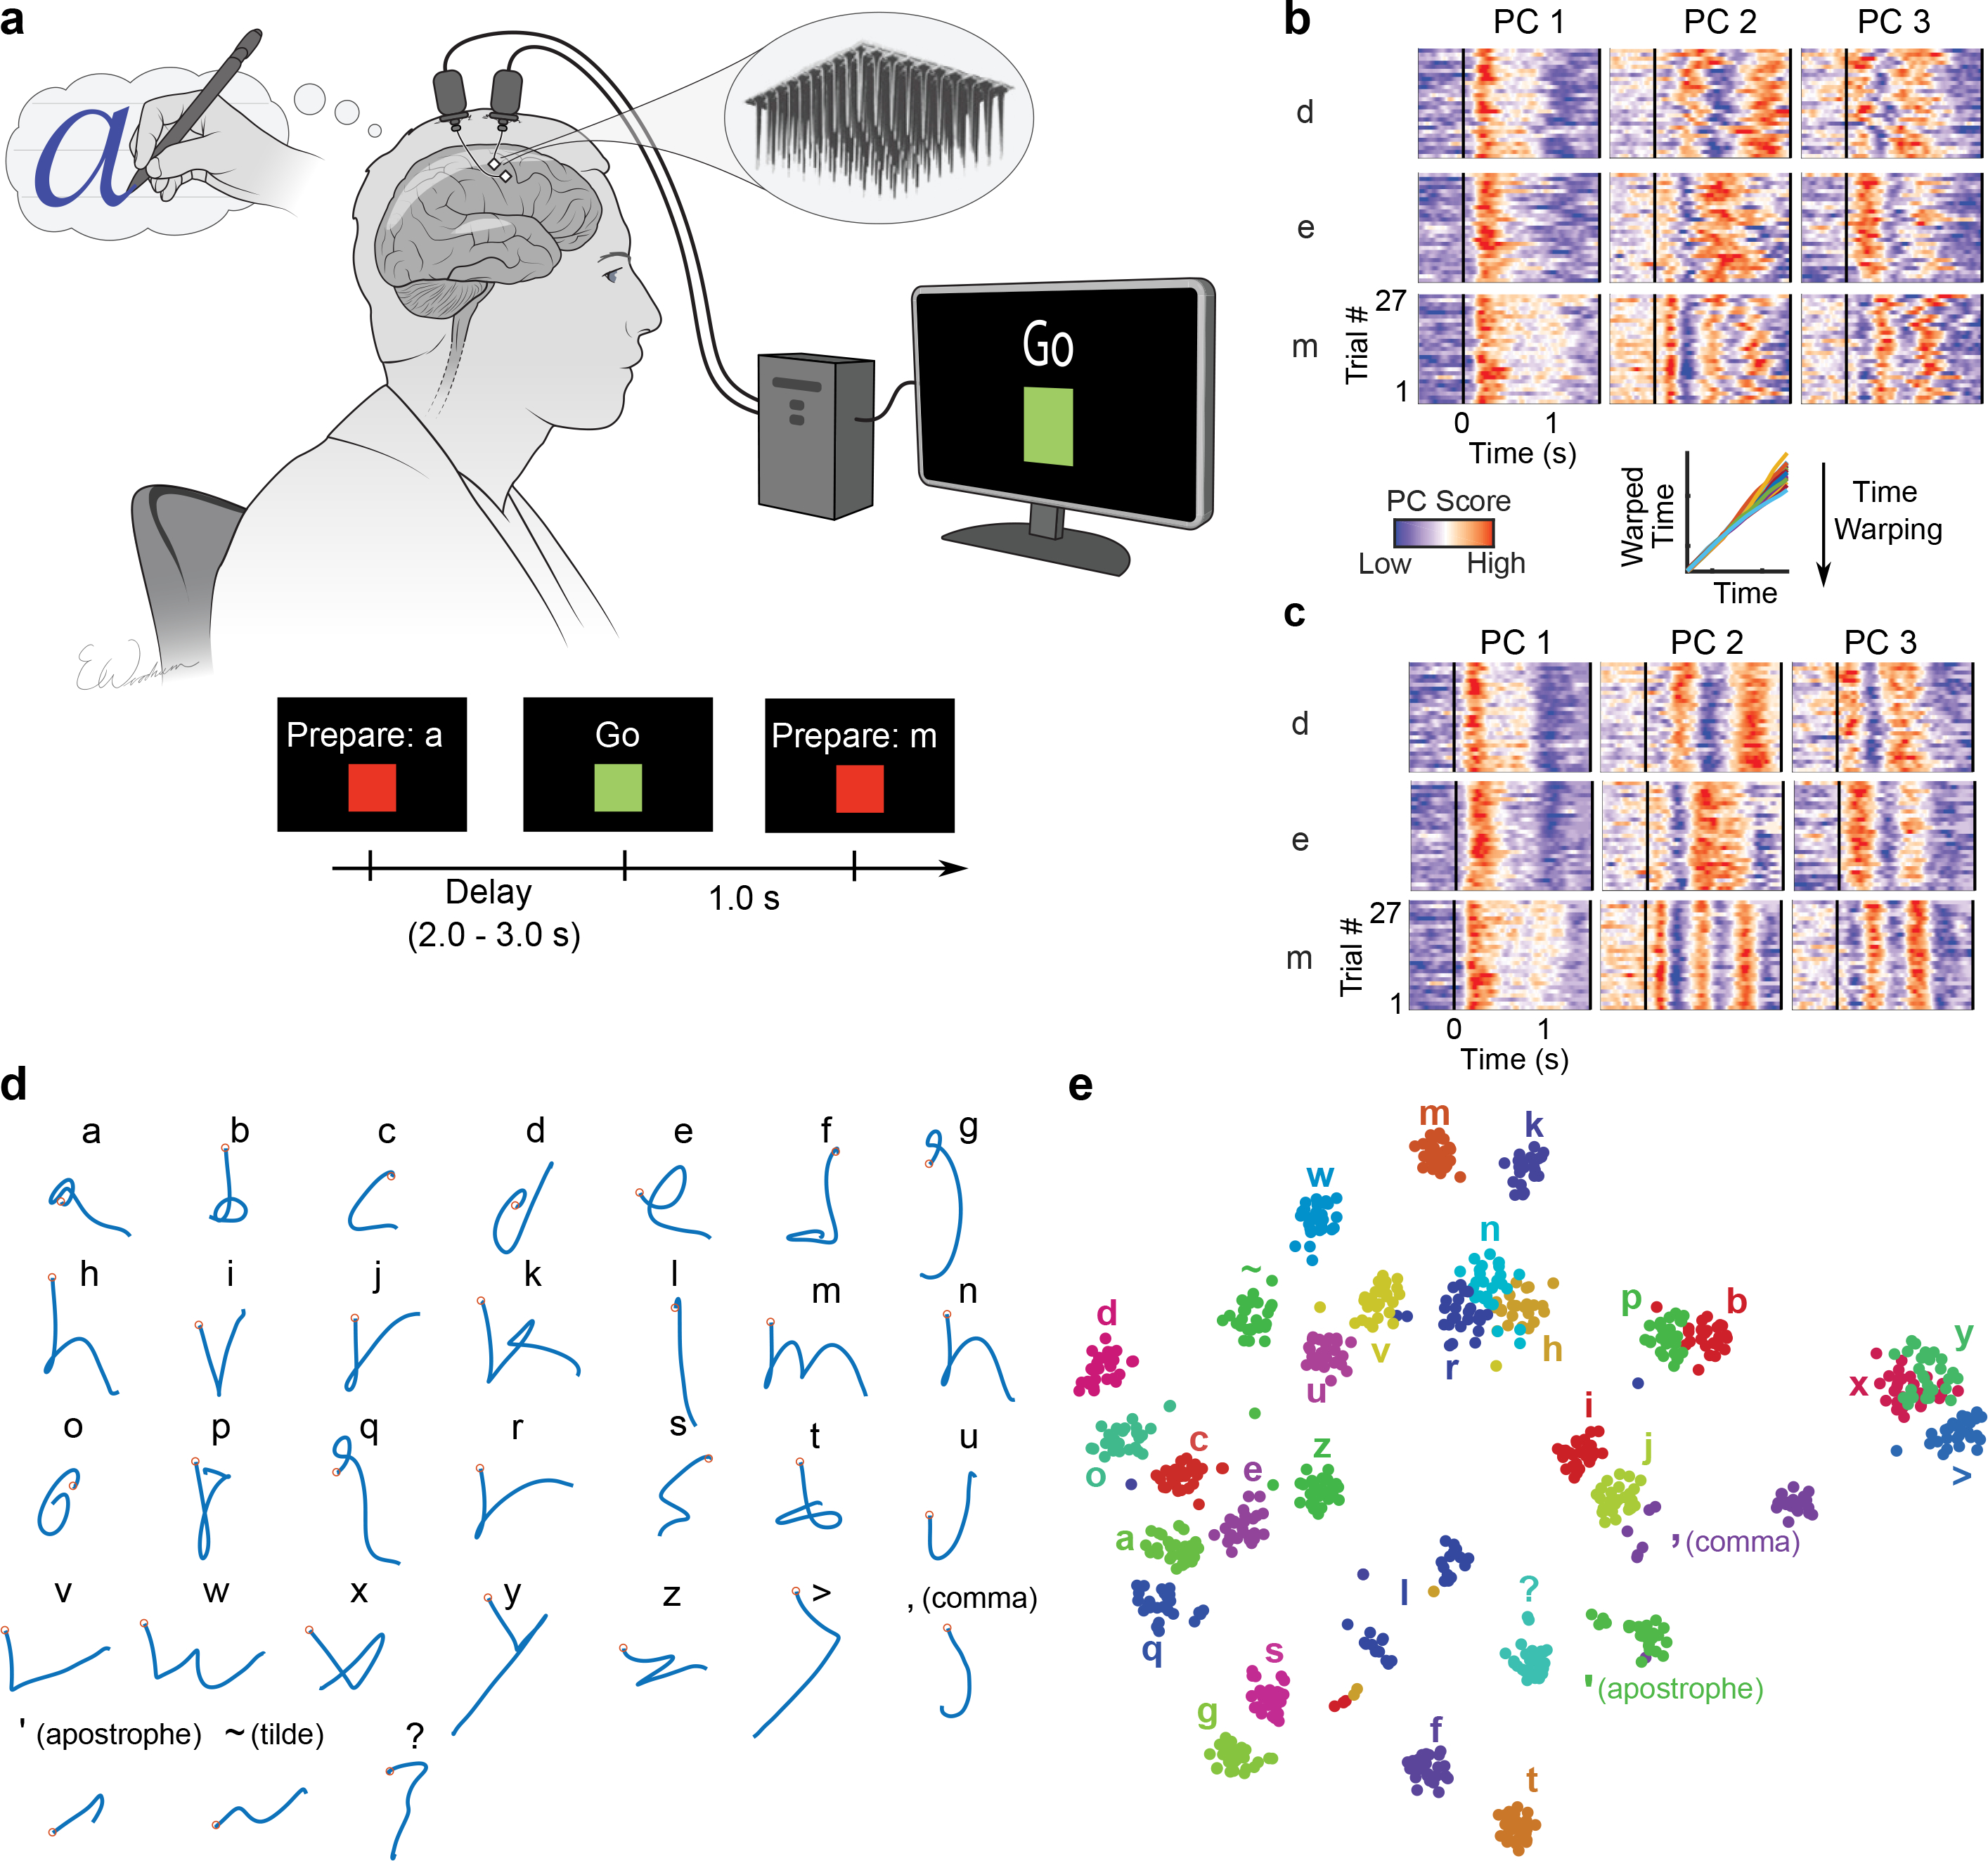
a, To assess the neural representation of attempted handwriting, participant T5 attempted to handwrite each character one at a time, following the instructions given on a computer screen (lower panels depict what is shown on the screen, following the timeline). b, Neural activity in the top 3 principal components (PCs) is shown for three example letters (d, e and m) and 27 repetitions of each letter (‘trials’). The color scale was normalized within each panel separately for visualization. c, Time-warping the neural activity to remove trial-to-trial changes in writing speed reveals consistent patterns of activity unique to each letter. In the inset above C, example time-warping functions are shown for the letter ‘m’ and lie relatively close to the identity line (each trial’s warping function is plotted with a differently colored line). d, Decoded pen trajectories are shown for all 31 tested characters. Intended 2D pen tip velocity was linearly decoded from the neural activity using cross-validation (each character was held out), and decoder output was denoised by averaging across trials. Orange circles denote the start of the trajectory. e, A 2-dimensional visualization of the neural activity made using t-SNE. Each circle is a single trial (27 trials for each of 31 characters).
To visualize the neural activity (multiunit threshold crossing rates), we used principal components analysis to display the top 3 neural dimensions containing the most variance (Fig. 1b). The neural activity appeared to be strong and repeatable, although the timing of its peaks and valleys varied across trials, potentially due to fluctuations in writing speed. We used a time-alignment technique to remove temporal variability11, revealing remarkably consistent underlying patterns of neural activity that are unique to each character (Fig. 1c). To see if the neural activity encoded the pen movements needed to draw each character’s shape, we attempted to reconstruct each character by linearly decoding pen tip velocity from the trial-averaged neural activity (Fig. 1d). Readily recognizable letter shapes confirm that pen tip velocity is robustly encoded. The neural dimensions that represented pen tip velocity accounted for 30% of the total neural variance.
Next, we used a nonlinear dimensionality reduction method (t-SNE) to produce a 2-dimensional visualization of each single trial’s neural activity recorded after the ‘go’ cue was given (Fig. 1e). The t-SNE visualization revealed tight clusters of neural activity for each character and a predominantly motoric encoding where characters that are written similarly are closer together. Using a k-nearest neighbor classifier applied offline to the neural activity, we could classify the characters with 94.1% accuracy (95% CI = [92.6, 95.8]). Taken together, these results suggest that, even years after paralysis, the neural representation of handwriting in motor cortex is likely strong enough to be useful for a BCI.
Decoding handwritten sentences
Next, we tested whether we could decode complete handwritten sentences in real-time, thus enabling a person with tetraplegia to communicate by attempting to handwrite their intended message. To do so, we trained a recurrent neural network (RNN) to convert the neural activity into probabilities describing the likelihood of each character being written at each moment in time (Fig. 2a, Extended Data Fig. 1). These probabilities could either be thresholded in a simple way to emit discrete characters, which we did for real-time decoding (Fig. 2a “Raw Online Output”), or processed more extensively by a large-vocabulary language model to simulate an autocorrect feature, which we applied offline (Fig. 2a “Offline Output from a Language Model”). We used the limited set of 31 characters shown in Fig. 1d, consisting of the 26 lower case letters of the alphabet, commas, apostrophes, question marks, periods (written by T5 as ‘~’) and spaces (written by T5 as ‘>‘). The ‘~’ and ‘>‘ symbols were chosen to make periods and spaces easier to detect. T5 attempted to write each character in print (not cursive), with each character printed on top of the previous one.
Figure 2. Neural decoding of attempted handwriting in real-time.
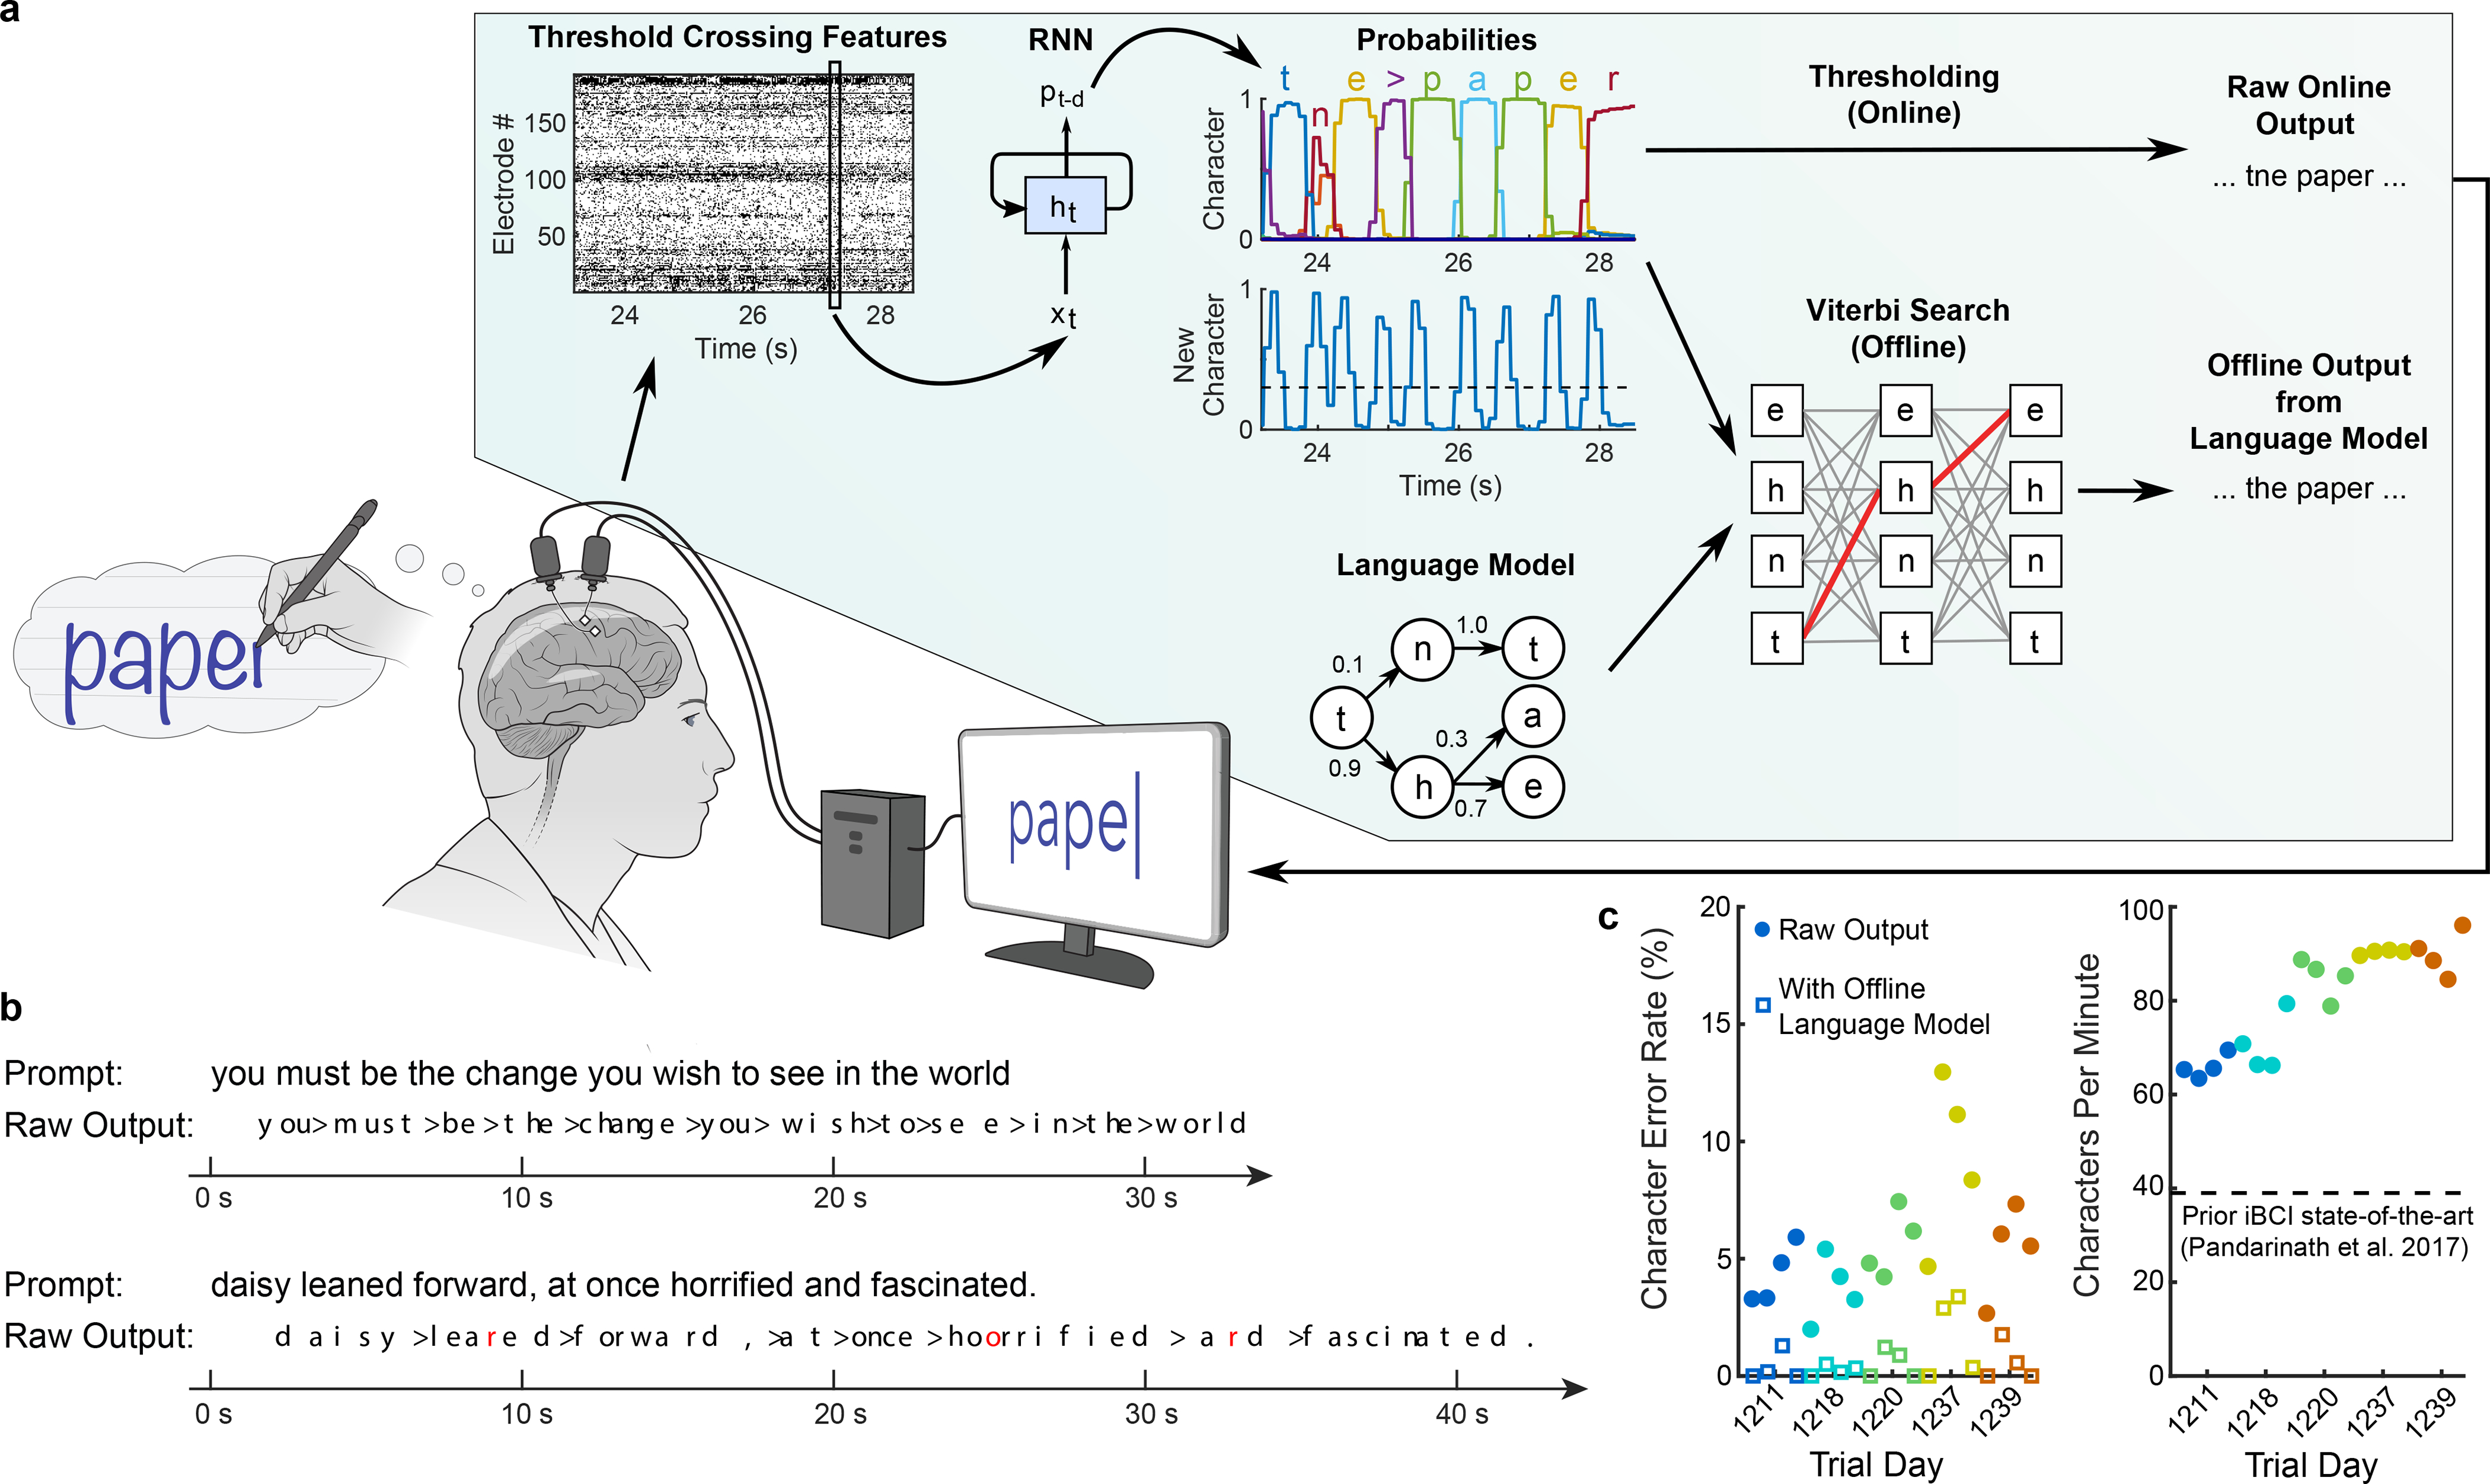
a, Diagram of the decoding algorithm. First, the neural activity (multiunit threshold crossings) was temporally binned and smoothed on each electrode (20 ms bins). Then, a recurrent neural network (RNN) converted this neural population time series (xt) into a probability time series (pt-d) describing the likelihood of each character and the probability of any new character beginning. The RNN had a one second output delay (d), giving it time to observe each character fully before deciding its identity. Finally, the character probabilities were thresholded to produce “Raw Online Output” for real-time use (when the ‘new character’ probability crossed a threshold at time t, the most likely character at time t+0.3s was emitted and shown on the screen). In an offline retrospective analysis, the character probabilities were combined with a large-vocabulary language model to decode the most likely text that the participant wrote (using a custom 50,000-word bigram model). b, Two real-time example trials are shown, demonstrating the RNN’s ability to decode readily understandable text on sentences it was never trained on. Errors are highlighted in red and spaces are denoted with “>”. c, Error rates (edit distances) and typing speeds are shown for five days, with four blocks of 7–10 sentences each (each block is indicated with a single circle and colored according to the trial day). The speed is more than double that of the next fastest intracortical BCI7.
To collect training data for the RNN, we recorded neural activity while T5 attempted to handwrite complete sentences at his own pace, following instructions on a computer monitor. Prior to the first day of real-time evaluation, we collected a total of 242 sentences across 3 pilot days that were combined to train the RNN. On each subsequent day of real-time testing, additional training data were collected to recalibrate the RNN prior to evaluation, yielding a combined total of 572 training sentences by the last day (comprising 7.3 hours and 30.4k characters). To train the RNN, we adapted neural network methods in automatic speech recognition12–14 to overcome two key challenges: (1) the time that each letter was written in the training data was unknown (since T5’s hand was paralyzed), making it challenging to apply supervised learning techniques, and (2) the dataset was limited in size compared to typical RNN datasets, making it difficult to prevent overfitting to the training data (see Supplemental Methods, Extended Data Figs. 2–3).
We evaluated the RNN’s performance over a series of 5 days, each day containing 4 evaluation blocks of 7–10 sentences that the RNN was never trained on (thus ensuring that the RNN could not have overfit to those sentences). T5 copied each sentence from an onscreen prompt, attempting to handwrite it letter by letter, while the decoded characters appeared on the screen in real-time as they were detected by the RNN (Supplementary Video 1–2, Extended Data Table 1). Characters appeared after they were completed by T5 with a short delay (estimated to be 0.4–0.7 seconds). The decoded sentences were quite legible (Fig. 2b, “Raw Output”). Importantly, typing rates were high, plateauing at 90 characters per minute with a 5.4% character error rate (Fig. 2c, average of red circles). Since there was no “backspace” function implemented, T5 was instructed to continue writing if any decoding errors occurred.
When a language model was used to autocorrect errors offline, error rates decreased considerably (Fig. 2c, open squares below filled circles; Table 1). The character error rate fell to 0.89% and the word error rate fell to 3.4% averaged across all days, which is comparable to state-of-the-art speech recognition systems (e.g. word error rates of 4–5% 14,15), putting it well within the range of usability. Finally, to probe the limits of possible decoding performance, we trained a new RNN offline using all available sentences to process the entire sentence in a non-causal way (comparable to other BCI studies 16,17). Accuracy was extremely high in this regime (0.17% character error rate), indicating a high potential ceiling of performance, although this decoder would not be able to provide letter-by-letter feedback to the user.
Table 1. Mean character and word error rates (with 95% CIs) for the handwriting BCI across all 5 days.
“Raw online output” is what was decoded online (in real-time). “Online output + offline language model” was obtained by applying a language model retrospectively to what was decoded online (to simulate an autocorrect feature). “Offline bidirectional RNN + language model” was obtained by retraining a bidirectional (acausal) decoder offline using all available data, in addition to applying a language model. Word error rates can be much higher than character error rates because a word is considered incorrect if any character in that word is wrong.
| Character Error Rate [95% CI] | Word Error Rate [95% CI] | |
|---|---|---|
| Raw online output | 5.9% [5.3, 6.5] | 25.1% [22.5, 27.4] |
| Online output + offline language model | 0.89% [0.61, 1.2] | 3.4% [2.5, 4.4] |
| Offline bidirectional RNN + language model | 0.17% [0, 0.36] | 1.5% [0, 3.2] |
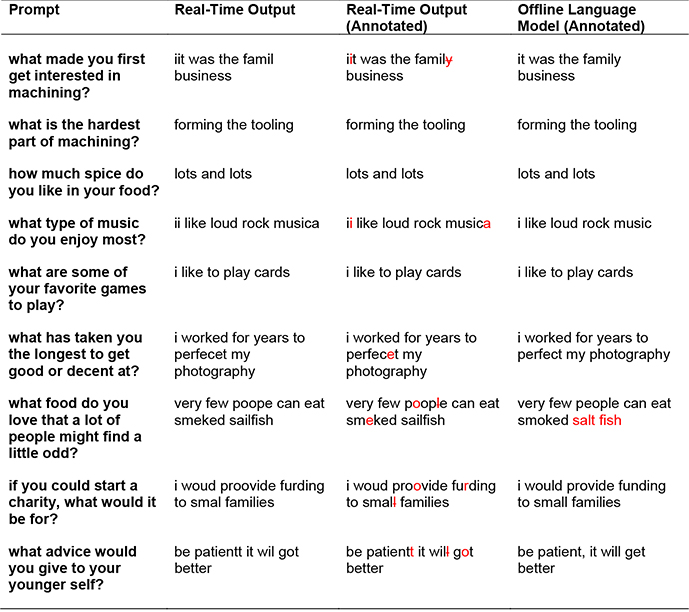
Next, to evaluate performance in a less restrained setting, we collected two days of data in which T5 used the BCI to freely type answers to open-ended questions (Supplementary Video 3, Extended Data Table 2). The results confirm that high performance can also be achieved when the user writes self-generated sentences as opposed to copying on-screen prompts (73.8 characters per minute with an 8.54% character error rate in real-time, 2.25% with a language model). The prior state-of-the-art for free typing in intracortical BCIs was 24.4 correct characters per minute 7.
Daily decoder retraining
Following standard practice (e.g. 1,2,18,4,5), we retrained our handwriting decoder each day before evaluating it, with the help of ‘calibration’ data collected at the beginning of each day. Retraining helps account for changes in neural recordings that accrue over time, which might be caused by neural plasticity or electrode array micromotion. Ideally, to reduce the burden on the user, little or no calibration data would be required. In a retrospective analysis of the copy typing data reported above in Fig. 2, we assessed whether high performance could still have been achieved using less than the original 50 calibration sentences per day (Fig. 3a). We found that 10 sentences (8.7 minutes) were enough to achieve a raw error rate of 8.5% (1.7% with a language model), although 30 sentences were needed to match the raw online error rate of 5.9%.
Figure 3. Performance remains high when daily decoder retraining is shortened (or unsupervised).
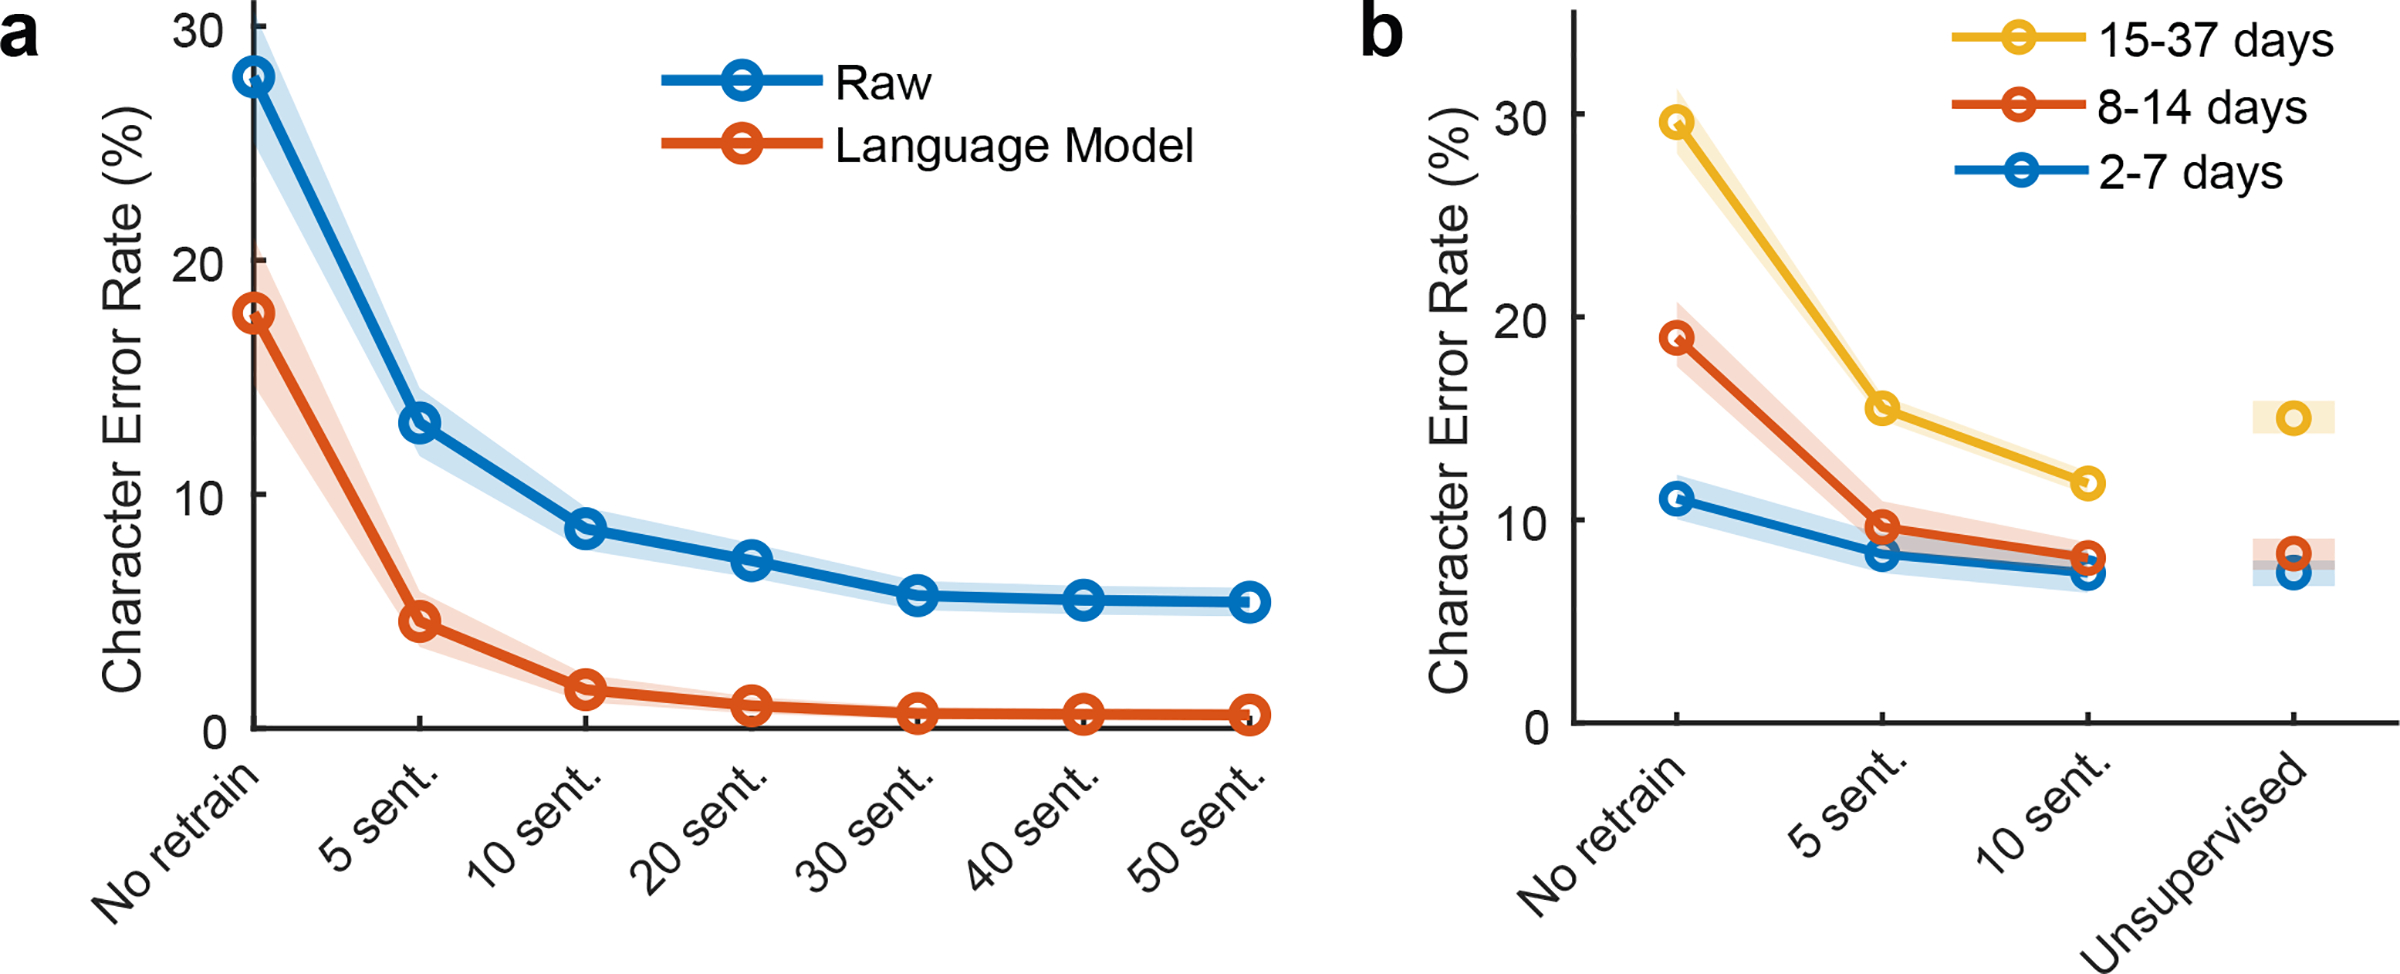
a, To account for neural activity changes that accrue over time, we retrained our handwriting decoder each day before evaluating it. Here, we simulated offline how decoding performance would have changed if less than the original 50 calibration sentences were used. Lines show the mean error rate across all data and shaded regions indicate 95% CIs. b, Copy typing data from eight sessions were used to assess whether less calibration data are required if sessions occur closer in time. All session pairs (X, Y) were considered. Decoders were first initialized using training data from session X and earlier, and then evaluated on session Y under different retraining methods (no retraining, retraining with limited calibration data, or unsupervised retraining). Lines show the average raw error rate and shaded regions indicate 95% CIs.
However, our copy typing data were collected over a 28-day time span, possibly allowing larger changes in neural activity to accumulate. Using further offline analyses, we assessed whether more closely-spaced sessions reduce the need for calibration data (Fig. 3b). We found that when only 2–7 days passed between sessions, performance was reasonable with no decoder retraining (11.1% raw error rate, 1.5% with a language model), as might be expected from prior work showing short-term stability of neural recordings19–21. Finally, we tested whether decoders could be retrained in an unsupervised manner by using a language model to error-correct and retrain the decoder, thus bypassing the need to interrupt the user for calibration (i.e., by recalibrating automatically during normal use). Encouragingly, unsupervised retraining achieved a 7.3% raw error rate (0.84% with a language model) when sessions were separated by 7 days or less.
Ultimately, whether decoders can be successfully retrained with minimal recalibration data depends on how quickly the neural activity changes over time. We assessed the stability of the neural patterns associated with each character and found high short-term stability (mean correlation = 0.85 when 7 days apart or less), and neural changes that seemed to accumulate at a steady and predictable rate (Extended Data Fig. 4). The above results are promising for clinical viability, as they suggest that unsupervised decoder retraining, combined with more limited supervised retraining after longer periods of inactivity, may be sufficient to achieve high performance. Nevertheless, future work must confirm this online, as offline simulations are not always predictive of online performance.
Temporal variety improves decoding
To our knowledge, 90 characters per minute is the highest typing rate yet reported for any type of BCI (see Discussion). For intracortical BCIs, the highest performing method has been point-and-click typing with a 2D computer cursor, peaking at 40 characters per minute 7 (see Supplementary Video 4 for a direct comparison). The speed of point-and-click BCIs is limited primarily by decoding accuracy. During parameter optimization, the cursor gain is increased so as to increase typing rate, until the cursor moves so quickly that it becomes uncontrollable due to decoding errors22. How is it then that handwriting movements could be decoded more than twice as fast, with similar levels of accuracy?
We theorize that handwritten letters may be easier to distinguish from each other than point-to-point movements, since letters have more variety in their spatiotemporal patterns of neural activity than do straight-line movements. To test this theory, we analyzed the patterns of neural activity associated with 16 straight-line movements and 16 letters that required no lifting of the pen off the page, both performed by T5 with attempted handwriting (Fig. 4a–b).
Figure 4. Increased temporal variety can make movements easier to decode.

a, We analyzed the spatiotemporal patterns of neural activity corresponding to 16 handwritten characters (1 second in duration) vs. 16 handwritten straight-line movements (0.6 seconds in duration). b, Spatiotemporal neural patterns were found by averaging over all trials for a given movement (after time-warping to align the trials in time)11. Neural activity was resampled to equalize the duration of each set of movements, resulting in a 192 × 100 matrix for each movement (192 electrodes and 100 time steps). c, Pairwise Euclidean distances between neural patterns were computed for each set, revealing larger nearest neighbor distances (but not mean distances) for characters. Each circle represents a single movement and bar heights show the mean. d, Larger nearest neighbor distances made the characters easier to classify than straight lines. The noise is in units of standard deviations and matches the scale of the distances in c. e, The spatial dimensionality was similar for characters and straight lines, but the temporal dimensionality was more than twice as high for characters, suggesting that more temporal variety underlies the increased nearest neighbor distances and better classification performance. Error bars show the 95% CI. Dimensionality was quantified using the participation ratio. f-h, A toy example to give intuition for how increased temporal dimensionality can make neural trajectories more separable. Four neural trajectories are depicted (N1 and N2 are two hypothetical neurons whose activity is constrained to a single spatial dimension, the unity diagonal). Allowing the trajectories to vary in time by adding one bend (increasing the temporal dimensionality from 1 to 2) enables larger nearest neighbor distances (g) and better classification (h).
First, we analyzed the pairwise Euclidean distances between each neural activity pattern. We found that the nearest-neighbor distances for each movement were 72% larger for characters as compared to straight lines (95% CI = [60%, 86%]), making it less likely for a decoder to confuse two nearby characters (Fig. 4c). To confirm this, we simulated the classification accuracy for each set of movements as a function of neural noise (Fig. 4d), demonstrating that characters are easier to classify than straight lines.
To gain insight into what might be responsible for the relative increase in nearest neighbor distances for characters, we examined the spatial and temporal dimensionality of the neural patterns. Spatial and temporal dimensionality were estimated using the “participation ratio”, which quantifies approximately how many spatial or temporal dimensions are required to explain 80% of the variance in the neural activity patterns23. We found that spatial dimensionality was only modestly larger for characters (1.24 times larger; 95% CI = [1.19, 1.30]), but that the temporal dimensionality was much greater (2.65 times larger; 95% CI = [2.58, 2.72]), suggesting that the increased variety of temporal patterns in letter writing drives the increased separability of each movement (Fig. 4e).
To illustrate how increased temporal dimensionality can make movements more distinguishable, we constructed a toy model with four movements and two neurons whose activity is constrained to lie along a single dimension (Fig. 4f–g). Simply by allowing the trajectories to change in time (Fig. 4g), the nearest neighbor distance between the neural trajectories can be increased, resulting in an increase in classification accuracy when noise levels are large enough (Fig. 4h). Although neural noise in the toy model was assumed to be independent white noise, we found that these results also hold for noise that is correlated across time and neurons (Extended Data Fig. 5 and Supplemental Note 1).
These results suggest that time-varying patterns of movement, such as handwritten letters, are fundamentally easier to decode than point-to-point movements. We think this is one, but not necessarily the only, important factor that enabled a handwriting BCI to go faster than continuous-motion point-and-click BCIs. Other discrete (classification-based) BCIs have also typically used directional movements with little temporal variety, which may have limited their accuracy and/or the size of the movement set24,25.
More generally, using the principle of maximizing the nearest neighbor distance between movements, it should be possible to optimize a set of movements for ease of classification26. We explored doing so and designed an alphabet that is theoretically easier to classify than the Latin alphabet (Extended Data Fig. 6). The optimized alphabet avoids large clusters of redundant letters that are written similarly (most Latin letters begin with either a downstroke or a counter-clockwise curl).
Discussion
Locked-in syndrome (paralysis of nearly all voluntary muscles) severely impairs or prevents communication, and is most frequently caused by brainstem stroke or late-stage ALS (estimated prevalence of locked-in syndrome: 1 in 100,000 27). Commonly used BCIs for restoring communication are either flashing EEG spellers28–30,18,31,32 or intracortical point-and-click BCIs33,6,7. EEG spellers based on oddball potentials or motor imagery typically achieve 1–5 characters per minute28–32. EEG spellers that use visually evoked potentials have achieved speeds of 60 characters per minute 18, but have important usability limitations, as they tie up the eyes, are not typically self-paced, and require panels of flashing lights on a screen. Intracortical BCIs based on 2D cursor movements give the user more freedom to look around and set their own pace of communication, but have yet to exceed 40 correct characters per minute in people7. Recently, speech-decoding BCIs have shown exciting promise for restoring rapid communication (e.g. 34,16,17), but their accuracies and vocabulary sizes require further improvement to support general-purpose use.
Here, we introduced a novel approach for communication BCIs – decoding a rapid, dexterous motor behavior in a person with tetraplegia – that sets a new benchmark for communication rate at 90 characters per minute. The demonstrated real-time system is general (the user can express any sentence), easy to use (entirely self-paced and the eyes are free to move), and accurate enough to be useful in the real-world (94.1% raw accuracy, and >99% accuracy offline with a large-vocabulary language model). To achieve high performance, we developed new decoding methods to work effectively with unlabeled neural sequences in data-limited regimes. These methods could be applied more generally to any sequential behavior that cannot be observed directly (e.g., decoding speech from someone who can no longer speak).
Finally, it is important to recognize that the current system is a proof-of-concept that a high-performance handwriting BCI is possible (in a single participant); it is not yet a complete, clinically viable system. More work is needed to demonstrate high performance in additional people, expand the character set (e.g., capital letters), enable text editing and deletion, and maintain robustness to changes in neural activity without interrupting the user for decoder retraining. More broadly, intracortical microelectrode array technology is still maturing, and requires further demonstrations of longevity, safety, and efficacy before widespread clinical adoption35,36. Variability in performance across participants is also a potential concern (in a prior study, T5 achieved the highest performance of 3 participants7).
Nevertheless, we believe the future of intracortical BCIs is bright. Current microelectrode array technology has been shown to retain functionality for 1000+ days post implant37,38 (including here; see Extended Data Fig. 7), and has enabled the highest BCI performance to date compared to other recording technologies (EEG, ECoG) for restoring communication7, arm control2,5, and general-purpose computer use39. New developments are underway for implant designs that increase the electrode count by at least an order of magnitude, which will further improve performance and longevity35,36,40,41. Finally, we envision that a combination of algorithmic innovations42–44 and improvements to device stability will continue to reduce the need for daily decoder retraining. Here, offline analyses showed the potential promise of more limited, or even unsupervised, decoder retraining (Fig. 3).
Extended Data
Extended Data Fig. 1: Diagram of the RNN architecture.
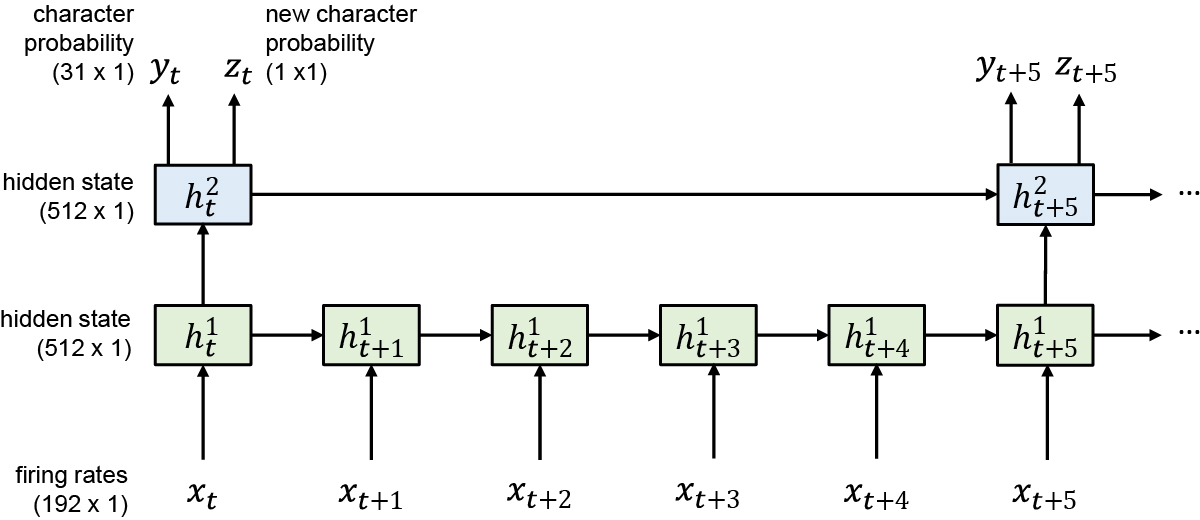
We used a two-layer gated recurrent unit (GRU) recurrent neural network architecture to convert sequences of neural firing rate vectors xt (which were temporally smoothed and binned at 20 ms) into sequences of character probability vectors yt and ‘new character’ probability scalars zt. The yt vectors describe the probability of each character being written at that moment in time, and the zt scalars go high whenever the RNN detects that T5 is beginning to write any new character. Note that the top RNN layer runs at a slower frequency than the bottom layer, which we found improved the speed of training by making it easier to hold information in memory for long time periods. Thus, the RNN outputs are updated only once every 100 ms.
Extended Data Fig. 2: Overview of RNN training methods.
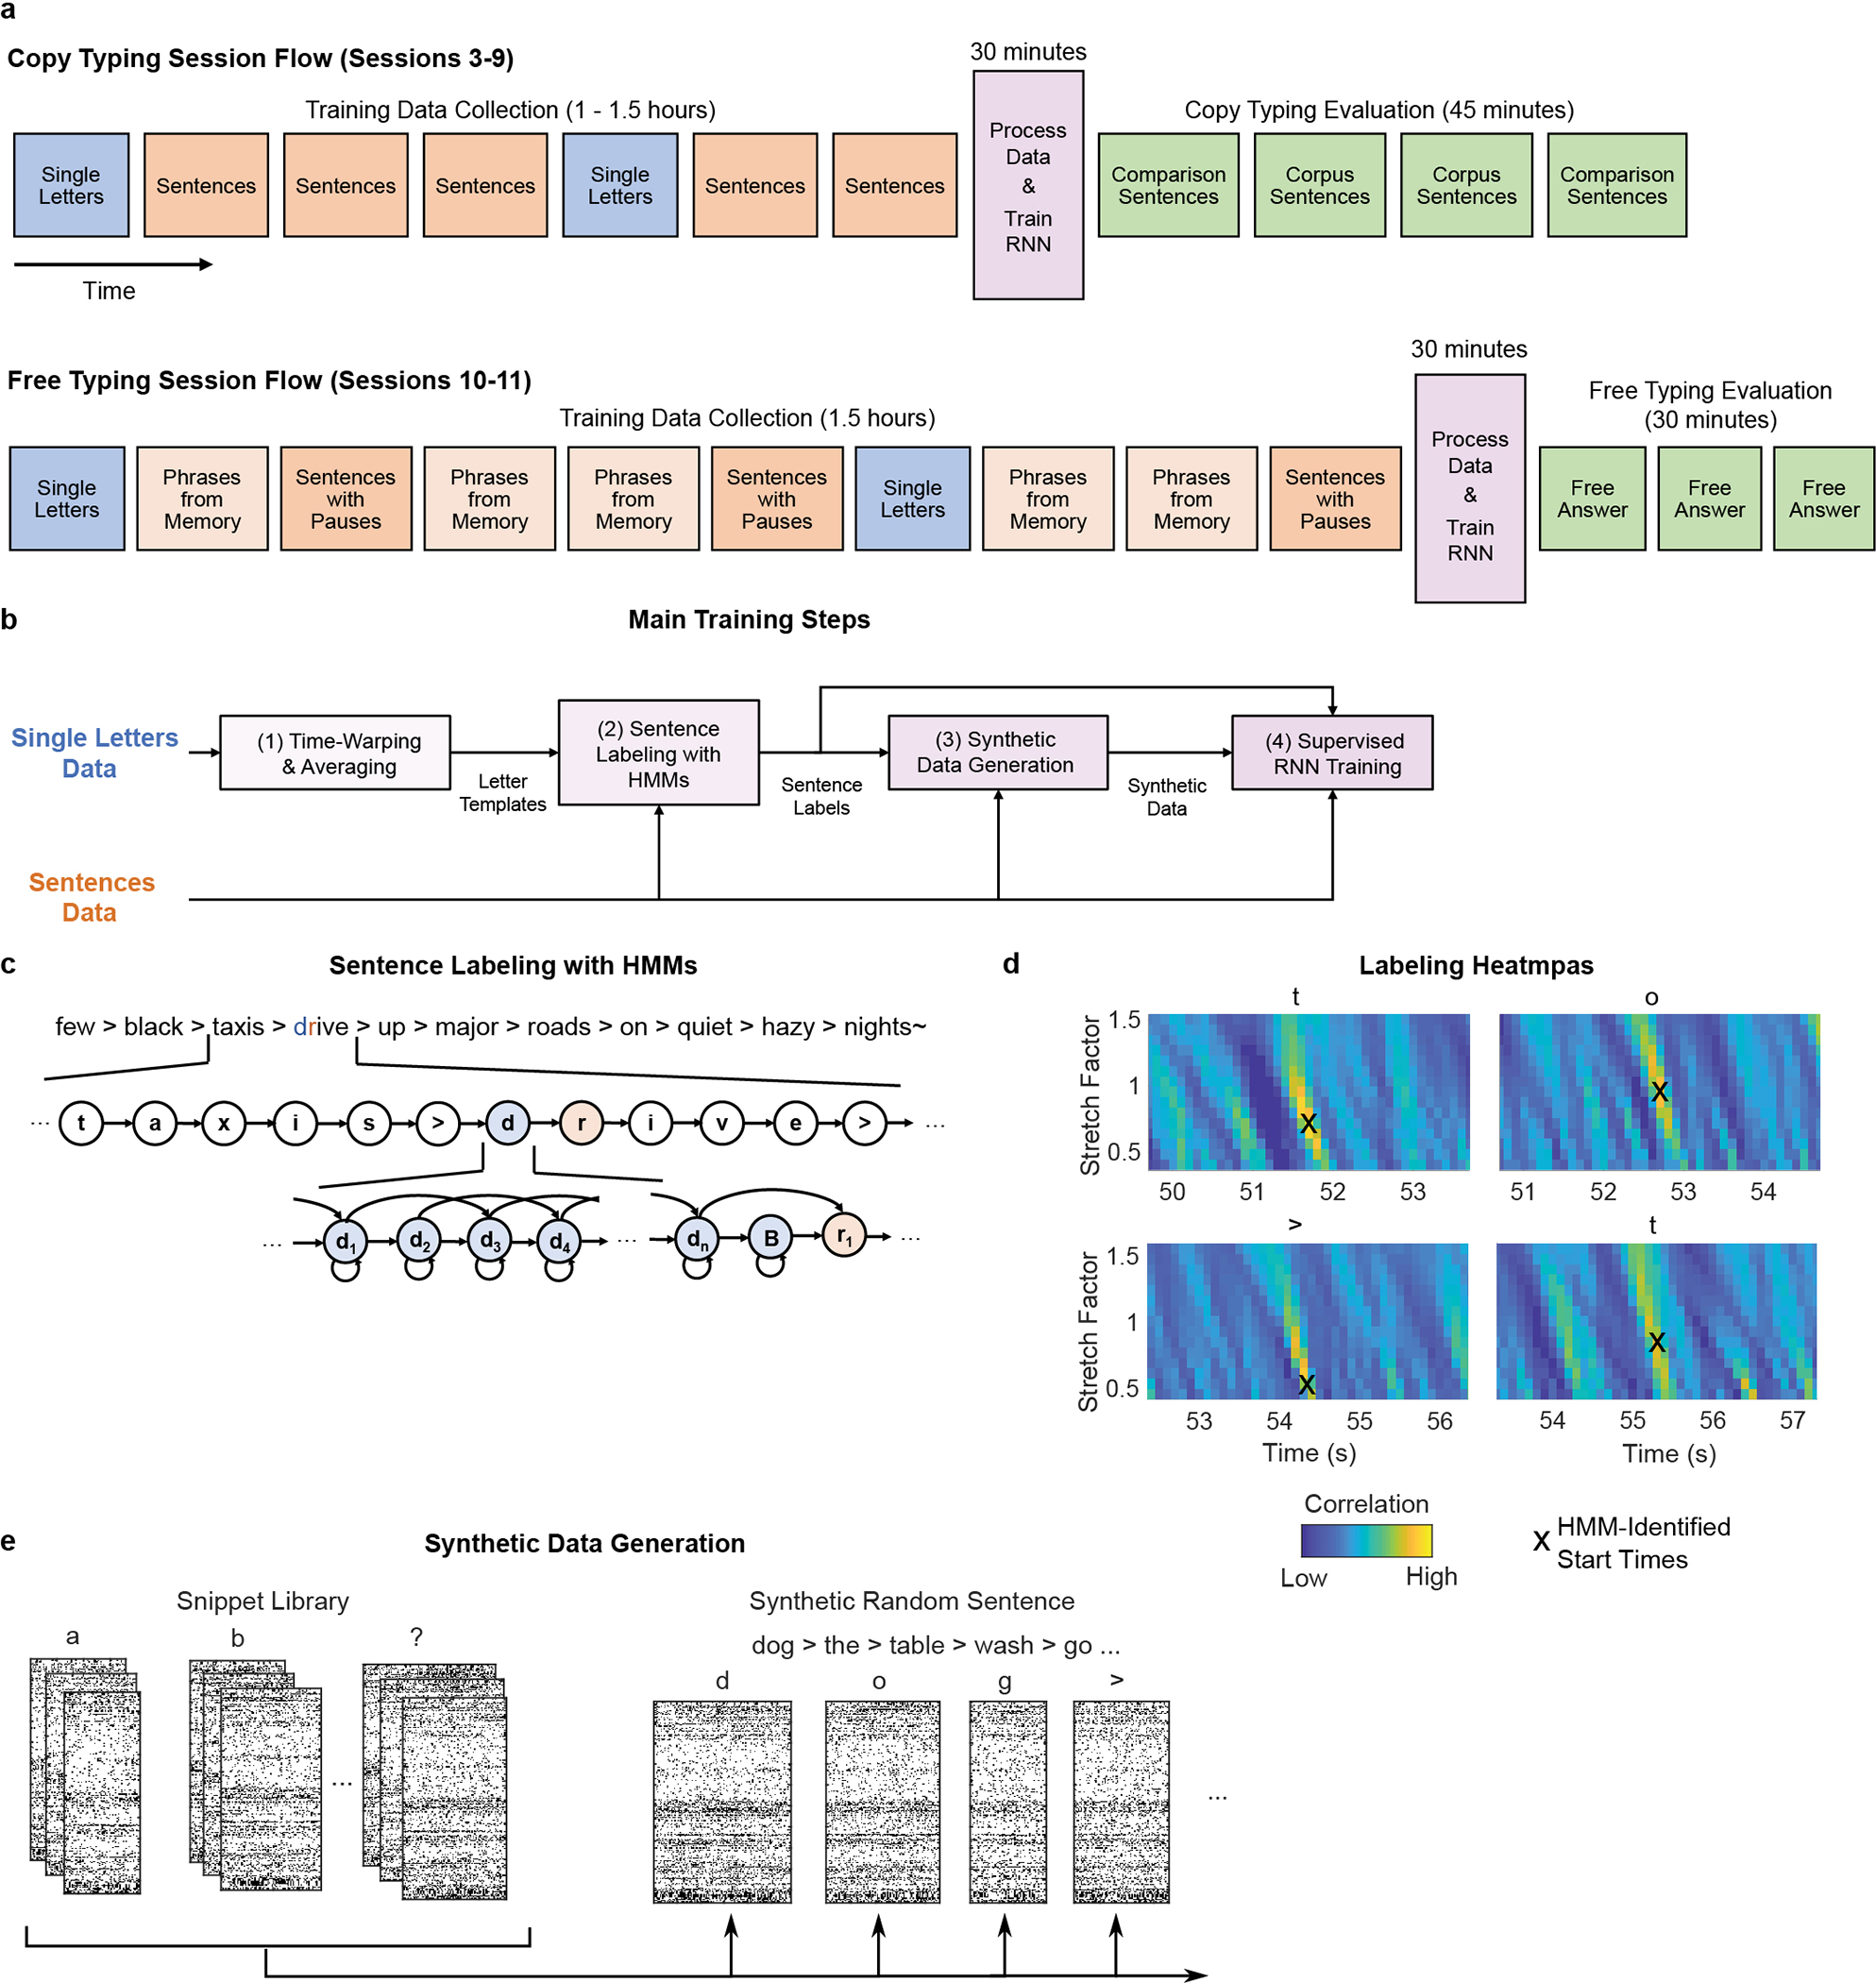
a, Diagram of the session flow for copy typing and free typing sessions (each rectangle corresponds to one block of data). First, single letter and sentences training data is collected (blue and red blocks). Next, the RNN is trained using the newly collected data plus all previous days’ data (purple block). Finally, the RNN is held fixed and evaluated (green blocks). b, Diagram of the data processing and RNN training process (purple block in a). First, the single letter data is time-warped and averaged to create spatiotemporal templates of neural activity for each character. These templates are used to initialize the hidden Markov models (HMMs) for sentence labeling. After labeling, the observed data is cut apart and rearranged into new sequences of characters to make synthetic sentences. Finally, the synthetic sentences are combined with the real sentences to train the RNN. c, Diagram of a forced-alignment HMM used to label the sentence “few black taxis drive up major roads on quiet hazy nights”. The HMM states correspond to the sequence of characters in the sentence. d, The label quality can be verified with cross-correlation heatmaps made by correlating the single character neural templates with the real data. The HMM-identified character start times form clear hotspots on the heatmaps. Note that these heatmaps are depicted only to qualitatively show label quality and aren’t used for training (only the character start times are needed to generate the targets for RNN training). e, To generate new synthetic sentences, the neural data corresponding to each labeled character in the real data is cut out of the data stream and put into a snippet library. These snippets are then pulled from the library at random, stretched/compressed in time by up to 30% (to add more artificial timing variability), and combined into new sentences.
Extended Data Fig. 3: The effect of key RNN parameters on performance.
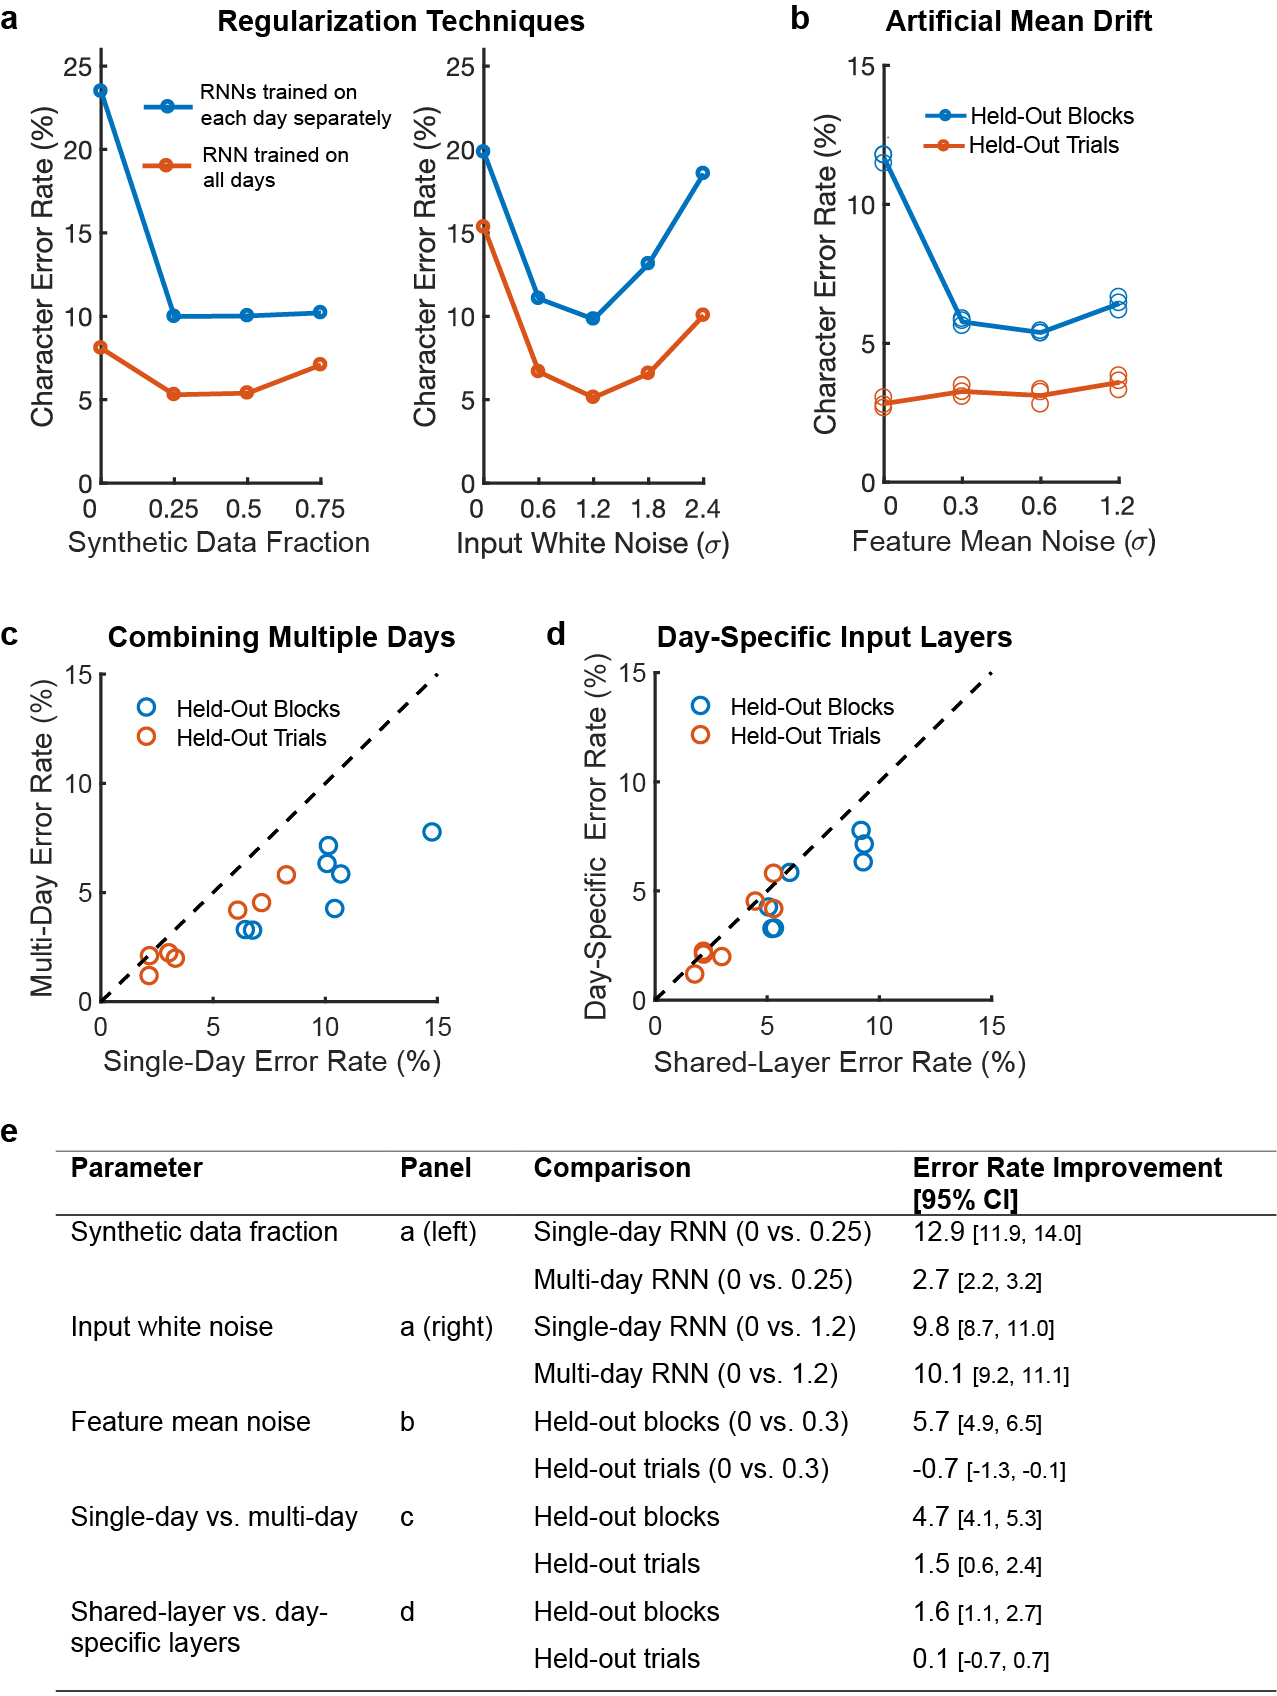
a, Training with synthetic data (left) and artificial white noise added to the inputs (right) were both essential for high performance. Data are shown from a grid search over both parameters, and lines show performance at the best value for the other parameter. Results indicate that both parameters are needed for high performance, even when the other is at the best value. Using synthetic data is more important when the dataset size is highly limited, as is the case when training on only a single day of data (blue line). Note that the inputs given to the RNN were z-scored, so the input white noise is in units of standard deviations of the input features. b, Artificial noise added to the feature means (random offsets and slow changes in the baseline firing rate) greatly improves the RNN’s ability to generalize to new blocks of data that occur later in the session, but does not help the RNN to generalize to new trials within blocks of data that it was already trained on. This is because feature means change slowly over time. For each parameter setting, three separate RNNs were trained (circles); results show low variability across RNN training runs. c, Training an RNN with all of the datasets combined improves performance relative to training on each day separately. Each circle shows the performance on one of seven days. d, Using separate input layers for each day is better than using a single layer across all days. e, Improvements in character error rates are summarized for each parameter. 95% confidence intervals were computed with bootstrap resampling of single trials (N=10,000). As shown in the table, all parameters show a statistically significant improvement for at least one condition (confidence intervals do not intersect zero).
Extended Data Fig. 4: Changes in neural recordings across days.
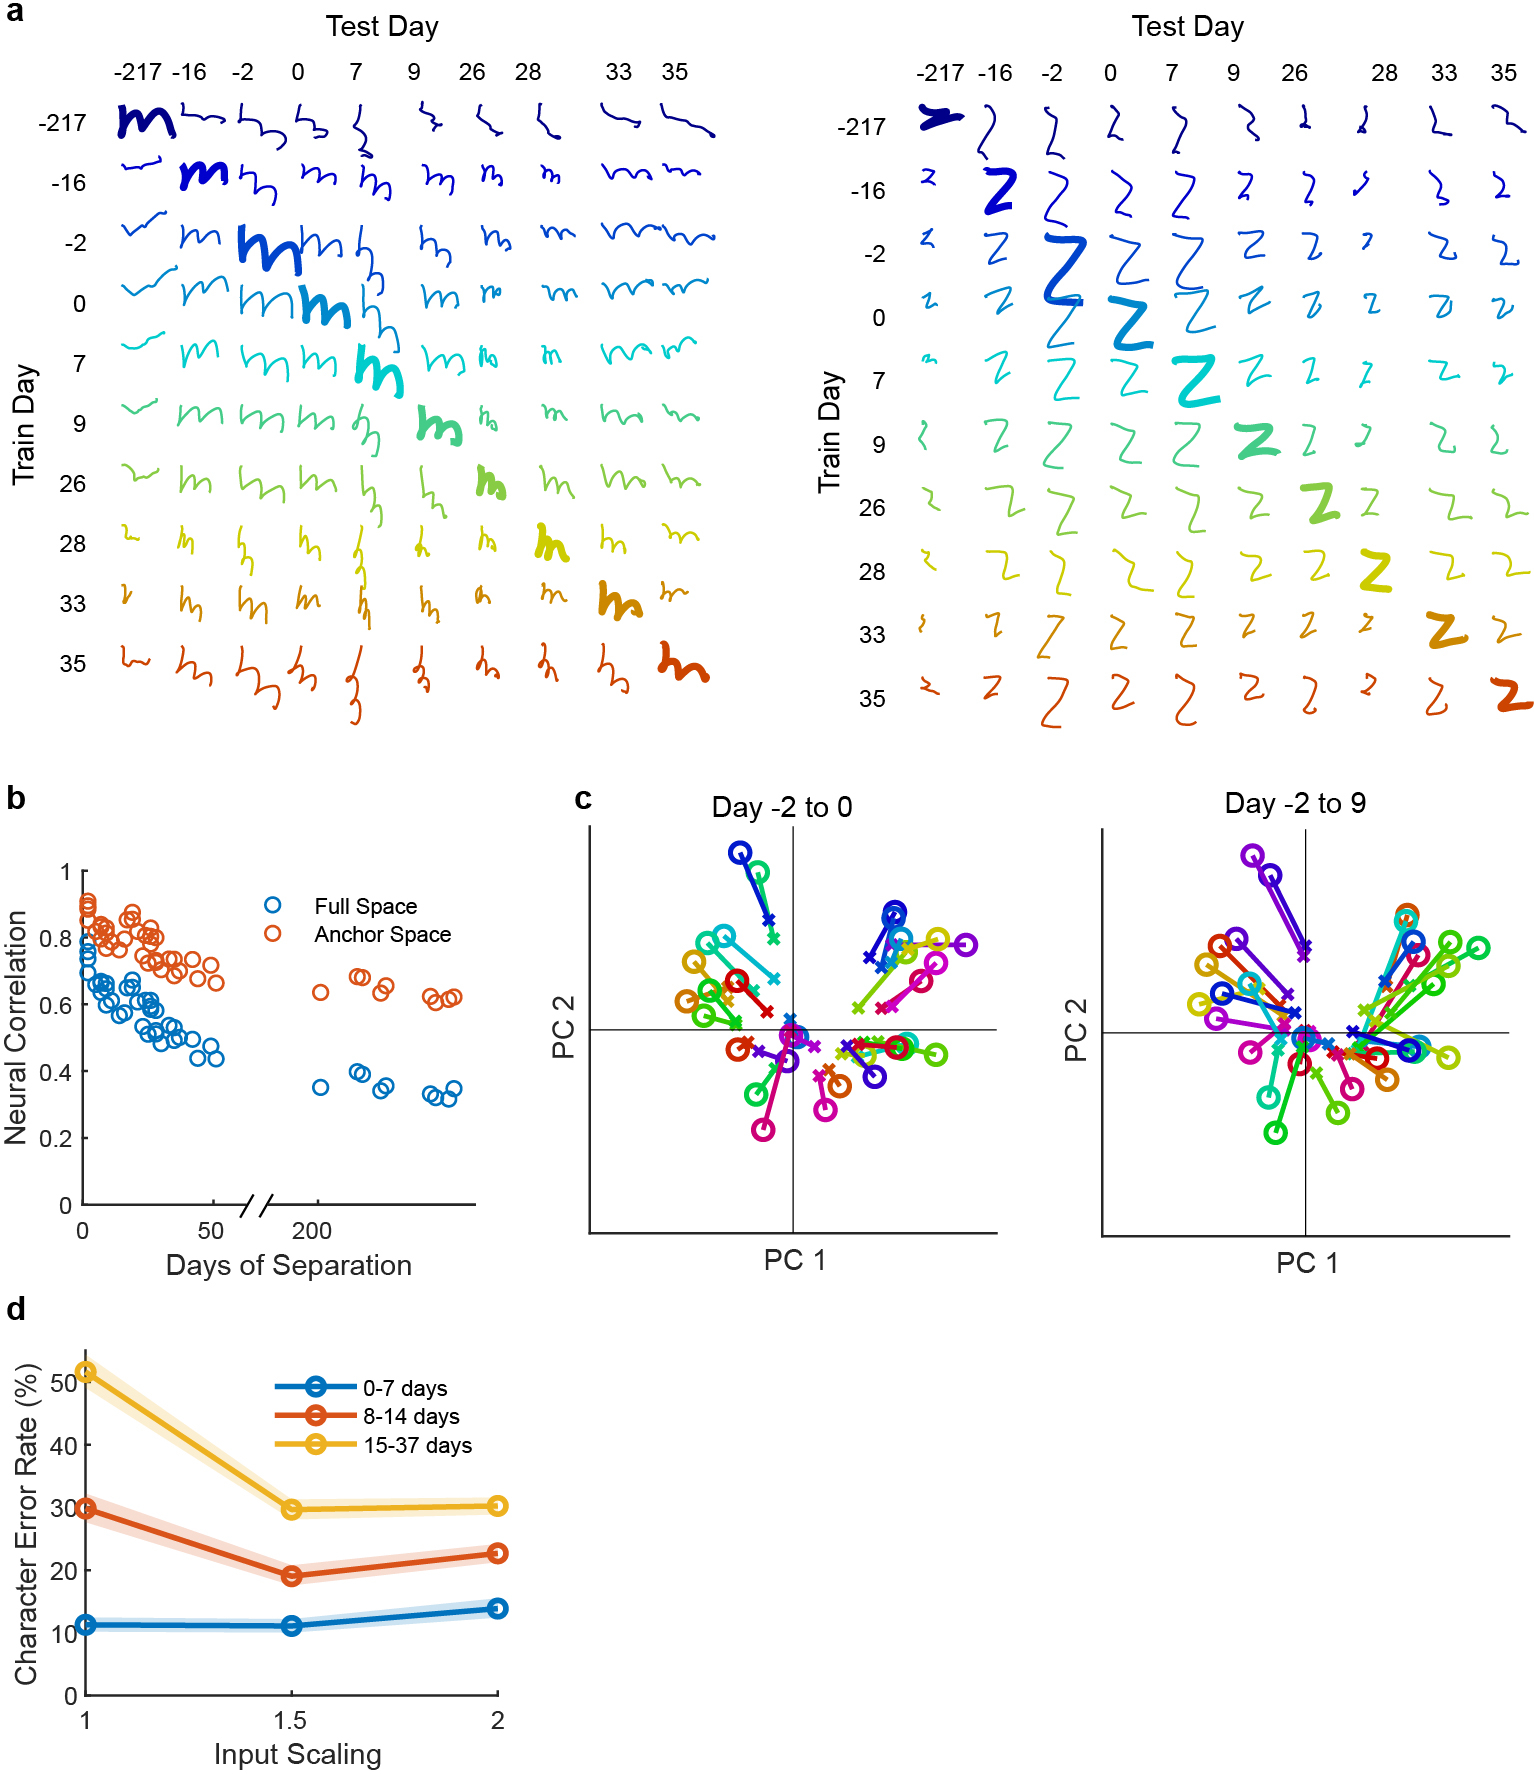
a, To visualize how much the neural recordings changed across time, decoded pen tip trajectories were plotted for two example letters (“m” and “z”) for all ten days of data (columns), using decoders trained on all other days (rows). Each session is labeled according to the number of days passed relative to Dec. 9, 2019 (day #4). Results show that although neural activity patterns clearly change over time, their essential structure is largely conserved (since decoders trained on past days transfer readily to future days). b, The correlation (Pearson’s r) between each session’s neural activity patterns was computed for each pair of sessions and plotted as a function of the number of days separating each pair. Blue circles show the correlation computed in the full neural space (all 192 electrodes) while red circles show the correlation in the “anchor” space (top 10 principal components of the earlier session). High values indicate a high similarity in how characters are neurally encoded across days. The fact that correlations are higher in the anchor space suggests that the structure of the neural patterns stays largely the same as it slowly rotates into a new space, causing shrinkage in the original space but little change in structure. c, A visualization of how each character’s neural representation changes over time, as viewed through the top two PCs of the original “anchor” space. Each “o” represents the neural activity pattern for a single character, and each “x” shows that same character on a later day (lines connect matching characters). The left panel shows a pair of sessions with only two days between them (“Day −2 to 0”), while the right panel shows a pair of sessions with 11 days between them (“Day −2 to 9”). The relative positioning of the neural patterns remains similar across days, but most conditions shrink noticeably towards the origin. This is consistent with the neural representations slowly rotating out of the original space into a new space, and suggests that scaling-up the input features may help a decoder to transfer more accurately to a future session (by counteracting this shrinkage effect). d, Similar to Fig. 3b, copy typing data from eight sessions was used to assess offline whether scaling-up the decoder inputs improves performance when evaluating the decoder on a future session (when no decoder retraining is employed). All session pairs (X, Y) were considered. Decoders were first initialized using all data from session X and earlier, then evaluated on session Y under different input scaling factors (e.g., an input scale of 1.5 means that input features were scaled up by 50%). Lines indicate the average raw character error rate and shaded regions show 95% CIs. Results show that when long periods of time pass between sessions, input-scaling improves performance. We therefore used an input scaling factor of 1.5 when assessing decoder performance in the “no retraining” conditions of Fig. 3.
Extended Data Fig. 5: Effect of correlated noise on the toy model of temporal dimensionality (see Supplemental Note 1 for a detailed interpretation of this figure).
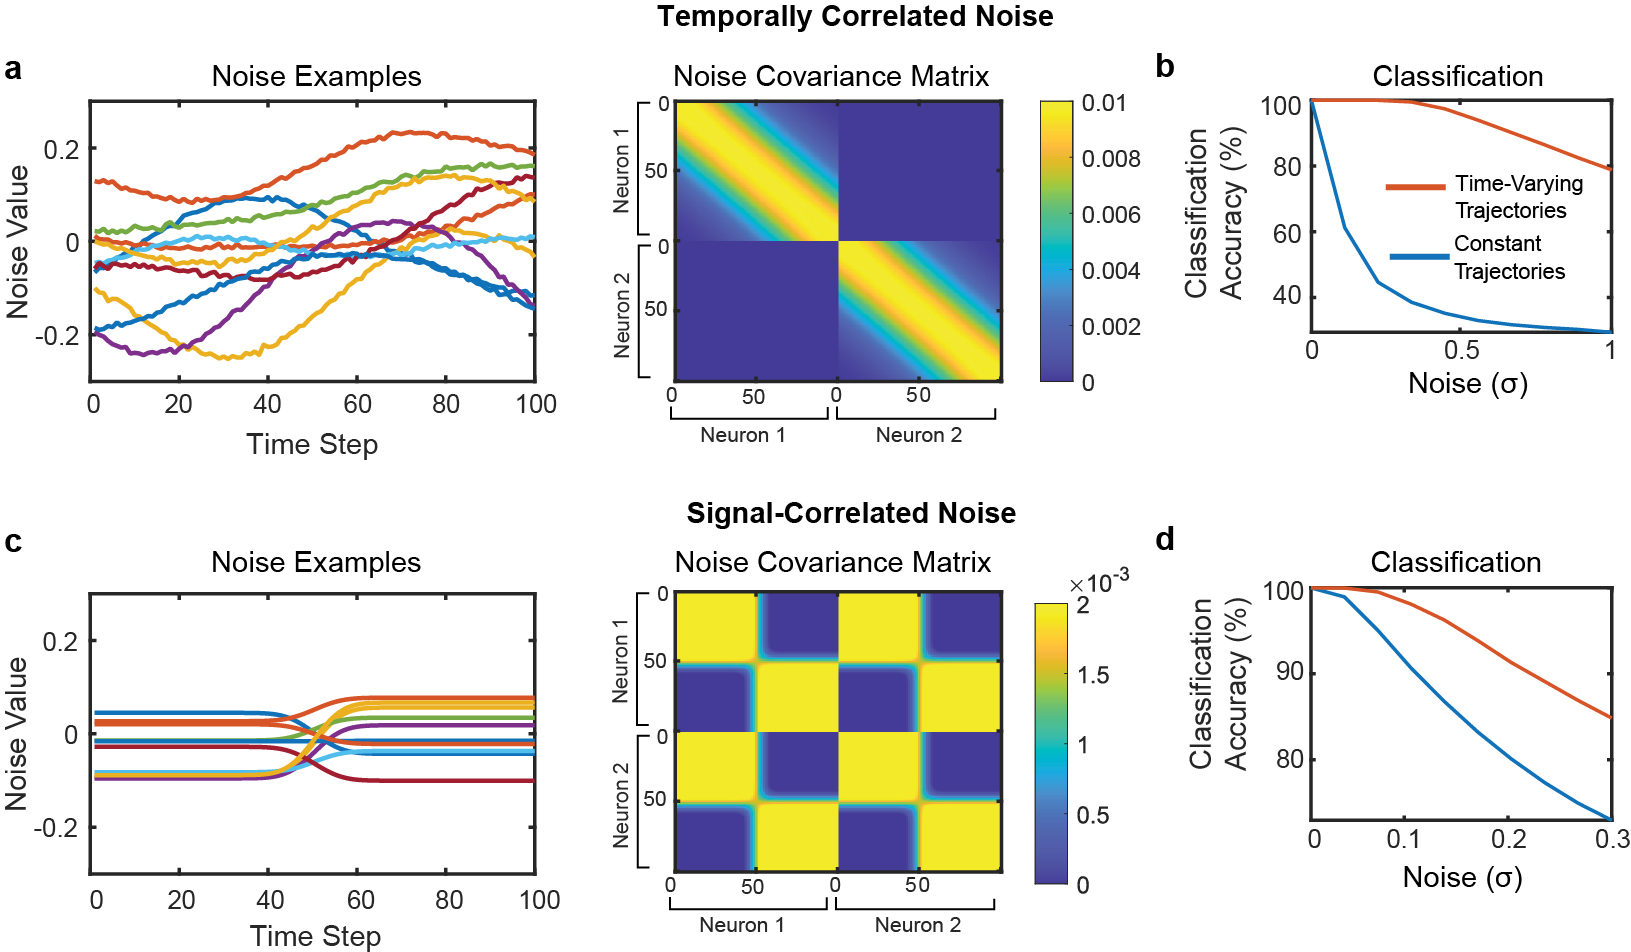
a, Example noise vectors and covariance matrix for temporally correlated noise. On the left, example noise vectors are plotted (each line depicts a single example). Noise vectors are shown for all 100 time steps of neuron 1. On the right, the covariance matrix used to generate temporally correlated noise is plotted (dimensions = 200 × 200). The first 100 time steps describe neuron 1’s noise and the last 100 time steps describe neuron 2’s noise. The diagonal band creates noise that is temporally correlated within each simulated neuron (but the two neurons are uncorrelated with each other). b, Classification accuracy when using a maximum likelihood classifier to classify between all four possible trajectories in the presence of temporally correlated noise. Even in the presence of temporally correlated noise, the time-varying trajectories are still much easier to classify. c, Example noise vectors and noise covariance matrix for noise that is correlated with the signal (i.e., noise that is concentrated only in spatiotemporal dimensions that span the class means). Unlike the temporally correlated noise, this covariance matrix generates spatiotemporal noise that has correlations between time steps and neurons. d, Classification accuracy in the presence of signal-correlated noise. Again, time-varying trajectories are easier to classify than constant trajectories.
Extended Data Fig. 6: An artificial alphabet optimized to maximize neural decodability.
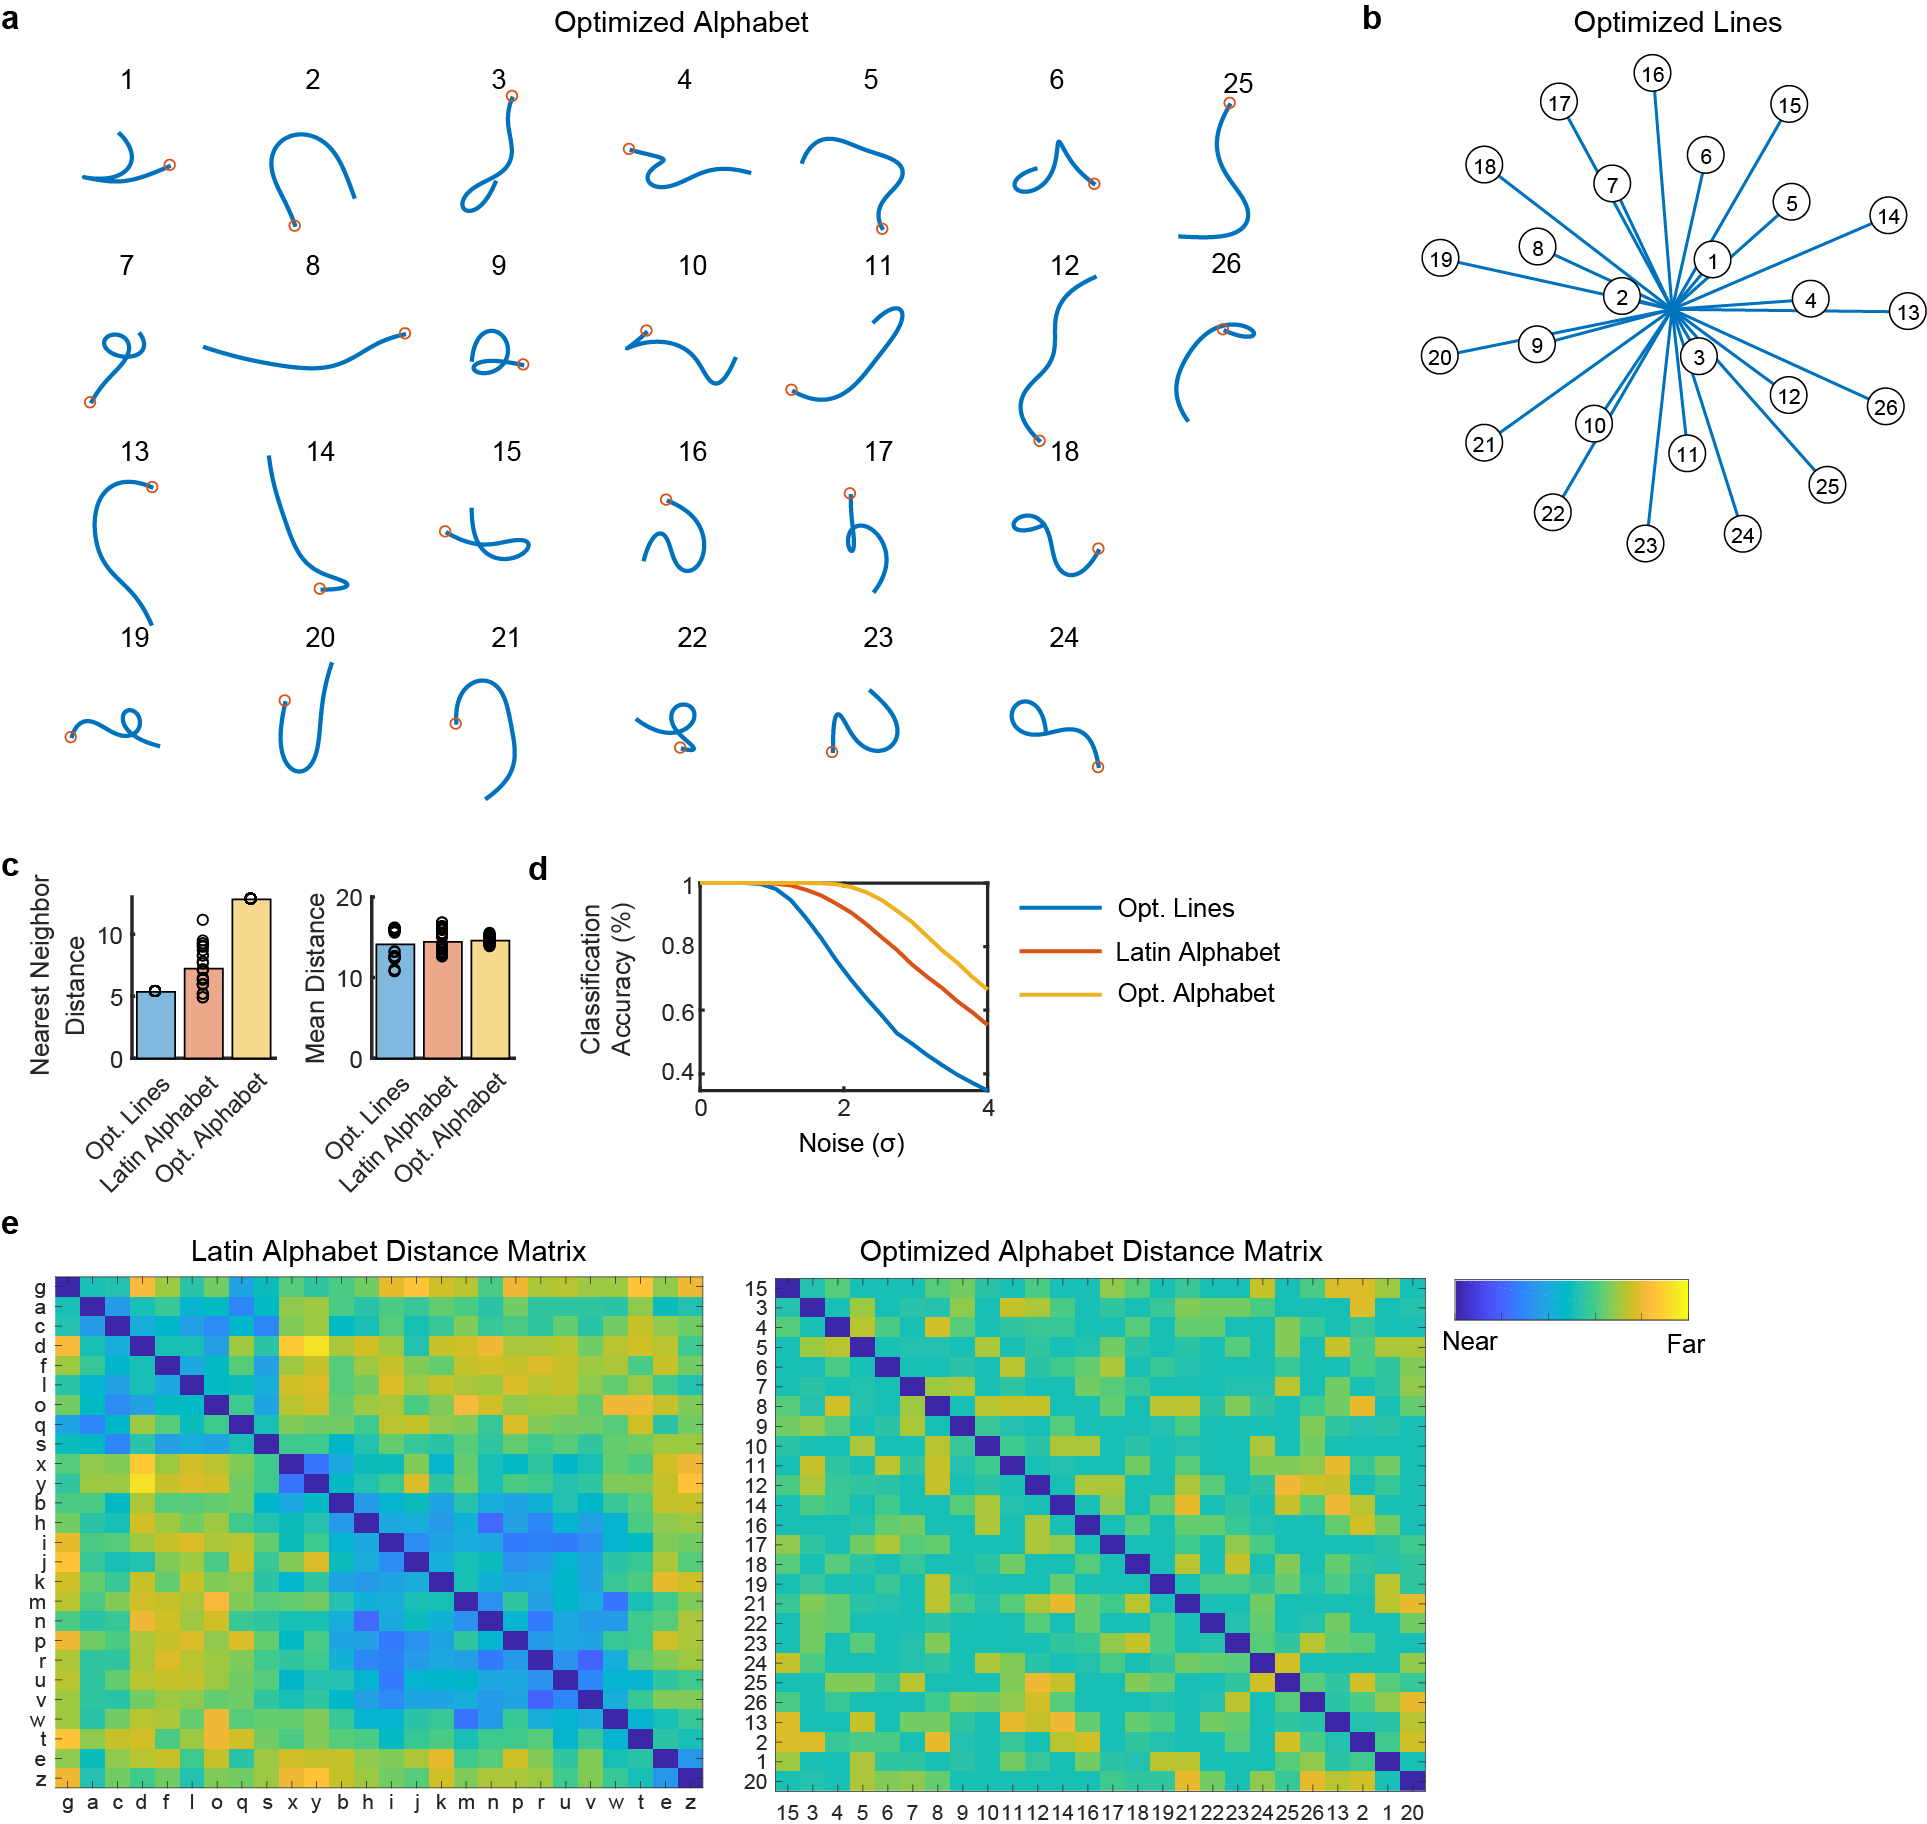
(A) Using the principle of maximizing the nearest neighbor distance, we optimized for a set of pen trajectories that are theoretically easier to classify than the Latin alphabet (using standard assumptions of linear neural tuning to pen tip velocity). (B) For comparison, we also optimized a set of 26 straight lines that maximize the nearest neighbor distance. (C) Pairwise Euclidean distances between pen tip trajectories were computed for each set, revealing a larger nearest neighbor distance (but not mean distance) for the optimized alphabet as compared to the Latin alphabet. Each circle represents a single movement and bar heights show the mean. (D) Simulated classification accuracy as a function of the amount of artificial noise added. Results confirm that the optimized alphabet is indeed easier to classify than the Latin alphabet, and that the Latin alphabet is much easier to classify than straight lines, even when the lines have been optimized. (E) Distance matrices for the Latin alphabet and optimized alphabets show the pairwise Euclidean distances between the pen trajectories. The distance matrices were sorted into 7 clusters using single-linkage hierarchical clustering. The distance matrix for the optimized alphabet has no apparent structure; in contrast, the Latin alphabet has two large clusters of similar letters (letters that begin with a counter-clockwise curl, and letters that begin with a down stroke).
Extended Data Fig. 7: Example spiking activity recorded from each microelectrode array.
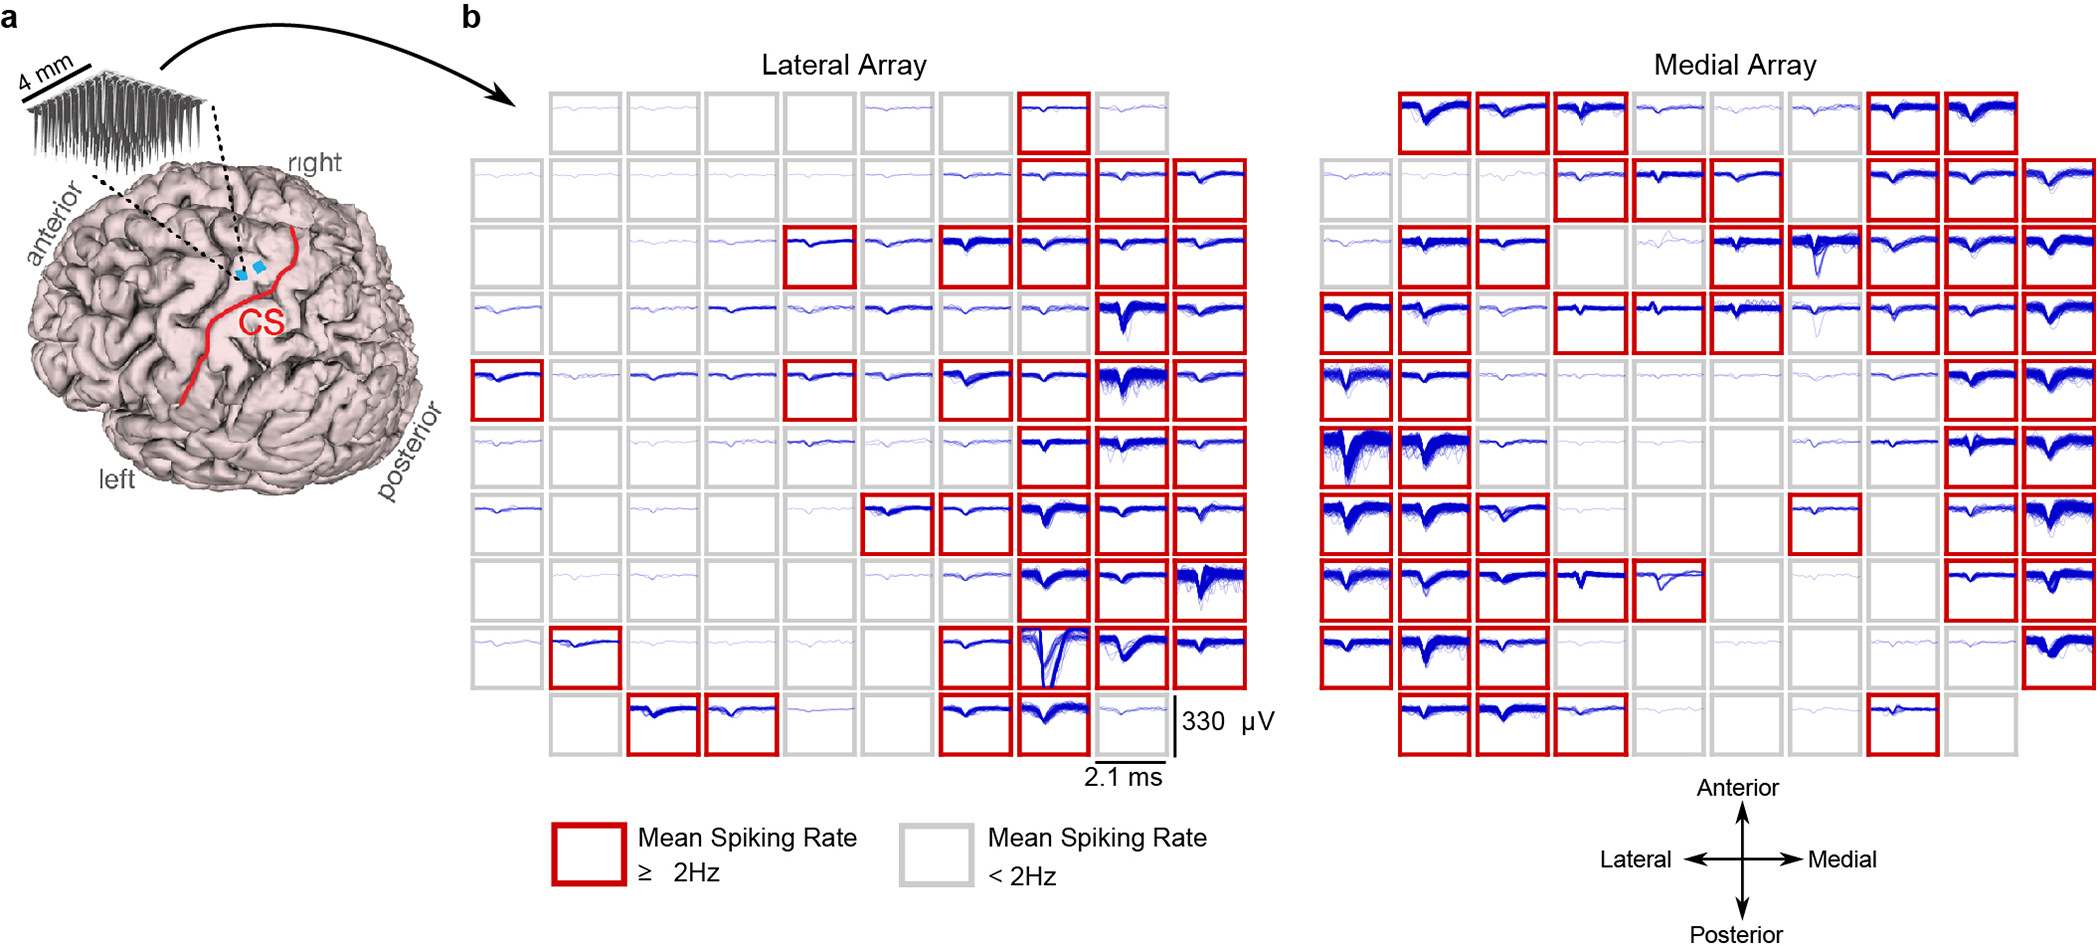
(A) Participant T5’s MRI-derived brain anatomy. Microelectrode array locations (blue squares) were determined by co-registration of postoperative CT images with preoperative MRI images. (B) Example spike waveforms detected during a ten second time window are plotted for each electrode (data were recorded on post-implant day 1218). Each rectangular panel corresponds to a single electrode and each blue trace is a single spike waveform (2.1 millisecond duration). Spiking events were detected using a −4.5 RMS threshold, thereby excluding almost all background activity. Electrodes with a mean threshold crossing rate ≥ 2 Hz were considered to have ‘spiking activity’ and are outlined in red (note that this is a conservative estimate that is meant to include only spiking activity that could be from single neurons, as opposed to multiunit ‘hash’). Results show that many electrodes still record large spiking waveforms that are well above the noise floor (the y-axis of each panel spans 330 μV, while the background activity has an average RMS value of only 6.4 μV). On this day, 92 electrodes out of 192 had a threshold crossing rate ≥ 2 Hz.
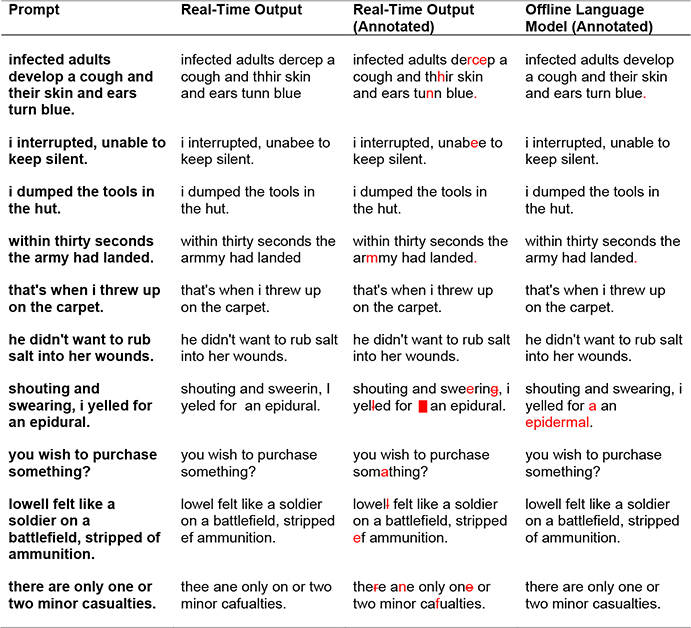
Extended Data Table 1:
Example decoded sentences for one block of copy typing. In the rightmost columns, errors are highlighted in red (extra spaces were denoted with a red square, and omitted letters were indicated with a strikethrough). Note that our language model substitutes “epidermal” for “epidural”, since “epidural” is out of vocabulary. The mean characters per minute for this block was 86.47 and the character error rates were 4.18% (real-time output) and 1.22% (language model). Sentence prompts were taken from the BNC corpus according to a random selection process (see Supplementary Methods for details).
 |
Extended Data Table 2:
Example decoded sentences for one block of free typing. In the rightmost columns, errors are highlighted in red (omitted letters were indicated with a strikethrough). Note that our language model substitutes “salt fish” for “sailfish”, since “sailfish” is out of vocabulary. The mean characters per minute for this block was 73.8 and the estimated character error rates were 6.82% (real-time output) and 1.14% (language model).
 |
Supplementary Material
Acknowledgements
We thank participant T5 and his caregivers for their dedicated contributions to this research, and N. Lam, E. Siauciunas, and B. Davis for administrative support. This work was supported by the Howard Hughes Medical Institute (F.R.W. and D.T.A.), Office of Research and Development, Rehabilitation R&D Service, U.S. Department of Veterans Affairs (A2295R, N2864C); NIH: National Institute of Neurological Disorders and Stroke and BRAIN Initiative (UH2NS095548), National Institute on Deafness and Other Communication Disorders (R01DC009899, U01DC017844) (L.R.H.); NIDCD R01-DC014034, NIDCD U01-DC017844, NINDS UH2-NS095548, NINDS U01-NS098968, Larry and Pamela Garlick, Samuel and Betsy Reeves, Wu Tsai Neurosciences Institute at Stanford (J.M.H and K.V.S); Simons Foundation Collaboration on the Global Brain 543045 and Howard Hughes Medical Institute Investigator (K.V.S). The funders had no role in study design, data collection and interpretation, or the decision to submit the work for publication.
Competing Interests
The MGH Translational Research Center has a clinical research support agreement with Neuralink, Paradromics, and Synchron, for which LRH provides consultative input. JMH is a consultant for Neuralink Corp and Proteus Biomedical, and serves on the Medical Advisory Board of Enspire DBS. KVS consults for Neuralink Corp. and CTRL-Labs Inc. (part of Facebook Reality Labs) and is on the scientific advisory boards of MIND-X Inc., Inscopix Inc., and Heal Inc. FRW, JMH, and KVS are inventors on patent application US 2021/0064135 A1 (the applicant is Stanford University), which covers the neural decoding approach taken in this work. All other authors have no competing interests.
Footnotes
Additional Information
Supplementary Information is available for this paper. Reprints and permissions information is available at www.nature.com/reprints.
Data Availability Statement
All neural data needed to reproduce the findings in this study are publicly available at the Dryad repository (https://doi.org/10.5061/dryad.wh70rxwmv). The dataset contains neural activity recorded during attempted handwriting of 1,000 sentences (43.5k characters) over 10.7 hours.
Code Availability Statement
Code that implements an offline reproduction of the central findings in this study (high-performance neural decoding with an RNN) is publicly available on GitHub at https://github.com/fwillett/handwritingBCI.
References
- 1.Hochberg LR et al. Reach and grasp by people with tetraplegia using a neurally controlled robotic arm. Nature 485, 372–375 (2012). [DOI] [PMC free article] [PubMed] [Google Scholar]
- 2.Collinger JL et al. High-performance neuroprosthetic control by an individual with tetraplegia. The Lancet 381, 557–564 (2013). [DOI] [PMC free article] [PubMed] [Google Scholar]
- 3.Aflalo T et al. Decoding motor imagery from the posterior parietal cortex of a tetraplegic human. Science 348, 906–910 (2015). [DOI] [PMC free article] [PubMed] [Google Scholar]
- 4.Bouton CE et al. Restoring cortical control of functional movement in a human with quadriplegia. Nature 533, 247–250 (2016). [DOI] [PubMed] [Google Scholar]
- 5.Ajiboye AB et al. Restoration of reaching and grasping movements through brain-controlled muscle stimulation in a person with tetraplegia: a proof-of-concept demonstration. The Lancet 389, 1821–1830 (2017). [DOI] [PMC free article] [PubMed] [Google Scholar]
- 6.Jarosiewicz B et al. Virtual typing by people with tetraplegia using a self-calibrating intracortical brain-computer interface. Science Translational Medicine 7, 313ra179–313ra179 (2015). [DOI] [PMC free article] [PubMed] [Google Scholar]
- 7.Pandarinath C et al. High performance communication by people with paralysis using an intracortical brain-computer interface. eLife 6, e18554 (2017). [DOI] [PMC free article] [PubMed] [Google Scholar]
- 8.Palin K, Feit AM, Kim S, Kristensson PO & Oulasvirta A How do People Type on Mobile Devices? Observations from a Study with 37,000 Volunteers. in Proceedings of the 21st International Conference on Human-Computer Interaction with Mobile Devices and Services 1–12 (Association for Computing Machinery, 2019). doi: 10.1145/3338286.3340120. [DOI] [Google Scholar]
- 9.Yousry TA et al. Localization of the motor hand area to a knob on the precentral gyrus. A new landmark. Brain 120, 141–157 (1997). [DOI] [PubMed] [Google Scholar]
- 10.Willett FR et al. Hand Knob Area of Premotor Cortex Represents the Whole Body in a Compositional Way. Cell (2020) doi: 10.1016/j.cell.2020.02.043. [DOI] [PMC free article] [PubMed] [Google Scholar]
- 11.Williams AH et al. Discovering Precise Temporal Patterns in Large-Scale Neural Recordings through Robust and Interpretable Time Warping. Neuron 105, 246–259.e8 (2020). [DOI] [PMC free article] [PubMed] [Google Scholar]
- 12.Hinton G et al. Deep Neural Networks for Acoustic Modeling in Speech Recognition: The Shared Views of Four Research Groups. IEEE Signal Processing Magazine 29, 82–97 (2012). [Google Scholar]
- 13.Graves A, Mohamed A & Hinton G Speech recognition with deep recurrent neural networks. in 2013 IEEE International Conference on Acoustics, Speech and Signal Processing 6645–6649 (2013). doi: 10.1109/ICASSP.2013.6638947. [DOI] [Google Scholar]
- 14.Xiong W et al. The Microsoft 2017 Conversational Speech Recognition System. arXiv:1708.06073 [cs] (2017). [Google Scholar]
- 15.He Y et al. Streaming End-to-end Speech Recognition for Mobile Devices. in ICASSP 2019 – 2019 IEEE International Conference on Acoustics, Speech and Signal Processing (ICASSP) 6381–6385 (2019). doi: 10.1109/ICASSP.2019.8682336. [DOI] [Google Scholar]
- 16.Anumanchipalli GK, Chartier J & Chang EF Speech synthesis from neural decoding of spoken sentences. Nature 568, 493–498 (2019). [DOI] [PMC free article] [PubMed] [Google Scholar]
- 17.Makin JG, Moses DA & Chang EF Machine translation of cortical activity to text with an encoder–decoder framework. Nature Neuroscience 1–8 (2020) doi: 10.1038/s41593-020-0608-8. [DOI] [PMC free article] [PubMed] [Google Scholar]
- 18.Chen X et al. High-speed spelling with a noninvasive brain–computer interface. Proc Natl Acad Sci U S A 112, E6058–E6067 (2015). [DOI] [PMC free article] [PubMed] [Google Scholar]
- 19.Dickey AS, Suminski A, Amit Y & Hatsopoulos NG Single-Unit Stability Using Chronically Implanted Multielectrode Arrays. J Neurophysiol 102, 1331–1339 (2009). [DOI] [PMC free article] [PubMed] [Google Scholar]
- 20.Eleryan A et al. Tracking single units in chronic, large scale, neural recordings for brain machine interface applications. Front. Neuroeng. 7, (2014). [DOI] [PMC free article] [PubMed] [Google Scholar]
- 21.Downey JE, Schwed N, Chase SM, Schwartz AB & Collinger JL Intracortical recording stability in human brain–computer interface users. J. Neural Eng. 15, 046016 (2018). [DOI] [PubMed] [Google Scholar]
- 22.Willett FR et al. Signal-independent noise in intracortical brain–computer interfaces causes movement time properties inconsistent with Fitts’ law. J. Neural Eng. 14, 026010 (2017). [DOI] [PMC free article] [PubMed] [Google Scholar]
- 23.Gao P et al. A theory of multineuronal dimensionality, dynamics and measurement. bioRxiv 214262 (2017) doi: 10.1101/214262. [DOI] [Google Scholar]
- 24.Musallam S, Corneil BD, Greger B, Scherberger H & Andersen RA Cognitive Control Signals for Neural Prosthetics. Science 305, 258–262 (2004). [DOI] [PubMed] [Google Scholar]
- 25.Santhanam G, Ryu SI, Yu BM, Afshar A & Shenoy KV A high-performance brain–computer interface. Nature 442, 195–198 (2006). [DOI] [PubMed] [Google Scholar]
- 26.Cunningham JP, Yu BM, Gilja V, Ryu SI & Shenoy KV Toward optimal target placement for neural prosthetic devices. J. Neurophysiol. 100, 3445–3457 (2008). [DOI] [PMC free article] [PubMed] [Google Scholar]
- 27.Pels EGM, Aarnoutse EJ, Ramsey NF & Vansteensel MJ Estimated Prevalence of the Target Population for Brain-Computer Interface Neurotechnology in the Netherlands. Neurorehabil Neural Repair 31, 677–685 (2017). [DOI] [PMC free article] [PubMed] [Google Scholar]
- 28.Vansteensel MJ et al. Fully Implanted Brain–Computer Interface in a Locked-In Patient with ALS. New England Journal of Medicine 375, 2060–2066 (2016). [DOI] [PMC free article] [PubMed] [Google Scholar]
- 29.Nijboer F et al. A P300-based brain–computer interface for people with amyotrophic lateral sclerosis. Clinical Neurophysiology 119, 1909–1916 (2008). [DOI] [PMC free article] [PubMed] [Google Scholar]
- 30.Townsend G et al. A novel P300-based brain–computer interface stimulus presentation paradigm: Moving beyond rows and columns. Clinical Neurophysiology 121, 1109–1120 (2010). [DOI] [PMC free article] [PubMed] [Google Scholar]
- 31.McCane LM et al. P300-based brain-computer interface (BCI) event-related potentials (ERPs): People with amyotrophic lateral sclerosis (ALS) vs. age-matched controls. Clinical Neurophysiology 126, 2124–2131 (2015). [DOI] [PMC free article] [PubMed] [Google Scholar]
- 32.Wolpaw JR et al. Independent home use of a brain-computer interface by people with amyotrophic lateral sclerosis. Neurology 91, e258–e267 (2018). [DOI] [PMC free article] [PubMed] [Google Scholar]
- 33.Bacher D et al. Neural Point-and-Click Communication by a Person With Incomplete Locked-In Syndrome. Neurorehabil Neural Repair 29, 462–471 (2015). [DOI] [PMC free article] [PubMed] [Google Scholar]
- 34.Mugler EM et al. Direct classification of all American English phonemes using signals from functional speech motor cortex. J. Neural Eng. 11, 035015 (2014). [DOI] [PMC free article] [PubMed] [Google Scholar]
- 35.Nurmikko A Challenges for Large-Scale Cortical Interfaces. Neuron 108, 259–269 (2020). [DOI] [PubMed] [Google Scholar]
- 36.Vázquez-Guardado A, Yang Y, Bandodkar AJ & Rogers JA Recent advances in neurotechnologies with broad potential for neuroscience research. Nat Neurosci 23, 1522–1536 (2020). [DOI] [PubMed] [Google Scholar]
- 37.Simeral JD, Kim S-P, Black MJ, Donoghue JP & Hochberg LR Neural control of cursor trajectory and click by a human with tetraplegia 1000 days after implant of an intracortical microelectrode array. Journal of Neural Engineering 8, 025027 (2011). [DOI] [PMC free article] [PubMed] [Google Scholar]
- 38.Bullard AJ, Hutchison BC, Lee J, Chestek CA & Patil PG Estimating Risk for Future Intracranial, Fully Implanted, Modular Neuroprosthetic Systems: A Systematic Review of Hardware Complications in Clinical Deep Brain Stimulation and Experimental Human Intracortical Arrays. Neuromodulation: Technology at the Neural Interface 23, 411–426 (2020). [DOI] [PubMed] [Google Scholar]
- 39.Nuyujukian P et al. Cortical control of a tablet computer by people with paralysis. PLOS ONE 13, e0204566 (2018). [DOI] [PMC free article] [PubMed] [Google Scholar]
- 40.Musk E & Neuralink. An Integrated Brain-Machine Interface Platform With Thousands of Channels. Journal of Medical Internet Research 21, e16194 (2019). [DOI] [PMC free article] [PubMed] [Google Scholar]
- 41.Sahasrabuddhe K et al. The Argo: A 65,536 channel recording system for high density neural recording in vivo. bioRxiv 2020.07.17.209403 (2020) doi: 10.1101/2020.07.17.209403. [DOI] [Google Scholar]
- 42.Sussillo D, Stavisky SD, Kao JC, Ryu SI & Shenoy KV Making brain–machine interfaces robust to future neural variability. Nat Commun 7, (2016). [DOI] [PMC free article] [PubMed] [Google Scholar]
- 43.Dyer EL et al. A cryptography-based approach for movement decoding. Nature Biomedical Engineering 1, 967–976 (2017). [DOI] [PMC free article] [PubMed] [Google Scholar]
- 44.Degenhart AD et al. Stabilization of a brain–computer interface via the alignment of low-dimensional spaces of neural activity. Nature Biomedical Engineering 1–14 (2020) doi: 10.1038/s41551-020-0542-9. [DOI] [PMC free article] [PubMed] [Google Scholar]
Associated Data
This section collects any data citations, data availability statements, or supplementary materials included in this article.


