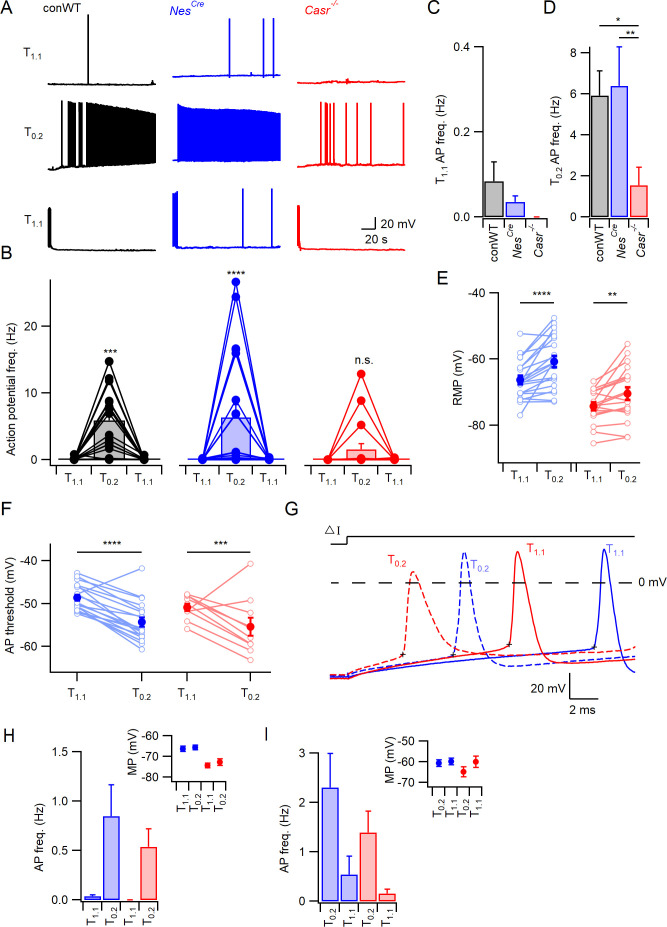
Figure 1. CaSR deletion reduces divalent-dependent excitability.
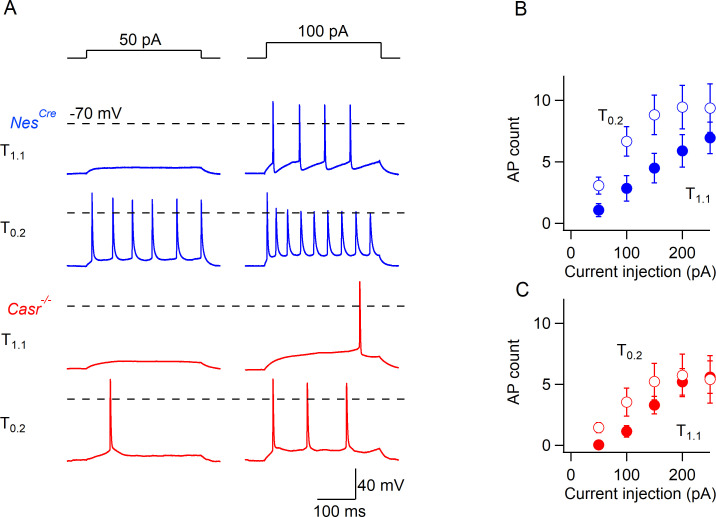
(A) Spontaneous voltage traces at RMP following the application of solutions with different divalent concentrations (T1.1 (upper traces), T0.2 (middle), and T1.1 recovery (lower)) recorded in three individual neurons with or without CaSR (conWT (black), NesCre (blue) and Casr-/- (red)). Each trace depicts 150 s of continuous acquisition. (B) Histograms of average action potential (AP) frequency (Hz) recorded using the same solutions: T1.1, T0.2, and T1.1 recovery. Individual recordings represented by open circles linked with lines and average is represented with a bar. From left to right graphs depict conWT (n = 18), NesCre (n = 21), and Casr-/- (n = 18). ANOVA: Post-hoc tests (Sidak compensated for multiple comparisons here and in all later figures) showed that action potential frequency increased in conWT (p=0.0009) and NesCre (P, 0.0001), but not Casr-/- (p=0.6697) neurons when changing from T1.1 to T0.2 (Figure 1—source data 1). (C) Baseline average action potential frequency in T1.1. was unaffected by genotype (p>0.999). (D) Average action potential frequency with T0.2 application was the same in conWT and NesCre (p=0.9831) and higher than in Casr-/- neurons (p=0.013 and 0.0033, respectively). (E) Plot of effect of external divalent concentration and CaSR on RMP. Two-way RM ANOVA indicates that increasing [Ca2+]o (F (1, 37)=31.65, p<0.0001) and CaSR deletion (F (1, 37)=19.1, p<0.0001) hyperpolarized the RMP without an interaction (F (1, 37)=1.035, p=0.3155). Post-hoc testing indicated RMP was depolarized with the switch to T0.2 in both NesCre and Casr-/-neurons (p<0.0001 and p=0.0066 for 21 and 18 recordings respectively; Figure 1—source data 1). (F) Plot of average action potential threshold in T1.1 and T0.2 in NesCre and Casr-/- neurons elicited as per panel G. Two-way RM ANOVA indicates that reducing [Ca2+]o hyperpolarized the action potential threshold (F (1, 27)=56.48, p<0.0001) but that genotype had no effect (F (1, 27)=2.284, p=0.1424). [Ca2+]o was highly effective in both NesCre and Casr-/-neurons (p<0.0001 and p=0.0003 for 19 and 10 recordings, respectively). Individual neuron values are represented by open circles linked by lines and averages by filled circles. (G) Exemplar action potentials elicited by current injection in a NesCre (blue) and a Casr-/- neuon (red) in T1.1 (unbroken) and T0.2 (broken). Action potential threshold is indicated by +for the first action potential elicited by current injection (50–200 pA) under the same conditions as panel E. (H) Histogram summarizing effects of divalents on action potential frequency in NesCre and Casr-/- neurons after a current injection to counter divalent-dependent depolarization following T0.2 application. Two-way RM ANOVA indicates that reducing [Ca2+]o increases the action potential frequency (F (1, 35)=11.54, p=0.0017) and that this is significant in the NesCre but not Casr-/-neurons (p=0.0075 and 0.1555 for 21 and 16 recordings, respectively). Inset shows average membrane potential after the current injection. (I) Histogram summarizing effects of divalents on action potential frequency in NesCre and Casr-/- neurons after current injection in T1.1 to depolarize membrane potential to value recorded in T0.2. Two-way RM ANOVA indicates that reducing [Ca2+]o increases the action potential frequency (F (1, 35)=45.09, p=0.0004) and that this is significant in the NesCre but not Casr-/-neurons (p=0.0044 and 0.056 for 21 and 16 recordings, respectively). Inset shows average membrane potential after the current injection.
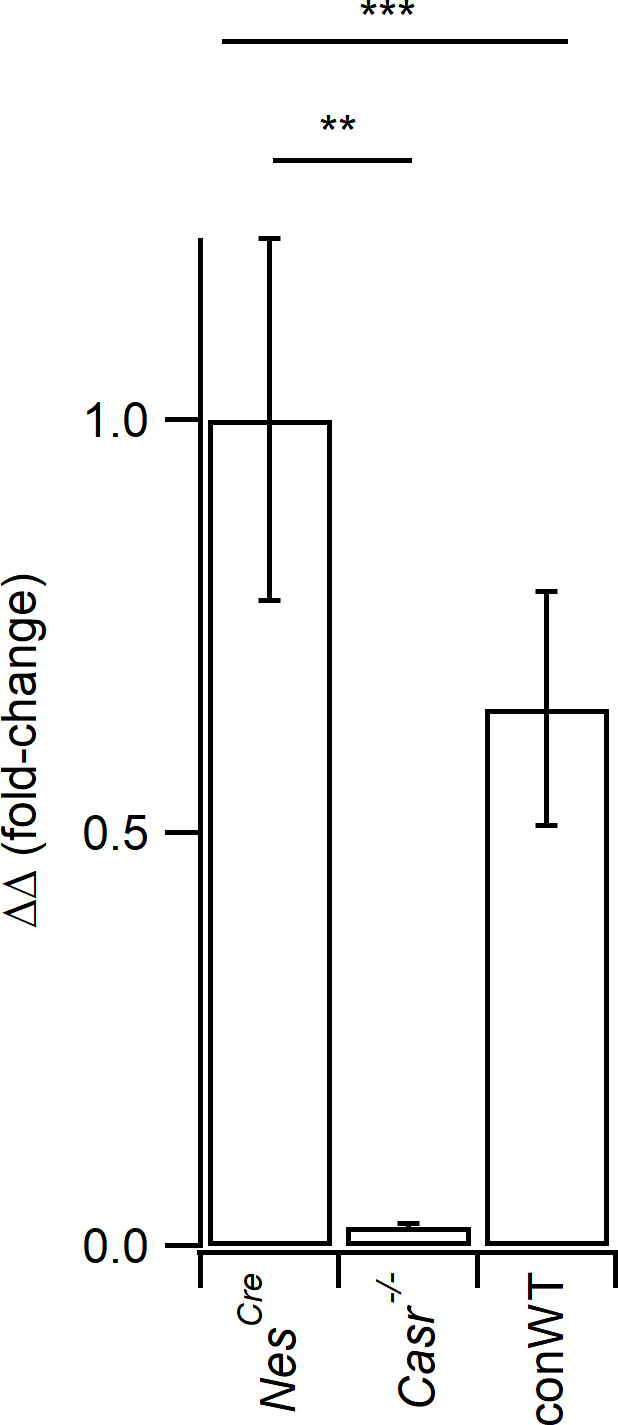
Figure 1—figure supplement 1. Casr expression levels reduced in Casr-/- neurons.


