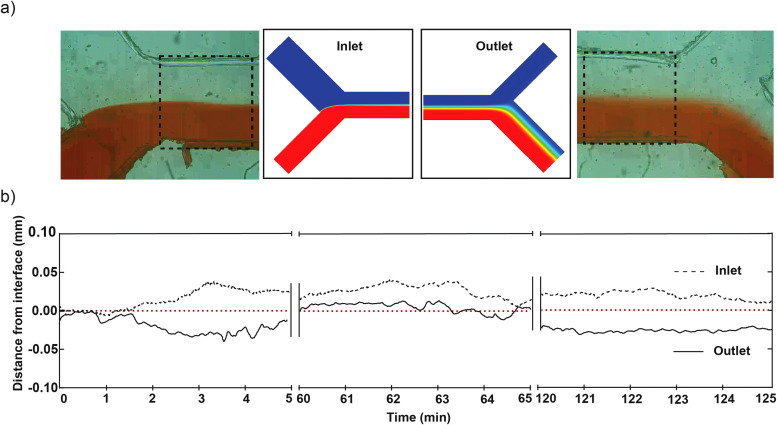
FIG. 2.
Characterization of microfluidic devices. (a) Laminar flow generated using our microfluidic device; represented by red dye (bottom) and colorless solution (water, top) streams in inlet (left) and outlet (right). Adjacent is numerical simulations for ion diffusion matched at inlet and outlet (see Fig. 4). (b) Line graph showing laminar interface fluctuation from center (0.00) over 5-min intervals to measure flow stability at 0, 60, and 120 min (plot of relative distance from interface vs time in minutes).

