Abstract
Glaucoma is a neurodegenerative disease of the visual system and is the leading cause of irreversible blindness worldwide. To date, its pathophysiological mechanisms remain unclear. This study evaluated the feasibility of advanced diffusion magnetic resonance imaging techniques for examining the microstructural environment of the visual pathway in glaucoma. While conventional diffusion tensor imaging (DTI) showed lower fractional anisotropy and higher directional diffusivities in the optic tracts of glaucoma patients than healthy controls, diffusion kurtosis imaging (DKI) and the extended white matter tract integrity (WMTI) model indicated lower radial kurtosis, higher axial and radial diffusivities in the extra-axonal space, lower axonal water fraction, and lower tortuosity in the same regions in glaucoma patients. These findings suggest glial involvements apart from compromised axonal integrity in glaucoma. In addition, DKI and WMTI but not DTI parameters significantly correlated with clinical ophthalmic measures via optical coherence tomography and visual field perimetry testing. Taken together, DKI and WMTI provided sensitive and comprehensive imaging biomarkers for quantifying glaucomatous damage in the white matter tract across clinical severity complementary to DTI.
I. Introduction
Glaucoma is the world’s leading cause of the irreversible blindness and is characterized by injury to the retinal ganglion cells and progressive vision loss [1]. While intraocular pressure is the major risk factor for the disease, recent evidence suggests that glaucoma not only affects the eye but also the brain’s visual system [2–4]. However, the cause of the disease remains unclear, partly due to limited non-invasive approaches for early detection and longitudinal monitoring of the disease in patients’ brains in a comprehensive manner.
Diffusion-weighted magnetic resonance imaging (DWI) and the related diffusion models allow non-invasive measurements of water diffusivity in the brain, and are sensitive to changes in the microstructural environment. For example, conventional diffusion tensor imaging (DTI) has been used to identify deterioration in white matter tissues [5]. DTI-derived parameters including fractional anisotropy (FA) and mean diffusivity (MD) may reflect overall microstructural integrity and averaged magnitude of diffusion of the nerve fibers, whereas the directional diffusivities such as axial diffusivity (AD) and radial diffusivity (RD) can be sensitive to disrupted axonal and myelin integrity, respectively [6]. DTI analyses consistently showed reduced FA in the visual pathways of glaucoma patients suggesting microstructural disorganization [4–5, 7]. These findings, however, showed inconsistencies in directional diffusivities probably due to small cohort size, varying clinical severity, or limitations inherent to the DTI model. One key assumption in DTI is free water diffusion, or Gaussian diffusivity, characterized by a monoexponential decay of the DWI signal over increasing diffusivity sensitization (b-value) [8]. Experiments with high b-values have shown non-Gaussian diffusivity patterns both in gray matter and white matter, presumably due to the structural complexity of the cellular environment. The departure from monoexponential signal decay observed at high b-values is accounted for in a more elaborated model known as diffusion kurtosis imaging (DKI). Image acquisition for DKI involves higher b-values (≥ 2000 s/mm2) and more gradient directions than DTI, and may offer more accurate and specific parameters in characterizing the microstructural brain environment [9].
Previous studies suggest that DKI parameters can offer better sensitivity and specificity than conventional DTI parameters and can therefore constitute useful biomarkers for human brain tissues affected by diseases [10–12]. The aim of this study was to determine the visual pathway integrity of glaucoma patients and healthy controls using both DTI and DKI models. Furthermore, an extended DKI model was used to determine compartment-specific white matter tract integrity (WMTI) in the intra-axonal space (IAS) and the extra-axonal space (EAS) of the optic tract (OT) [10]. We also investigated the correlations between diffusion MRI parameters for OT and their clinical ophthalmological exam counterparts to evaluate the feasibility of imaging a complementary indicator of disease severity in the brain.
II. Materials and Methods
A. Subjects
The experimental procedures involving human subjects were approved by the Institutional Review Board. Nine glaucoma patients (age = 65±9 years; 8 males) and 5 healthy controls (age = 65±7 years; 3 males) were recruited for an MRI study to evaluate the brain involvements in glaucoma at the Center for Biomedical Imaging at NYU Langone Health. Clinical ophthalmic assessments were obtained from the glaucoma subjects to determine eye-brain-behavior relationships across disease severity. These clinical measures included ganglion cell-inner plexiform layer (GCIPL) thickness and cup-to-disc ratio (C/D) from spectral-domain optical coherence tomography (SD-OCT); and visual field mean deviation (VF-MD) from Humphrey VF perimetry.
B. MR Imaging Acquisition
MR imaging was performed in a Siemens MAGNETOM Prisma 3T scanner equipped with a 20-channel head/neck coil. Diffusion imaging was performed at multiple shells comprising 3 b-values (250, 1000, 2000 s/mm2) along with multiple diffusion encoding directions (4, 20, 60, respectively) using echo-planar imaging. Ten non-diffusion weighted images at b = 0 s/mm2 were also acquired. Other imaging parameters included: field of view = 230×230 mm2, acquisition matrix = 100×100, voxel resolution = 2.3×2.3×2.3 mm3, number of slices = 52, repetition time = 5000 ms and echo time = 70 ms. Total acquisition time was about 10 min.
C. Image Analysis
The pre-processing steps for the diffusion images included eddy current distortion and motion correction in FSL v5.0.10 [13], as well as Marchenko-Pastur principal component analysis denoising, Gibbs ringing correction, Rician bias correction, outlier detection, and smoothing using the Diffusion parameter EStImation with Gibbs and NoisE Removal (DESIGNER) suite [14]. We then used DESIGNER to calculate maps of DTI (FA, AD, RD, MD), DKI [mean kurtosis (MK), axial kurtosis (AK), radial kurtosis (RK)] and WMTI parameters [axial IAS diffusivity (Da), axial EAS diffusivity (De,‖), radial EAS diffusivity (De,⊥), axonal water fraction (AWF), tortuosity of the EAS (ratio of De,‖ and De,⊥)].
All maps were nonlinearly registered to the FMRIB58_FA standard-space image in FSL. Regions of interests (ROIs) were manually delineated on the left and right OTs of the FA map using ImageJ. The same ROIs were then applied to the other parametric maps. The mean values of DTI, DKI and WMTI parameters were estimated for the left and right OTs.
D. Statistical Analysis
Unpaired t-test and chi-square test were applied to evaluate age and gender differences between glaucoma and healthy subjects respectively using GraphPad Prism 8. Unpaired t-tests were also used to compare DTI, DKI and WMTI parameters of the OT between groups. We calculated the correlation coefficients between imaging-based estimates of each OT and the clinical ophthalmic measurements averaged between left and right eyes, since the OT fibers come evenly from both eyes in humans. Data are represented as mean ± standard deviation unless otherwise specified. Results were considered statistically significant when corrected p<0.05.
III. Results
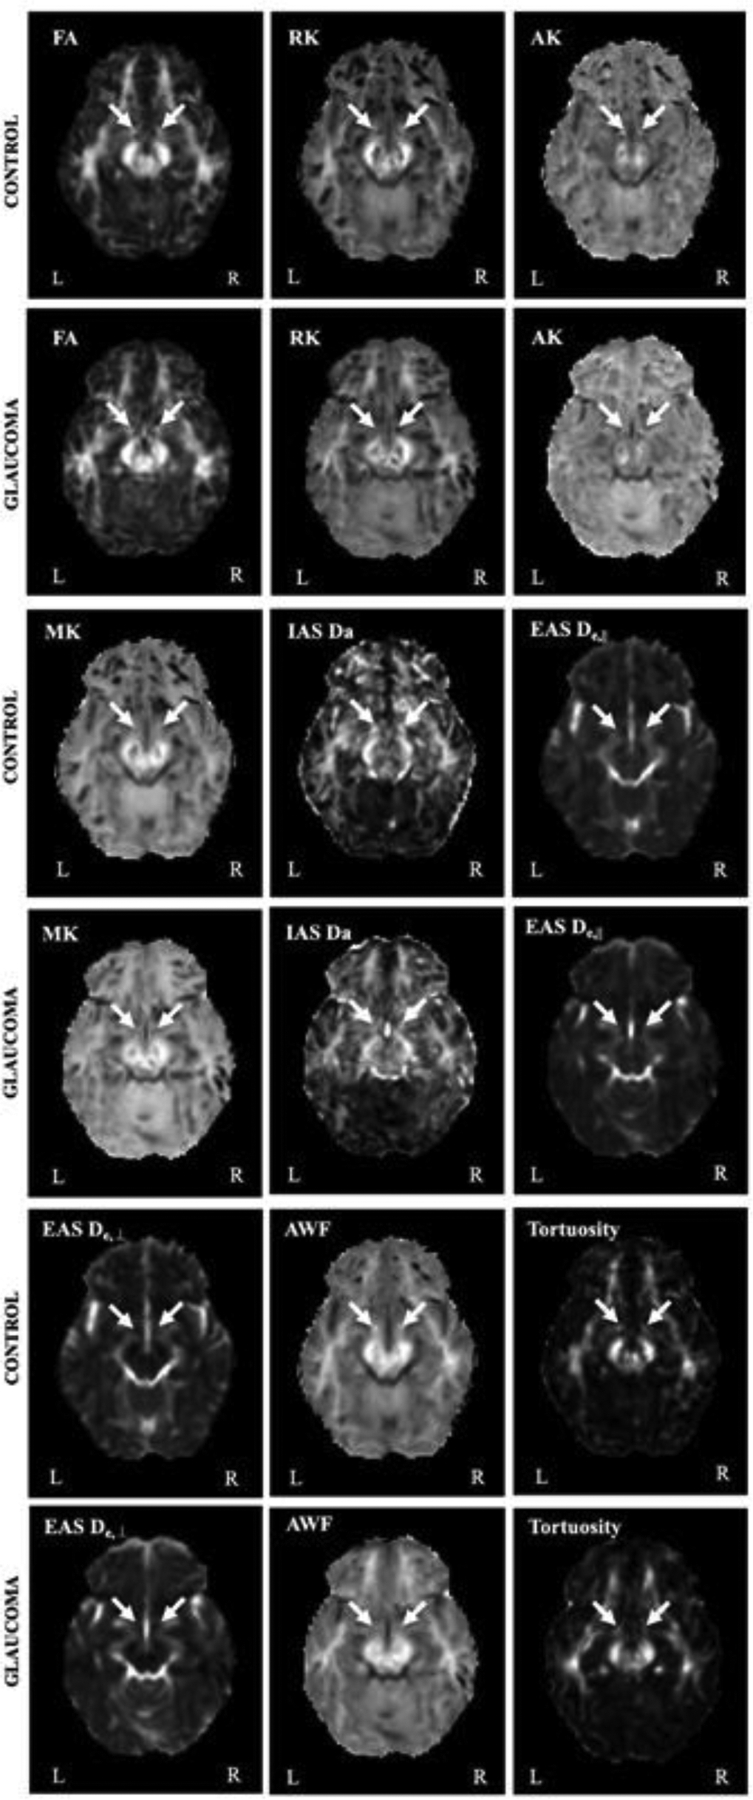
The median values of GCIPL thickness, C/D, and VF-MD were 62.5 μm, 0.78 and −19.25 dB, respectively in the glaucoma group. Age and gender of glaucoma subjects were not significantly different from those of healthy controls (p>0.05). Example maps for each diffusion parameter are shown in Fig. 1 at the level of the bilateral OTs for each group.
Figure 1.

Representative diffusion MRI parametric maps for healthy control and glaucoma subjects. Arrows indicate the optic tracts.
A. Group Comparisons for DTI Parameters
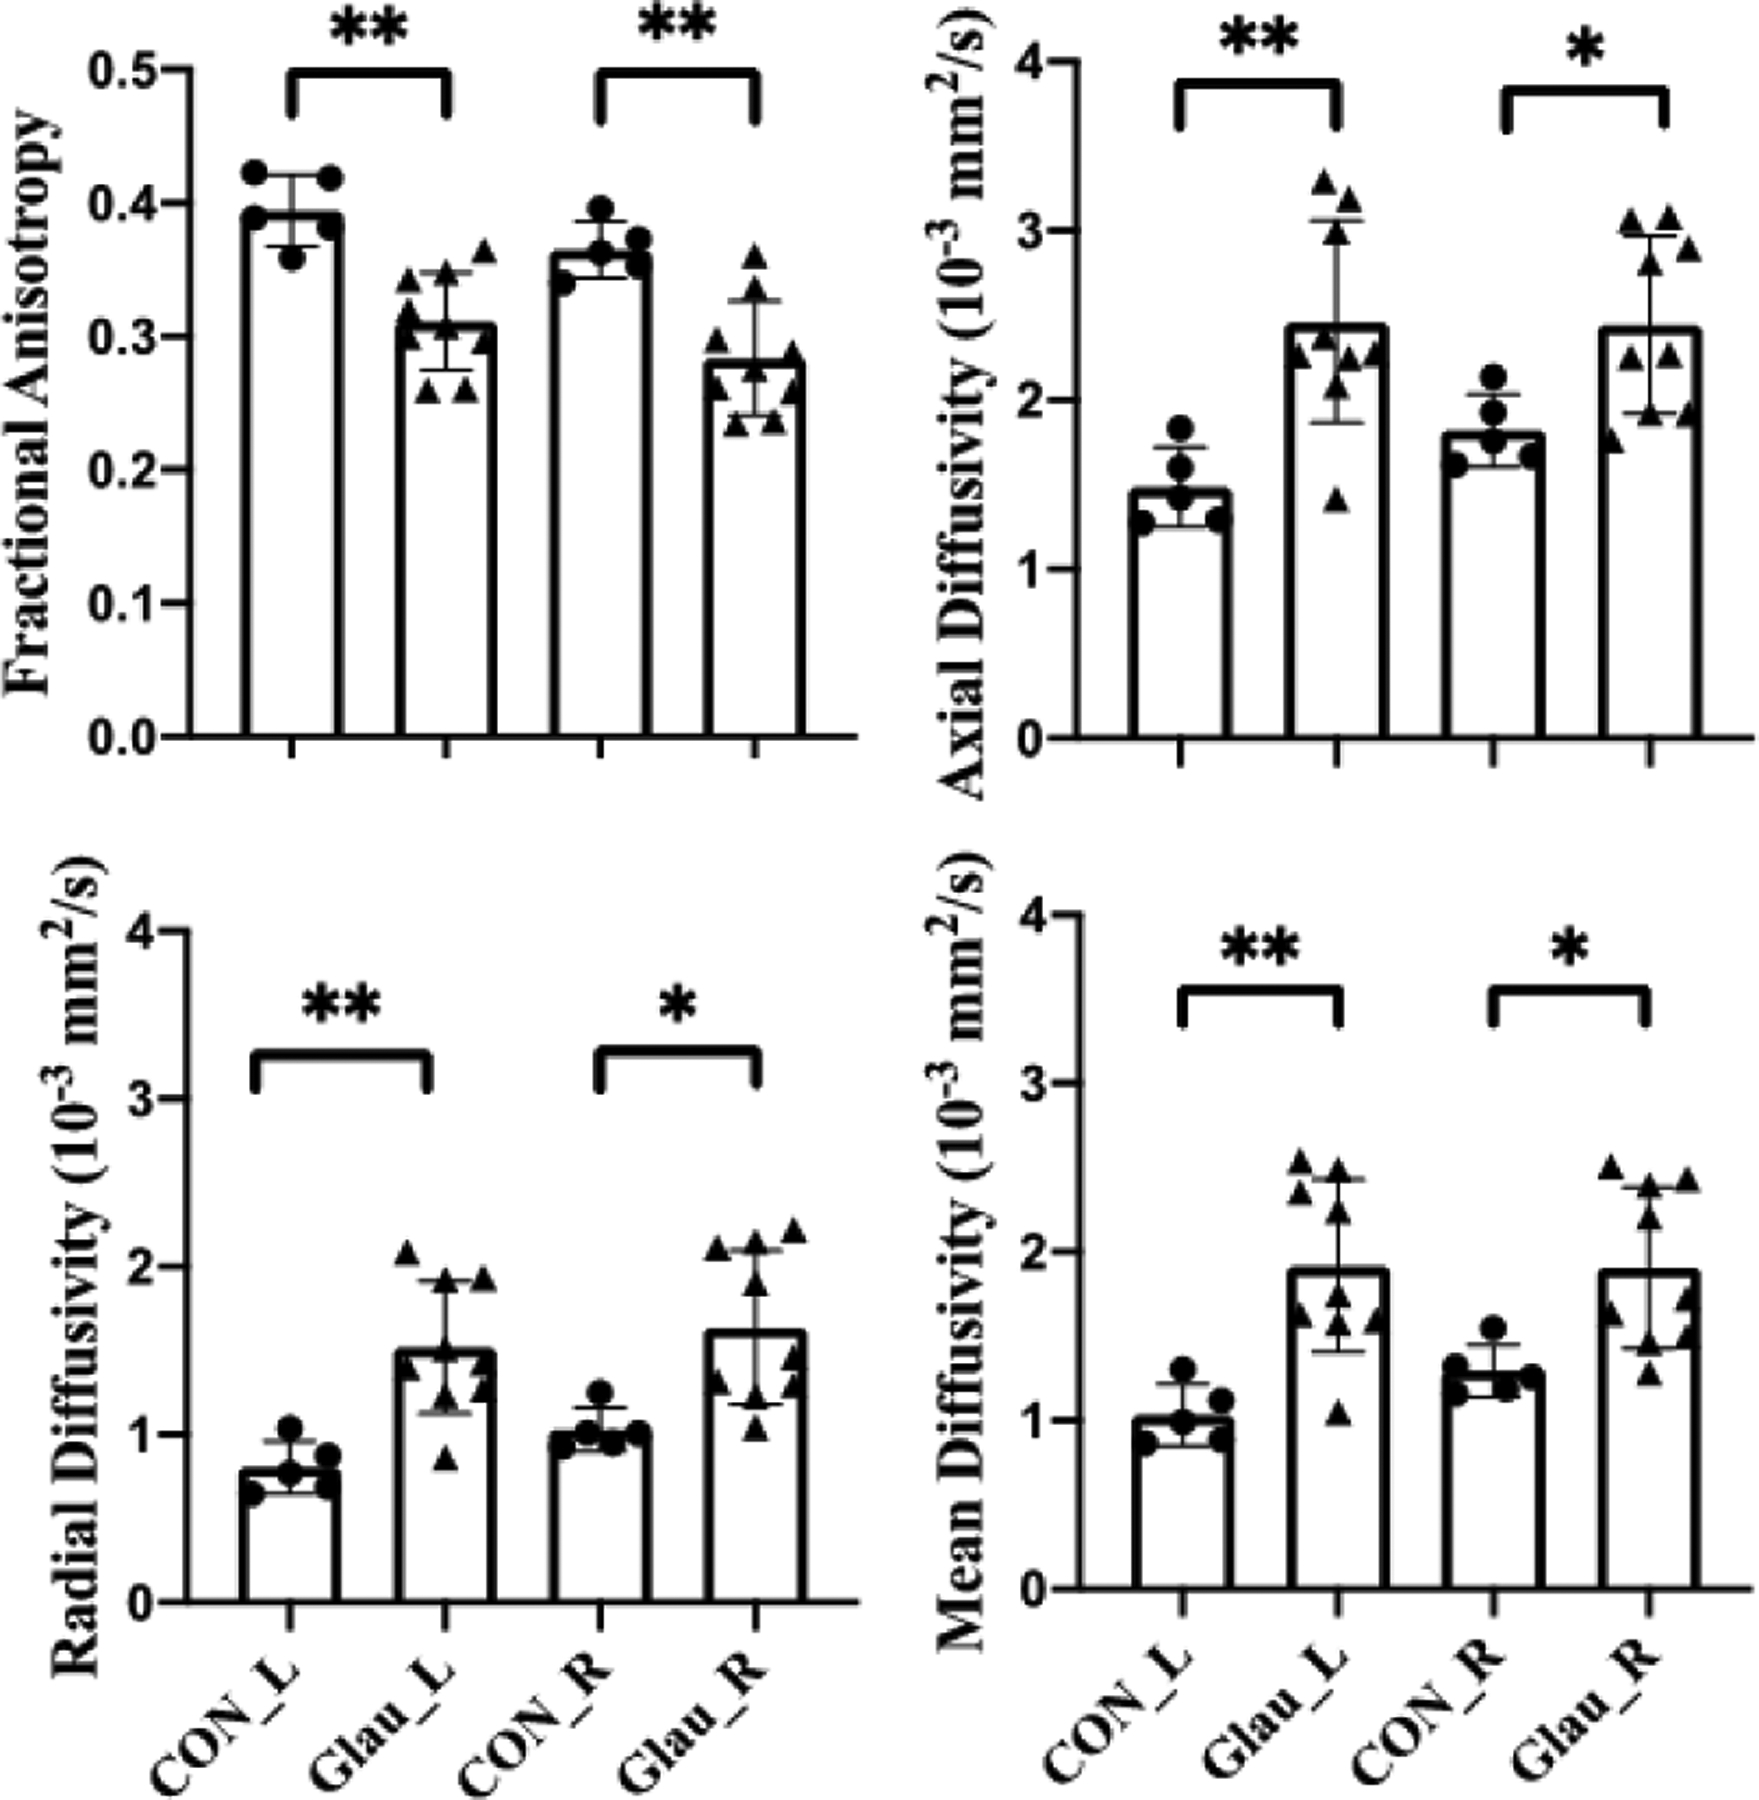
Quantitative analysis in Fig. 2 showed that glaucoma subjects had lower FA and higher MD in both sides of OTs than healthy controls. For directional diffusivities, glaucoma subjects had higher AD and RD in both the left and right OTs than healthy controls.
Figure 2.

Diffusion tensor imaging (DTI) parameters for the left (L) and right (R) optic tracts in healthy control (CON) and glaucoma subjects (Glau). Unpaired t-tests between glaucoma and healthy groups, *p<0.05; **p<0.01.
B. Group Comparisons for DKI and WMTI Parameters
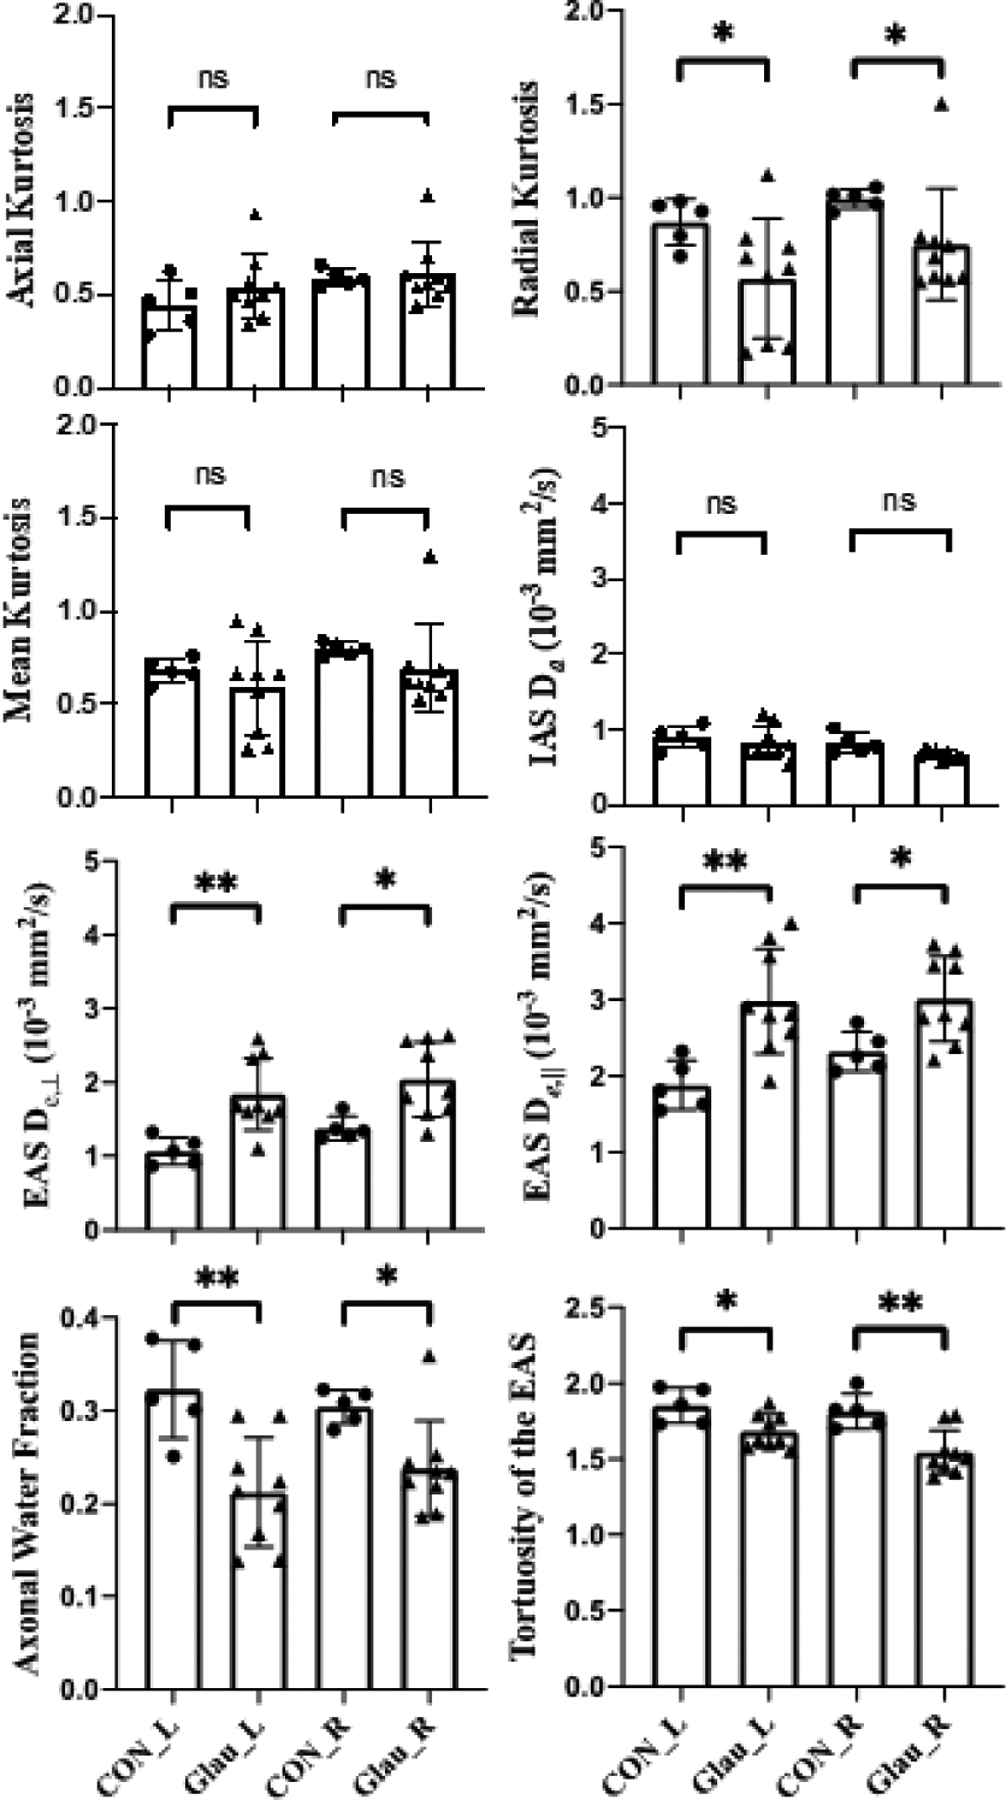
As shown in Fig. 3, glaucoma subjects had lower RK in both sides of OTs than healthy controls. However, no apparent difference was observed in other DKI parameters including AK and MK. With regard to the extended WMTI model, glaucoma subjects showed significantly higher De,‖ and De,⊥ in the EAS of OTs bilaterally than healthy controls. In contrast, AWF and tortuosity were significantly lower in glaucoma subjects compared to healthy controls in both sides of OTs. Da in the IAS of OTs did not show apparent difference between glaucoma and healthy subjects.
Figure 3.

Diffusion kurtosis imaging (DKI) parameters and white matter tract integrity (WMTI) model for the left (L) and right (R) optic tracts in healthy control (CON) and glaucoma subjects (Glau). Unpaired t-tests between glaucoma and healthy groups, *p<0.05; **p<0.01; ns: not significant.
C. Correlations between Diffusion Parameters and Clinical Ophthalmic Measurements
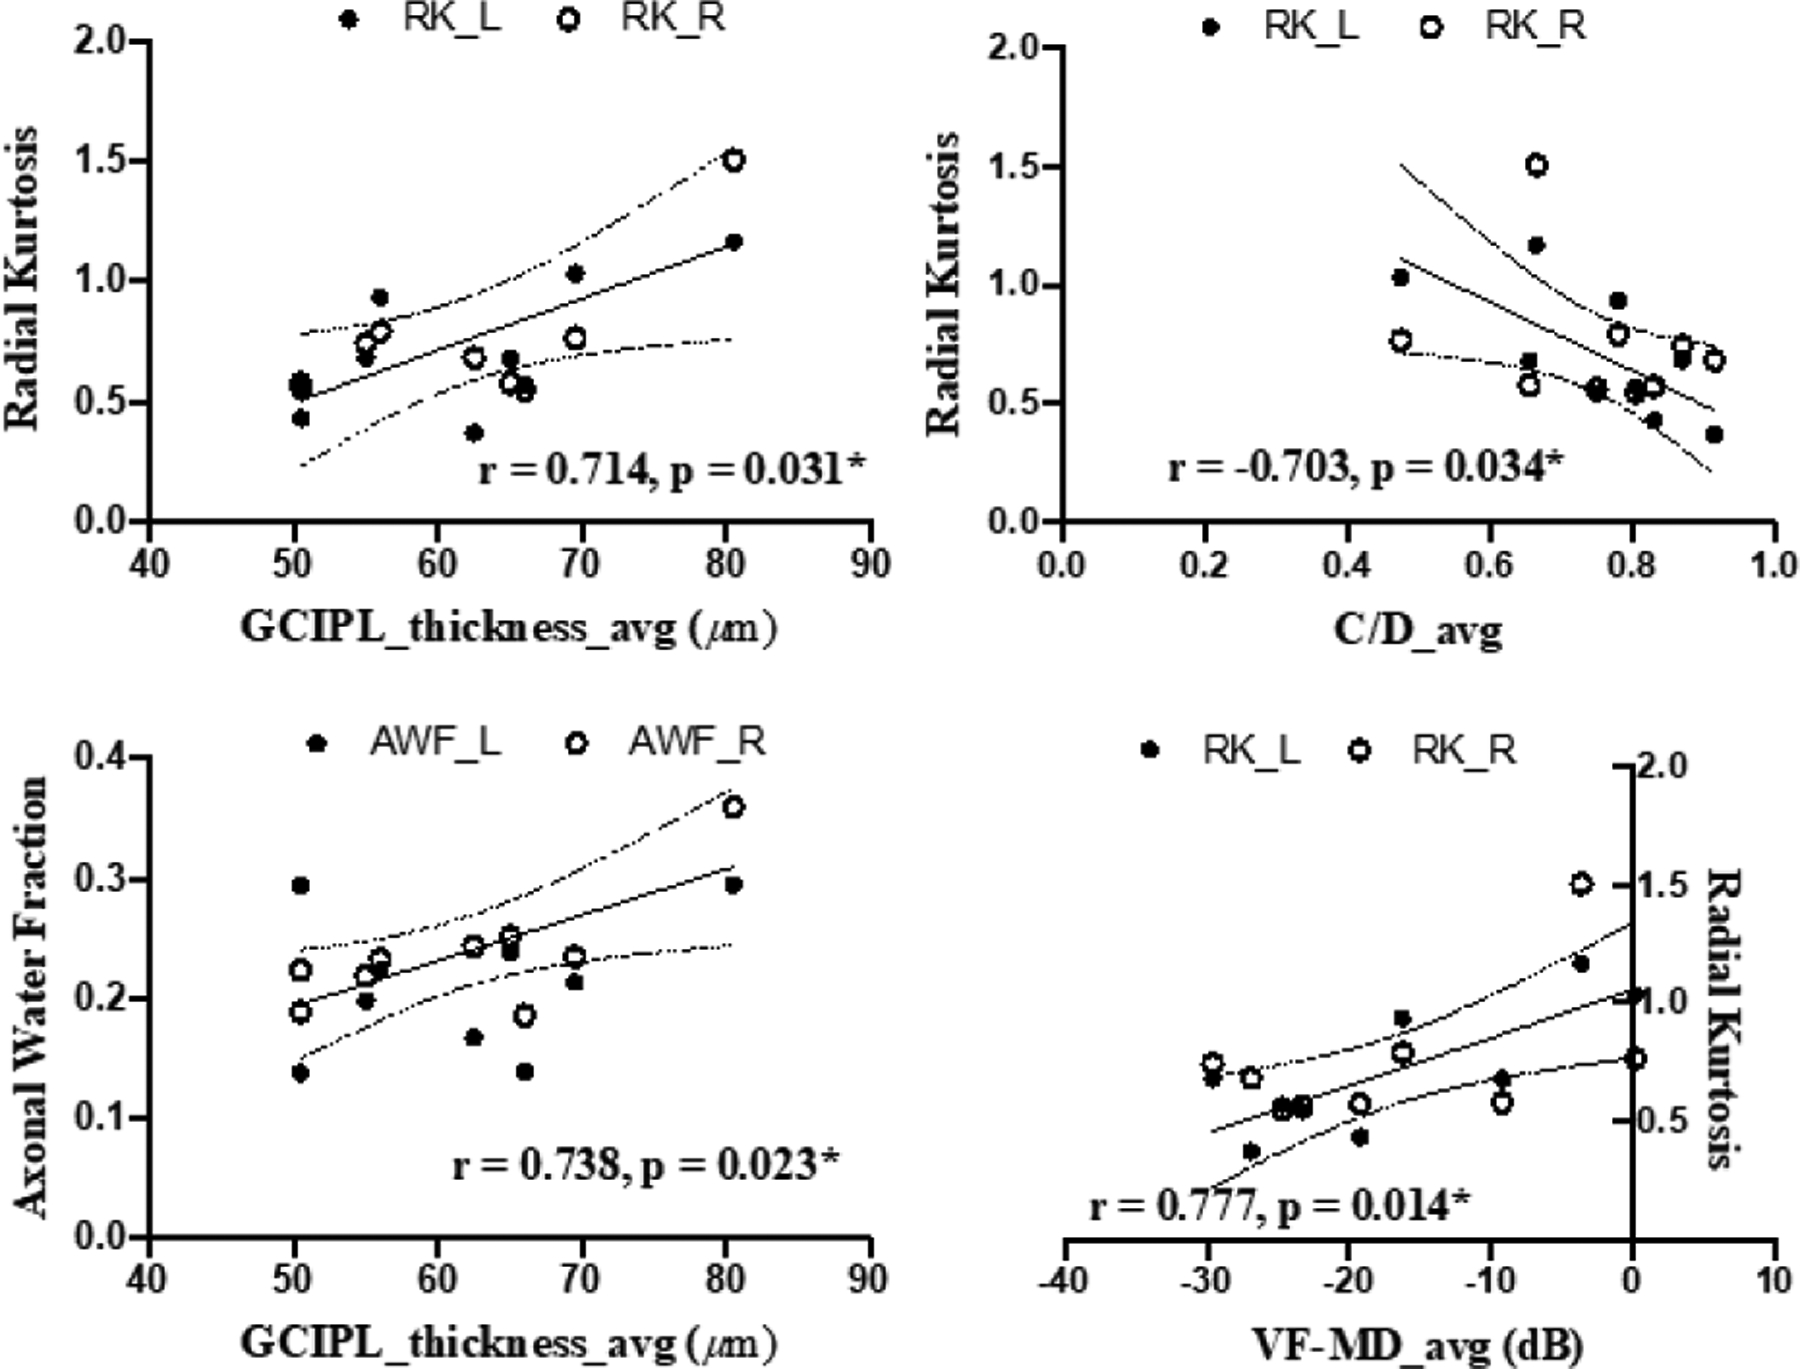
Correlation analyses did not show apparent correlation between clinical ophthalmic measurements and DTI parameters of the OTs (p>0.05). For DKI and WMTI in Fig. 4, averaged GCIPL thickness was found to positively correlate with RK (r=0.714, p=0.031) and with AWF (r=0.738, p=0.023) in the right OT of glaucoma subjects. There was also a significant negative correlation between averaged C/D and RK of the left OT (r=−0.703, p=0.034). In addition, the averaged VF-MD positively correlated with the RK of the left OT (r=0.777, p=0.014). No apparent correlation was observed between clinical ophthalmic measurements and other DKI or WMTI parameters (p>0.05).
Figure 4.

Correlations between diffusion MRI parameters of the left (L) or right (R) optic tract (y-axes) and averaged (avg) clinical ophthalmic measures for both eyes (x-axes) in glaucoma patients.
IV. Discussion
A. DTI Changes in Glaucoma
The lower FA estimates in the OTs of glaucoma patients are consistent with prior DTI studies that reflected compromised overall microstructural integrity along the visual pathway in glaucoma [4–5, 7]. For directional diffusivities, some studies attributed the reduced FA to increased RD and reduced or no change in AD, which suggested the presence of demyelination and axonal injury in the glaucomatous visual pathway [3]. The current study, however, suggests that the FA reduction in the glaucoma group is driven by a greater increase in RD relative to the increase in AD. Since AD and RD are sensitive but not specific biomarkers of axonal and myelin integrity, the mechanisms behind these discrepancies in directional diffusivity changes across human glaucoma DTI studies remain unclear, and the underlying glaucoma pathophysiology may be more complicated than axonal and myelin deterioration. DKI and WMTI may be helpful for in vivo quantification of these specific neurodegenerative events and may better inform the brain changes in glaucoma.
B. DKI and WMTI Changes in Glaucoma
As opposed to conventional DTI, to date, only one study had employed DKI demonstrating lower MK along the brain’s visual pathway in glaucoma patients [11]. In the current study, significantly lower RK was found in the OT of glaucoma subjects as compared to healthy controls. This indicated less restricted water diffusion perpendicular to the axonal axis in consistency with the higher RD in DTI [9].
The extended DKI model allows for multi-compartment WMTI estimates in the IAS and EAS [10]. In this modeling, IAS represents the impermeable myelinated axons, while EAS represents the permeable medium of glial cells. In this context, intra- and extra-axonal diffusion tensors, AWF, and tortuosity of EAS can be quantified. In IAS, Da describes the microstructural properties of axons, while AWF maps the density of axonal packing. In EAS, De,‖ and De, ⊥ can respectively inform properties of glial cells and myelin sheath. In the current study, the higher De,⊥ in glaucoma patients is consistent with a previous ex vivo animal study of hypomyelination [15], whereas the higher De,‖ may indicate increased permeability in glial cellular environment induced by glaucoma [16]. In this context, the decrease of tortuosity of the EAS suggested a greater increase of De,⊥ relative to De,‖, and may reflect the extent of diffusional changes from demyelination and glial cell activation. The higher De,‖ and lower AWF but no change in Da also indicated that AD changes in glaucoma may not be attributed to axonal injury alone, but also axonal loss and glial activation among others. In summary, DKI and WMTI allowed more comprehensive in vivo characterization of the microenvironment in the glaucomatous OT complementary to conventional DTI. The lower AWF in glaucoma likely indicates axonal loss, whereas other WMTI measures suggest the susceptibility of the remaining axons to demyelination and glial cell interactions.
C. DKI and WMTI Changes across Clinical Severity
Loss of retinal ganglion cells and the subsequent GCIPL thinning is common in glaucoma patients. Thinner GCIPL is generally associated to worse visual outcomes. In our analyses, the averaged GCIPL thickness positively correlated with RK and AWF in the OT. This suggested that retinal ganglion cell integrity was tightly coupled to the extents of axonal loss and demyelination along the distal visual pathway in glaucoma. The negative association between C/D and RK also suggested a linkage between optic nerve cupping and myelin integrity, whereas the positive association between VF-MD and RK indicated that RK may reflect clinical visual functional loss.
Among the DKI and WMTI parameters, RK appears to be the most sensitive to clinical ophthalmic measures and may be a feasible imaging biomarker of glaucoma disease severity. No apparent correlation was found between DTI parameters and clinical measurements, suggesting that DKI and WMTI parameters were more sensitive to detect and reflect disease progress. Taken together, these preliminary observations encouraged larger-scale studies in the future to verify the use of DKI and WMTI for more sensitive and targeted characterization and monitoring of neurodegenerative events in the brains of glaucoma.
Acknowledgment
We thank Zena Moore, Tonya Robins, Caprice Sassano, Martina Romain, Jesselyne Abel, and Benjamin Ades-aron for their help with subject recruitment and technical support.
Research supported by National Institutes of Health R01-EY028125 (Bethesda, Maryland); BrightFocus Foundation (G2013077, G2016030, G2019103) and an Unrestricted Grant from Research to Prevent Blindness to NYU Langone Health Department of Ophthalmology.
Contributor Information
Zhe Sun, Department of Ophthalmology and Sackler Institute of Graduate Biomedical Sciences, NYU Langone Health, New York University, New York, NY 10017 USA.
Els Fieremans, Department of Radiology, NYU Grossman School of Medicine, NYU Langone Health, New York University, New York, NY 10017 USA.
Kevin C. Chan, Departments of Ophthalmology and Radiology, NYU Grossman School of Medicine, NYU Langone Health, New York University, New York, NY, 10017 USA
References
- [1].Weinreb RN, Aung T, and Medeiros FA, “The pathophysiology and treatment of glaucoma: a review,” JAMA., vol. 311, no. 18, pp. 1901–1911, May 2014, doi: 10.1001/jama.2014.3192. [DOI] [PMC free article] [PubMed] [Google Scholar]
- [2].Gupta N, Greenberg G, De Tilly LN, Gray B, Polemidiotis M, and Yücel YH., “Atrophy of the lateral geniculate nucleus in human glaucoma detected by magnetic resonance imaging,” Br J Ophthalmol., vol. 93, no. 1, pp. 56–60, January 2009, doi: 10.1136/bjo.2008.138172. [DOI] [PMC free article] [PubMed] [Google Scholar]
- [3].You Y et al. , “Demyelination precedes axonal loss in the transneuronal spread of human neurodegenerative disease,” Brain, vol. 142, no. 2, pp. 426–442, February 2019, doi: 10.1093/brain/awy338. [DOI] [PubMed] [Google Scholar]
- [4].Murphy MC et al. , “Retinal Structures and Visual Cortex Activity are Impaired Prior to Clinical Vision Loss in Glaucoma,” Sci Rep, 6, p31464, August 2016, doi: 10.1038/srep31464. [DOI] [PMC free article] [PubMed] [Google Scholar]
- [5].Chen Z et al. , “Diffusion tensor magnetic resonance imaging reveals visual pathway damage that correlates with clinical severity in glaucoma,” Clin Exp Ophthalmol., vol. 41, no. 1, pp. 43–49, Jan-Feb 2013, doi: 10.1111/j.1442-9071.2012.02832.x. [DOI] [PubMed] [Google Scholar]
- [6].J Xu et al. , “Assessing optic nerve pathology with diffusion MRI: from mouse to human.,” NMR Biomed., vol. 21, no. 9, pp. 928–40, 2008, doi: 10.1002/nbm.1307. [DOI] [PMC free article] [PubMed] [Google Scholar]
- [7].Lu P et al. , “Reduced white matter integrity in primary open-angle glaucoma: a DTI study using tract-based spatial statistics,” J Neuroradiol., vol. 40, no. 2, pp. 89–93, May 2013, doi: 10.1016/j.neurad.2012.04.001. [DOI] [PubMed] [Google Scholar]
- [8].Basser PJ and Pierpaoli C, “Microstructural and physiological features of tissues elucidated by quantitative-diffusion-tensor MRI,” J Magn Reson B., vol. 111, no. 3, pp. 209–219, June 1996. [DOI] [PubMed] [Google Scholar]
- [9].Wu EX and Cheung MM, “MR diffusion kurtosis imaging for neural tissue characterization,” NMR Biomed., vol. 23, no. 7, pp. 836–848, August 2010, doi: 10.1002/nbm.1506. [DOI] [PubMed] [Google Scholar]
- [10].Fieremans E, Jensen JH, and Helpern JA, “White matter characterization with diffusional kurtosis imaging,” Neuroimage., vol. 58, no. 1, pp. 177–188, 2011, doi: 10.1016/j.neuroimage.2011.06.006. [DOI] [PMC free article] [PubMed] [Google Scholar]
- [11].Xu Z et al. , “Microstructural visual pathway abnormalities in patients with primary glaucoma: 3 T diffusion kurtosis imaging study,” Clin Radiol., vol. 73, no. 6, pp. 591. e9–591. e15, June 2018, doi: 10.1016/j.crad.2018.01.010. [DOI] [PubMed] [Google Scholar]
- [12].Lanzafame S et al. , “Differences in Gaussian diffusion tensor imaging and non-Gaussian diffusion kurtosis imaging model-based estimates of diffusion tensor invariants in the human brain,” Med Phys., vol. 43, no. 5, pp. 2464–2475, May 2016, doi: 10.1118/1.4946819. [DOI] [PubMed] [Google Scholar]
- [13].Jenkinson M, Beckmann CF, Behrens TE, Woolrich MW, and Smith SM. “FSL,” NeuroImage, 62:782–90, August 2012, doi: 10.1016/j.neuroimage.2011.09.015. [DOI] [PubMed] [Google Scholar]
- [14].Ades-Aron B, Veraart J, Kochunov P, McGuire S, Sherman P, Kellner E, Novikov DS, Fieremans E. “Evaluation of the accuracy and precision of the diffusion parameter EStImation with Gibbs and NoisE removal pipeline,” Neuroimage, vol. 183, pp. 532–543, January 2016, doi: 10.1016/j.neuroimage.2018.07.066 [DOI] [PMC free article] [PubMed] [Google Scholar]
- [15].Kelm ND, West KL, Carson RP, Gochberg DF, Ess KC, and Does MD, “Evaluation of diffusion kurtosis imaging in ex vivo hypomyelinated mouse brains,” Neuroimage, vol. 124, pp. 612–626, January 2016, doi: 10.1016/j.neuroimage.2015.09.028. [DOI] [PMC free article] [PubMed] [Google Scholar]
- [16].Chong RS and Martin KR, “Glial cell interactions and glaucoma,” Curr Opin Ophthalmol, vol. 26, no. 2, p. 73, March 2015, doi: 10.1097/ICU.0000000000000125. [DOI] [PMC free article] [PubMed] [Google Scholar]


