

Abstract
Concerns over ACE inhibitor or ARB use to treat hypertension during COVID-19 remain unresolved. Although studies using more robust methodologies provided some clarity, sources of bias persist and it remains critical to quickly address this question. In this review, we discuss pernicious sources of bias using a causal model framework, including time-varying confounder, collider, information, and time-dependent bias, in the context of recently published studies. We discuss causal inference methodologies that can address these issues, including causal diagrams, time-to-event analyses, sensitivity analyses, and marginal structural modeling. We discuss effect modification and we propose a role for causal mediation analysis to estimate indirect effects via mediating factors, especially components of the renin–angiotensin system. Thorough knowledge of these sources of bias and the appropriate methodologies to address them is crucial when evaluating observational studies to inform patient management decisions regarding whether ACE inhibitors or ARBs are associated with greater risk from COVID-19.
Keywords: angiotensin-converting enzyme 2, causal inference, causal mediation, causal model, collider, directed acyclic graph, hypertension, immortal time, renin–angiotensin system, severe acute respiratory syndrome coronavirus 2
INTRODUCTION
Early reports of the coronavirus disease 2019 (COVID-19) pandemic led to concerns about the relationship between ACE (angiotensin-converting enzyme) inhibitor (ACEi) or Ang II (angiotensin II) receptor blocker (ARB) therapy and COVID-19 in patients with underlying hypertension and associated comorbidities, because of the fact that ACE2 (angiotensin-converting enzyme 2) is the binding site for severe acute respiratory syndrome coronavirus 2 (SARS-CoV-2) [1,2]. These case series and small descriptive cohorts had limited to no application of appropriate epidemiological or statistical methods, and thus are highly susceptible to bias, especially confounding by age and by indication associated with comorbidities, such as heart disease [3–6]. As such, this controversial topic quickly needed data to provide clarity and answer appropriately the question of whether ACEi/ARBs, compared with other antihypertensive agents, are associated with an increased risk of SARS-CoV-2, COVID-19, and related outcomes in patients with hypertension [7–10]. This is of particular interest during the pandemic because of the potential for significant publication bias.
Recent studies employing more rigorous methods, especially in addressing confounding bias, have not demonstrated an association between ACEI/ARB use and SARS-CoV-2 infection or COVID-19, though several important potential sources of bias remain unaddressed and characterized incompletely [11–15]. In order to better characterize these risks, one must more thoroughly understand, identify, and account for persistent sources of bias. Conceptualizing these important research questions in a causal model can often best distinguish these sources of bias and inform study design and analytic strategies as well as inform the key causal relationships.
Our objective is to apply a causal inference framework to highlight several key examples of persistent and overlooked sources of bias and examples of several methodological considerations that can address them, using a multidisciplinary approach with expertise in clinical care, epidemiology, statistics, and basic and translational science. Our goal is to facilitate the appropriate appraisal and interpretation of studies investigating this important topic, in order to ensure that appropriate conclusions are drawn to best influence patient care during the COVID-19 pandemic. We discuss bias in the context of our exposure of interest, ACEi/ARB use, and our outcomes of interest, SARS-CoV-2 infection, development of COVID-19, and COVID-19-related outcomes, as well as highlight how or how not existing studies that have investigated these questions have addressed these sources of bias (Table 1).
TABLE 1.
Key sources of bias and how they were or were not addressed in studies evaluating angiotensin-converting enzyme inhibitor/angiotensin II receptor blocker use and coronavirus disease 2019a
| Article | Design/population | Confounding bias | Selection/collider bias | Time-dependent bias |
|---|---|---|---|---|
| Zhang et al. [33] | Retrospective cohort Patients with hypertension who were hospitalized with COVID-19 |
Addressed with PSM Did not account for time-varying confounding |
Conditioned on hypertension and hospitalization | Exposure defined by ACEi/ARB use after index time |
| Mehta et al. [12] | Prospective cohort Retrospective analysis All patients who were tested All patients with a positive test |
Addressed with PSW Did not account for time-varying confounding |
Conditioned on being tested and then a positive test | Not present; exposure defined prior to index time |
| Mancia et al. [44] | Population-based case–control study Cases were patients with a positive test |
Addressed with matching controls and adjusting for covariates | Conditioned cases on a positive test | Not present; exposure defined prior to index time |
| Reynolds et al. [13] | Retrospective cohort All patients who were tested Patients who had a positive test |
Addressed with PSM | Conditioned on being tested and on having a positive test | Not present; exposure defined prior to index time |
| Lopes et al. [90] | Open-label randomized controlled trial of hospitalized patients (protocol) | Addressed with randomization | Conditioned on hospitalization | Not present in intention to treat analysis |
Information bias is present in each example because of the current approach to SARS-CoV-2 testing and use of electronic health record registries for data collection. Examples of how sources of bias were at least partially addressed are provided.
ACEi, ACE inhibitor; COVID-19, coronavirus disease 2019; PSM, propensity-score matching; PSW, propensity-score weighting.
SPECIFYING THE RESEARCH QUESTION
It is critically important to define the research question thoughtfully and explicitly, as this informs the appropriate study design and analytic plan as well as potential sources of bias. One must define adequately the specific study population and the exposures and outcomes of interest for each particular question, being mindful of time as it relates to causal relationships. For the purposes of this review, we will focus on the following three questions:
Among patients with hypertension, is use of ACEi/ARB vs. other antihypertensive medications associated with a differential risk of SARS-CoV-2 infection (i.e. do these medications increase expression of ACE2 in the lungs and subsequently increase the likelihood of viral binding) (Fig. 1)?
Among patients with hypertension who tested positive for SARS-CoV-2, is use of ACEi/ARB vs. other antihypertensive medications associated with a differential risk of developing COVID-19 (i.e. does this hypothetical increase in ACE2 expression increase or decrease risk of disease)?
Among patients with hypertension who tested positive for SARS-CoV-2 and who developed COVID-19, is use of ACEi/ARB vs. other antihypertensive medications associated with a differential risk of worse outcomes (e.g. hospitalization, ICU admission, or death), that is, does this hypothetical increase in ACE2 expression and/or viral suppression of ACE2 expression impact disease severity?
FIGURE 1.
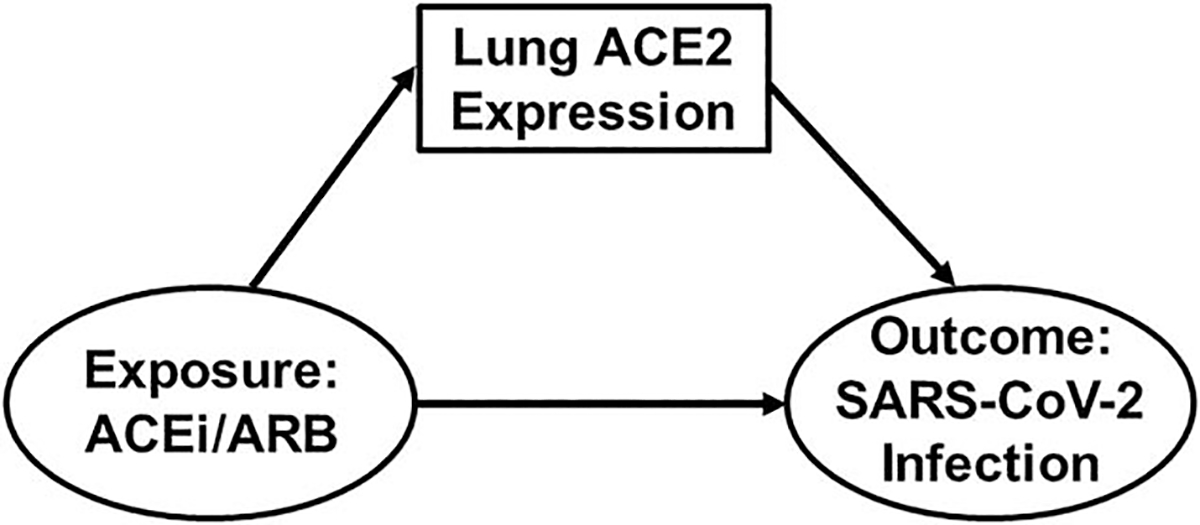
Directed acyclic graph demonstrating research question 1: Is ACEi/ARB Use Associated with SARS-CoV-2 Infection? Exposure and outcome are shown in ovals whereas ACE2 expression in the lungs is shown in a box. As also represented by Fig. 6, ACE2 can also be conceptualized as a mediator of the ACEi/ARB–SARS-CoV-2 relationship. ACE2, angiotensin-converting enzyme 2; ACEi, angiotensin-converting enzyme inhibitor; ARB, angiotensin II receptor blocker; SARS-CoV-2, severe acute respiratory syndrome coronavirus 2.
Questions (1) to (3) focus on progressively narrower patient populations. In all instances, our exposure of interest is baseline (pre-SARS-CoV-2 infection) ACEi/ARB use. For questions (2) and (3), the continued use of ACEi/ARB after a positive SARS-CoV-2 test and/or hospitalization for COVID-19 becomes a crucial exposure and introduces the importance of index time, which we will discuss in detail.
For observational studies, it can be helpful to conceptualize these questions in the target trial framework; that is, the randomized trial we would conduct if it were feasible and ethical (Table 2) [16]. In each instance, we want to know if patients in the population of interest who are currently taking an ACEi/ARB should continue or discontinue their ACEi/ARB or switch to another antihypertensive medication. Similarly, we want to know if patients in the population of interest who are not currently taking an ACEi/ARB should continue their current medication or switch to an ACEi/ARB. In this context, we are attempting to create an observational setting in which we can emulate a randomized trial, building counterfactuals for each scenario (i.e. potential outcomes or ‘what would have happened if’) [17,18]. Once one defines appropriately the research question and study population in this causal context, we can begin to identify and address bias.
TABLE 2.
General definitions of select terms
| Term | Definition |
|---|---|
| Target trial | Ideal randomized clinical trial one would conduct if possible [16] |
| Counterfactual | Potential outcomes [17] |
| Exchangeability | Assumption that all individuals in a study population are exchangeable with each other on all relevant factors except exposure status [19] |
| Causal diagram (e.g. DAG) | Graphical tool used to represent a causal model and assess for potential violations of exchangeability [20,21] |
| Antecedent | Factor that is a cause of another factor [23] |
| Descendant | Factor that is an effect of another factor [23] |
| Minimally sufficient adjustment set | Set of factors identified by a DAG that, if adjusted for, can efficiently close off biasing noncausal paths [23] |
| Confounding bias | Factor that is associated with the outcome (in the causal direction towards the outcome) regardless of exposure status, distributed unequally across exposure levels, and is not on the causal path between the exposure and outcome [24] |
| Selection bias | Selecting or restricting the study sample based on a common antecedent factor of the exposure and outcome (i.e. a confounding factor), which violates exchangeability [27] |
| Collider bias | Selecting or restricting the study sample based on, or adjusting for or stratifying on, a common descendent factor of the exposure and outcome, which can induce a spurious association or distort the magnitude or direction of an association between the exposure and outcome [26] |
| Information bias | Error in obtaining or documenting information used to inform, characterize, or define a factor; related to misclassification bias [29] |
| Index time | Start of study period and/or assessment of exposure status |
| Time-dependent bias | Failure to account appropriately for index time or time during follow up, which erroneously favors one exposure group over another [30] |
| Immortal time bias | Participant’s inability to reach an outcome over a set period of time because of study design and/or analytic plan restrictions [31] |
| Immeasurable time bias | Exposure groups are assigned erroneously the same exposure time because of lack of information about how exposure status changes over time [32] |
| Propensity score | Conditional probability of exposure (i.e. treatment) assignment based on observed covariates [36] |
| Table 2 fallacy | Presentation of multiple effect estimates for exposures and covariates from the same multivariable model that confounds direct-effect and total-effect estimates and encourages misinterpretation of results [43] |
| Competing risk | A secondary event that precludes a participant’s ability to reach the primary outcome, which biases survival estimates [49] |
| Sensitivity analysis | Quantification of a model’s uncertainty because of bias related to the assumptions that one makes in the primary analyses [52] |
| Negative control | Surrogate marker for the actual exposure or outcome that can help identify and address various sources of bias [64] |
| Effect modification | Magnitude or direction of the exposure-outcome association differs across levels of a third factor [74] |
| Mediation | Third factor that lies on the causal and temporal paths between an exposure and outcome, leading to indirect effects of the exposure on the outcome via the third factor, in addition to the direct effects of an exposure on an outcome [80] |
DAG, directed acyclic graph.
EXCHANGEABILITY AND CAUSAL DIAGRAMS
Inherent to the discussion of bias is the concept of exchangeability, which assumes that exposed individuals are exchangeable with unexposed individuals on all relevant factors except for exposure status (the counterfactual ideal) [19]. Bias in any form is rooted in the violation of this exchangeability. Recent observational studies investigating ACEi/ARB use in patients with SARS-CoV-2 and COVID-19 have notably addressed exchangeability in regards to confounding bias but major additional sources of bias persist, which threaten exchangeability and which have not been fully discussed [11–15].
One of the most important first steps in establishing a causal model is to develop causal diagrams, which are important tools for assessing the potential violations of exchangeability in an observational study. Causal diagrams are graphical tools that have become increasingly popular to inform causal inference-based assessments of exposure–outcome relationships, moving beyond illustrating statistical associations and towards establishing inferred causal evidence [20–22]. With causal diagrams, or more specifically directed acyclic graphs (DAGs), one can construct a causal model representing the causal relationships between an exposure and outcome, as well as factors that are antecedents (causes) or descendants (effects) of these factors, and thus visualize opportunities for bias to arise [23]. Specifically, one can discriminate between the causal paths and noncausal (i.e. biasing) paths that exist for our research question. This includes colliding or mediating factors as well as confounding factors.
Through study design and analysis, we attempt to close off noncausal paths while leaving causal paths open, in order to mitigate confounding and other sources of bias. DAGs can inform a minimally sufficient adjustment set of factors that should be included in an adjusted multivariable regression model and can inform models used to build propensity scores (more below), in order to close off noncausal paths. In the following sections, we apply DAGs to illustrate potential sources of bias, using question (1) above as our motivating example of a causal model, to examine the association of ACEi/ARB use and SARS-CoV-2 infection (Fig. 1). We also discuss examples from recently published studies that employed more robust methodologies [12,13].
POTENTIAL SOURCES OF BIAS
Confounding bias
A confounding factor is one that is associated with the outcome even in the unexposed group (in the direction of factor → outcome) and that is distributed heterogeneously between the different exposure levels (in the direction of factor → exposure). Additionally, confounding factors cannot lie on the causal pathway between a particular exposure and outcome [24]. These factors (or their antecedents) can introduce confounding bias, which has been a major issue in early COVID-19 studies (e.g. age, as demonstrated in Fig. 2). For example, appropriate adjustment for age blocks the noncausal path between ACEi/ARB use and SARS-CoV-2 infection, thus leaving the causal path between them open.
FIGURE 2.
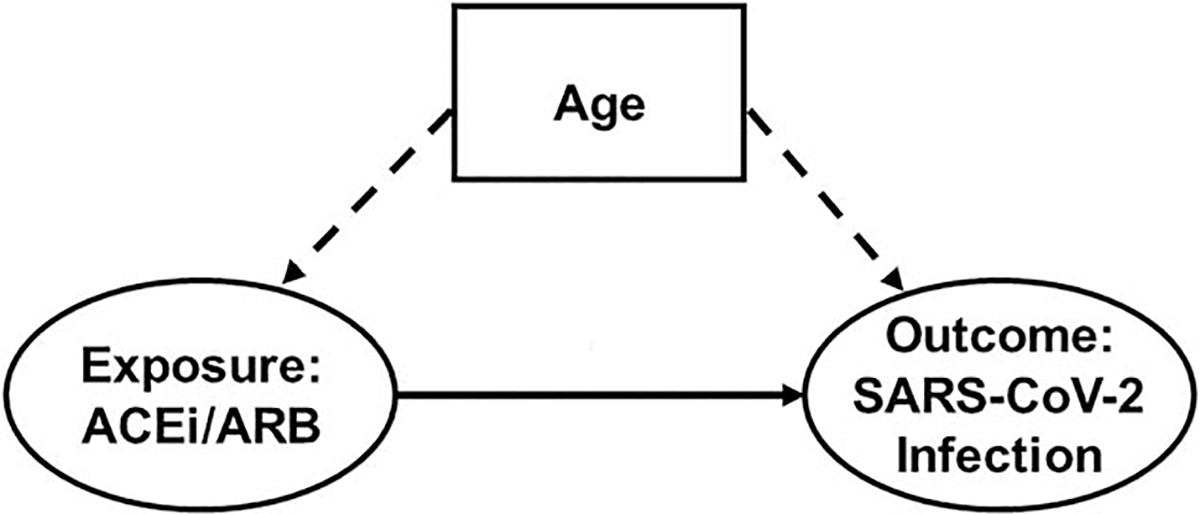
Directed acyclic graph representing confounding bias in the association between angiotensin-converting enzyme inhibitor/angiotensin II receptor blocker use and severe acute respiratory syndrome coronavirus 2 infection. The prevalence of ACEi/ARB use and the risk of SARS-CoV-2 infection (ovals) increase with increasing age (dashed arrows), thus making age (box) a confounding factor in the association between ACEi/ARB use and SARS-CoV-2 infection. ACEi, angiotensin-converting enzyme inhibitor; ARB, angiotensin II receptor blocker; SARS-CoV-2, severe acute respiratory syndrome coronavirus 2.
Recently published studies have made significant gains in addressing confounding bias [12,13]. However, among hospitalized participants in particular, several potential time-varying confounding factors remain unaccounted for, such as hypotension, acute kidney injury, and hyperkalemia [25]. These factors can be challenging in that in addition to potentially confounding the relationship between ACEi/ARB use and COVID-19-related outcomes, they can lie on the causal path between prior ACEi/ARB exposure and COVID-19 outcomes depending upon how one incorporates time in the causal model (i.e. the factor may mediate the causal relationship, see Causal Mediation). Time-varying confounding factors are important to consider for time-to-event analyses and have not been identified or addressed in studies to date (Table 1).
Collider bias
In causal language, we can introduce selection bias when we select or restrict a study sample based on a factor that is a common antecedent of the exposure and the outcome (i.e. a confounding factor), as this compromises exchangeability of our exposed and unexposed groups [15,26,27]. When we condition the study population on a common descendent of the exposure and outcome, we may introduce collider bias. Collider bias can induce a spurious association or distort the magnitude or direction of the association between an exposure and outcome [26] and is a significant limitation in COVID-19 research that has been under-recognized to date [28].
As a possible risk factor for SARS-CoV-2 infection and COVID-19, hypertension (and its descendent comorbidities, such as heart failure) increases the likelihood of a patient being on an ACEi/ARB and being tested for SARS-CoV-2 (Fig. 3). As illustrated, if we select our study population conditional upon being tested; having a positive test result; being diagnosed with COVID-19; or being hospitalized for COVID-19, we can introduce collider bias, which can induce or distort an association between ACEi/ARB use and these outcomes (Table 1) [12,13]. Similarly, we can introduce collider bias if we adjust for or stratify on a collider, as was the case in studies that included participants with and without hypertension but that adjusted for or stratified on hypertension. Furthermore, often only a limited proportion of individuals undergo testing, and indications for and availability of testing can change over time and across regions. Similarly, criteria for hospitalization change over time and across regions depending on resource availability and evolution in treatment of disease. Thus, the presence of collider bias can be a dynamic process that is dependent upon the study time period and the potential population of interest.
FIGURE 3.
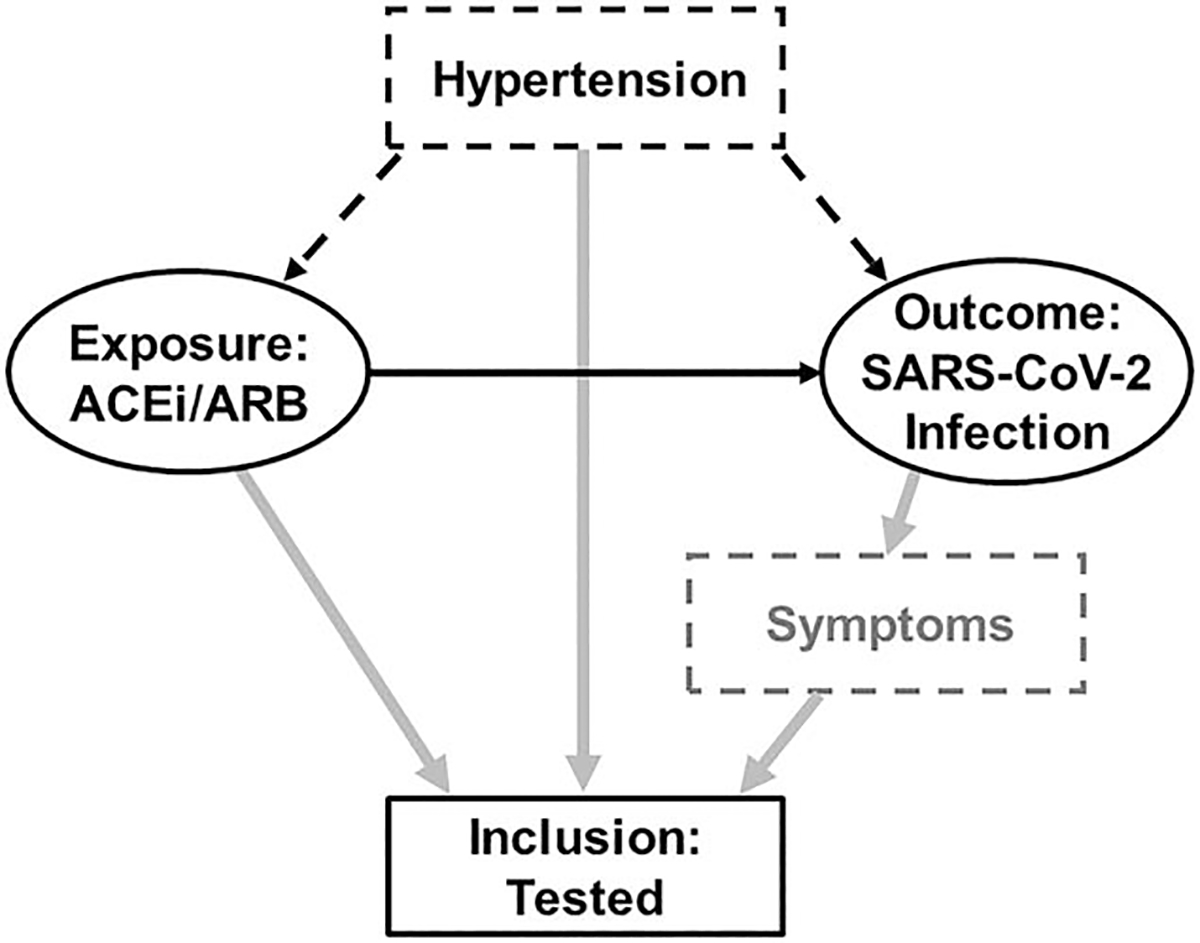
Directed acyclic graph demonstrating collider bias in the association between angiotensin-converting enzyme inhibitor/angiotensin II receptor blocker use and severe acute respiratory syndrome coronavirus 2 infection. The solid black arrow represents the apparent association between the exposure and outcome (ovals). Patients who take an ACEi/ARB and those with symptoms concerning for SARS-CoV-2 infection (e.g. cough or fever, represented by dashed grey box), as well as patients with hypertension (dashed black box), may be more likely to be tested for SARS-CoV-2 (grey arrows). If study inclusion is conditional upon a positive test (solid black box), these patients may be preferentially more likely to be included in the study, thus making testing a collider. We can also induce collider bias if we adjust for or stratify on the collider. ACEi, angiotensin-converting enzyme inhibitor; ARB, angiotensin II receptor blocker; SARS-CoV-2, severe acute respiratory syndrome coronavirus 2.
Information bias
Errors in obtaining or documenting information that informs or characterizes a factor can induce information bias. In some instances, information bias can result in misclassification of exposure or outcome status. In the present example, as authors of recent studies and editorials have noted, information bias may be introduced through medical records-based definitions of diagnoses or medication use, heterogeneity of testing strategies and practices (e.g. within and between countries and across time), test characteristics (e.g. sensitivity and specificity of a SARS-CoV-2 test), and patient access to testing or medical care (Fig. 4) [15]. Indeed, as Mehta et al. [12] noted, testing practices changed during their study period. If the association between these factors is stronger than the association between observed and true disease status, the assessment will likely be highly biased [29].
FIGURE 4.
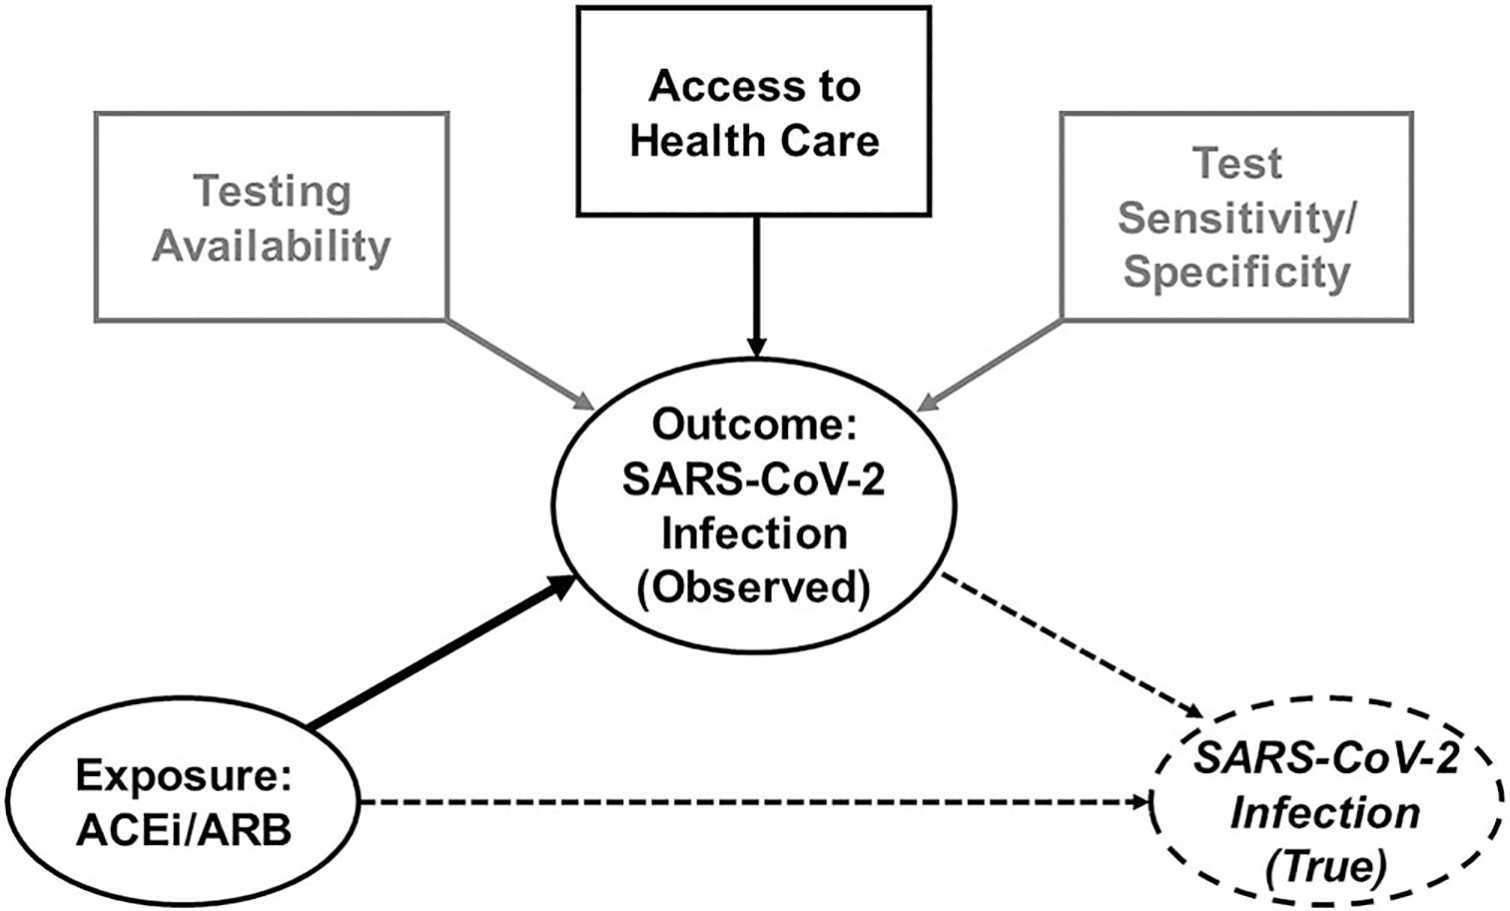
Directed acyclic graph representing information bias in the association between angiotensin-converting enzyme inhibitor/angiotensin II receptor blocker use and severe acute respiratory syndrome coronavirus 2 infection. The large solid black arrow represents the causal relationship between the exposure (ACEi/ARB use) and the outcome (observed SARS-CoV-2 infection), represented by solid ovals. Information bias can be introduced via heterogeneity in access to healthcare (black box and small solid black arrow) and test availability and test characteristics (grey boxes and grey arrows), which limit one’s ability to estimate the association between the exposure and the true outcome (dashed oval), represented by the long dashed arrow. The short dashed arrow represents the association of observed with true infection. Note, not all arrows are included for simplicity. ACEi, angiotensin-converting enzyme inhibitor; ARB, angiotensin II receptor blocker; SARS-CoV-2, severe acute respiratory syndrome coronavirus 2.
Time-dependent bias
An important consideration for this discussion is how one approaches the influence of time as a factor, especially time-varying exposure. Time-dependent bias occurs when methodological approaches fail to account appropriately for index time (i.e. the start of the study period, or the time at which we start to measure exposure status until an outcome occurs) or follow-up time, thus yielding results that can erroneously favor one exposure group over another [30]. When comparing treatment exposure to no treatment, this bias always favors the treatment group.
Immortal time bias, a specific type of time-dependent bias, occurs when the exposure group is unable to achieve an outcome (e.g. death) during a certain period of time, because of the fact that the study design and/or analytic plan excludes their ability to reach said outcome [31]. This can occur when exposure allocation (i.e. first prescription or use of a medication) is dependent upon survival to a certain point in time (i.e. occurs a period of time after index time). For example, if participant follow up starts at the time of hospital admission, but first ACEi/ARB use occurs at any point during the hospitalization, the ACEi/ARB-exposed group must survive long enough in the hospital to reach the time of first exposure (Fig. 5). Thus, participants who are ultimately assigned to the exposed group are protected from dying from the time the study starts (index time: the moment of hospitalization) to the time when they first receive the ACEi or ARB (time of exposure), as otherwise, if they died during that window of time, they would have been assigned to the unexposed group. This would then bias towards an underestimation of the exposure–outcome relationship in favor of the exposure [30], as has indeed been the case in several COVID-19 studies [25].
FIGURE 5.
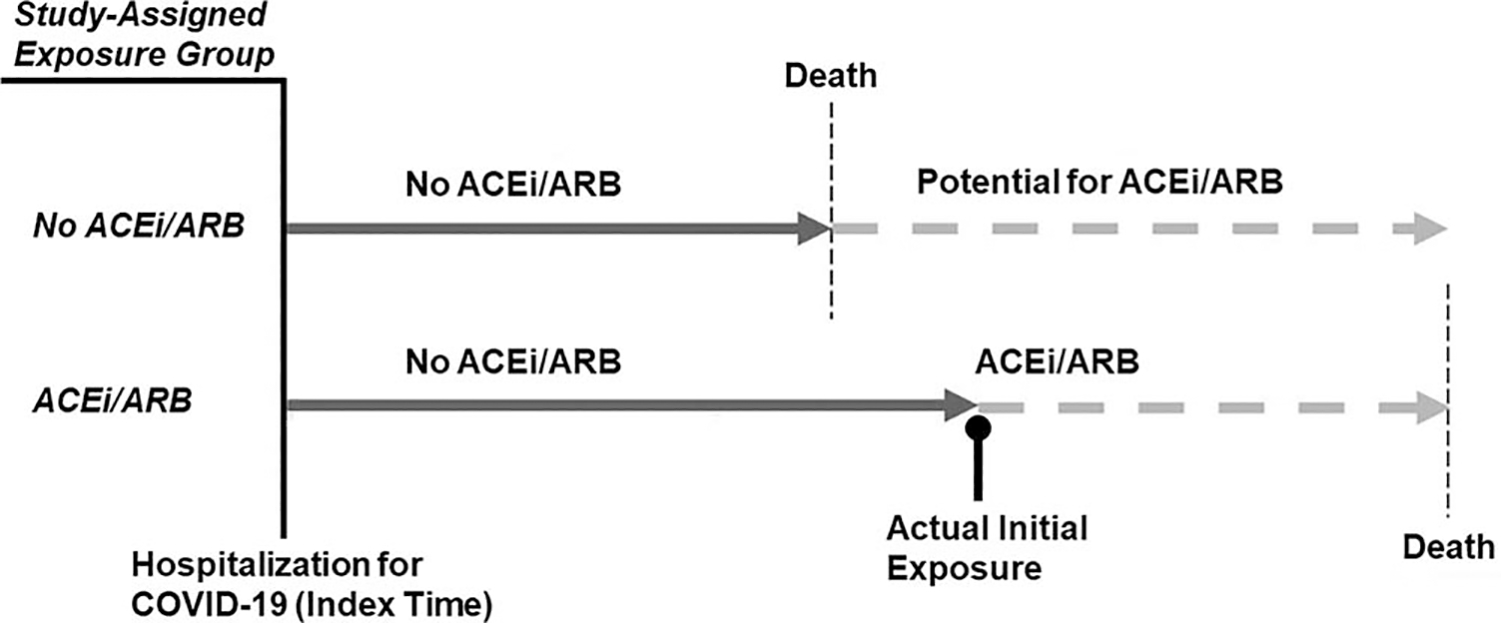
Time-dependent bias in the association between angiotensin-converting enzyme inhibitor/angiotensin II receptor blocker use and outcomes among patients hospitalized with coronavirus disease 2019. Study-assigned exposure status (left side of the figure in italics) is characterized by use of ACEi/ARB at any point (yes/no) during the hospitalization, starting at the time of hospitalization (i.e. index time) but without regard to when exposure occurred during the hospitalization (right side of the figure). Solid dark grey arrows represent no ACEi/ARB exposure while dashed light grey arrows indicate either ACEi/ARB use or potential ACEi/ARB use, if the participant had lived long enough to have the opportunity to take an ACEi/ARB. Note that if one does not account for the exact timing of initial ACEi/ARB exposure (black line with round cap), then study exposure allocation becomes dependent upon survival up to that point in time (i.e. the patient must be stable enough to receive the medication). Thus, exposed individuals cannot die (i.e. are immortal) prior to reaching the time of initial exposure, or else they would be classified as an unexposed individual. This distorts the relationship between ACEi/ARB use and adverse outcomes and biases towards greater survival in the exposed group as those participants classified as unexposed never had the opportunity to be exposed prior to dying. ACEi, angiotensin-converting enzyme inhibitor; ARB, angiotensin II receptor blocker; COVID-19, coronavirus disease 2019.
Lack of information on how exposure status changes over time (i.e. time-varying exposure) introduces another type of time-dependent bias, known as immeasurable time bias. With immeasurable time bias, participants may be defined as being exposed or unexposed for the full duration of the study follow-up period, even if there is insufficient information to determine if or for how long they actually received the medication during that time [32]. For example, studies evaluating inpatient exposure to ACEi/ARB vs. other antihypertensive medications may define someone as being exposed to these medications based on their medication list at the time of admission. However, this approach ignores the fact that ACEi/ARBs are more likely to be held during a hospitalization compared with other antihypertensive medications because of the perceived risk of, or actual occurrence of, acute complications, such as hyperkalemia or acute kidney injury. We introduce immeasurable time bias when both the ACEi/ARB group and the other antihypertensive medication group are erroneously assigned the same accrued exposure time, even though the actual exposure times are unknown and potentially different between the groups. Several studies to date have been at risk of time-dependent bias, as briefly noted by some of the authors in their discussion of their studies’ limitations (Table 1) [12,13,33].
SUGGESTED APPROACHES
We advocate for strategies that separate study design from analysis to minimize the sources of bias described above, which existing literature in this area has not addressed consistently [34,35]. We provide examples of a few methods below and in the Appendix, http://links.lww.com/HJH/B506. In order to optimally investigate these questions, and identify and address these sources of bias, in the context of a causal model approach, we recommend using a cohort study design. We do acknowledge that a case–control study design can be an appropriate approach in select instances.
Study design
It is important to note that there have been very limited data about the effect of ACEi/ARBs on these ‘nontraditional’ outcomes (e.g. risk of mechanical ventilation) from observational studies and clinical trials prior to the pandemic. This limits the assumptions one can make about standard errors and probabilities of the exposure and outcomes, which in turn hinders adequate power and sample size calculations and adds additional uncertainty to estimates of effect sizes and their precision from current investigations of the pandemic. As discussed previously, inclusion and exclusion criteria have the potential to induce selection and collider bias and limit generalizability [15]. To prevent collider bias, one must ensure that the exposure and the outcome do not drive inclusion or selective retention, which can be difficult to do. The analytic phase can introduce collider bias through inappropriate adjustment or stratification on a certain factor. Thoughtfully and intentionally selecting covariates to include in an analysis, based on the causal model and by applying causal diagrams, can help mitigate this concern.
It is generally recommended to further refine the cohort through matching procedures when the distributions of confounding factors in the exposed and unexposed groups do not overlap (i.e. violate exchangeability), such as if the unexposed group is younger on average than the exposed group. Matching participants in the cohort before conducting the analysis reduces model dependence, i.e. study findings remain relatively consistent no matter which analytic approach one chooses. Propensity score matching (i.e. matching exposure groups on the conditional probability of exposure assignment based on observed covariates [36]) is a common approach but is not without limitations, including imbalance of potential confounding factors across exposure groups, residual unmeasured confounding bias, and selection bias because of selection of matches. Helpful alternative approaches include coarsened exact matching and distance-based matching but these have their own limitations [37–39]. Use of the high-dimensional propensity score method may help in situations where there is concern that covariates used for building the propensity score do not necessarily adequately approximate the propensity to treatment [40].
Inherent to which specific question one is asking, one must account for index time, time-varying exposures, and time to outcomes (i.e. follow-up time). Accordingly, it is important to consider the timing of ACEi/ARB exposure for a particular participant, especially for studies investigating question 3. Whether the study defines ACEi/ARB exposure as pre-COVID-19 diagnosis only or the study design and analysis account for continued ACEi/ARB use, or newly prescribed ACEi/ARBs, during the COVID-19 course will have important implications for how we interpret the exposure–outcome relationships [12,13]. Furthermore, certain outcomes that may occur more than once, such as admission to the hospital or acute kidney injury, may be better classified as count data and thus require different analytic approaches.
Analysis
We can apply several analytical techniques to compare groups, including regression models that incorporate the minimally sufficient adjustment set identified by a DAG and models that include the propensity score, either as an adjustment term or as an inverse probability weight [41]. If the objective is to infer causal relationships, we recommend utilizing a separate model for each exposure-outcome to avoid the Table 2 fallacy, which has plagued the interpretation of several COVID-19 studies [42–45]. It is essential to select the confounding factors a priori for each exposure-outcome model by applying a DAG specific to that exposure–outcome relationship. Additionally, it is best to specify the anticipated analyses a priori; hypothesis-generating studies must be clearly defined as such and often have to account for multiple hypothesis testing.
In the context of ACEi/ARB use and either SARS-CoV-2 infection or COVID-19 diagnosis (questions 1 and 2), one optimal approach is to apply a generalized linear model with a log-link and either a binomial or a Poisson distribution for outcome status as a function of ACEi/ARB exposure and to report the effect estimate as a relative risk with the corresponding 95% confidence interval, being mindful of time-dependent exposure [46,47]. We recommend this approach because of the fact that estimating effect sizes with odds ratios (using a logit-link and binomial distribution) can overestimate effect sizes when outcomes are relatively common [48]. To examine ACEi/ARB use and COVID-19 outcomes (question 3), we suggest conducting a time-to-event analysis to account appropriately for censoring and reporting the hazard ratio as the effect estimate of ACEi/ARB use on time to a given outcome (e.g. time from admission to death), with the corresponding 95% confidence interval. In studies evaluating ACEi/ARB use following initial diagnosis of COVID-19, we suggest methods that account for time-varying exposure that address time-dependent bias, such as time-varying Cox proportional hazards modeling and joint modeling. To date, the majority of studies have not employed these approaches [12,13].
We also emphasize that all time-to-event analyses should consider competing risks [49]. Standard time-to-event analyses treat participants who do not experience an event as right-censored, that is, the event could occur after last-known follow-up. A competing risk is another type of event (e.g. death from other causes) that makes reaching the event of interest (e.g. mechanical ventilation) impossible. Failing to account for competing risks can lead to biased estimates of the survival function, as occurred in Grein et als [50,51] study on compassionate use of remdesivir in patients with COVID-19.
Sensitivity analyses
ACEi/ARBs are by definition distinctly different medication classes that act at different parts of the renin–angiotensin system (RAS) and that have significant within-class heterogeneity. As such, we recommend conducting sensitivity analyses, that is, methods to quantify uncertainty in a model because of bias related to assumptions that one makes in the primary analyses [52], to examine three distinct treatment exposure groups: ACEis, ARBs, and other, though to date this has not generally occurred. There are propensity score-based methods to compare three or more exposure groups, such as probit regression [53], generalized boosted models [54], or tree-based methods [55].
Sensitivity analyses, such as the E-value [56], Gamma sensitivity [57], or tipping point analysis [58,59] can assess how sensitive the results are to unmeasured confounding bias. For example, the E-value demonstrates the strength of association required of an unmeasured confounding factor in order to reverse the observed association between the exposure and outcome [56]. Various sensitivity analyses can estimate selection and collider bias as well [28,60,61].
Additional sensitivity analyses may be appropriate to use to address potential time-varying confounding bias, as several time-varying factors may lie on the causal path between ACEi/ARB exposure and COVID-19 outcomes, depending upon the specific point in time. One recommended approach in this setting is to employ marginal structural modeling, which uses stabilized inverse probability of treatment weights (analogous to time-updated propensity scores) to create a pseudo-population in which potential confounding factors are balanced across the population [62,63]. This approach attempts to mimic randomization at various time points and would be particularly useful to evaluate time-updated exposure to ACEi/ARB among hospitalized patients, in order to address time-updated confounding by indication for continuation vs. withdrawal of ACEi/ARBs. To date, no study has utilized this approach.
Sensitivity analyses that employ carefully selected negative controls can help to address unmeasured confounding, information, and selection bias [64]. Negative controls act as surrogate markers for the actual exposure or outcome of interest. If selected appropriately, negative controls should be subject to the same potential sources of bias as the exposure or outcome but would not be expected to have the same exposure–outcome relationship.
Sensitivity analyses accounting for repeated outcome events (i.e. count data) from differential follow-up windows, also known as recurrent event analyses, may also be performed [65]. These methods can provide useful information about prognosis in the setting of recurrent SARS-CoV-2 infection or re-hospitalization, while also improving statistical power to evaluate relationships between the exposure and outcome events that can occur more than once.
Some authors suggest that machine learning and artificial intelligence-based approaches, or even having a large enough data set, may overcome many of the issues described above [66]. However, these approaches are still subject to many of the same limitations as more traditional methodological approaches and may benefit from consideration of a causal model and causal inference methods, including many of the sensitivity analyses described here, especially if the goal of the research question is inference rather than prediction [67].
Effect modification
Effect modification occurs when the magnitude of the association between the exposure and outcome differs across strata or levels of a third factor. Sex and obesity are examples of factors that have been associated with distinctive differences in hypertension phenotype, the RAS (and by extension ACEi/ARB use), and SARS-CoV-2/COVID-19 [68–72]. These factors, therefore, may modify the strength of the effect size between ACEi/ARB use and the outcomes and should be assessed as potential effect-modifying factors, rather than assuming that they are confounding factors. Indeed, inappropriately treating these factors as confounding factors can induce bias. Studies may also consider time and region as effect-modifying factors to help address dynamic changes in testing and indications for hospitalization, for example, that have varied substantially over the course of the pandemic [44]. If present, one should present effect size estimates across strata (including 95% confidence intervals) along with measures of interaction on both the additive and multiplicative scales [73,74].
Incorporating race or ethnicity as factors in these exposure–outcome relationships deserves special attention. Prior research supports potential differential responses to ACEi/ARBs compared with other antihypertensive medication classes (e.g. calcium channel blockers and thiazide diuretics) in patients who are Black vs. those who are not Black [69,75]. However, recent emphasis is now appropriately placed on the complexity of race and ethnicity in biomedical research, especially during the pandemic [76,77]. Race is primarily a social construct that has often been applied inappropriately to biologic (often genetic) risk, despite being a poor marker of this [78]. Rather than race, it would be ideal to use more objective and precise measures of ancestry as well as carefully collected information on distinctive social factors that contribute potentially to disparities across different groups, such as systemic racism, access to healthcare, individual income, education, neighborhood segregation, and social support, depending upon which of these factors are most relevant to the particular research question. Unfortunately, this level of detailed information is often not available, especially from retrospective study designs. We must consider carefully these issues when designing research studies moving forward [79].
Causal mediation
Causal models inform us that we must give special attention to intermediate factors that lie on the causal and temporal paths between an exposure and outcome, as these factors may mediate the causal relationship. As usually occurs, investigators will estimate the total effect (i.e. association) a given exposure has on an outcome. However, in some instances, disentangling the indirect effects an exposure has on an outcome from the direct effects, using causal mediation analysis, allows us to gain insight into how altering or blocking a given intermediate factor on the causal path could alter the outcome. Mediation analysis also allows us to estimate the relative direct effects that several exposures have on an outcome. As often occurs, simply ‘adjusting’ for the intermediate factor in one’s analysis may violate key assumptions and bias one’s results [80]. Mediation analytic methods exist that allow us to disentangle a variety of these direct and indirect effects, including in the presence of time-varying exposures, outcomes, and mediators and in the presence of multiple mediators [81–84]. To date, we are unaware of studies applying these methods in COVID-19 research.
For example, one can apply causal mediation analysis to determine if the RAS does indeed have a causal role in the association between ACEi/ARB use and SARS-CoV-2 infection (Fig. 6). Simply stated, there are two generally opposing theories about the role of the RAS in SARS-CoV-2 and COVID-19:
There is concern, based on animal studies, that ACEi/ARBs could increase ACE2 lung expression, thereby increasing the risk of SARS-CoV-2 infection and possibly development of COVID-19 [1];
SARS-CoV-2 may downregulate ACE2 expression in the lungs, which could increase Ang II (pro-inflammatory) at the expense of suppressing Ang-(1–7) (anti-inflammatory), thereby potentially mediating COVID-19-related acute lung injury and lung fibrosis [8].
FIGURE 6.
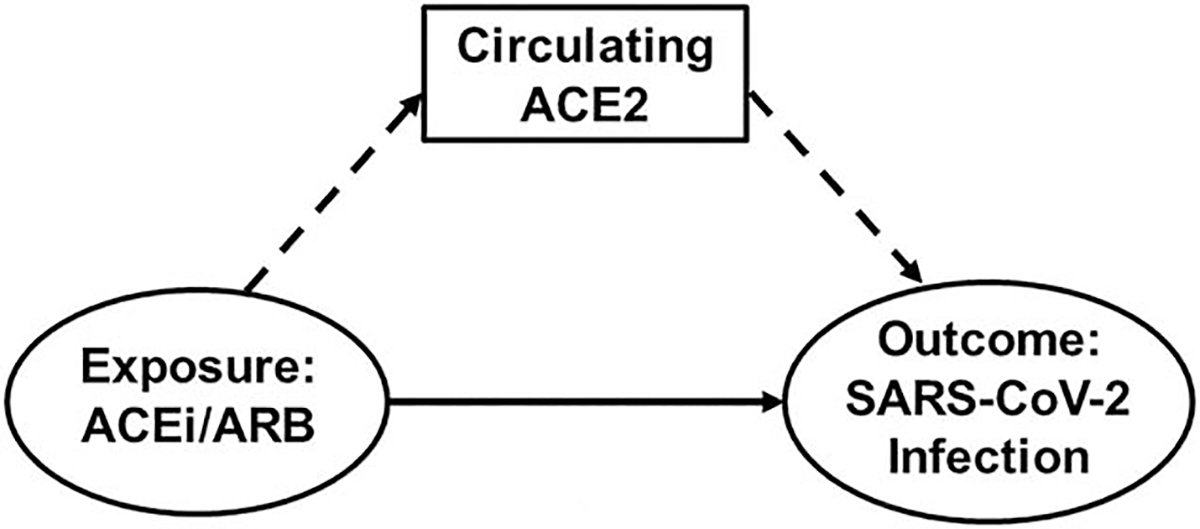
Directed acyclic graph demonstrating that angiotensin-converting enzyme 2 may mediate the association between angiotensin-converting enzyme inhibitor/angiotensin II receptor blocker use and severe acute respiratory syndrome coronavirus 2 infection. ACEi/ARB exert direct effects on SARS-CoV-2 infection (ovals with solid arrow) as well as indirect effects mediated via changes in circulating ACE2 levels (box with dashed arrows), a proxy for ACE2 expression in the lungs. Thus, measurement of circulating ACE2 would serve as a biomarker of infection and could provide mechanistic evidence that ACE2 may be involved in COVID-19 pathophysiology. ACEi, angiotensin-converting enzyme inhibitor; ACE2, angiotensin-converting enzyme 2; ARB, angiotensin II receptor blocker; SARS-CoV-2, severe acute respiratory syndrome coronavirus 2.
In order to use clinical data to investigate these particular theories, we can measure components of the RAS in the blood (e.g. ACE2), as a surrogate biomarker for ACE2 expression in the lungs, and estimate the direct effect of ACEi/ARB use on SARS-CoV-2 infection as well as the indirect effect mediated through ACE2. This could provide vital mechanistic (and therefore, causal) evidence to clarify the RAS’s role in COVID-19. In addition, one can apply causal mediation analysis to data from ongoing clinical trials that are measuring RAS components to better define these causal mechanisms, which traditional clinical trial methods cannot necessarily do [85].
We should note, however, that measurement of RAS peptides and enzymes is complex and susceptible to significant measurement error and variability, which can introduce information bias. Low concentrations, interfering substances, ongoing metabolism, and sequence similarity/cross-reactivity with other angiotensin peptides are important considerations for sample collection, processing, storage, and analysis as well as interpretation of results [70,86–88]. Specific assays require optimal conditions and precise methods, including extraction/purification and validation against mass spectrometry/high-performance liquid chromatography [86,87]. Furthermore, the tissue sources of the RAS in circulation are not known, and normative values do not exist [87]. Thus, appropriate methodology and analysis in experienced laboratories and interpretation of results by experienced investigators are critical in this approach, especially when comparing results across studies and patient populations [89].
CONCLUSION
Well designed observational studies remain crucial to investigate rigorously whether ACEi/ARBs, compared with other antihypertensive medication classes, are associated with an increased risk of SARS-CoV-2 infection, developing COVID-19, and worse outcomes in patients with hypertension. Although multiple recently published observational studies have begun to evaluate these relationships, significant limitations to the interpretation of their results remain. This discussion is highly relevant to related questions pertaining to ACEi/ARB use during the pandemic in patients with heart failure and chronic kidney disease, in whom clinical trials are not ethical. Knowledge of important sources of bias and the high-quality epidemiologic methods needed to address them, using a causal model framework, are critical in evaluating studies investigating this important topic and to applying the results to patients.
Supplementary Material
ACKNOWLEDGEMENTS
Conflicts of interest
L.D.M. has received consulting fees from Acelity and Sanofi. J.B.C. has funding from the NIH (K23-HL133843 and R01-HL153646–01). E.T.J. and J.R. have funding from the Wake Forest Clinical and Translational Science Institute (WF CTSI), which is supported by the NIH National Center for Advancing Translational Sciences (UL1-TR001420). A.M.S. has funding from the NIH (R01-HL146818, L40-HL148910, K23-HL148394).
Abbreviations:
- ACE2
angiotensin-converting enzyme 2
- ACEi
angiotensin-converting enzyme inhibitors
- Ang II
angiotensin II
- Ang-(1–7)
angiotensin-(1–7)
- ARB
angiotensin II receptor blockers
- COVID-19
coronavirus disease 2019
- DAG
directed acyclic graph
- RAS
renin–angiotensin system
- SARS-CoV-2
severe acute respiratory syndrome coronavirus 2
REFERENCES
- 1.Fang L, Karakiulakis G, Roth M. Are patients with hypertension and diabetes mellitus at increased risk for COVID-19 infection? Lancet Respir Med 2020; 8:e21. [DOI] [PMC free article] [PubMed] [Google Scholar]
- 2.Guan WJ, Ni ZY, Hu Y, Liang WH, Ou CQ, He JX, et al. , China Medical Treatment Expert Group for Covid-19. Clinical characteristics of coronavirus disease 2019 in China. N Engl J Med 2020; 382:1708–1720. [DOI] [PMC free article] [PubMed] [Google Scholar]
- 3.Severe outcomes among patients with coronavirus disease 2019 (COVID-19) - United States, 12 February to 16 March 2020. Morb Mortal Wkly Rep 2020; 69:343–346. [DOI] [PMC free article] [PubMed] [Google Scholar]
- 4.Al Kibria GM, Nemirovsky A, Sharmeen A, Day B. Age-stratified prevalence, treatment status, and associated factors of hypertension among US adults following application of the 2017 ACC/AHA guideline. Hypertens Res 2019; 42:1631–1643. [DOI] [PubMed] [Google Scholar]
- 5.Grasselli G, Zangrillo A, Zanella A, Antonelli M, Cabrini L, Castelli A, et al. , COVID-19 Lombardy ICU Network. Baseline characteristics and outcomes of 1591 patients infected with SARS-CoV-2 admitted to ICUs of the Lombardy Region, Italy. JAMA 2020; 323:1574–1581. [DOI] [PMC free article] [PubMed] [Google Scholar]
- 6.von Elm E, Altman DG, Egger M, Pocock SJ, Gøtzsche PC, Vandenbroucke JP, STROBE Initiative. The Strengthening the Reporting of Observational Studies in Epidemiology (STROBE) Statement: guidelines for reporting observational studies. Int J Surg 2014; 12:1495–1499. [DOI] [PubMed] [Google Scholar]
- 7.Danser AHJ, Epstein M, Batlle D. Renin-angiotensin system blockers and the COVID-19 pandemic: at present there is no evidence to abandon renin-angiotensin system blockers. Hypertension 2020; 75:1382–1385. [DOI] [PMC free article] [PubMed] [Google Scholar]
- 8.South AM, Diz D, Chappell MC. COVID-19, ACE2 and the cardiovascular consequences. Am J Physiol Heart Circ Physiol 2020; 318:H1084–H1090. [DOI] [PMC free article] [PubMed] [Google Scholar]
- 9.South AM, Tomlinson L, Edmonston D, Hiremath S, Sparks MA. Controversies of renin–angiotensin system inhibition during the COVID-19 pandemic. Nat Rev Nephrol 2020; 16:305–307. [DOI] [PMC free article] [PubMed] [Google Scholar]
- 10.Sparks MA, South A, Welling P, Luther JM, Cohen J, Byrd JB, et al. Sound science before quick judgement regarding RAS blockade in COVID-19. Clin J Am Soc Nephrol 2020; 15:714–716. [DOI] [PMC free article] [PubMed] [Google Scholar]
- 11.Li J, Wang X, Chen J, Zhang H, Deng A. Association of renin-angiotensin system inhibitors with severity or risk of death in patients with hypertension hospitalized for coronavirus disease 2019 (COVID-19) infection in Wuhan, China. JAMA Cardiol 2020; 5:1–6. [DOI] [PMC free article] [PubMed] [Google Scholar]
- 12.Mehta N, Kalra A, Nowacki AS, Anjewierden S, Han Z, Bhat P, et al. Association of use of angiotensin-converting enzyme inhibitors and angiotensin II receptor blockers with testing positive for coronavirus disease 2019 (COVID-19). JAMA Cardiol 2020; [Epub ahead of print]. [DOI] [PMC free article] [PubMed] [Google Scholar]
- 13.Reynolds HR, Adhikari S, Pulgarin C, Troxel AB, Iturrate E, Johnson SB, et al. Renin-angiotensin-aldosterone system inhibitors and risk of Covid-19. N Engl J Med 2020; 382:2441–2448. [DOI] [PMC free article] [PubMed] [Google Scholar]
- 14.Jarcho JA, Ingelfinger JR, Hamel MB, D’Agostino RB, Harrington DP. Inhibitors of the renin–angiotensin–aldosterone system and Covid-19. N Engl J Med 2020; 382:2462–2464. [DOI] [PMC free article] [PubMed] [Google Scholar]
- 15.Thomas LE, Bonow RO, Pencina MJ. Understanding observational treatment comparisons in the setting of coronavirus disease 2019 (COVID-19). JAMA Cardiol 2020; [Epub ahead of print]. [DOI] [PubMed] [Google Scholar]
- 16.Hernán MA, Robins JM. Using big data to emulate a target trial when a randomized trial is not available. Am J Epidemiol 2016; 183:758–764. [DOI] [PMC free article] [PubMed] [Google Scholar]
- 17.Höfler M Causal inference based on counterfactuals. BMC Med Res Methodol 2005; 5:28. [DOI] [PMC free article] [PubMed] [Google Scholar]
- 18.Huszar F inFERENCe. Causal Inference 3: Counterfactuals. Available at: https://www.inference.vc/causal-inference-3-counterfactuals. [Accessed 31 July 2020]
- 19.Greenland S, Robins JM. Identifiability, exchangeability, and epidemiological confounding. Int J Epidemiol 1986; 15:413–419. [DOI] [PubMed] [Google Scholar]
- 20.Pearl J An introduction to causal inference. Int J Biostat 2010; 6:7–17. [DOI] [PMC free article] [PubMed] [Google Scholar]
- 21.Petersen ML, van der Laan MJ. Causal models and learning from data: integrating causal modeling and statistical estimation. Epidemiology 2014; 25:418–426. [DOI] [PMC free article] [PubMed] [Google Scholar]
- 22.Stovitz SD, Shrier I. Causal inference for clinicians. BMJ Evid Based Med 2019; 24:109–112. [DOI] [PubMed] [Google Scholar]
- 23.Shrier I, Platt RW. Reducing bias through directed acyclic graphs. BMC Med Res Methodol 2008; 8:70. [DOI] [PMC free article] [PubMed] [Google Scholar]
- 24.Field-Fote E Mediators and moderators, confounders and covariates: exploring the variables that illuminate or obscure the ‘active ingredients’ in neurorehabilitation. J Neurol Phys Ther 2019; 43:. [DOI] [PubMed] [Google Scholar]
- 25.Chaudhri I, Koraishy FM, Bolotova O, Yoo J, Marcos LA, Taub E, et al. Outcomes associated with the use of renin-angiotensin-aldosterone system blockade in hospitalized patients with SARS-CoV-2 infection. Kidney360 2020; 1:801–809. [DOI] [PMC free article] [PubMed] [Google Scholar]
- 26.Cole SR, Platt RW, Schisterman EF, Chu H, Westreich D, Richardson D, et al. Illustrating bias due to conditioning on a collider. Int J Epidemiol 2010; 39:417–420. [DOI] [PMC free article] [PubMed] [Google Scholar]
- 27.Hernán MA, Hernández-Díaz S, Robins JM. A structural approach to selection bias. Epidemiology 2004; 15:615–625. [DOI] [PubMed] [Google Scholar]
- 28.Griffith G, Morris TT, Tudball M, Herbert A, Mancano G, Pike L, et al. Collider bias undermines our understanding of COVID-19 disease risk and severity [preprint]. medRxiv 2020. [DOI] [PMC free article] [PubMed] [Google Scholar]
- 29.Shahar E Causal diagrams for encoding and evaluation of information bias. J Eval Clin Pract 2009; 15:436–440. [DOI] [PubMed] [Google Scholar]
- 30.Wolkewitz M, Allignol A, Harbarth S, de Angelis G, Schumacher M, Beyersmann J. Time-dependent study entries and exposures in cohort studies can easily be sources of different and avoidable types of bias. J Clin Epidemiol 2012; 65:1171–1180. [DOI] [PubMed] [Google Scholar]
- 31.Redelmeier DA, Singh SM. Survival in Academy Award-winning actors and actresses. Ann Intern Med 2001; 134:955–962. [DOI] [PubMed] [Google Scholar]
- 32.Suissa S Immeasurable time bias in observational studies of drug effects on mortality. Am J Epidemiol 2008; 168:329–335. [DOI] [PubMed] [Google Scholar]
- 33.Zhang P, Zhu L, Cai J, Lei F, Qin JJ, Xie J, et al. Association of inpatient use of angiotensin converting enzyme inhibitors and angiotensin II receptor blockers with mortality among patients with hypertension hospitalized with COVID-19. Circ Res 2020; 126:1671–1681. [DOI] [PMC free article] [PubMed] [Google Scholar]
- 34.Goodman SN, Schneeweiss S, Baiocchi M. Using design thinking to differentiate useful from misleading evidence in observational research. JAMA 2017; 317:705–707. [DOI] [PubMed] [Google Scholar]
- 35.Ho DE, Imai K, King G, Stuart EA. Matching as nonparametric pre-processing for reducing model dependence in parametric causal inference. Polit Anal 2007; 15:199–236. [Google Scholar]
- 36.Rosenbaum PR, Rubin DB. The central role of the propensity score in observational studies for causal effects. Biometrika 1983; 70:41–55. [Google Scholar]
- 37.Austin PC. An introduction to propensity score methods for reducing the effects of confounding in observational studies. Multivariate Behav Res 2011; 46:399–424. [DOI] [PMC free article] [PubMed] [Google Scholar]
- 38.King G, Nielsen R. Why propensity scores should not be used for matching. Polit Anal 2019; 27:435–454. [Google Scholar]
- 39.Diamond A, Sekhon JS. Genetic matching for estimating causal effects: a general multivariate matching method for achieving balance in observational studies. Rev Econ Stat 2013; 95:932–945. [Google Scholar]
- 40.Schneeweiss S, Rassen JA, Glynn RJ, Avorn J, Mogun H, Brookhart MA. High-dimensional propensity score adjustment in studies of treatment effects using healthcare claims data. Epidemiology 2009; 20:512–522. [DOI] [PMC free article] [PubMed] [Google Scholar]
- 41.Austin PC, Stuart EA. Moving towards best practice when using inverse probability of treatment weighting (IPTW) using the propensity score to estimate causal treatment effects in observational studies. Stat Med 2015; 34:3661–3679. [DOI] [PMC free article] [PubMed] [Google Scholar]
- 42.VanderWeele TJ, Staudt N. Causal diagrams for empirical legal research: a methodology for identifying causation, avoiding bias and interpreting results. Law Probab Risk 2011; 10:329–354. [DOI] [PMC free article] [PubMed] [Google Scholar]
- 43.Westreich D, Greenland S. The Table 2 Fallacy: presenting and interpreting confounder and modifier coefficients. Am J Epidemiol 2013; 177:292–298. [DOI] [PMC free article] [PubMed] [Google Scholar]
- 44.Mancia G, Rea F, Ludergnani M, Apolone G, Corrao G. Renin–angiotensin–aldosterone system blockers and the risk of covid-19. N Engl J Med 2020; 382:2431–2440. [DOI] [PMC free article] [PubMed] [Google Scholar]
- 45.Williamson EJ, Walker AJ, Bhaskaran K, Bacon S, Bates C, Morton CE, et al. Factors associated with COVID-19-related death using Open-SAFELY. Nature 2020; 584:430–436. [DOI] [PMC free article] [PubMed] [Google Scholar]
- 46.Chen W, Qian L, Shi J, Franklin M. Comparing performance between log-binomial and robust Poisson regression models for estimating risk ratios under model misspecification. BMC Med Res Methodol 2018; 18:63–163. [DOI] [PMC free article] [PubMed] [Google Scholar]
- 47.Greenland S Model-based estimation of relative risks and other epidemiologic measures in studies of common outcomes and in case-control studies. Am J Epidemiol 2004; 160:301–305. [DOI] [PubMed] [Google Scholar]
- 48.Greenland S Interpretation and choice of effect measures in epidemiologic analyses. Am J Epidemiol 1987; 125:761–768. [DOI] [PubMed] [Google Scholar]
- 49.Putter H, Fiocco M, Geskus RB. Tutorial in biostatistics: competing risks and multistate models. Stat Med 2007; 26:2389–2430. [DOI] [PubMed] [Google Scholar]
- 50.Grein J, Ohmagari N, Shin D, Diaz G, Asperges E, Castagna A, et al. Compassionate use of remdesivir for patients with severe Covid-19. N Engl J Med 2020; 382:2327–2336. [DOI] [PMC free article] [PubMed] [Google Scholar]
- 51.Bonovas S, Piovani D. Comment on ‘Compassionate use of remdesivir in Covid-19’. N Engl J Med 2020; 382:e101. [DOI] [PubMed] [Google Scholar]
- 52.Ding P, VanderWeele TJ. Sensitivity analysis without assumptions. Epidemiology 2016; 27:368–377. [DOI] [PMC free article] [PubMed] [Google Scholar]
- 53.Spreeuwenberg MD, Bartak A, Croon MA, Hagenaars JA, Busschbach JJ, Andrea H, et al. The multiple propensity score as control for bias in the comparison of more than two treatment arms: an introduction from a case study in mental health. Med Care 2010; 48:166–174. [DOI] [PubMed] [Google Scholar]
- 54.McCaffrey DF, Griffin BA, Almirall D, Slaughter ME, Ramchand R, Burgette LF. A tutorial on propensity score estimation for multiple treatments using generalized boosted models. Stat Med 2013; 32:3388–3414. [DOI] [PMC free article] [PubMed] [Google Scholar]
- 55.Jung SH, Chi SA, Ahn HJ. K-Sample comparisons using propensity analysis. Biom J 2019; 61:698–713. [DOI] [PMC free article] [PubMed] [Google Scholar]
- 56.VanderWeele TJ, Ding P. Sensitivity analysis in observational research: introducing the E-value. Ann Intern Med 2017; 167:268–274. [DOI] [PubMed] [Google Scholar]
- 57.Rosenbaum PR. Observational studies. New York: Springer Science & Business Media; 2002. [Google Scholar]
- 58.Lin DY, Psaty BM, Kronmal RA. Assessing the sensitivity of regression results to unmeasured confounders in observational studies. Biometrics 1998; 54:948–963. [PubMed] [Google Scholar]
- 59.D’Agostino McGowan L CRAN R-Project. CRAN - Package tipr. Available at: https://CRAN.R-project.org/package=tipr. [Accessed 23 June 2020]
- 60.Smith LH, Mathur SMB, VanderWeele TJ. Multiple-bias sensitivity analysis using bounds [preprint]. arXiv 2020; [Epub ahead of print]. [DOI] [PMC free article] [PubMed] [Google Scholar]
- 61.Smith LH, VanderWeele TJ. Bounding bias due to selection. Epidemiology 2019; 30:509–516. [DOI] [PMC free article] [PubMed] [Google Scholar]
- 62.Cole SR, Hernán MA. Constructing inverse probability weights for marginal structural models. Am J Epidemiol 2008; 168:656–664. [DOI] [PMC free article] [PubMed] [Google Scholar]
- 63.Joffe MM, Ten Have TR, Feldman HI, Kimmel SE. Model selection, confounder control, and marginal structural models. Am Stat 2004; 58:272–279. [Google Scholar]
- 64.Arnold BF, Ercumen A, Benjamin-Chung J, Colford JM Jr. Brief report: negative controls to detect selection bias and measurement bias in epidemiologic studies. Epidemiology 2016; 27:637–641. [DOI] [PMC free article] [PubMed] [Google Scholar]
- 65.Xia M, Murray S, Tayob N. Nonparametric group sequential methods for recurrent and terminal events from multiple follow-up windows. Stat Med 2019; 38:5657–5669. [DOI] [PubMed] [Google Scholar]
- 66.Ferri-García R, Rueda MDM. Propensity score adjustment using machine learning classification algorithms to control selection bias in online surveys. PLoS One 2020; 15:e0231500. [DOI] [PMC free article] [PubMed] [Google Scholar]
- 67.Fang G, Annis IE, Elston-Lafata J, Cykert S. Applying machine learning to predict real-world individual treatment effects: insights from a virtual patient cohort. J Am Med Inform Assoc 2019; 26:977–988. [DOI] [PMC free article] [PubMed] [Google Scholar]
- 68.Garg S, Kim L, Whitaker M, O’Halloran A, Cummings C, Holstein R, et al. Hospitalization rates and characteristics of patients hospitalized with laboratory-confirmed coronavirus disease 2019 - COVID-NET, 14 States, March 1–30, 2000. Morb Mortal Wkly Rep 2020; 69:458–464. [DOI] [PMC free article] [PubMed] [Google Scholar]
- 69.South AM, Arguelles L, Finer G, Langman CB. Race, obesity, and the renin-angiotensin-aldosterone system: treatment response in children with primary hypertension. Pediatr Nephrol 2017; 32:1585–1594. [DOI] [PubMed] [Google Scholar]
- 70.South AM, Nixon PA, Chappell MC, Diz DI, Russell GB, Jensen ET, et al. Association between preterm birth and the renin—angiotensin system in adolescence: influence of sex and obesity. J Hypertens 2018; 36:2092–2101. [DOI] [PMC free article] [PubMed] [Google Scholar]
- 71.Xie X, Chen J, Wang X, Zhang F, Liu Y. Age- and gender-related difference of ACE2 expression in rat lung. Life Sci 2006; 78:2166–2171. [DOI] [PMC free article] [PubMed] [Google Scholar]
- 72.Cohen JB. Hypertension in obesity and the impact of weight loss. Curr Cardiol Rep 2017; 19:98. [DOI] [PMC free article] [PubMed] [Google Scholar]
- 73.de Abajo FJ, Rodríguez-Martín S, Lerma V, Mejía-Abril G, Aguilar M, García-Luque A, et al. , MED-ACE2-COVID19 study group. Use of renin-angiotensin-aldosterone system inhibitors and risk of COVID-19 requiring admission to hospital: a case-population study. Lancet 2020; 395:1705–1714. [DOI] [PMC free article] [PubMed] [Google Scholar]
- 74.Knol MJ, VanderWeele TJ. Recommendations for presenting analyses of effect modification and interaction. Int J Epidemiol 2012; 41:514–520. [DOI] [PMC free article] [PubMed] [Google Scholar]
- 75.Wright JT Jr, Dunn JK, Cutler JA, Davis BR, Cushman WC, Ford CE, et al. , ALLHAT Collaborative Research Group. Outcomes in hypertensive black and nonblack patients treated with chlorthalidone, amlodipine, and lisinopril. JAMA 2005; 293:1595–1608. [DOI] [PubMed] [Google Scholar]
- 76.Millett GA, Jones AT, Benkeser D, Baral S, Mercer L, Beyrer C, et al. Assessing differential impacts of COVID-19 on black communities. Ann Epidemiol 2020; 47:37–44. [DOI] [PMC free article] [PubMed] [Google Scholar]
- 77.Abbasi J Taking a closer look at COVID-19, health inequities, and racism. JAMA 2020; 324:427–429. [DOI] [PubMed] [Google Scholar]
- 78.Fontanarosa PB, Bauchner H. Race, ancestry, and medical research. JAMA 2018; 320:1539–1540. [DOI] [PubMed] [Google Scholar]
- 79.Eneanya ND, Yang W, Reese PP. Reconsidering the consequences of using race to estimate kidney function. JAMA 2019; 322:113–114. [DOI] [PubMed] [Google Scholar]
- 80.VanderWeele TJ. Mediation analysis: a practitioner’s guide. Annu Rev Public Health 2016; 37:17–32. [DOI] [PubMed] [Google Scholar]
- 81.Chen YH, Mukherjee B, Ferguson KK, Meeker JD, VanderWeele TJ. Mediation formula for a binary outcome and a time-varying exposure and mediator, accounting for possible exposure-mediator interaction. Am J Epidemiol 2016; 184:157–159. [DOI] [PMC free article] [PubMed] [Google Scholar]
- 82.VanderWeele TJ. A unification of mediation and interaction: a 4-way decomposition. Epidemiology 2014; 25:749–761. [DOI] [PMC free article] [PubMed] [Google Scholar]
- 83.VanderWeele TJ, Tchetgen Tchetgen EJ. Mediation analysis with time varying exposures and mediators. J R Stat Soc Series B Stat Methodol 2017; 79:917–938. [DOI] [PMC free article] [PubMed] [Google Scholar]
- 84.Valente MJ, Rijnhart JJM, Smyth HL, Muniz FB, MacKinnon DP. Causal mediation programs in R, Mplus, SAS, SPSS, and Stata. Struct Equ Model 2020; [Epub ahead of print]. [DOI] [PMC free article] [PubMed] [Google Scholar]
- 85.Lee H, Herbert RD, Lamb SE, Moseley AM, McAuley JH. Investigating causal mechanisms in randomised controlled trials. Trials 2019; 20:524. [DOI] [PMC free article] [PubMed] [Google Scholar]
- 86.Brosnihan KB, Chappell MC. Measurement of angiotensin peptides: HPLC-RIA. Methods Mol Biol 2017; 1527:81–99. [DOI] [PMC free article] [PubMed] [Google Scholar]
- 87.Chappell MC. Biochemical evaluation of the renin-angiotensin system: the good, bad, and absolute? Am J Physiol Heart Circ Physiol 2016; 310:H137–H152. [DOI] [PMC free article] [PubMed] [Google Scholar]
- 88.South AM, Shaltout HA, Washburn LK, Hendricks AS, Diz DI, Chappell Mark C. Fetal programming and the angiotensin-(1–7) axis: a review of the experimental and clinical data. Clin Sci 2019; 133:55–74. [DOI] [PMC free article] [PubMed] [Google Scholar]
- 89.Sparks MA, South AM, Badley AD, Baker-Smith CM, Batlle D, Bozkurt B, et al. Severe acute respiratory syndrome coronavirus 2, COVID-19, and the renin-angiotensin system: pressing needs and best research practices. Hypertension 2020; 76:1350–1367. [DOI] [PMC free article] [PubMed] [Google Scholar]
- 90.Lopes RD, Macedo AVS, de Barros ESPGM, Moll-Bernardes RJ, Feldman A, D’Andréa Saba Arruda G et al. Continuing versus suspending angiotensin-converting enzyme inhibitors and angiotensin receptor blockers: Impact on adverse outcomes in hospitalized patients with severe acute respiratory syndrome coronavirus 2 (SARS-CoV-2). Am Heart J 2020; 226:49–59. [DOI] [PMC free article] [PubMed] [Google Scholar]
Associated Data
This section collects any data citations, data availability statements, or supplementary materials included in this article.