In this study, Trela et al. delineate the cellular mechanisms governing early mammary gland development and find that its initial growth is primarily accomplished by cell migration. Moreover, they suggest that mammary bud invagination is driven by contractile cells encircling the bud—the ring cells.
Abstract
The mammary gland develops from the surface ectoderm during embryogenesis and proceeds through morphological phases defined as placode, hillock, bud, and bulb stages followed by branching morphogenesis. During this early morphogenesis, the mammary bud undergoes an invagination process where the thickened bud initially protrudes above the surface epithelium and then transforms to a bulb and sinks into the underlying mesenchyme. The signaling pathways regulating the early morphogenetic steps have been identified to some extent, but the underlying cellular mechanisms remain ill defined. Here, we use 3D and 4D confocal microscopy to show that the early growth of the mammary rudiment is accomplished by migration-driven cell influx, with minor contributions of cell hypertrophy and proliferation. We delineate a hitherto undescribed invagination mechanism driven by thin, elongated keratinocytes—ring cells—that form a contractile rim around the mammary bud and likely exert force via the actomyosin network. Furthermore, we show that conditional deletion of nonmuscle myosin IIA (NMIIA) impairs invagination, resulting in abnormal mammary bud shape.
Introduction
Morphogenesis, a process crucial in the development of multicellular organisms, produces the complex shapes of an adult body. It requires orchestration of cell behaviors that lead to tissue deformation, such as lengthening, narrowing, bending, folding, and branching. At the cellular level, these events are mediated by tightly coordinated cell shape alterations, rearrangements, proliferation, apoptosis, and cell migration (Montell, 2008). Much of our understanding of coordinated cellular morphogenetic mechanisms comes from studies in single-layered tissues and mechanisms such as apical constriction during vertebrate neural tube closure and convergent extension in Drosophila germband elongation (St Johnston and Sanson, 2011). These processes require a subcellular force that is often generated and propagated to neighboring cells by an intracellular contractile network of actin filaments, actin cross-linkers, and myosin proteins (Munjal and Lecuit, 2014). Epithelial cells are tightly connected by lateral junctions and highly polarized with well-defined apical, lateral, and basal domains. Despite this tight adhesiveness and stereotypic structural organization, epithelial tissues are dynamic throughout the life of an animal. Morphogenetic processes are crucial for proper development, yet these mechanisms are poorly characterized in complex, stratified tissues.
One such polarized and tightly adhesive epithelium is the mammalian epidermis, which develops from the surface ectoderm as a monolayer of epithelial cells that, during the course of development, undergoes stratification to generate multiple differentiated cell layers (M’Boneko and Merker, 1988). During embryogenesis, the surface ectoderm also gives rise to ectodermal appendages including the hair follicle, tooth, feather, sweat, and mammary glands. Development of these complex organs involves critical epithelial–mesenchymal interactions ensuring tightly regulated cell fate specification and coordinated cellular response to molecular cues that are shared among ectodermal organs but with exclusive combination (Biggs and Mikkola, 2014). Their early development proceeds through remarkably similar morphological phases, the first morphological sign being formation of local epithelial thickenings called placodes, followed by progression to the bud stage through invagination into the underlying mesenchymal tissue. Thereafter, morphogenesis of ectodermal appendages diverges, ultimately giving rise to a set of diverse organs, each with a unique form and function (Pispa and Thesleff, 2003).
Although unraveling the cellular morphogenetic mechanisms governing organogenesis is more challenging in mammals than in simpler organisms, recent years have witnessed great progress in understanding these processes in ectodermal appendages. The formation of the placode, a lens-shaped, multilayered epithelial thickening elevated above the surface epithelium, serves as an ideal model to study cellular mechanisms driving epithelial morphogenesis of multilayered structures. In developing teeth, the transition from the placode to the bud stage and accompanying invagination is achieved through a combination of cell proliferation and contractile canopy of superficially located cells that pull inward the placodal cells, thereby bending the epithelium (Ahtiainen et al., 2016; Panousopoulou and Green, 2016). Force required for this transition is generated by the actomyosin network. Morphogenesis of the hair follicle placode is governed by cell compaction and centripetal migration toward the prospective placode center (Ahtiainen et al., 2014). Mechanisms driving hair follicle invagination are still poorly understood, but the ensuing downgrowth depends on proliferation of the suprabasally located stem cell precursors (Ouspenskaia et al., 2016).
The mammary gland is a specialized branched organ characteristic for all mammals. Its development begins with the appearance of transit stripes of molecularly distinct epithelial cells that emerge at the dorso-ventral border of the mouse embryo flank at embryonic day (E) 10.5 (Veltmaat et al., 2004). Subsequently, five pairs of placodes form at conserved positions on each flank. Placodes transit through the hillock and bud stages and submerge into the underlying mesenchyme through an invagination process (Veltmaat et al., 2003; Propper et al., 2013). Thereafter, the mammary rudiment grows relatively slowly until a sprout forms that begins branching morphogenesis after reaching the secondary mammary mesenchyme, the precursor of the adult fatty stroma (Cowin and Wysolmerski, 2010).
The molecular and cellular mechanisms driving mammary branching morphogenesis have been studied extensively, yet embryonic development is poorly understood (Myllymäki and Mikkola, 2019). The signaling pathways regulating early development are described to some extent, though. Functional studies have identified Wnt, FGF, and the tumor necrosis factor family ligand ectodysplasin (Eda) as pathways essential for placode and bud formation (Chu et al., 2004; Mailleux et al., 2002; Mustonen et al., 2003; Mustonen et al., 2004). However, the cellular processes involved still remain elusive, although existing evidence suggests that cell proliferation plays a minor role in placode formation (Balinsky, 1950; Propper, 1978; Lee et al., 2011). In particular, the process of epithelial invagination, a fundamental step in the development of most organs, has not been explored. Here, we use a combination of high-resolution, whole-mount 3D and 4D confocal microscopy; quantitative image analysis; and genetically modified mouse mutants to address these questions.
Results
Cellular hypertrophy plays a minor role in early mammary development
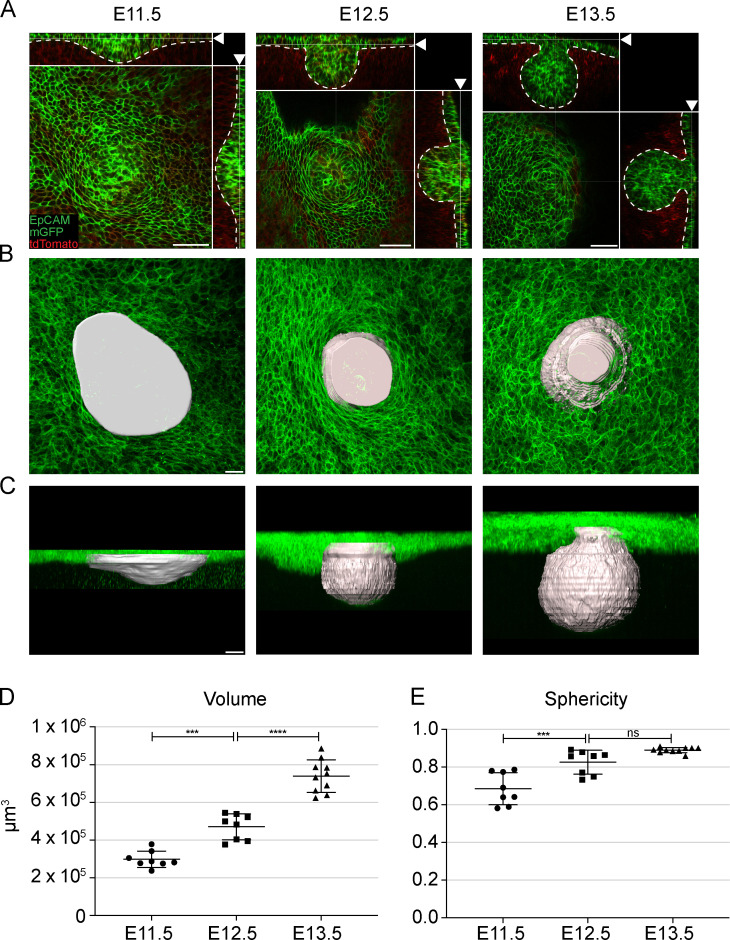
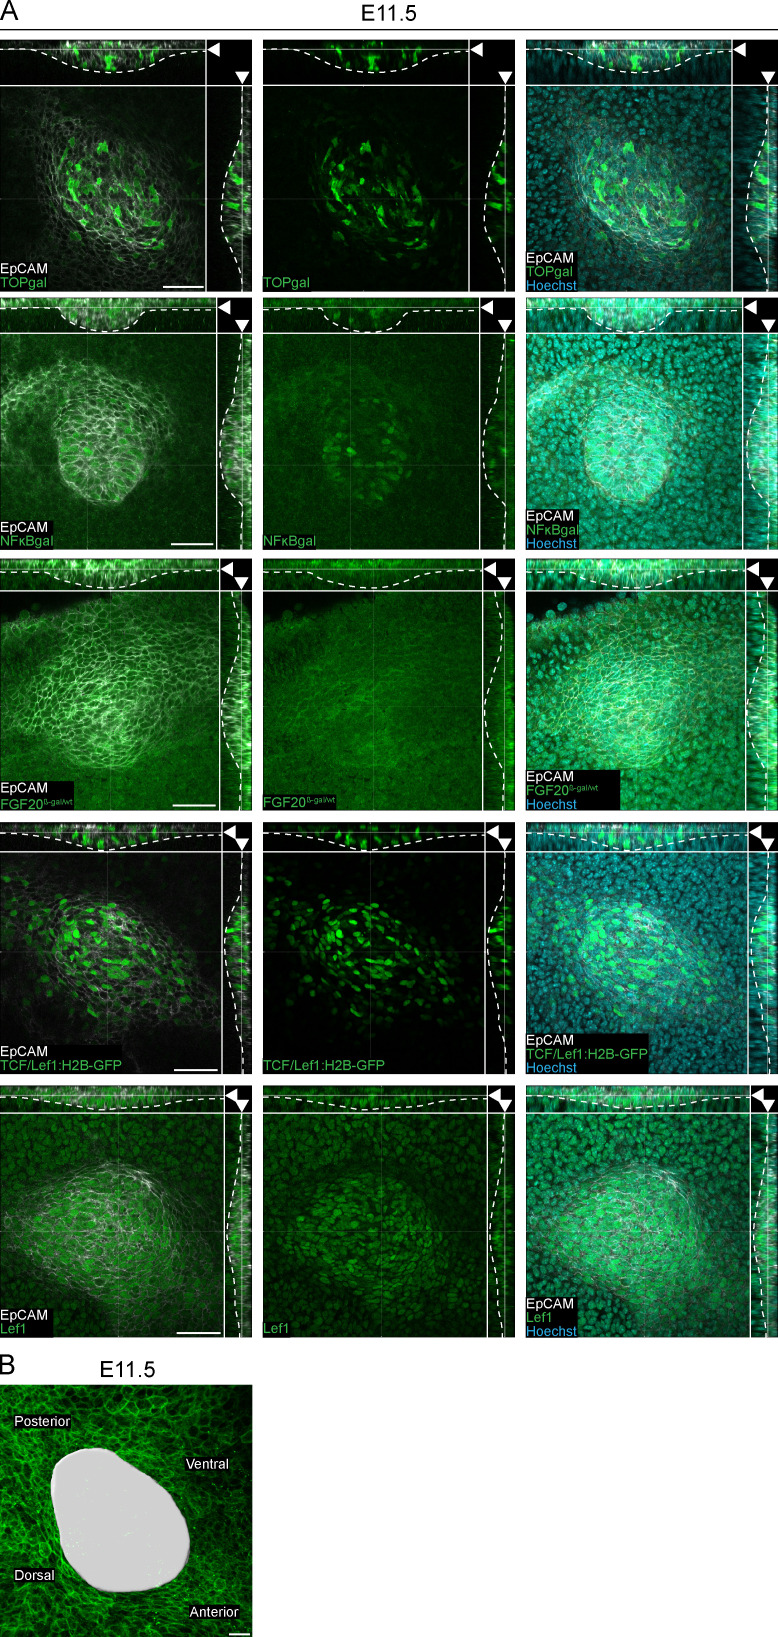
To characterize early mammogenesis, we first analyzed mammary primordium size and shape at the placode (E11.5), hillock (E12.5), and bulb (E13.5) stages by using the K14-Cre/mTmG mouse model and 3D whole-mount imaging with confocal microscopy (Fig. 1 A). Because formation of mammary placodes is asynchronous, we focused on mammary bud 3, which is the first to form and is easily accessible. As no known early markers are specifically expressed at this stage (Fig. S1 A), we used the stereotypic appendage morphology to manually surface render mammary rudiments. At the placode stage, 3D surface rendering revealed a comet-shaped indentation elongated along the anterior-posterior axis, which enlarged in size and deepened more prominently into the underlying mesenchyme at the hillock stage (Fig. 1, B and C; and Fig. S1 B). A day later, a further increase in size was apparent and the “neck” of the bulb became evident (Fig. 1, B and C). Quantification showed that the volume increased by 2.5-fold between placode and bulb stages (Fig. 1 D), while the shape changed from relatively flat into a round sphere (Fig. 1 E).
Figure 1.
Growth of the mammary rudiment during early developmental stages. (A) Optical sections (planar and sagittal views; arrowhead indicates section plane) of confocal microscopy images from K14-Cre/mTmG mouse mammary rudiments at placode (E11.5), hillock (E12.5), and bulb (E13.5) stages; epithelium in green (membrane-bound GFP and EpCAM) and mesenchyme in red. Dashed line marks the epithelial-mesenchymal border. Scale bar, 50 µm. (B and C) Planar and sagittal views of maximum intensity projections of epithelial tissue; rendered surfaces of mammary rudiments in white. Scale bar, 20 µm. (D and E) Quantification of volume (D) and sphericity (E) of mammary rudiments using rendered surfaces. One-way ANOVA with Šidák’s post hoc comparison; ***, P ≤ 0.001; ****, P ≤ 0.0001; nE11.5 = 8; nE12.5 = 8; nE13.5 = 10. Data are presented as mean ± SD.
Figure S1.
Expression of mammary fate markers at placode stage. (A) Planar and sagittal views of confocal whole-mount images of samples from TOP-gal, NF-κB-gal, FGF20β-gal/wt, and TCF/Lef1:H2B-GFP reporter mouse models or wild-type mouse at E11.5 (arrowhead indicates section plane). Expression of β-galactosidase or Lef1 was detected by the immunofluorescent staining (green) in the β-gal reporter or wild-type samples, respectively. All samples were stained with epithelial marker EpCAM (white) and nuclear marker Hoechst (cyan). Dashed line marks the epithelial-mesenchymal border. Scale bar, 50 µm. (B) Planar view showing maximum intensity projections of epithelial tissue (K14-Cre; mTmG) at E11.5. Surface rendering (white) of mammary placode 3 in respect to body axes. Scale bar, 20 µm.
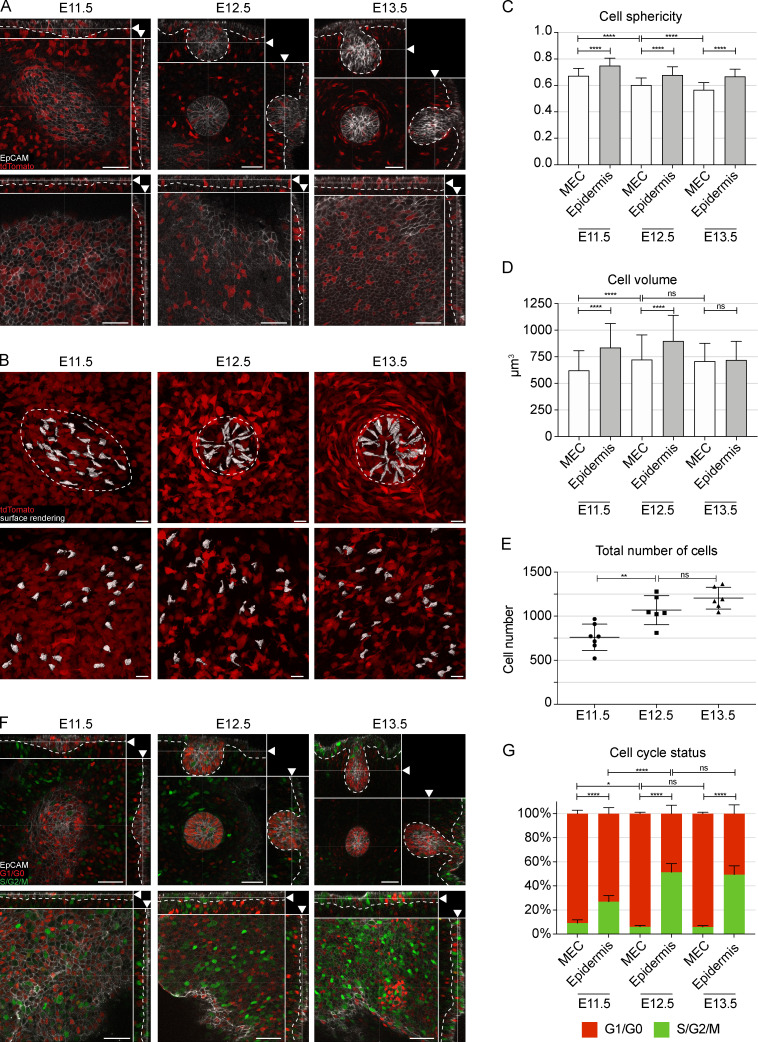
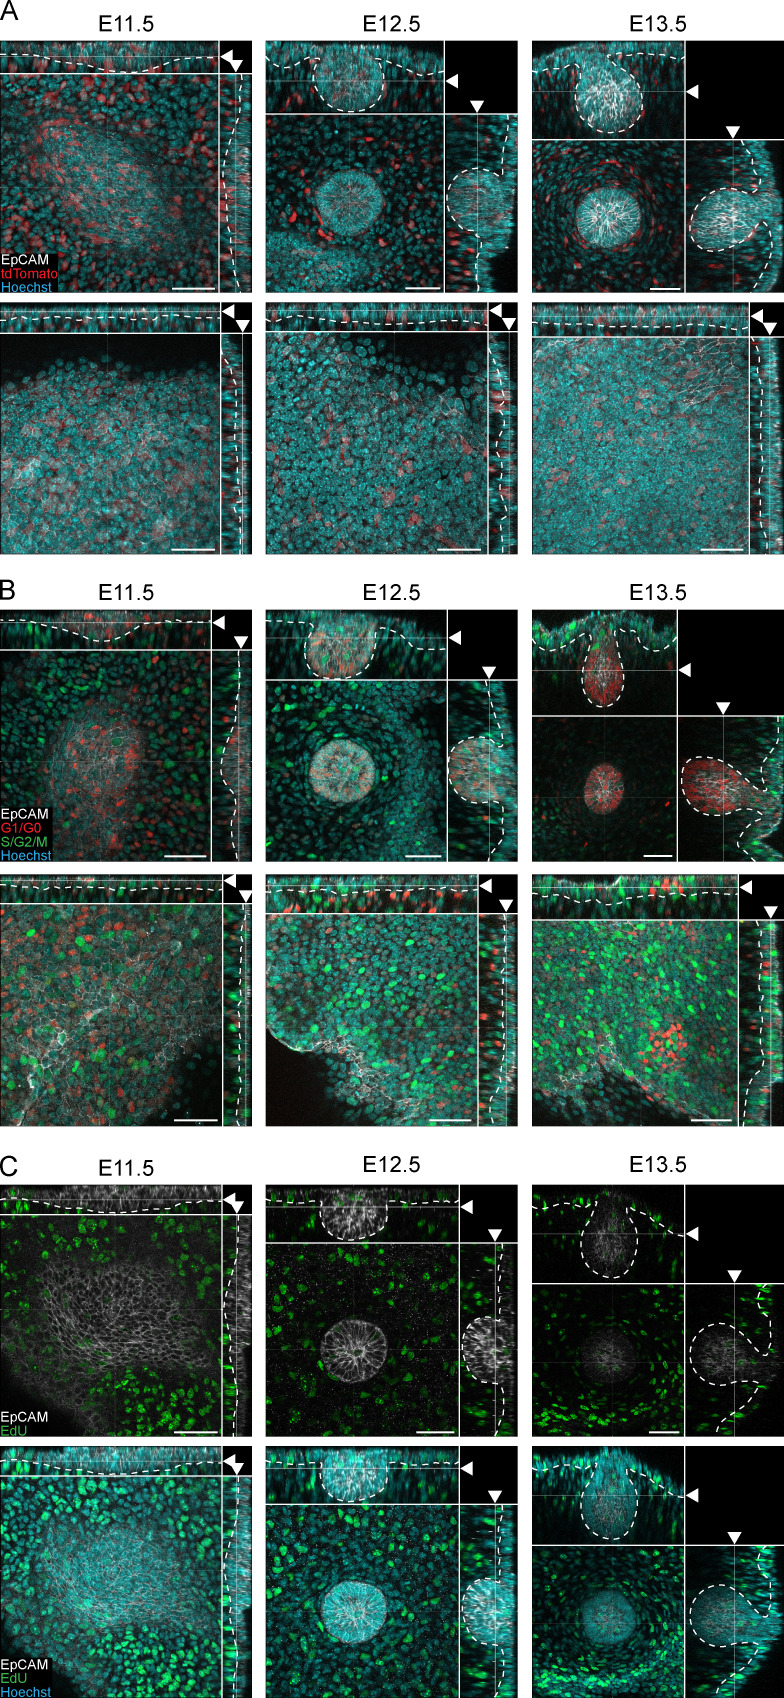
Two major processes may account for the dynamics of the volume gain: increase in cell number and/or individual cell size. Because previous studies indicated low levels of cell proliferation in mammary primordia (Balinsky, 1950; Lee et al., 2011), we first focused on cell size. We used the inducible R26-CreERT/tdTomato model for stochastic and sparse cell labeling, which, in combination with epithelial marker (EpCAM) staining, was used for 3D surface rendering of single cells (Fig. 2 A and Fig. S2 A). 3D surface rendering revealed that epidermal cells were relatively regular in shape, whereas mammary epithelial cells (MECs) were elongated with long protrusions at all stages analyzed, with a characteristic “centripetal” alignment at the hillock (E12.5) and bulb (E13.5) stages (Fig. 2 B). Cell shape analysis confirmed that MECs were less spherical than epidermal cells (Fig. 2 C). Quantification of cell volumes showed that MECs were smaller than epidermal cells at the placode (E11.5) and hillock (E12.5) stages, but there was no significant difference at the bulb (E13.5) stage. The volume of MECs increased between E11.5 and E12.5 stages by 1.2-fold, but not thereafter (Fig. 2 D). We conclude that although cellular hypertrophy contributes to the growth of the early mammary rudiment, the bulk of the growth must be achieved via other mechanisms.
Figure 2.
Mammary rudiments are characterized by low level of cell proliferation. (A) Optical sections (planar and sagittal views; arrowhead indicates section plane) of confocal microscopy images from R26-CreERT/tdTomato mouse embryos at placode (E11.5), hillock (E12.5), and bulb (E13.5) stages stained with EpCAM (white). Cells were sparsely labeled (cytoplasmic tdTomato, red) with low dosage of tamoxifen 24 h earlier. Scale bar, 50 µm. Dashed line marks the epithelial-mesenchymal border. (B) Planar views of maximum intensity projections of tdTomato-expressing epithelial cells. Cell surface rendering was performed on randomly selected cells (white); dashed line marks the border of the mammary rudiment. Scale bar, 20 µm. (C and D) Quantification of cell sphericity (C) and volume (D) at E11.5, E12.5, and E13.5 (six biological replicates for each stage). nE11.5 = 172 MECs and 170 epidermal cells; nE12.5 = 142 MECs and 136 epidermal cells; nE13.5 = 175 MECs and 175 epidermal cells. (E) Quantification of the total cell number in the mammary rudiment (nE11.5 = 7; nE12.5 = 6; nE13.5 = 6). (F) Optical sections (planar and sagittal views; arrowhead indicates section plane) of confocal images of mammary rudiments from Fucci embryos stained with EpCAM (white); nuclei in G1/G0 in red and in S/G2/M in green. Scale bar, 50 µm. Dashed line marks the epithelial-mesenchymal border. (G) Quantification of the proportions of cells in G1/G0 and S/G2/M in MECs and epidermis (nE11.5 = 7; nE12.5 = 6; nE13.5 = 6). Statistical significances were calculated by Student’s t test to compare mammary rudiment and epidermis at the same developmental stage or one-way ANOVA with Šidák’s post hoc comparison to compare mammary rudiments from three developmental stages. *, P ≤ 0.05; **, P ≤ 0.01; ****, P ≤ 0.0001. Data are shown as mean ± SD.
Figure S2.
Analysis of cell size and proliferation in early mammary morphogenesis. (A) Optical sections (planar and sagittal views) of confocal microscopy images from sparsely labeled R26-CreERT/tdTomato reporter embryos at placode (E11.5), hillock (E12.5), and bulb (E13.5) stages showing cytoplasmic expression of the reporter (tdTomato, red). Samples were stained with epithelial marker EpCAM (white) and nuclear marker Hoechst (cyan). (B) Optical sections (planar and sagittal views) of confocal images from transgenic Fucci cell cycle mouse model at placode (E11.5), hillock (E12.5), and bulb (E13.5) stages. Epithelial cells and nuclei have been stained with EpCAM (white) and Hoechst (cyan), respectively. The majority of the MECs are nonproliferative (G1/G0 phase, red), and only rare proliferative cells (S/G2/M phases, green) could be observed in the mammary bud. (C) Optical sections (planar and sagittal views) of confocal images of the mammary gland area from wild-type embryos at mammary gland placode (E11.5), hillock (E12.5), and bulb (E13.5) stages. Embryos were collected 2 h after EdU injection followed by whole-mount staining of EdU (S phase, green), epithelial marker EpCAM (white), and nuclear marker Hoechst (cyan). (A–C) Dashed line marks the epithelial-mesenchymal border, and arrowheads indicate the plane of the optical section. Scale bar, 50 µm.
Migration-driven cell influx rather than proliferation drives growth of the mammary rudiment
Next, we quantified the total number of MECs from the placode to the bulb stage. The analysis showed a substantial increase of cell number between E11.5 and E12.5 and a further, albeit not statistically significant, increase between E12.5 and E13.5, totaling a 1.6-fold increase over the 2-d course of development (Fig. 2 E). These data suggest that an increase in cell number has a major role in growth of the mammary primordium.
The most obvious process capable of fueling cell number is proliferation. To assess the contribution of cell proliferation, we used the Fucci transgenic cell cycle reporter mouse to distinguish cells in G0/G1 phases (nuclear monomeric Kuzabi Orange [mKO2]) from cells in S/G2/M (nuclear monomeric Azami Green [mAG]; Sakaue-Sawano et al., 2008; Fig. 2 F and Fig. S2 B). Quantification revealed that the portion of cells in S/G2/M phases was significantly lower in MECs than in adjacent epidermal cells across all stages evaluated (Fig. 2 G). More importantly, mammary primordium consisted mainly of cells in G1/G0 phases throughout early development, cells in S/G2/M being rare (between 5% and 9%; Fig. 2 G). Similarly, we observed low numbers of replicating cells by analyzing proliferation with 5-ethynyl-2′-deoxyuridine (EdU) incorporation, validating our conclusions from the Fucci model (Fig. S2 C). These data provide compelling evidence that the cell number increase during early mammogenesis is largely proliferation independent. A previous 2D study reporting BrdU-incorporation analysis in histological sections made the same conclusion (Lee et al., 2011).
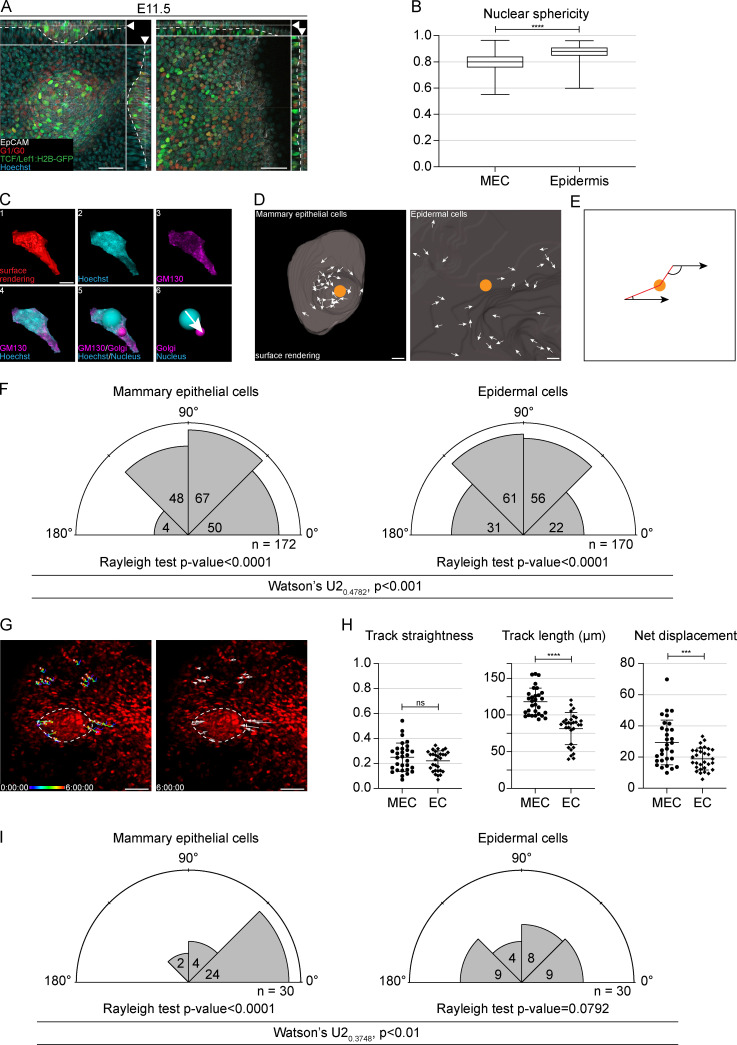
The low number of proliferative cells together with the characteristic elongated shape of MECs at the placode (E11.5) stage (Fig. 2 B) prompted us to investigate possible involvement of cell migration in placode formation. It is well acknowledged that cells undergo deformation under compression such as during cell migration, leading to substantial shape changes of organelles like the nucleus (Friedl et al., 2011). Therefore, we 3D surface rendered nuclei at the placode (E11.5) stage by taking advantage of mouse models with fluorescently labeled nuclei: Fucci mKO2 and the TCF/Lef1:H2B-GFP Wnt reporter (Ferrer-Vaquer et al., 2010; Fig. 3 A and Fig. S3 A). Shape analysis revealed that MEC nuclei had significantly lower sphericity than epidermal cells, indicating that MECs were under strain (Fig. 3 B).
Figure 3.
Cell influx drives mammary placode formation. (A) Optical section (planar and sagittal views; arrowhead shows section plane) of a mammary placode (left) and nonmammary epidermis (right) from E11.5 Fucci, mKO2;TCF/Lef1:H2B-GFP embryos. Cells in G1/G0 express nuclear mKO2 (red), while Wnt reporter active cells express nuclear GFP (green); Hoechst staining for nuclei (cyan) and EpCAM for epithelial cells (white). Dashed line marks the epithelial-mesenchymal border. Scale bar, 50 µm. (B) Quantification of nuclear sphericity of MECs and epidermal cells at E11.5. Student’s t test; ****, P ≤ 0.0001; n = 652 MECs and 882 epidermal cells from 14 biological replicates. Data shown represent median (line) with 25th and 75th percentiles (hinges) plus min to max ranges (whiskers). (C) Cells in E11.5 R26-CreERT/tdTomato embryos were sparsely labeled by low dosage of tamoxifen 24 h earlier and stained with EpCAM (white), GM130 (magenta), and Hoechst (cyan) to mark epithelial cells, Golgi, and nuclei, respectively. Figure shows planar views of a representative masked single cell (1–6) to define cell polarity. The surface-rendered cell (red; 1), nucleus (cyan; 2), Golgi (magenta; 3), overlay of both nucleus and Golgi (4), overlay of nucleus (cyan) and Golgi (magenta) with reference points for both (5), and cell vector (white arrow) from nuclear reference point (cyan) to Golgi reference point (magenta) (6). Scale bar, 5 µm. (D) Cell vectors (white arrows) show the polarity of MECs and epidermal cells at E11.5. Center of the placode or the control epidermal region is indicated by the orange spot. Scale bar, 20 µm. (E) Schematic image showing two examples of the angle between the cell vector and center of the placode (orange spot). (F) Rose plots showing the angles between cell vectors and the center of a mammary placode or image center of a corresponding epidermal region. Rayleigh test for nonuniformity, H0 = random. Watson’s U2 test revealed a significant difference between MEC and epidermal cell plots. n = 172 MECs and 170 epidermal cells from six biological replicates. (G) Confocal time-lapse 3D imaging of a forming mammary placode. Images show tracks of representative individual MECs and epidermal cells expressing Fucci, mKO transgene (nuclear red) on the left and track direction (arrows) on the right. Dashed line demarcates the mammary placode. Scale bar, 50 µm. See also Video 1. (H) Quantification of track straightness, length, and net displacement of MECs (n = 30) and epidermal cells (EC, n = 30) from three biological replicates. Statistical significance was tested with Mann-Whitney U test and Student’s t test; ***, P ≤ 0.001; ****, P ≤ 0.0001. (I) Rose plots of the escape angles (the angle between cell trajectories at the beginning and end of the time lapse with respect to the center of the placode or a corresponding epidermal region). Rayleigh test for nonuniformity, H0 = random. Watson’s U2 test revealed a significant difference between mammary placode cell and epidermal cell plots.
Figure S3.
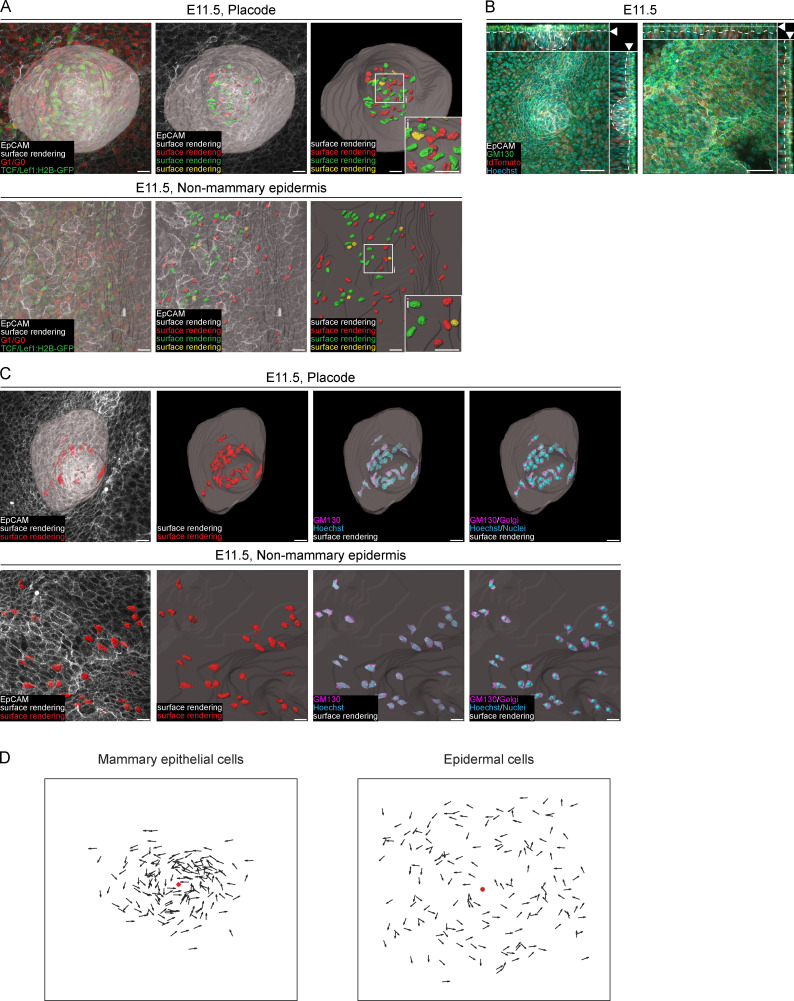
Analysis of nuclear shape and cell polarity in forming mammary placodes. (A) Representative images showing surface rendering of randomly selected nuclei based on the expression of nuclear mKO2 (G1/G0 marker of the Fucci cell cycle reporter, red) and nuclear GFP (TCF/Lef:H2B-GFP Wnt reporter, green) in a mammary placode (left) and epidermis (right) at E11.5; double positive mKO2 and GFP nuclei in yellow. Epithelial cells were stained with EpCAM (white). Gray area in the upper picture delineates the placode. Insets are close-ups of the indicated areas. Scale bar, 20 µm. (B) Optical sections (planar and sagittal views; arrowheads indicate the section plane) of confocal microscopy images from E11.5 R26-CreERT/tdTomato mouse embryos. Cells were sparsely labeled with low dosage of tamoxifen 24 h before to induce the expression of cytoplasmic tdTomato (red). The cells were stained with EpCAM (white), GM130 (green), and Hoechst (cyan) to mark epithelial cells, Golgi, and nuclei, respectively. Dashed line marks the epithelial-mesenchymal border. Scale bar, 50 µm. (C) Planar views of representative images showing the process of creating reference points using nuclear marker (Hoechst, cyan) and Golgi marker (GM130, green) of mammary placode (upper panel) and epidermis (lower panel) at mammary placode stage (E11.5) that are required for cell angle analysis shown in Fig. 3, C–F. Epithelial cells are further stained with EpCAM (white). First column shows overlay of maximum intensity projection of confocal image and surface rendering of randomly selected cells expressing tdTomato (from R26-CreERT/tdTomato, red). Second column shows surface rendering (white) of mammary placode or epidermis together with surface rendering of randomly selected tdTomato+ epithelial cells (red). Third column shows the nucleus (cyan) and GM130 (Golgi marker, magenta) staining in masked tdTomato+ epithelial cells from the mammary placode and epidermis. Fourth column shows surface rendering of the mammary placode and epidermis with reference points for nuclei (Hoechst, cyan; reference point, cyan) and Golgi marker (GM130, magenta; reference point, magenta) in masked tdTomato+ epithelial cells from the mammary placode and epidermis. Scale bar, 20 µm. (D) Summary of all the relative cell orientations in 2D of MECs (left, n = 172 from six biological replicates) and epidermal cells (right, n = 170 from six biological replicates) at E11.5. Each arrow represents one cell. Red star marks the mammary placode center (left) or image center of the epidermis (right).
It is known that localization of the Golgi apparatus is linked with the direction of cell polarity (Hurtado et al., 2011; Ravichandran et al., 2020). To test if the observed nuclear shape of MECs could be linked with cell migration, we measured cell polarity by analyzing the location of the Golgi apparatus with respect to the cell nucleus (Fig. 3 C; and Fig. S3, B and C). To quantify cell orientation with respect to the placode, we calculated the angle between two vectors: the nucleus to Golgi vector and the nucleus to placode center vector (Fig. 3, D and E; and Fig. S3 D). We reasoned that cells presumed to migrate toward the mammary gland placode would have an angle of <90° and cells moving outward from the placode, more than 90°. Unlike epidermal cells, the majority of MECs had angles <90° (Fig. 3 F).
Next, we established whole-embryo confocal live imaging that allowed us to track epithelial cells up to 6 h (Fig. 3 G and Video 1). Quantification showed no difference in track straightness between MECs and epidermal cells. However, MECs displayed significantly longer track length as well as net displacement compared with epidermal cells (Fig. 3 H). Escape angle analysis confirmed that the majority of MECs were migrating toward the center of the placode, whereas epidermal cells moved randomly (Fig. 3 I).
Video 1.
Live imaging of the mammary placode at E11.25. 3D reconstructed images of optical section stacks acquired with a laser scanning confocal microscope showing epithelial cells including mammary placode–expressing K17-GFP (green) and nuclei in G1/G0 (Fucci mKO2 model, red) at E11.25. Cells were tracked (white spheres) for 6 h. Image stack was taken at 15-min intervals, and the playback speed is 5 frames/s. Scale bar, 50 µm. The video is related to Fig. 3.
Epidermal cells surrounding the mammary gland bud may contribute to its invagination
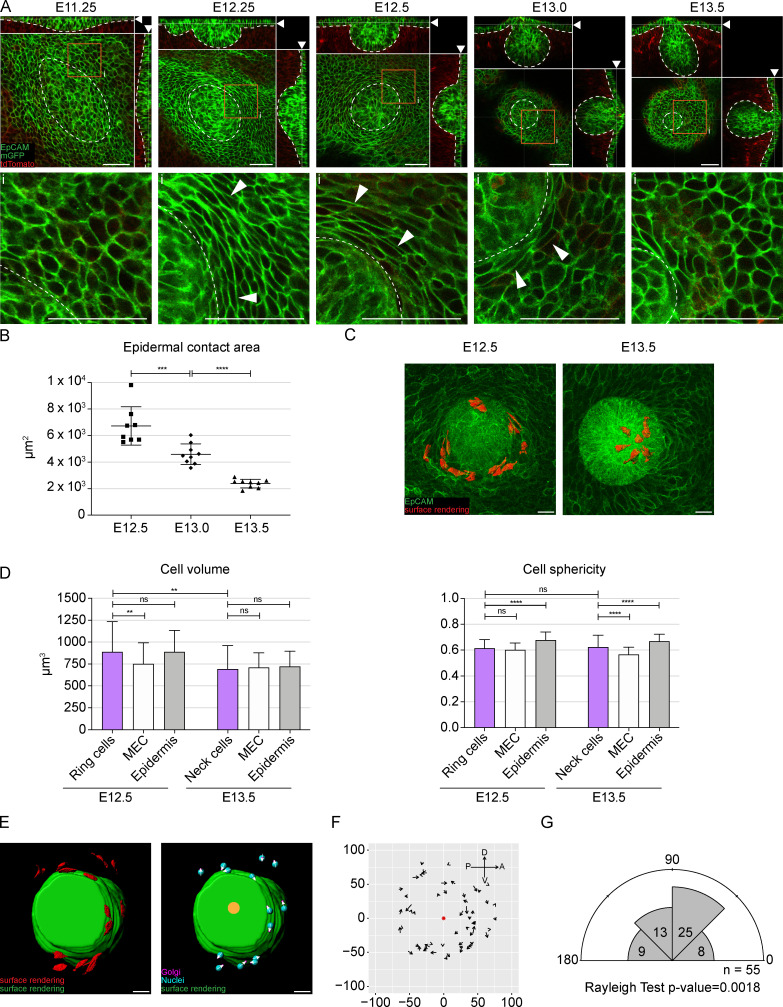
While cell migration fuels the growth of the mammary primordium, it alone cannot account for the process of invagination and formation of the characteristic bulb shape of the E13.5 mammary rudiment. Intriguingly, we observed morphological changes taking place in epidermal cells adjacent to the mammary bud (Fig. 4 A). At early placode stage (E11.25), there was no obvious difference between placodal and epidermal cells. Noticeable change took place within the next 24 h: epidermal cells adjacent to the early mammary hillock (E12.25) thinned and became elongated in contrast to epidermal cells located farther away. A quarter of a day later (E12.5), the specific alignment of these epidermal cells was even more pronounced, generating a ringlike structure of thin and stretched cells encircling the mammary hillock (Fig. 4 A). Due to their particular appearance and arrangement, we named these cells ring cells. Half a day later, at E13.0, some ring cells were still visible, but by the bulb (E13.5) stage, they had disappeared, and cells next to the mammary rudiment again resembled habitual keratinocytes (Fig. 4 A). Interestingly, the disappearance of the ring cells coincided with invagination of the bud and formation of the constricted neck characteristic of the mammary bulb, suggesting that the ring cells may give rise to the neck cells. In line with this, several mammary epithelial markers show lower expression levels in the neck compared with the bud itself (Elo et al., 2017; Hiremath et al., 2012; Chu et al., 2004; Hens et al., 2007), further supporting the notion that the origin of these cells may differ from cells of the “bud proper.”
Figure 4.
A rim of thin keratinocytes encircles the invaginating mammary bud. (A) Optical sections (planar and sagittal views; arrowheads show the section plane) of confocal whole-mount microscopy images from K14-Cre/mTmG mouse mammary primordia at placode (E11.25), hillock (E12.25 and E12.5), bud (E13.0), and bulb (E13.5) stages; epithelium in green (cell-membrane localized GFP and EpCAM staining) and mesenchyme in red. Dashed line marks the epithelial-mesenchymal border. Lower panel: inserts (i) are close-ups of planar views marked in orange boxes in the upper panel. Arrowheads indicate ring cells. Scale bar, 50 µm. (B) Quantification of epidermal contact area of the mammary rudiment. One-way ANOVA with Šidák’s post hoc comparison; ***, P ≤ 0.001; ****, P ≤ 0.0001; nE12.5 = 8; nE13.0 = 9; nE13.5 = 9. Data are shown as mean ± SD. (C) Planar views of maximum intensity projections showing epithelial tissue (cell-membrane localized GFP) at E12.5 and E13.5. Surface rendering of the keratinocytes (ring cells, red) surrounding the mammary bud at E12.5 and cells in the neck at E13.5. Scale bar, 20 µm. See also Video 2. (D) Quantification of the volume and sphericity of mammary epithelial, ring, neck, and epidermal cells (EC) before (E12.5) and after (E13.5) invagination; six biological replicates for both stages. nE12.5 ring = 86 ring cells, 142 MECs, and 136 ECs; nE13.5 = 38 neck cells, 175 MECs, and 175 ECs. Data are shown as mean ± SD. Statistical significance was calculated by Student’s t test to compare ring and neck cells or one-way ANOVA with Šidák’s post hoc comparison or Kruskal-Wallis test to compare ring cells, MECs, and ECs at the same developmental stage; **, P ≤ 0.01; ****, P ≤ 0.0001. (E) Planar views of surface rendering of ring cells (red) and mammary bud (green) at the hillock (E12.5) stage. Cell vectors (white arrowheads) show the polarity of ring cells as defined by the nucleus (cyan) to Golgi (magenta) vector. Orange spot marks the center of the bud’s top surface. Scale bar, 20 µm. (F) Coordinate system showing ring cells’ vectors (arrows) and their opposing directionality at E12.5. Red dot marks the center of the hillock’s top domain. A, anterior; D, dorsal; P, posterior; V, central (nE12.5 = 55 ring cells from four biological replicates). (G) Rose plot representing the angles between the cell vector and the center of mammary bud’s top domain. Rayleigh test for nonuniformity, H0 = random.
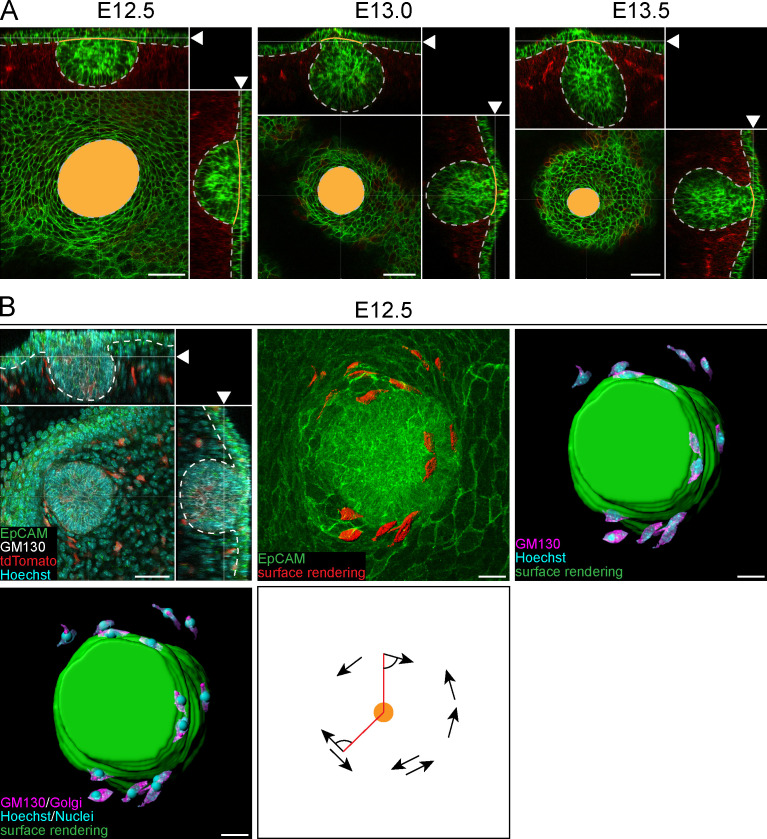
To gain further insights into the invagination process, we analyzed the submersion of the mammary primordium’s top domain (Fig. S4 A). Quantification confirmed a steady decrease in the area in contact with the epidermis between E12.5 and E13.5 (Fig. 4 B). 3D surface rendering of individual cells revealed that ring cells were thin and elongated and had long protrusions encompassing the hillock (Fig. 4 C and Video 2). Quantification of cellular parameters at E12.5 confirmed a shape difference between ring cells and other epidermal cells, while there was no difference in cell volume (Fig. 4 D). MECs, though, were clearly smaller. At E13.5, ring cells were no longer discernible. Cells located in the newly formed neck differed from both epidermal and bulb proper cells, the latter being least spherical (Fig. 4 D).
Figure S4.
A rim of thin keratinocytes forms around the invaginating mammary rudiment. (A) Optical sections (planar and sagittal views; arrowheads indicate the section plane) of a confocal image from K14-Cre/mTmG mouse embryos at hillock (E12.5), bud (E13.0), and bulb (E13.5) stages. Epithelial tissue labeled with membrane-bound GFP and epithelial marker EpCAM (green). Mesenchymal tissue labeled with membrane-bound tdTomato (red). Yellow area in the planar and yellow line in the sagittal views show how epidermal contact area was defined. Dashed line marks epithelial-mesenchymal border. Scale bar, 50 µm. (B) Representative images showing the procedure determining the relative orientation of ring cells at the mammary hillock (E12.5) stage from R26-CreERT/tdTomato embryos. Upper left: Optical section (planar and sagittal views; arrowheads indicate the section plane) of the confocal image of the sparsely labeled tdTomato+ (red) cells with epithelial marker EpCAM (green), Golgi marker GM130 (white), and Hoechst (cyan). Dashed line marks epithelial-mesenchymal border. Scale bar, 50 µm. Upper middle: Planar view of the maximum intensity projection showing epithelial cells (EpCAM, green) and surface rendering of randomly selected tdTomato+ ring cells (red). Scale bar, 20 mm. Upper right: Planar view of surface rendering of the mammary primordium (green) and the staining for nuclei (Hoechst, cyan) and Golgi (GM130, magenta) in masked ring cells. Scale bar, 20 mm. Lower left: Planar view of the surface rendering of the mammary primordium (green) with reference points for nuclei (Hoechst, cyan) and Golgi marker (GM130, magenta) in masked tdTomato+ ring cells. Scale bar, 20 µm. Lower right: An example of the relative angles between cell vector (black arrow) and center of the bud’s top domain (red line toward orange dot).
Video 2.
Unlike habitual keratinocytes, keratinocytes encircling the mammary rudiment are thin and elongated before invagination (E12.5) but not any more after invagination (E13.5). 3D reconstructed images of optical section stacks acquired with a laser scanning confocal microscope showing epithelium (EpCAM, green) and surface rendering of MECs, ring/neck cells, and epidermal cells at hillock (E12.5) and bulb (E13.5) stages. Scale bar, 40 µm. The video is related to Fig. 4. Frame rate is 30 frames/s.
The fact that ring cells (a) form at the time when the bud proper starts to form; (b) have a particular rim-like arrangement; (c) have a distinctive size and shape compared with other epidermal (and mammary) cells, displaying characteristics of cells under strain, such as thinning and elongation; and (d) gradually disappear from the surface epidermis while the bud sinks into the mesenchyme, suggesting that ring cells are functionally relevant for invagination. One possible mechanism could be via cell sliding and contraction, a process previously shown to drive eyelid closure (Heller et al., 2014). To assess this possibility, we investigated the polarity of the ring cells. If cell intercalation around the bud were to drive invagination, we might expect ring cells to display nonrandom polarity with respect to the mammary primordium. Again, we used Golgi apparatus and nuclear staining to assess polarity and then calculated the angle of the cells with respect to the center of the bud (Fig. 4 E and Fig. S4 B). The results showed nonrandom distribution of ring cells, with the majority of them having angles ranging from 45° to 135°, indicating that they were preferentially concentrically aligned around the mammary bud (Fig. 4, F and G).
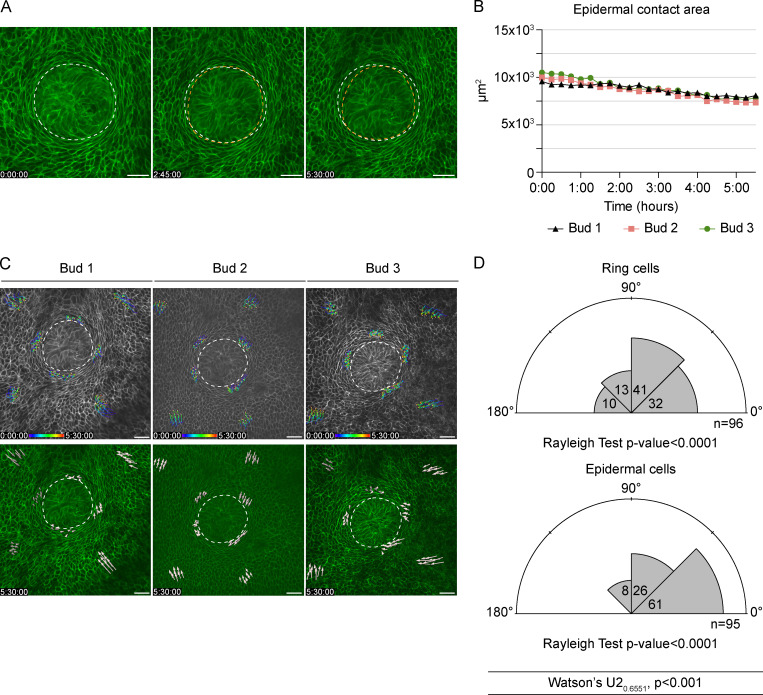
To further assess the ring cells’ role in invagination, we performed whole-embryo confocal live imaging (Video 3). As in vivo (Fig. 4 B), a decrease in epidermal contact area was evident in all samples, indicating an active invagination process (Fig. 5, A and B). Tracking of cells and quantification of cell motility vectors with respect to the center of the bud showed that the majority of epidermal cells located farther away from the bud moved preferentially toward the bud (64% of vectors had 0–45° angles), which is expected given that the bud’s epidermal contact area is decreasing while it invaginates. In stark contrast, vectors displaying 45–90° were most common among ring cells (Fig. 5, C and D). Altogether, these data suggest that ring cells move in a circle-like fashion and could generate force driving mammary bud invagination and thereby neck formation.
Video 3.
Live imaging of ring cells at E12.5. 3D reconstructed images of optical section stacks acquired with a spinning disk confocal microscope showing mammary rudiment (epithelial membrane-bound GFP, green) at E12.5. Both ring and epidermal cells (white spheres) were tracked for 5 h 30 min. MIP, maximum intensity projection. Image stack was taken at 15-min intervals, and the playback speed is 5 frames/s. Scale bar, 30 µm. The video is related to Fig. 5.
Figure 5.
Confocal time-lapse 3D imaging of ring cells at E12.5. (A) A representative mammary bud from a K14-Cre/mTmG embryo at the beginning, at 2 h 45 min, and at the end of the imaging (5 h 30 min). White and orange dashed line mark the perimeter of the invaginating mammary bud in the beginning and at the indicated time point, respectively. Scale bar, 30 µm. (B) Quantification of the epidermal contact area of individual mammary buds during imaging. (C) Individual ring and epidermal cell tracks in three mammary buds. Dashed line marks the perimeter of the invaginating mammary bud. Scale bar, 30 µm. See also Video 3. (D) Rose plots of the escape angles (the angle between cell trajectories at the beginning and end of the time lapse in respect to the center of the mammary bud). Rayleigh test for nonuniformity, H0 = random; n = 96 ring cells and 95 epidermal cells from three biological replicates. Statistical significance was assessed with Watson’s U2 test.
Ring cells display high actomyosin contractility
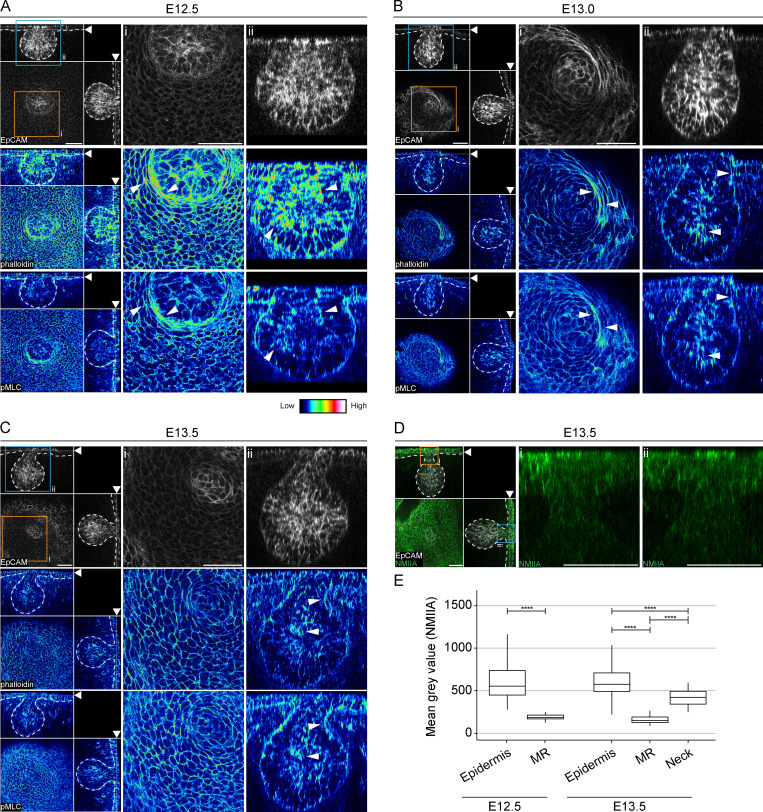
The importance of the actomyosin network in tissue morphogenesis prompted us to investigate it in the context of ring cell activity (Munjal and Lecuit, 2014). Whole-mount staining of phalloidin revealed high levels of F-actin in ring cells, especially those located closest to MECs at the hillock (E12.5) stage (Fig. 6 A). In addition, high F-actin intensity marked basal (proximal to basement membrane) and apical (distal to basement membrane) domains of the basally located mammary cells. Similarly, we detected higher levels of phosphorylated myosin light chain II (pMLC), a marker for actomyosin contractility, at the same locations (Fig. 6 A). At E13.0, both F-actin and pMLC persisted at high intensity at the same locations whenever ring cells were still evident (Fig. 6 B). At the bulb (E13.5) stage, when ring cells had disappeared, the epidermal cells displayed relatively uniform staining of both F-actin and pMLC (Fig. 6 C).
Figure 6.
Ring cells display high actomyosin contractility. (A–C) Optical sections (planar and sagittal views; arrowheads indicate the section plane) of confocal images from wild-type embryos labeled with epithelial marker EpCAM (white), F-actin (phalloidin, represented in LUT, middle panel), and pMLC, represented in LUT, lower panel) at hillock (E12.5; A), bud (E13.0; B), and bulb (E13.5; C) stages. Scale bar, 50 µm. Dashed line marks the epithelial-mesenchymal border. Arrowheads highlight high-intensity levels, i and ii (insert). Scale bar, 50 µm. (D) Optical sections (planar and sagittal views; arrowheads indicate the section plane) of confocal images from a wild-type embryo stained with EpCAM (white) and NMIIA (green) at the bulb (E13.5) stage. Dashed line marks the epithelial-mesenchymal border. Inserts (i and ii) are close-ups of sagittal views marked in orange and blue boxes. Scale bar, 50 µm. (E) Quantification of NMIIA intensities in cells of the epidermis (EC), mammary rudiment (MR), and neck region from five different embryos per stage (nE12.5 EC = 1,292; nE12.5 MR = 485; nE13.5 EC = 1,889; nE13.5 MR = 533; and nE13.5 Neck = 119). Data shown represent the median (line) with 25th and 75th percentiles (hinges) plus 1.5× interquartile ranges (whiskers). Statistical significance was assessed with the Mann-Whitney U test with Bonferroni correction. ****, P ≤ 0.0001.
Nonmuscle myosin IIA (NMIIA) is the most abundantly expressed nonmuscle myosin in a wide variety of cell types including epidermal cells (Ma et al., 2010; Fig. 6 D and Fig. S5 A). Quantification of NMIIA intensities at E12.5 revealed high levels in epidermal cells compared with MECs (Fig. 6 E and Fig. S5 A). At the bulb (E13.5) stage, NMIIA was readily detectable also in the neck region while expression in the bud proper remained low (Fig. 6, D and E; and Fig. S5 A).
Figure S5.
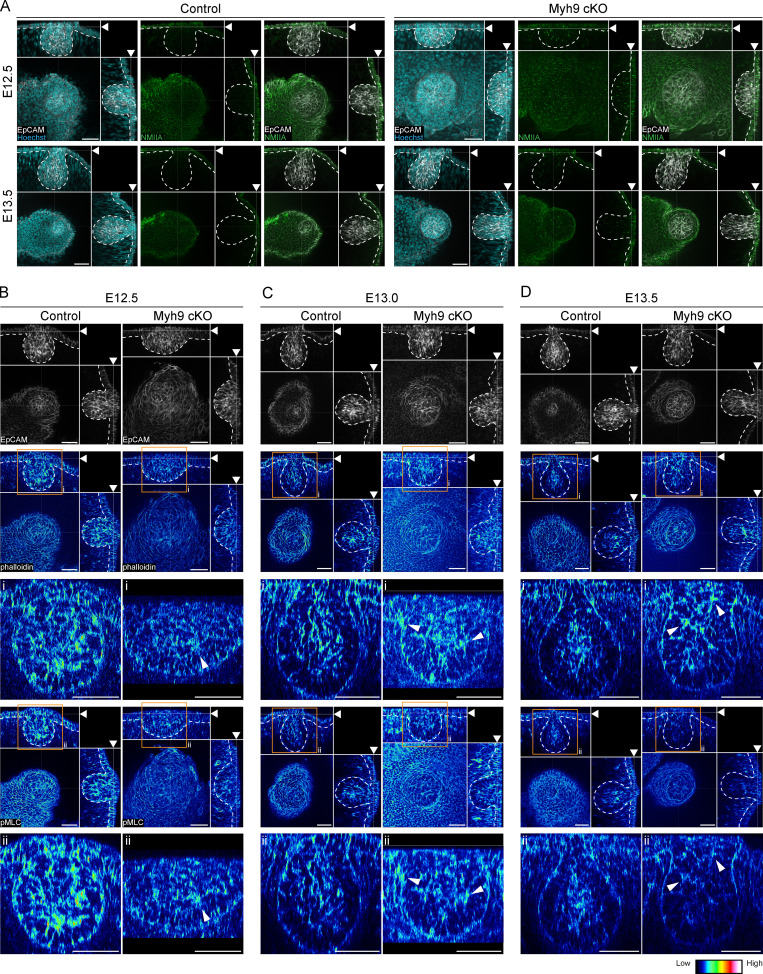
Expression of NMIIA, F-actin, and pMLC in control and Myh9 deficient embryos. (A) Optical sections (planar and sagittal views) of confocal images from Myh9 cKO embryos and their control littermates stained with NMIIA (green) at hillock (E12.5) and bulb (E13.5) stages. Epithelium was stained with EpCAM (white) and nuclei with Hoechst (cyan). Dashed line marks the epithelial-mesenchymal border, and arrowheads mark the plane of optical section. Scale bar, 50 µm. (B–D) Optical sections (planar and sagittal views) of confocal images from Myh9 cKO and control littermate embryos stained with epithelial marker (EpCAM, white in the upper panel), F-actin (phalloidin, represented in LUT depicted in the middle panel), pMLC (represented in LUT depicted in the lower panel) at hillock (E12.5; B), bud (E13.0; C), and bulb (E13.5; D) stages. Scale bar, 50 µm. Dashed line marks the epithelial-mesenchymal border, and arrowheads mark the plane of the optical section. i and ii are close-ups of the regions indicated by orange boxes.
Myosin IIA drives the localized actomyosin contractility required for mammary bud invagination
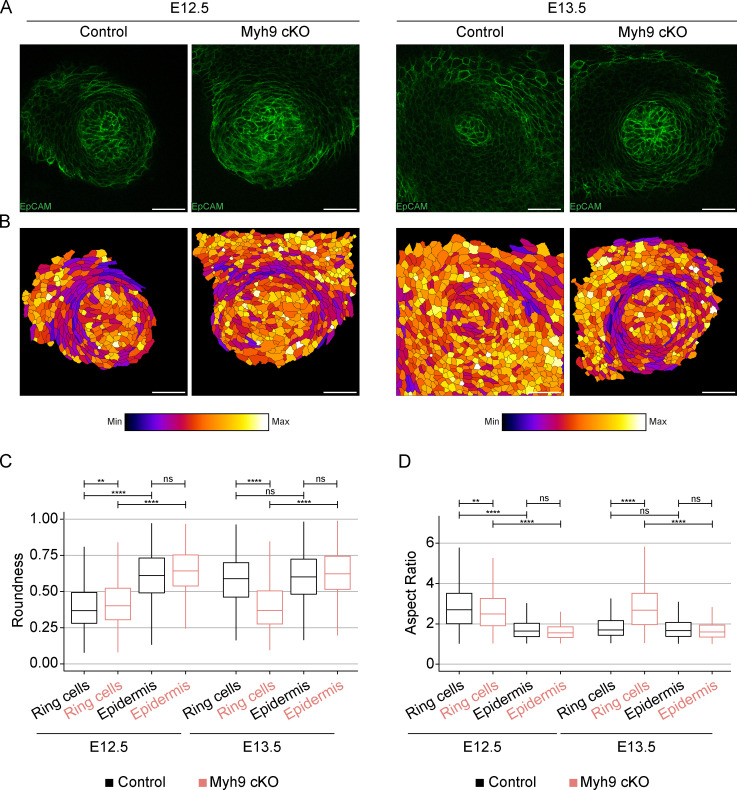
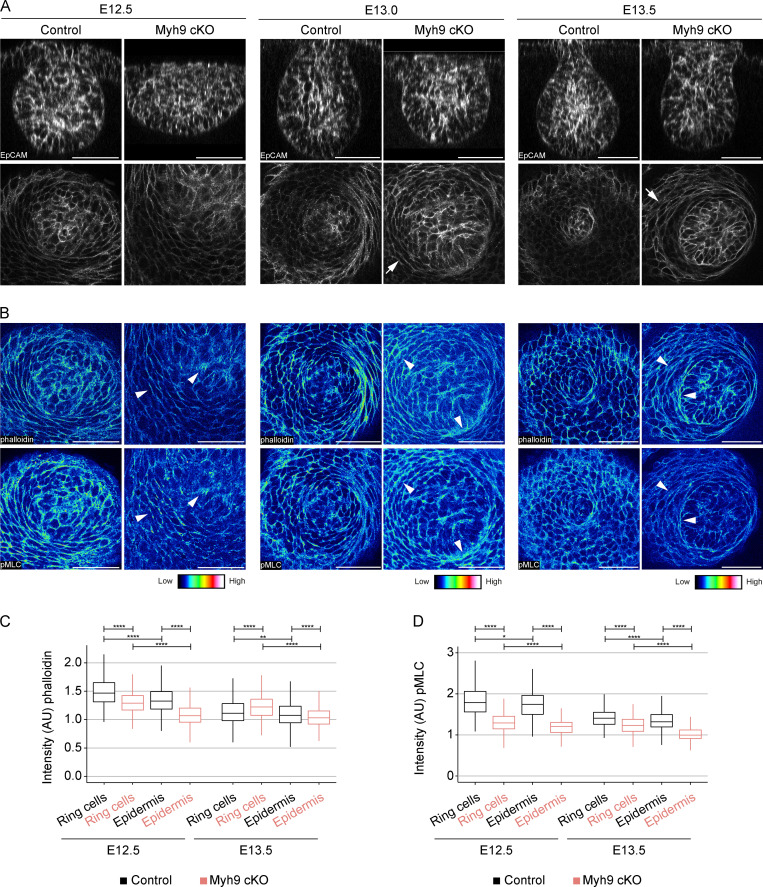
To decipher the function of the actomyosin network in mammary bud invagination, we conditionally inactivated NMIIA by deleting the Myh9 gene (encoding the heavy chain of NMIIA) in the epithelium using the K14-Cre driver. Due to the relatively low NMIIA expression in the mammary primordium, Myh9 deletion was expected to mainly interfere with the ring cells. First, we confirmed reduction in NMIIA levels in K14-Cre/Myh9flox/flox conditional knockout (Myh9 cKO hereafter) by immunostaining (Fig. S5 A). To assess if the shape of ring cells is different from epidermal cells and if they are affected by loss of NMIIA, we analyzed cell roundness and aspect ratio in epidermal cells adjacent to the bud (0–30 µm, ∼ring cells) and in cells located farther away (70–100 µm, control keratinocytes; Fig. 7, A and B). Prior to invagination (E12.5), cells encircling the bud had a much higher aspect ratio and were more elongated than control epidermal cells (Fig. 7, B–D). Ringlike cells did form in Myh9 cKO at E12.5, yet they were significantly less extended than in control littermates (Fig. 7, B–D). The more distal epidermal cells did not differ from each other. Importantly, after invagination had occurred in control embryos (E13.5), the proximal and distal cells no longer differed in shape, confirming the disappearance of the contractile epidermal ring. In contrast, elongated and thin ring cells persisted in Myh9 cKO mutants (Fig. 7, B–D).
Figure 7.
Epithelial NMIIA deficiency leads to persistence of the contractile epidermal ring. (A) Optical sections (planar views) of confocal images of representative Myh9 cKO and control littermate embryos labeled with EpCAM (green) at hillock (E12.5) and bulb (E13.5) stages. Scale bar, 50 µm. (B) Heatmap of cell roundness in the planar images shown in A. (C and D) Quantification of cell roundness (C) and aspect ratio (D) of cells adjacent to the bud (0–30 µm ∼ ring cells) and those farther away from the bud (70–100 µm, control epidermal cells [EC]) in 6 or 7 control and 7–11 Myh9 cKO embryos per stage (Control: nE12.5 Ring cells = 931, nE12.5 EC = 448, nE13.5 Ring cells = 697, nE13.5 EC= 921; Myh9 cKO: nE12.5 Ring cells = 886, nE12.5 EC = 219, nE13.5 Ring cells = 1,174, nE13.5 EC = 1,201). Data shown represent median (line) with 25th and 75th percentiles (hinges) plus 1.5× interquartile ranges (whiskers). Statistical significance was assessed with the Mann-Whitney U test with Bonferroni correction. **, P ≤ 0.01; ****, P ≤ 0.0001.
Next, we analyzed the actomyosin network with phalloidin and pMLC stainings in Myh9 cKO embryos and their control littermates (Fig. 8, A and B; and Fig. S5, B–D) and quantified their intensities again in cells adjacent to the bud and in control cells located farther away. Quantification confirmed a significant difference in both F-actin and pMLC intensities between the two groups in control embryos at E12.5, the difference being less apparent at E13.5 (Fig. 8, C and D) when the ring cells were no longer morphologically discernible (Fig. 7, B–D). Myh9 cKO embryos displayed a significant decrease in F-actin intensities at E12.5 and pMLC intensities at both stages compared with control embryos, indicating diminished contractile actomyosin network (Fig. 8, C and D). At E13.5, F-actin remained slightly elevated in the bud-proximal cells in Myh9 cKO embryos compared with controls, likely because of the persisting ring cells.
Figure 8.
Epithelial NMIIA deficiency impairs ring cell function. (A and B) Optical sections (planar and sagittal views) of confocal images from Myh9 cKO and control littermate embryos labeled with EpCAM (white; A), F-actin (phalloidin, represented in LUT depicted in the middle panel), and pMLC (represented in LUT depicted in the right panel) (B) at hillock (E12.5), bud (E13.0), and bulb (E13.5) stages. Scale bar, 50 µm. Arrowheads mark the increased intensity. Arrows mark ring cells still present at E13.0. (C and D) Quantification of F-actin (C) and pMLC (D) intensity in ring cells (0–30 µm from the bud) and epidermal cells (EC; 70–100 µm away from the bud) of four to seven control and four to six Myh9 cKO embryos per stage (Controls: nE12.5 Ring cells = 621, nE12.5 EC = 252, nE13.5 Ring cells = 648, nE13.5 EC= 787; Myh9 cKO: nE12.5 Ring cells = 568, nE12.5 EC = 108, nE13.5 Ring cells = 495, nE13.5 EC = 652). Data shown represent median (line) with 25th and 75th percentiles (hinges) plus 1.5× interquartile ranges (whiskers). Statistical significance within each stage was assessed with the Mann-Whitney U test with Bonferroni correction. AU, arbitrary units. *, P ≤ 0.05; **, P ≤ 0.01; ****, P ≤ 0.0001.
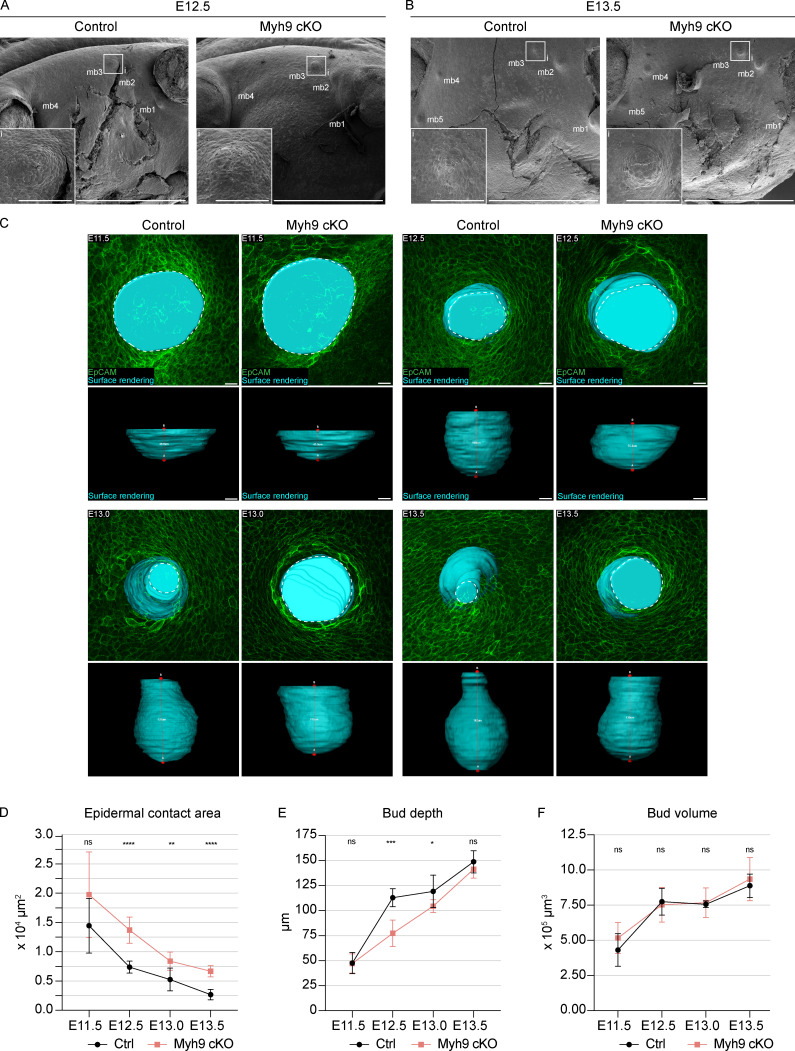
The compromised contractile activity of ring cells in Myh9 cKO embryos prompted us to evaluate the consequences of Myh9 deletion for the invagination process. Scanning electron microscopy revealed that at E12.5, mammary primordia were elevated above the surface epithelium both in control and Myh9 cKO embryos (Fig. 9 A). 1 d later, after invagination had occurred, the protrusion was no longer evident in controls, whereas in Myh9 cKO mutants, mammary primordia remained elevated above the surface epithelium (Fig. 9 B). 3D surface rendering of EpCAM-stained specimens further confirmed this conclusion (Fig. 9 C and Video 4). Next, we quantified the epidermal contact area and, using 3D surface rendering, invagination of the mammary rudiment from placode (E11.5) to bulb (E13.5) stage. At the placode stage, no significant difference was observed between the controls and mutants (Fig. 9, D and E). In control embryos, the epidermal contact area steadily decreased during the invagination process, whereas in Myh9 cKO embryos, this was significantly less pronounced (Fig. 9 D). The invagination, measured as the depth of the mammary rudiment, was also substantially impaired in Myh9 cKO at the hillock stage (E12.5–E13.0), but not anymore at the bulb (E13.5) stage (Fig. 9 E). Importantly, there was no difference in the volume of control and Myh9 cKO mammary glands, indicating that there was no general delay in mammary development (Fig. 9 F). Taken together, our results indicate that loss of epithelial NMIIA diminishes actomyosin contractility and suggest arrested ring cell function as the likely cause of the impaired mammary bud invagination and neck formation.
Figure 9.
Impaired invagination and neck formation in Myh9 cKO embryos.(A and B) Scanning electron microscopy images of Myh9 cKO embryos and control littermates at E12.5 (A) and E13.5 (B) with close-ups of mammary primordium 3. Scale bar, 1 mm. i, insert; scale bar, 100 µm. mb, mammary bud. (C) Planar and sagittal views of maximum intensity projections showing surface rendering (cyan) of mammary rudiments of Myh9 cKO embryos and control littermates at E11.5, E12.5, E13.0, and E13.5. Dashed line marks the epidermal contact area. Red line connects top and bottom domains of mammary primordium showing the depth of the rudiment. Scale bar, 20 µm. See also Video 4. (D–F) Quantification of epidermal contact area (D), bud depth (E), and bud volume (F). Statistical significances were calculated with Student’s t test to controls and Myh9 cKO embryos at each developmental stage. nE11.5 = 6 (Ctrl) and 7 (Myh9 cKO), nE12.5 = 6 (Ctrl) and 7 (Myh9 cKO), nE13.0 = 10 (Ctrl) and 8 (Myh9 cKO), nE13.5 = 8 (Ctrl) and 13 (Myh9 cKO). Data are shown as mean ± SD. *, P ≤ 0.05; **, P ≤ 0.01; ***, P ≤ 0.001; ****, P ≤ 0.0001.
Video 4.
3D rendering of control and Myh9 cKO mammary rudiments from the placode (E11.5) to the bulb (E13.5) stage. 3D reconstructed images of optical section stacks acquired with a laser scanning confocal microscope showing epithelium (EpCAM, green) and surface rendering of mammary gland (cyan) from Myh9 cKO and control littermates at placode (E11.5), hillock (E12.5), bud (E13.0), and bulb (E13.5) stages. Surface rendering of mammary primordium (cyan) and epidermis (green) showing remaining protrusion of the rudiment in Myh9 cKO compared with control littermates at E13.5. Scale bar, 40 µm. The video is related to Fig. 9. Frame rate is 30 frames/s.
Discussion
In this study, we investigated embryonic mammary development with a particular focus on cellular mechanisms governing its early growth and invagination. The former was initially attributed to localized enhanced cell proliferation, and the first attempt to challenge this hypothesis was made by Balinsky in the 1950s. He quantified mitotic indices of E11–E14 mammary rudiments based on histological sections and suggested that cell proliferation cannot account for the initial growth of the mammary bud (Balinsky, 1950; Balinsky, 1952). Ever since, it has been speculated, without conclusive evidence, that mammary placodes form by cell migration (Lee et al., 2011; Veltmaat et al., 2003; Propper, 1978). 70 yr later, after Balinsky’s seminal studies, we provide ample evidence—cell cycle data, whole-mount high-resolution 3D and 4D microscopy, and quantitative morphometric analyses—showing that the growth of early mammary primordia is primarily achieved by cell influx. Further support for the role of cell migration has been provided by Propper (1978), who used ex vivo tissue culture to show that charcoal placed on epidermal cells is incorporated into the forming mammary primordia.
In addition to mammary tissue, hair follicles show greatly reduced cell proliferation at the placode stage, where this phenomenon has been linked with acquisition of placode cell fate (Ahtiainen et al., 2014). The same applies to developing teeth, although in tooth placodes, only a spatially distinct subset of cells, a signaling center, becomes quiescent (Ahtiainen et al., 2016). Both of them also form by cell influx, implying directional cell migration as a shared feature among ectodermal appendage placodes (Ahtiainen et al., 2014; Ahtiainen et al., 2016). A major difference between these three ectodermal appendages is, however, that cell proliferation is a major driver of growth after the placode stage both in teeth and hair follicles (Ahtiainen et al., 2014; Ahtiainen et al., 2016; Ouspenskaia et al., 2016). To our knowledge, the prolonged quiescence of mammary cells is a unique feature not reported to occur at early stages of morphogenesis in any other mammalian organ.
An outstanding question that remains is the identity of cues regulating the observed cellular behaviors during early mammary morphogenesis. We showed that cellular hypertrophy also contributes to the growth of the mammary rudiment and find the neuregulin-3 (Nrg3)/Erbb4 pathway the best candidate: in Nrg3 mutants, the smaller size of mammary buds correlates with a smaller size of MECs (Kogata et al., 2014). Wnt and ectodysplasin pathways are known to increase cell motility during hair placode morphogenesis (Ahtiainen et al., 2014) and hence could have a similar role in early mammogenesis. The signal(s) governing cell cycle exit of MECs is unknown and may also relate to the absence of pathway activity. The embryonic mammary gland is devoid of Hedgehog (Hh) signaling activity (Hatsell and Cowin, 2006), whereas in developing teeth and hair follicles, Hh signaling is a major driver of proliferation and organ growth (St-Jacques et al., 1998; Chiang et al., 1999; Gritli-Linde et al., 2002). Further work is warranted to clarify how and why embryonic MECs gain and maintain quiescence.
The processes that govern the formation of epithelial thickenings such as placodes cannot explain tissue invagination on their own. Multiple cellular mechanisms have been shown or proposed to drive invagination, including apical constriction, basal relaxation, actomyosin cable-mediated buckling, and basal wedging (Davidson, 2012; Pearl et al., 2017). Epithelial invagination has mainly been studied in single-layered epithelia, and whether the same cellular mechanisms are used in multilayered epithelia remains an open question. A recent study that used the molar tooth as a model proposed that invagination of skin appendage placodes is achieved by horizontal contraction and intercalation of superficial placode cells that form a shrinking “canopy,” thereby forcing the underlying placodal cells to sink into the underlying mesenchyme (Panousopoulou and Green, 2016). However, we did not find evidence for such an organization of superficial mammary cells by our unbiased analysis with 3D confocal microscopy. Here, we delineate an undescribed mechanism of organ invagination driven by a rim of contractile keratinocytes around the invaginating multilayered tissue. These cells are characterized by high intensity of both F-actin and pMLC. Their morphology and, in particular, functionality were impaired upon conditional deletion of NMIIA, ultimately leading to compromised, but not abolished, invagination. Of note, mammals have three isoforms on NMII proteins, namely NMIIA, IIB, and IIC encoded by three genes, Myh9, Myh10, and Myh14, respectively (Brito and Sousa, 2020; Heissler and Manstein, 2013; Marigo et al., 2004), and NMIIB is likely to act redundantly with NMIIA (Ma et al., 2010).
Our findings do not exclude the involvement of other mechanisms and cell types in mammary bud invagination. It is possible that passive forces generated by the proliferative epidermis and nonproliferative placode lead to mechanical instability that is locally stabilized by the ring cells’ contractility, resulting in invagination via a buckling type of mechanism (Nelson, 2016). Another obvious candidate is the MECs themselves. The majority of the basal mammary cells (in contrast to epidermal cells) had narrow apical surfaces, and their sphericity decreased gradually during the invagination process, suggesting that apical constriction may take place. Also, the mesenchyme may be involved; mammary mesenchyme begins to condense around the mammary bud at ∼E12.5 (Propper et al., 2013), coinciding with the onset of invagination. Computational models of developing teeth suggest that both proliferation and adhesion of mesenchymal cells contribute to tooth germ-shape determination (Marin-Riera et al., 2018).
The molecular signals that regulate mammary placode invagination are unknown. How do the ring cells get specified? They likely receive cues both from the placode as well as from the epidermis/underlying dermis, a combination that may generate a unique molecular milieu. We are aware of only one gene, Sostdc1, being expressed at high levels at the edges of the mammary bud, matching the location of the ring cells (Närhi et al., 2012). Intriguingly, Sostdc1-null embryos have a much wider neck at the bulb stage (E13.5) and show ectopic TCF/Lef1-lacZ (TOP-GAL) Wnt reporter expression in the region where ring cells are located (Närhi et al., 2012). Although very speculative, this may imply that Wnt signaling needs to be suppressed for the ring cells to be specified and/or functional. Also, the Hh pathway has been implicated in negatively regulating mammary bud invagination. In mice mutant for Gli3 (a.k.a. Extra-toes), a repressor of the Hh pathway, mammary buds often evaginate rather than invaginate (Lee et al., 2011). Analysis of Hh pathway reporter expression revealed ectopic Hh signaling specifically in the condensed mammary mesenchyme (Hatsell and Cowin, 2006). How Hh activity changes the behavior of mammary mesenchymal cells has not yet been explored.
In conclusion, this work provides new insights into early mammary morphogenesis by showing that mammary placodes coalesce by cell migration and proposes a previously undescribed invagination mechanism through a rim of contractile epithelial cells. This process bears resemblance to eyelid closure, where the leading edge of the eyelid epithelium consists of several layers of elongated cells perpendicular to the closure axis, creating a circle-like structure, similar in appearance to ring cells (Heller et al., 2014). The edge cells intercalate in a NMIIA-dependent manner, creating local compression that leads to the pulling of the surrounding epidermis to close the eye. Hence, although the contractile rim of cells surrounds an open space and is not associated with tissue invagination, it is mechanistically very similar to the process described in our study. These findings indicate that intercalating rings of contractile epithelial cells may be a more common theme in development than previously appreciated.
Materials and methods
Mice
The following mice were maintained on C57Bl/6 background: R26RtdTomato (Stock 007914), R26RCreERT2 (Stock 008463), and TCF/Lef1:H2B-GFP (Stock 013752), all obtained from The Jackson Laboratory. Myh9 floxed mice (Léon et al., 2007) were obtained from the European Mouse Mutant Archive (EM:02572) and crossed with the K14-Cre line that was previously described (Hafner et al., 2004). NF-κB-gal (Bhakar et al., 2002), FGF20-LacZ (Huh et al., 2012), and R26R-RG mice (Shioi et al., 2011) have been previously described. The following mice were maintained on NMRI background: Fucci dual transgenic (Sakaue-Sawano et al., 2008), TOP-gal (DasGupta and Fuchs, 1999), K17-GFP (Bianchi et al., 2005), and K14-Cre43 (Andl et al., 2004) used for crossing with R26RmT/mG mice. R26RmT/mG mice obtained from The Jackson Laboratory (Stock 007576) were in ICR background.
Mice were kept in 12-h light-dark cycles with food and water given ad libitum. To label tdTomato-expressing cells, pregnant R26RtdT/tdT females mated with R26RCreERT2 males were administered 0.5 mg tamoxifen (Sigma-Aldrich) and 25 mg progesterone (Sigma-Aldrich) dissolved in corn oil (Sigma-Aldrich) via intraperitoneal injection at 10:30 am, 24 h before sample collection. Embryonic ages were always assessed by the same person (E. Trela) and were defined based on the date of the vaginal plug, limb and craniofacial morphology, and other external criteria (Martin, 1990). For embryos younger than E12.0, the number of somites was used to stage the embryos (Theiler, 1989).
All mouse studies were approved and performed in accordance with the guidelines of the Finnish national animal experimentation board.
Immunostaining and whole-mount confocal microscopy
Immunostaining was performed with the following antibodies and reagents: rat anti-EpCAM (1:500; BD PharMingen; 552370), rabbit anti-GM130 (1:1,000; Sigma-Aldrich; G7295), mouse anti-pMLC (1:200; Cell Signaling Technology; 3675S), rabbit anti-NMIIA (1:1,000; BioLegend; 909801), rabbit anti-βgalactosidase (1:1,000; MP Biomedicals; 559762), and rabbit anti-Lef1 (1:1,000; Cell Signaling Technology; 2230S). F-actin was detected with Alexa Fluor 568–conjugated phalloidin (1:30; Thermo Fisher Scientific; A12380). Alexa Fluor 488– or 647–conjugated secondary antibodies (1:500; Life Technologies) were used. To detect nuclei, Hoechst33342 (1:2,000; Thermo Fisher Scientific; H3570) was used.
For whole-mount confocal microscopy, embryonic mouse flanks were dissected onto 0.1-µm nucleopore filters and fixed in 4% PFA in PBS for 1 h at room temperature. Subsequently, samples were washed in PBS and blocked in 5% normal goat serum, 0.1% Triton X-100 in PBS for 3–24 h, at 4°C. Primary antibody cocktail with Hoechst33342 was prepared in blocking solution, and samples were incubated for 24–48 h at 4°C. The tissues were washed several times in large volumes of PBS and 0.1% Triton X-100 in PBS over 6–24 h at 4°C. Secondary antibody cocktail with Hoechst33342 in blocking solution was incubated with the samples for 24–48 h at 4°C. Samples were washed excessively with 0.1% Triton X-100 in PBS and mounted with Vectashield. The images of the tissues were acquired as z-stacks using a photo multiplier tube with Zeiss LSM700 (Carl Zeiss Microscopy GmbH) upright laser scanning confocal microscope with 25×/0.8 Plan-Apochromat oil-immersion objective (glycerol, room temperature) at the optimal image resolution using ZEN black 2.3 software.
Scanning electron microscopy
Samples were fixed in 2.5% glutaraldehyde in 0.1 M NaPO4 (pH 7.4) overnight in 4°C. The samples were then postfixed with 1% OsO4 for 1 h at room temperature and dehydrated through a graded series of ethanol followed by drying by critical point dehydration. Samples mounted into aluminum stubs and coated with platinum were imaged with FEI Quanta 250 Field Emission Gun scanning electron microscope (FEI) using an Everhart-Thornley secondary electron detector and xT microscope control software version 4.1.10.2127.
Live imaging
Live imaging was performed as described previously (Miroshnikova et al., 2018). Briefly, E11.25 K17-GFP/Fucci, mKO2 whole embryo, or E12.5 R26RmT/mG/K14-Cre or R26R-RG/K14-Cre whole embryos were dissected out from the uterus and collected and placed in keratinocyte growth medium (CELLnTEC Advanced Cell Systems) supplemented with 10% (vol/vol) heat-inactivated fetal bovine serum (HyClone/Thermo Fisher Scientific; SV30160.03) and 20 U/ml penicillin-streptomycin (Gibco/Thermo Fisher Scientific; 15140), 20 mM Hepes (VWR International), 1.8 mM CaCl2 (Merck), and 10 ng/ml mouse recombinant EGF (Merck/MilliporeSigma; SPR3196). Next, embryos were immobilized on the side in a custom-built imaging chamber using Lumox dish 35 (Sarstedt AG & Co. KG) and imaged using Leica Stellaris 8 Falcon (Leica Microsystems) inverted laser scanning confocal microscope with HC PL APO 10×/0.40 CS2 air objective (for E11.25 mammary placode imaging) at 37°C, 5% CO2 using LAS X 4.1.1 software or Andor Dragonfly 505 high-speed spinning disk confocal microscopy system (Oxford Instruments) with inverted Nikon Eclipse Ti2 microscope (Nikon Corporation) with 40×/1.15 Apo LWD water objective (for imaging of E12.5 ring cells) at 37°C, 5% CO2 using Fusion 2.0 software. The images were acquired using a Hyd S or HyD X detector (Leica Microsystems) as z-stacks of 4–5-µm optical sections every 15 min for 6 h (E11.25 mammary placode imaging) and Andor Zyla 4.2 sCMOS (Oxford Instruments) as z-stacks of ∼1.5-µm optical sections for 5.5 h (for imaging of E12.5 ring cells).
EdU incorporation
To label proliferating cells, pregnant NMRI females were mated with Fucci, mKO males and injected (i.p.) with 25 mg/kg body weight of EdU (Life Technologies) at 7.5 mg/ml in saline 2 h before sacrifice. Collected samples were fixed with 4% PFA in PBS, and EdU detection was performed in whole mounts with the Click-iT kit (Thermo Fisher Scientific) following the protocol provided by the manufacturer. In essence, samples were permeabilized with 3% BSA, 0.25% Triton X-100 (MP Biomedicals) in PBS for 2 h, stained with Click-iT reaction cocktail containing Alexa Fluor 488–azide for 2 h protected from light, and washed thoroughly for 0.5 h with 3% BSA in PBS. Subsequently, samples were immunostained with rat anti-EpCAM (1:500; BD PharMingen; 552370) and Alexa Fluor 647–conjugated secondary antibodies (1:500; Life Technologies) with Hoechst33342 (1:2,000; Thermo Fisher Scientific; H3570) to detect nuclei and mounted in Vectashield.
Image analysis
Images were analyzed in 3D using Imaris software version 9.2.1 and 9.5.1 (Bitplane). Briefly, all measurements were done in 3D from confocal optical stacks unless otherwise indicated. To quantify shape and size of wild-type and Myh9 cKO mammary rudiments, their surfaces were rendered by manual drawing of the tissue contour in every third optical section using distance drawing mode. Shape was defined based on the expression of an epithelial marker and morphology of the organ. The following parameters were used: surface grain size 0.3 µm and contour with vertex spacing 2 µm. Statistical output of surface rendering was used to analyze mammary gland volume. To quantify mammary bud depth, the measurement point was manually placed in the center of top and bottom domains of each of the mammary buds.
To analyze cell cycle status and total number of cells, nuclear length of 25 cells in Z dimension was determined by manual measuring. The mean nuclear length of cells was used to calculate the distance between consecutive optical sections analyzed by manual cell counting in Carl Zeiss Microscopy software ZEN Lite 2.3. Cells expressing either of the markers for G1/G0 and S/G2/M phases or both were also used for cell cycle status quantification. In addition, cells expressing only nuclear marker were included in the analysis of total number of cells.
Nuclear shape analysis was performed by surface rendering of nuclei based on MECs masked with epithelial marker. For the surface creation wizard, intensity levels for G1/G0 and TCF/Lef1:H2B-GFP or both were manually set, and surface grain size was set to 0.3 µm. Statistical output of surface rendering was used to analyze sphericity.
To assess epidermal contact area for both wild-type and Myh9 cKO samples, the curve line in Carl Zeiss Microscopy software ZEN Lite 2.3 was used to manually draw a line between the top domain of the mammary gland and the lowest compartment of overlying epidermis.
To analyze cells’ size and shape in 3D, randomly selected tdTomato-expressing epithelial cells (EpCAM+ cells) were masked. Subsequently, cells located in mammary gland were surface rendered as described for nuclei, with manually set threshold according to the intensity levels and surface grain size set to 0.3 µm. Each cell was checked with nuclear staining to ensure a single nucleus in each cell for correct rendering. Statistical output of surface rendering was used to analyze cell volume and sphericity. To assess cell polarity, both nuclear and Golgi marker expression was masked within each cell. Spot mode was used for that purpose, with spots placed in the center of the intensity areas using background subtraction and estimated diameter 3.5 and 8.0 µm for Golgi and nuclear marker, respectively. Coordinates of these spots were extracted using the Imaris software and were used to analyze cell orientations in R, a free software environment available at http://www.r-project.org using packages “tidyverse” (Wickham et al., 2019), “spedp” (Bivand et al., 2013; Bivand and Wong, 2018), “ggplot2” (Wickham, 2016), and “circular” (Agostinelli and Lund, 2017) for analyzing and producing the figures.
To analyze the 2D shape of ring cells in Myh9 cKO and control littermates, cells were segmented from confocal slices of the mammary rudiment with the surrounding epidermis based on EpCAM staining using the Tissue Analyzer (Aigouy et al., 2016) plugin of Fiji (Schindelin et al., 2012). Cell boundaries were manually corrected and detected from label images with the label boundaries function of MorphoLibJ (Legland et al., 2016). Cells were identified based on cell boundaries using the Extended Particle Analyzer of BioVoxxel toolbox (Brocher, J. 2015. EuBIAS Conference; https://www.biovoxxel.de/development/), analyzed for cell shape parameters, and opened in Region of Interest manager. Cells smaller than 25 µm2, representing cell edges, were excluded from the analysis. For spatial analysis, the distance of cells from the mammary epithelial border was determined using a 2D distance map of Fiji, created from a mask of the mammary rudiment. The measure function of the Region of Interest manager was then used to read the distance map and corresponding image slices of pMLC, F-actin, and NMIIA staining to analyze mean gray values within cells at different distances. Mean gray values of pMLC and F-actin epithelial staining were normalized to the mean gray value of the mesenchyme adjacent to the epidermis, averaged from three large free-hand selections of different confocal slices. Cells close to the mammary epithelial border (0–30 µm) and at a distance (70–100 µm) were selected to analyze ring and epidermal cells, respectively.
A roundness heatmap of the mammary rudiment at hillock (E12.5) and bulb (E13.5) stages from Myh9 cKO and control littermates was created using Shape Description Maps from BioVoxxel toolbox (Brocher, J. 2015. EuBIAS Conference; https://www.biovoxxel.de/development/).
Statistical analysis
To assess statistical significance, Prism Software version 8.2.1 and 9.0.1 (GraphPad Software) or circular package for R were used (Agostinelli and Lund, 2017). The normality of data distribution was analyzed using the Shapiro-Wilk test. Normally distributed data were analyzed using two-tailed Student’s t test or one-way ANOVA. Data that failed the Shapiro-Wilk test were analyzed with the Kruskal-Wallis test or Mann-Whitney U test. Rayleigh’s Z-test was used to test normal distribution of mammary epithelial and epidermal cell angles at E11.5 from both fixed and live data and ring cells at E12.5 from both fixed and live data, followed by Watson’s U2 test to analyze significance of mammary epithelial and epidermal cells’ angles at E11.5 and E12.5.
Online supplemental material
Fig. S1 (related to Fig. 1) shows mammary epithelial markers expressed at the placode stage (E11.5) and mammary placode position in relation to body axes. Fig. S2 (related to Fig. 2) shows early developmental stages from tdTomato and Fucci models, with all markers indicated, and the EdU incorporation assay experiment. Fig. S3 (related to Fig. 3) shows steps taken in image analysis to quantify nuclear sphericity and confocal images from the placode stage with immunostaining used for cell angle analysis at the placode (E11.5) stage. Lastly, steps taken on image analysis of cell angle are shown in the figure. Fig. S4 (related to Fig. 4) shows how the epidermal contact area was defined and consecutive steps taken in image analysis to quantify ring cell angle in relation to the hillock at E12.5 stage. Fig. S5 (related to Fig. 8) shows NMIIA staining in Myh9 cKO and control littermates, full images of the close-ups from Fig. 8 of planar and sagittal views from Myh9 cKO and control littermates. Additionally, close-ups of mammary buds from phalloidin and pMLC staining are shown. Video 1 shows live imaging of the mammary placode at E11.25. Video 2 shows ring cell and neck cell surface rendering compared with epidermal cells at a corresponding developmental stage. Video 3 shows live imaging of ring cells at the E12.5 stage. Video 4 shows mammary gland surface rendering for Myh9 cKO and control littermates at placode (E11.5), hillock (E12.5), bud (E13.0), and bulb (E13.5) stages. Lastly, the remaining protrusion of mammary rudiment in Myh9 cKO at E13.5 compared with control littermate at the corresponding developmental stage is shown.
Supplementary Material
Acknowledgments
We thank Ms. Raija Savolainen, Ms. Riikka Santalahti, Ms. Merja Mäkinen, and Ms. Agnes Viherä for excellent technical assistance and past and present members of the Mikkola laboratory for discussions. We are thankful to Dr. Deng Yu Hui from Department of Statistics, Division of Science and Technology, Beijing Normal University and Hong Kong Baptist University United International College, Zhuhai, China, for the helpful discussion on image data analysis. Light microscopy imaging was performed at the Light Microscopy Unit of the Institute of Biotechnology and Biomedicum Imaging Unit and electron microscopy at the Electron Microscopy Unit of the Institute of Biotechnology, University of Helsinki, all supported by HiLIFE and Biocenter Finland.
This work was funded by the Academy of Finland, the Sigrid Jusélius Foundation, the Jane and Aatos Erkko Foundation, and the Doctoral Program in Integrative Life Science of the University of Helsinki.
The authors declare no competing financial interests.
Author contributions: M.L. Mikkola conceived and supervised the project; E. Trela, Q. Lan, S.-M. Myllymäki, R. Lindström, and V. Kumar designed experiments; E. Trela, Q. Lan, S.-M. Myllymäki, and C. Villeneuve carried out experiments and analyzed the data; S.A. Wickström provided cell biology expertise and the Myh9 floxed mouse model; and E. Trela and M.L. Mikkola wrote the manuscript. All authors edited the manuscript.
References
- Agostinelli, C., and Lund U.. 2017. R package ‘circular’: Circular Statistics (version 0.4-93). https://r-forge.r-project.org/projects/circular/ (accessed March 13, 2021)
- Ahtiainen, L., Lefebvre S., Lindfors P.H., Renvoisé E., Shirokova V., Vartiainen M.K., Thesleff I., and Mikkola M.L.. 2014. Directional cell migration, but not proliferation, drives hair placode morphogenesis. Dev. Cell. 28:588–602. 10.1016/j.devcel.2014.02.003 [DOI] [PubMed] [Google Scholar]
- Ahtiainen, L., Uski I., Thesleff I., and Mikkola M.L.. 2016. Early epithelial signaling center governs tooth budding morphogenesis. J. Cell Biol. 214:753–767. 10.1083/jcb.201512074 [DOI] [PMC free article] [PubMed] [Google Scholar]
- Aigouy, B., Umetsu D., and Eaton S.. 2016. Segmentation and Quantitative Analysis of Epithelial Tissues. Methods Mol. Biol. 1478:227–239. 10.1007/978-1-4939-6371-3_13 [DOI] [PubMed] [Google Scholar]
- Andl, T., Ahn K., Kairo A., Chu E.Y., Wine-Lee L., Reddy S.T., Croft N.J., Cebra-Thomas J.A., Metzger D., Chambon P., et al. 2004. Epithelial Bmpr1a regulates differentiation and proliferation in postnatal hair follicles and is essential for tooth development. Development. 131:2257–2268. 10.1242/dev.01125 [DOI] [PubMed] [Google Scholar]
- Balinsky, B.I.1950. On the prenatal growth of the mammary gland rudiment in the mouse. J. Anat. 84:227–235. [PMC free article] [PubMed] [Google Scholar]
- Balinsky, B.I.1952. I.—On the Developmental Processes in Mammary Glands and other Epidermal Structures. Trans. R. Soc. Edinb. 62:1–31. 10.1017/S0080456800009224 [DOI] [Google Scholar]
- Bhakar, A.L., Tannis L.L., Zeindler C., Russo M.P., Jobin C., Park D.S., MacPherson S., and Barker P.A.. 2002. Constitutive nuclear factor-kappa B activity is required for central neuron survival. J. Neurosci. 22:8466–8475. 10.1523/JNEUROSCI.22-19-08466.2002 [DOI] [PMC free article] [PubMed] [Google Scholar]
- Bianchi, N., Depianto D., McGowan K., Gu C., and Coulombe P.A.. 2005. Exploiting the keratin 17 gene promoter to visualize live cells in epithelial appendages of mice. Mol. Cell. Biol. 25:7249–7259. 10.1128/MCB.25.16.7249-7259.2005 [DOI] [PMC free article] [PubMed] [Google Scholar]
- Biggs, L.C., and Mikkola M.L.. 2014. Early inductive events in ectodermal appendage morphogenesis. Semin. Cell Dev. Biol. 25-26:11–21. 10.1016/j.semcdb.2014.01.007 [DOI] [PubMed] [Google Scholar]
- Bivand, R., and Wong D.W.S.. 2018. Comparing implementations of global and local indicators of spatial association. Test. 27:716–748. 10.1007/s11749-018-0599-x [DOI] [Google Scholar]
- Bivand, R.S., Pebesma E., and Gomez-Rubio V.. 2013. Applied spatial data analysis with R. Second edition. Springer, New York. 10.1007/978-1-4614-7618-4 [DOI] [Google Scholar]
- Brito, C., and Sousa S.. 2020. Non-Muscle Myosin 2A (NM2A): Structure, Regulation and Function. Cells. 9:1590. 10.3390/cells9071590 [DOI] [PMC free article] [PubMed] [Google Scholar]
- Chiang, C., Swan R.Z., Grachtchouk M., Bolinger M., Litingtung Y., Robertson E.K., Cooper M.K., Gaffield W., Westphal H., Beachy P.A., and Dlugosz A.A.. 1999. Essential role for Sonic hedgehog during hair follicle morphogenesis. Dev. Biol. 205:1–9. 10.1006/dbio.1998.9103 [DOI] [PubMed] [Google Scholar]
- Chu, E.Y., Hens J., Andl T., Kairo A., Yamaguchi T.P., Brisken C., Glick A., Wysolmerski J.J., and Millar S.E.. 2004. Canonical WNT signaling promotes mammary placode development and is essential for initiation of mammary gland morphogenesis. Development. 131:4819–4829. 10.1242/dev.01347 [DOI] [PubMed] [Google Scholar]
- Cowin, P., and Wysolmerski J.. 2010. Molecular mechanisms guiding embryonic mammary gland development. Cold Spring Harb. Perspect. Biol. 2:a003251. 10.1101/cshperspect.a003251 [DOI] [PMC free article] [PubMed] [Google Scholar]
- DasGupta, R., and Fuchs E.. 1999. Multiple roles for activated LEF/TCF transcription complexes during hair follicle development and differentiation. Development. 126:4557–4568. 10.1242/dev.126.20.4557 [DOI] [PubMed] [Google Scholar]
- Davidson, L.A.2012. Epithelial machines that shape the embryo. Trends Cell Biol. 22:82–87. 10.1016/j.tcb.2011.10.005 [DOI] [PMC free article] [PubMed] [Google Scholar]
- Elo, T., Lindfors P.H., Lan Q., Voutilainen M., Trela E., Ohlsson C., Huh S.H., Ornitz D.M., Poutanen M., Howard B.A., and Mikkola M.L.. 2017. Ectodysplasin target gene Fgf20 regulates mammary bud growth and ductal invasion and branching during puberty. Sci. Rep. 7:5049. 10.1038/s41598-017-04637-1 [DOI] [PMC free article] [PubMed] [Google Scholar]
- Ferrer-Vaquer, A., Piliszek A., Tian G., Aho R.J., Dufort D., and Hadjantonakis A.K.. 2010. A sensitive and bright single-cell resolution live imaging reporter of Wnt/ß-catenin signaling in the mouse. BMC Dev. Biol. 10:121. 10.1186/1471-213X-10-121 [DOI] [PMC free article] [PubMed] [Google Scholar]
- Friedl, P., Wolf K., and Lammerding J.. 2011. Nuclear mechanics during cell migration. Curr. Opin. Cell Biol. 23:55–64. 10.1016/j.ceb.2010.10.015 [DOI] [PMC free article] [PubMed] [Google Scholar]
- Gritli-Linde, A., Bei M., Maas R., Zhang X.M., Linde A., and McMahon A.P.. 2002. Shh signaling within the dental epithelium is necessary for cell proliferation, growth and polarization. Development. 129:5323–5337. 10.1242/dev.00100 [DOI] [PubMed] [Google Scholar]
- Hafner, M., Wenk J., Nenci A., Pasparakis M., Scharffetter-Kochanek K., Smyth N., Peters T., Kess D., Holtkötter O., Shephard P., et al. 2004. Keratin 14 Cre transgenic mice authenticate keratin 14 as an oocyte-expressed protein. Genesis. 38:176–181. 10.1002/gene.20016 [DOI] [PubMed] [Google Scholar]
- Hatsell, S.J., and Cowin P.. 2006. Gli3-mediated repression of Hedgehog targets is required for normal mammary development. Development. 133:3661–3670. 10.1242/dev.02542 [DOI] [PubMed] [Google Scholar]
- Heissler, S.M., and Manstein D.J.. 2013. Nonmuscle myosin-2: mix and match. Cell. Mol. Life Sci. 70:1–21. 10.1007/s00018-012-1002-9 [DOI] [PMC free article] [PubMed] [Google Scholar]
- Heller, E., Kumar K.V., Grill S.W., and Fuchs E.. 2014. Forces generated by cell intercalation tow epidermal sheets in mammalian tissue morphogenesis. Dev. Cell. 28:617–632. 10.1016/j.devcel.2014.02.011 [DOI] [PMC free article] [PubMed] [Google Scholar]
- Hens, J.R., Dann P., Zhang J.P., Harris S., Robinson G.W., and Wysolmerski J.. 2007. BMP4 and PTHrP interact to stimulate ductal outgrowth during embryonic mammary development and to inhibit hair follicle induction. Development. 134:1221–1230. 10.1242/dev.000182 [DOI] [PubMed] [Google Scholar]
- Hiremath, M., Dann P., Fischer J., Butterworth D., Boras-Granic K., Hens J., Van Houten J., Shi W., and Wysolmerski J.. 2012. Parathyroid hormone-related protein activates Wnt signaling to specify the embryonic mammary mesenchyme. Development. 139:4239–4249. 10.1242/dev.080671 [DOI] [PMC free article] [PubMed] [Google Scholar]
- Huh, S.H., Jones J., Warchol M.E., and Ornitz D.M.. 2012. Differentiation of the lateral compartment of the cochlea requires a temporally restricted FGF20 signal. PLoS Biol. 10:e1001231. 10.1371/journal.pbio.1001231 [DOI] [PMC free article] [PubMed] [Google Scholar]
- Hurtado, L., Caballero C., Gavilan M.P., Cardenas J., Bornens M., and Rios R.M.. 2011. Disconnecting the Golgi ribbon from the centrosome prevents directional cell migration and ciliogenesis. J. Cell Biol. 193:917–933. 10.1083/jcb.201011014 [DOI] [PMC free article] [PubMed] [Google Scholar]
- Kogata, N., Oliemuller E., Wansbury O., and Howard B.A.. 2014. Neuregulin-3 regulates epithelial progenitor cell positioning and specifies mammary phenotype. Stem Cells Dev. 23:2758–2770. 10.1089/scd.2014.0082 [DOI] [PubMed] [Google Scholar]
- Lee, M.Y., Racine V., Jagadpramana P., Sun L., Yu W., Du T., Spencer-Dene B., Rubin N., Le L., Ndiaye D., et al. 2011. Ectodermal influx and cell hypertrophy provide early growth for all murine mammary rudiments, and are differentially regulated among them by Gli3. PLoS One. 6:e26242. 10.1371/journal.pone.0026242 [DOI] [PMC free article] [PubMed] [Google Scholar]
- Legland, D., Arganda-Carreras I., and Andrey P.. 2016. MorphoLibJ: integrated library and plugins for mathematical morphology with ImageJ. Bioinformatics. 32:3532–3534. 10.1093/bioinformatics/btw413 [DOI] [PubMed] [Google Scholar]
- Léon, C., Eckly A., Hechler B., Aleil B., Freund M., Ravanat C., Jourdain M., Nonne C., Weber J., Tiedt R., et al. 2007. Megakaryocyte-restricted MYH9 inactivation dramatically affects hemostasis while preserving platelet aggregation and secretion. Blood. 110:3183–3191. 10.1182/blood-2007-03-080184 [DOI] [PubMed] [Google Scholar]
- M’Boneko, V., and Merker H.J.. 1988. Development and morphology of the periderm of mouse embryos (days 9-12 of gestation). Acta Anat. (Basel). 133:325–336. 10.1159/000146662 [DOI] [PubMed] [Google Scholar]
- Ma, X., Jana S.S., Conti M.A., Kawamoto S., Claycomb W.C., and Adelstein R.S.. 2010. Ablation of nonmuscle myosin II-B and II-C reveals a role for nonmuscle myosin II in cardiac myocyte karyokinesis. Mol. Biol. Cell. 21:3952–3962. 10.1091/mbc.e10-04-0293 [DOI] [PMC free article] [PubMed] [Google Scholar]
- Mailleux, A.A., Spencer-Dene B., Dillon C., Ndiaye D., Savona-Baron C., Itoh N., Kato S., Dickson C., Thiery J.P., and Bellusci S.. 2002. Role of FGF10/FGFR2b signaling during mammary gland development in the mouse embryo. Development. 129:53–60. 10.1242/dev.129.1.53 [DOI] [PubMed] [Google Scholar]
- Marigo, V., Nigro A., Pecci A., Montanaro D., Di Stazio M., Balduini C.L., and Savoia A.. 2004. Correlation between the clinical phenotype of MYH9-related disease and tissue distribution of class II nonmuscle myosin heavy chains. Genomics. 83:1125–1133. 10.1016/j.ygeno.2003.12.012 [DOI] [PubMed] [Google Scholar]
- Marin-Riera, M., Moustakas-Verho J., Savriama Y., Jernvall J., and Salazar-Ciudad I.. 2018. Differential tissue growth and cell adhesion alone drive early tooth morphogenesis: An ex vivo and in silico study. PLOS Comput. Biol. 14:e1005981. 10.1371/journal.pcbi.1005981 [DOI] [PMC free article] [PubMed] [Google Scholar]
- Martin, P.1990. Tissue patterning in the developing mouse limb. Int. J. Dev. Biol. 34:323–336. [PubMed] [Google Scholar]
- Miroshnikova, Y.A., Le H.Q., Schneider D., Thalheim T., Rübsam M., Bremicker N., Polleux J., Kamprad N., Tarantola M., Wang I., et al. 2018. Adhesion forces and cortical tension couple cell proliferation and differentiation to drive epidermal stratification. Nat. Cell Biol. 20:69–80. 10.1038/s41556-017-0005-z [DOI] [PubMed] [Google Scholar]
- Montell, D.J.2008. Morphogenetic cell movements: diversity from modular mechanical properties. Science. 322:1502–1505. 10.1126/science.1164073 [DOI] [PubMed] [Google Scholar]
- Munjal, A., and Lecuit T.. 2014. Actomyosin networks and tissue morphogenesis. Development. 141:1789–1793. 10.1242/dev.091645 [DOI] [PubMed] [Google Scholar]
- Mustonen, T., Pispa J., Mikkola M.L., Pummila M., Kangas A.T., Pakkasjärvi L., Jaatinen R., and Thesleff I.. 2003. Stimulation of ectodermal organ development by Ectodysplasin-A1. Dev. Biol. 259:123–136. 10.1016/S0012-1606(03)00157-X [DOI] [PubMed] [Google Scholar]
- Mustonen, T., Ilmonen M., Pummila M., Kangas A.T., Laurikkala J., Jaatinen R., Pispa J., Gaide O., Schneider P., Thesleff I., and Mikkola M.L.. 2004. Ectodysplasin A1 promotes placodal cell fate during early morphogenesis of ectodermal appendages. Development. 131:4907–4919. 10.1242/dev.01377 [DOI] [PubMed] [Google Scholar]
- Myllymäki, S.M., and Mikkola M.L.. 2019. Inductive signals in branching morphogenesis - lessons from mammary and salivary glands. Curr. Opin. Cell Biol. 61:72–78. 10.1016/j.ceb.2019.07.001 [DOI] [PubMed] [Google Scholar]
- Närhi, K., Tummers M., Ahtiainen L., Itoh N., Thesleff I., and Mikkola M.L.. 2012. Sostdc1 defines the size and number of skin appendage placodes. Dev. Biol. 364:149–161. 10.1016/j.ydbio.2012.01.026 [DOI] [PubMed] [Google Scholar]
- Nelson, C.M.2016. On Buckling Morphogenesis. J. Biomech. Eng. 138:021005. 10.1115/1.4032128 [DOI] [PMC free article] [PubMed] [Google Scholar]
- Ouspenskaia, T., Matos I., Mertz A.F., Fiore V.F., and Fuchs E.. 2016. WNT-SHH Antagonism Specifies and Expands Stem Cells prior to Niche Formation. Cell. 164:156–169. 10.1016/j.cell.2015.11.058 [DOI] [PMC free article] [PubMed] [Google Scholar]
- Panousopoulou, E., and Green J.B.. 2016. Invagination of Ectodermal Placodes Is Driven by Cell Intercalation-Mediated Contraction of the Suprabasal Tissue Canopy. PLoS Biol. 14:e1002405. 10.1371/journal.pbio.1002405 [DOI] [PMC free article] [PubMed] [Google Scholar]
- Pearl, E.J., Li J., and Green J.B.. 2017. Cellular systems for epithelial invagination. Philos. Trans. R. Soc. Lond. B Biol. Sci. 372:20150526. 10.1098/rstb.2015.0526 [DOI] [PMC free article] [PubMed] [Google Scholar]
- Pispa, J., and Thesleff I.. 2003. Mechanisms of ectodermal organogenesis. Dev. Biol. 262:195–205. 10.1016/S0012-1606(03)00325-7 [DOI] [PubMed] [Google Scholar]
- Propper, A.Y.1978. Wandering epithelial cells in the rabbit embryo milk line. A preliminary scanning electron microscope study. Dev. Biol. 67:225–231. 10.1016/0012-1606(78)90311-1 [DOI] [PubMed] [Google Scholar]
- Propper, A.Y., Howard B.A., and Veltmaat J.M.. 2013. Prenatal morphogenesis of mammary glands in mouse and rabbit. J. Mammary Gland Biol. Neoplasia. 18:93–104. 10.1007/s10911-013-9298-0 [DOI] [PMC free article] [PubMed] [Google Scholar]
- Ravichandran, Y., Goud B., and Manneville J.B.. 2020. The Golgi apparatus and cell polarity: Roles of the cytoskeleton, the Golgi matrix, and Golgi membranes. Curr. Opin. Cell Biol. 62:104–113. 10.1016/j.ceb.2019.10.003 [DOI] [PubMed] [Google Scholar]
- Sakaue-Sawano, A., Kurokawa H., Morimura T., Hanyu A., Hama H., Osawa H., Kashiwagi S., Fukami K., Miyata T., Miyoshi H., et al. 2008. Visualizing spatiotemporal dynamics of multicellular cell-cycle progression. Cell. 132:487–498. 10.1016/j.cell.2007.12.033 [DOI] [PubMed] [Google Scholar]
- Schindelin, J., Arganda-Carreras I., Frise E., Kaynig V., Longair M., Pietzsch T., Preibisch S., Rueden C., Saalfeld S., Schmid B., et al. 2012. Fiji: an open-source platform for biological-image analysis. Nat. Methods. 9:676–682. 10.1038/nmeth.2019 [DOI] [PMC free article] [PubMed] [Google Scholar]
- Shioi, G., Kiyonari H., Abe T., Nakao K., Fujimori T., Jang C.W., Huang C.C., Akiyama H., Behringer R.R., and Aizawa S.. 2011. A mouse reporter line to conditionally mark nuclei and cell membranes for in vivo live-imaging. Genesis. 49:570–578. 10.1002/dvg.20758 [DOI] [PMC free article] [PubMed] [Google Scholar]
- St-Jacques, B., Dassule H.R., Karavanova I., Botchkarev V.A., Li J., Danielian P.S., McMahon J.A., Lewis P.M., Paus R., and McMahon A.P.. 1998. Sonic hedgehog signaling is essential for hair development. Curr. Biol. 8:1058–1068. 10.1016/S0960-9822(98)70443-9 [DOI] [PubMed] [Google Scholar]
- St Johnston, D., and Sanson B.. 2011. Epithelial polarity and morphogenesis. Curr. Opin. Cell Biol. 23:540–546. 10.1016/j.ceb.2011.07.005 [DOI] [PubMed] [Google Scholar]
- Theiler, K.1989. The House Mouse Atlas of Embryonic Development. Springer-Verlag, Berlin. 10.1007/978-3-642-88418-4 [DOI] [Google Scholar]
- Veltmaat, J.M., Mailleux A.A., Thiery J.P., and Bellusci S.. 2003. Mouse embryonic mammogenesis as a model for the molecular regulation of pattern formation. Differentiation. 71:1–17. 10.1046/j.1432-0436.2003.700601.x [DOI] [PubMed] [Google Scholar]
- Veltmaat, J.M., Van Veelen W., Thiery J.P., and Bellusci S.. 2004. Identification of the mammary line in mouse by Wnt10b expression. Dev. Dyn. 229:349–356. 10.1002/dvdy.10441 [DOI] [PubMed] [Google Scholar]
- Wickham, H.2016. ggplot2: Elegant Graphics for Data Analysis. Springer-Verlag, New York. 10.1007/978-3-319-24277-4 [DOI] [Google Scholar]
- Wickham, H., Averick M., Bryan J., Chang W., Mcgowan L.D.A., François R., Grolemund G., Hayes A., Henry L., Hester J., et al. 2019. Welcome to the tidyverse. J. Open Source Softw. 4:1686. 10.21105/joss.01686 [DOI] [Google Scholar]
Associated Data
This section collects any data citations, data availability statements, or supplementary materials included in this article.


