Abstract
The complexity of biological mixtures continues to challenge efforts aimed at unknown metabolite identification in the metabolomics field. To address this challenge, we provide a new method to identify related peaks from individual metabolites in complex NMR spectra. Extractive ratio analysis NMR spectroscopy (E-RANSY) builds on our previously described ratio analysis method [Anal. Chem. 2011, 83, 7616-7623] and exploits the simplified NMR spectra provided by the extraction of metabolites under varied pH conditions. Under such conditions, metabolites from the same biological specimen are extracted differentially and the resulting NMR spectra exhibit characteristics favorable for unraveling unknown metabolite peaks using ratio analysis. We demonstrate the utility of the E-RANSY method by extracting carboxylic acid containing metabolites from human urine, one of the highly complex biological mixtures encountered in the metabolomics field. E-RANSY performs better than the original RANSY method and offers new avenues to identify unknown metabolites in complex biological mixtures.
Keywords: NMR, ratio analysis, pH extraction, urine, unknown metabolite identification
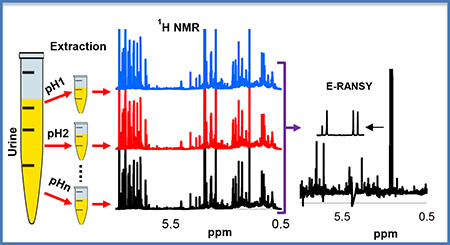
Graphical Abstract
INTRODUCTION
NMR spectroscopy exhibits numerous unique characteristics that are favorable for metabolomics applications. In particular, besides accurate quantitation, NMR’s capability to establish identity of unknown metabolites is unmatched. Currently, a combination of one and two-dimensional NMR experiments have been widely used to quantify metabolites and to identify unknown metabolites.1–7 In addition, publicly available spectral libraries and chemical shift databases such as HMDB (Human Metabolome Database),8 BMRB (Biological Magnetic Resonance Data Bank),9 MMCD (Madison Metabolomics Consortium Database),10 COLMAR (Complex Mixture Analysis by NMR),11 and PRIMe (Platform for RIKEN Metabolomics)12 have aided the identification of unknown metabolites immensely. More recent advances enable automated analysis of NMR spectra by combining chemical shift databases with computer algorithms.13,14 Such automated analysis tools enable metabolomics analyses even for researchers with limited knowledge of the interpretation of NMR spectra. Despite many such advances, however, a large number of metabolites detected in the NMR spectra of complex biological specimens such as urine remain unknown.
To address this challenge, efforts to facilitate compound identification have focused on reducing the spectral complexity and identifying NMR peaks that belong to the same compound, and include the development of statistical correlation, covariance NMR, and ratio analysis methods. For example, in statistical total correlation spectroscopy (STOCSY), peaks are identified based on high correlations obtained by generating correlation coefficients between every pair of 1D NMR peaks across multiple spectra.15,16 A covariance based algorithm called COLMAR (Complex Mixture Analysis by NMR) helps to identify metabolites combining spectral data from BMRB and HMDB.11 Ratio analysis, on the other hand, is based on the analysis of intensity ratios between peaks from the same metabolite, and has been applied to both NMR spectrosocpy (RANSY)17 and mass spectromtery (RAMSY).18 RANSY works on the principle that the NMR intensity ratios between peaks from the same metabolite are fixed; thus multiple peaks from a specific metabolite can be identified based on ratios of peak integrals.17 RAMSY, the mass spectrometry analogue of RANSY, similarly works on the principle that the abundance/intensity ratios between the mass fragments from the same metabolite are relatively constant. Therefore, the quotient of average peak ratios and their standard deviations generated using a small set of mass spectra from the same ion chromatogram, allows the statistical recovery of all the mass fragments and facilitate reliable identification of unknown metabolites efficiently. Unlike RAMSY, however, the challenge for RANSY is that it generally works with complex untargted NMR spectra, as samples are not subjected to prior simplication or separation methods before acquring the data. Therefore, isolation of metabolite peaks in NMR spectra of highly complex bifluids such as urine often becomes challenging even for the RANSY method.
In this study, we describe the development of an improved approach, which we call E-RANSY (extractive RANSY). E-RANSY involves extraction of metabolites in the same sample using a single solvent at different pH. The method was first developed using a mixture of standard compounds and then applied to the extraction of carboxylic acid containing metabolites from human urine. E-RANSY showed excellent performance based on NMR spectra of urine, after extraction in ethyl acetate at varied pH. The pH-assisted extraction in ethyl acetate offers both metabolite peak intensity variation across the spectra, as required for RANSY, as well as tremendous simplicity compared to the parent (unextracted) spectra. The presented results show superior performance to RANSY as well as the conventional correlation methods, such as STOCSY.
MATERIALS AND METHODS
Chemicals and Solvents.
Forty-nine standard compounds used as metabolite analogues were purchased from Sigma-Aldrich (St. Louis, MO), except for 3-hydroxy-3-methyl-butanoic acid, which was purchased from Fisher Scientific (Waltham, MA) (see SI Table S1). Sodium phosphate monobasic (NaH2PO4), sodium phosphate dibasic (Na2HPO4), and 3-(trimethylsilyl)propionic acid-2,2,3,3-d4 (TSP) were purchased from Sigma-Aldrich (St. Louis, MO). Ethyl acetate was purchased from ACROS Organics (New Jersey, USA). Deuterium Oxide (D2O) was purchased from Cambridge isotope laboratories, Inc. (Andover, MA). Deionized (DI) water was obtained using an in-house Synergy Ultrapure Water System from Millipore (Billerica, MA).
Preparation of Phosphate Buffer in D2O.
Phosphate buffer (0.1 M) was prepared by solubilizing 249.9 mg of anhydrous NaH2PO4 and 1124.0 mg of anhydrous Na2HPO4 into 100 g of D2O and pH adjusted to 7.45±0.01 by adding HCl and/or NaOH solutions. TSP (25 μM) was added to the buffer to be used as a chemical shift reference.
Extraction of Standards Mixture at Different pH.
A solution of 49 standards (~300 μM each; Table S1), was prepared by mixing appropriate volumes of their stock solutions. Using this mixture, 19 different solutions were obtained by extracting standards into ethyl acetate at different pH by liquid-liquid extraction as follows: For each sample, 500 μL of the standard mixture was taken in a 5 mL Eppendorf tube, pH adjusted to a desired value (pH range 0.57 - 12.01) (see SI Table S2) by adding 0.1 to 6 N HCl and/or 0.1 to 1 N NaOH solutions. Each sample was volume adjusted to 550 μL by adding DI water, subjected to liquid-liquid extraction into 1833 μL ethyl acetate (the mixture was stirred and centrifuged at the speed of 4500 ×g for ca. 20 min). 1375 μL of the ethyl acetate layer (top layer) was withdrawn, to which 200 μL DI water was added, then dried with a Vacufuge concentrator (Eppendorf, Hauppauge, NY, USA) and stored at −20 °C until used for NMR analysis.
Urine Extraction at different pH.
Approximately 90 mL urine (45 mL each in two 50 mL Eppendorf tubes) was collected from a healthy individual and pH adjusted to ca. 7.45 by adding 1 N NaOH solution. It was centrifuged (4500 ×g, 30 min) and supernatant separated (solid residue settled at the bottom was discarded). Aliquots (each 4.8 mL in 15 mL Eppendorf tube) of the supernatant urine were dried and the residue was reconstituted into 800 μL deionized (DI) water. For each sample, 600 μL of the reconstituted urine supernatant was taken in a 5 mL Eppendorf tube and pH was adjusted to a desired value (pH range 0.54 -7.36) (see SI Table S3) by adding 1 to 8 N HCl and/or 1 N NaOH solutions. Each solution was then made up to 725 μL by adding DI water. To selectively extract carboxylic acid containing metabolites, each solution was stirred for ca. 30 min with 2.4 mL of ethyl acetate and centrifuged (4500 g, 30 min). 2 mL of ethyl acetate layer (upper layer) was withdrawn, dried, and stored at −20 °C until used for NMR analysis. In total, fourteen extracted urine samples were obtained by this approach.
Intact urine samples.
Eleven urine samples were obtained from the same healthy individual, each sample was obtained on a different day. The samples were spun at 4500 g and 4.8 mL of the supernatants were dried and stored at −20 °C until used for NMR analysis.
NMR Experiments.
All NMR experiments were performed using a Bruker AVANCE III 800 MHz spectrometer using triple-resonance 1H{13C/15N} pulse field gradient cryoprobe. The instrument was equipped with a 24 sample case carousel and a sample changer for automation. Dried residues of standard mixtures as well as urine samples, obtained after solvent extraction, were solubilized into 600 μL phosphate buffer in D2O (pH adjusted to 7.43 ± 0.01) in order to reduce pH effects on the chemical shifts, and the solutions were transferred to 5 mm NMR tubes. The TSP concentration was 18.75 μM for standard mixtures and 50 μM for urine extracts. For intact urine samples, each dried residue was reconstituted into 960 μL phosphate buffer in D2O, and 600 μL was taken in a 5 mm NMR tube after adjusting pH to 7.43 ± 0.01.
1H 1D NMR spectra were recorded at 298 K temperature using a 90° pulse width and a relaxation delay of 6 s. The data were acquired using 48k time domain points, a 10,000 Hz spectral width, 432 or 592 transients, and presaturation of the residual water signal. The pulse sequence used was the 1D version of the NOESY sequence with water presaturation. The data were processed after multiplying by a Gaussian function (GB: 0.2 Hz; LB: −0.5 Hz) or an exponential line broadening function (LB: 0.3 Hz). The Fourier transformed spectral size was 128k points for urine samples and 8k for standard compound mixtures. The spectra were referenced to the TSP internal standard peak. TopSpin 3.2 software was used for data acquisition and processing and automated with ICON NMR.
Data Processing and Analysis.
Spectral regions from −0.5 to 10.1 ppm were converted to text format and imported into Microsoft Excel. When necessary, the interval correlation optimized shift alignment algorithm (icoshift)19 which was implemented in MatLab, was applied to spectral regions to compensate for peak drifts due to pH or concentration effects. Spectral regions that contained no peaks were removed. A binomial smoothing function algorithm was written as a MatLab script, which was applied to reduce the data size by a factor of 12 to facilitate fast computation (see Supporting Information for the MatLab script). Spectra were then normalized to total sum and multiplied by 105.
E-RANSY:
NMR data of standards mixtures, extracted urine and intact urine were subjected to ratio analysis. Calculation of the E-RANSY spectra utilized a MatLab script and followed the RANSY protocol that we have described in detail previously.17 In brief, in E-RANSY, the ratio spectrum is computed based on the quotient of means and standard deviations across columns of the ratio matrix D (Equation 1). The E-RANSY spectrum is derived using a peak of interest, which is called the “driving peak.” Thus, the jth data point of the E-RANSY spectrum is given by Rj.
| (1) |
Where are the points in the ratio matrix D of dimension n × m; n is the number of 1D NMR spectra and m is the number of data points in each spectrum. The jth data point of the ith spectrum is denoted by a vector as Xi,j. The data point k is the driving peak of the ith spectrum and is denoted as Xi,k.
RESULTS AND DISCUSSION
The intact urine NMR spectrum is highly complex, whereas the spectrum obtained after extraction of metabolites in ethyl acetate is greatly simplified. Figure 1 shows a typical spectrum of intact urine (before extraction) and the spectrum obtained after extraction in ethyl acetate at a lower pH. NMR spectra of extracts of the same urine samples at various pH were qualitatively similar. However, the spectra differed quantitatively and the relative peak intensities for the same metabolites varied significantly across the pH range (Figure 2). The simplicity to the spectra combined with the variation in the relative peak intensities were favorable to the isolation of individual metabolite peaks for unknown compounds using ratio analysis spectroscopy. The simplicity arises in part due to the elimination of other classes of metabolites such as amines,20 as well as the differences in the pKa’s of the carboxylic acid groups across the different metabolites.
Figure 1.
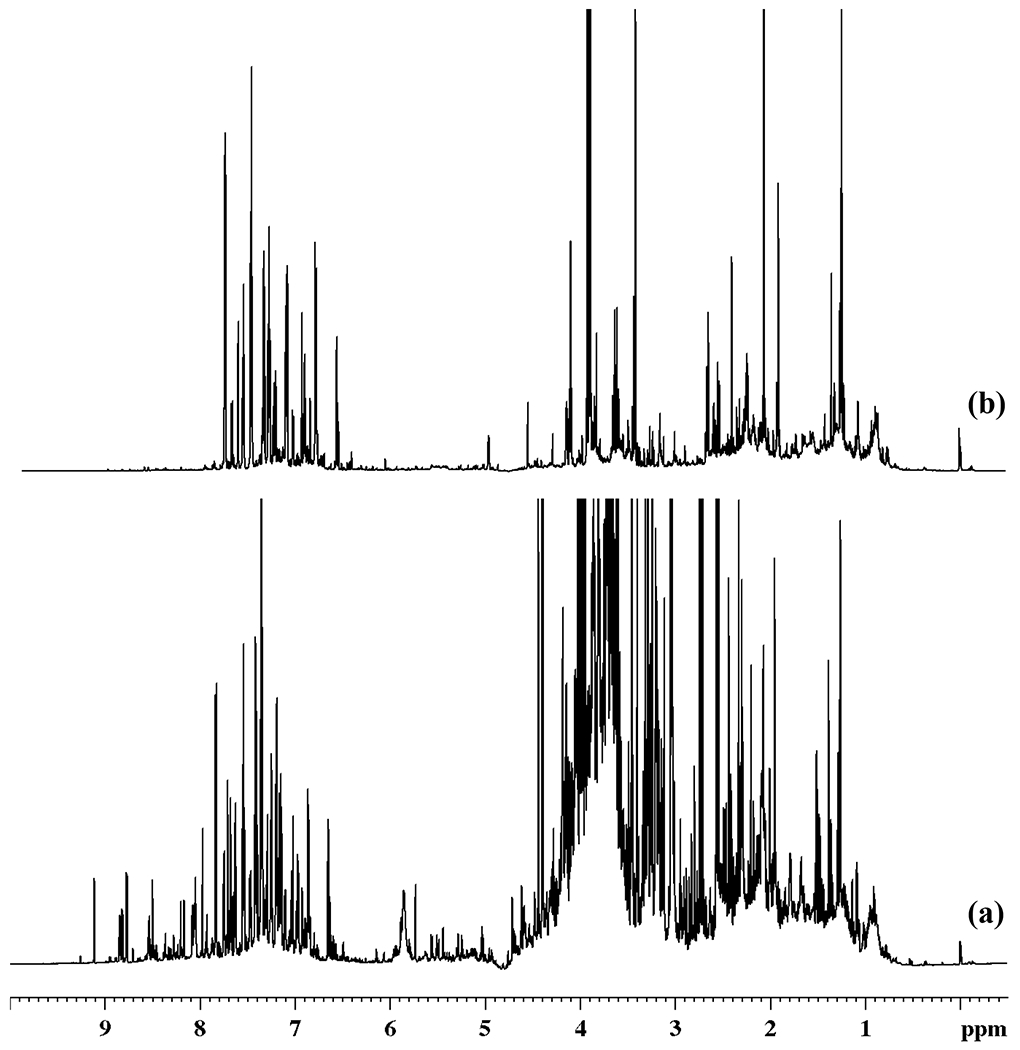
800 MHz 1D 1H NMR spectra of (a) typical intact human urine and (b) urine after solvent-solvent extraction using ethyl acetate at pH 2.01 and reconstitution at pH 7.43 ± 0.01.
Figure 2.
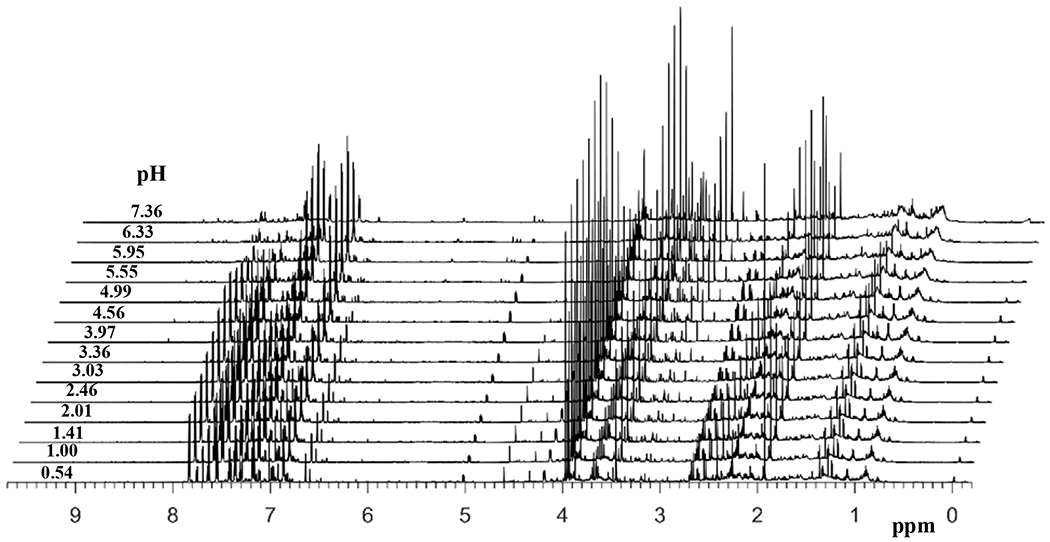
1H 1D NMR spectra, obtained at 800 MHz, of the same urine sample obtained after solvent-solvent extraction using ethyl acetate at different pH. For clarity, adjacent spectra are offset by 0.06 ppm and all spectra are plotted with reduced vertical scale.
The NMR spectra of intact urine as well as the spectra of extracted urine were analyzed using the RANSY and STOCSY methods. Two examples are shown in Figures 3 and 4 that illustrate results of the analysis based on the driving peaks at 6.8702 ppm (4-hydroxyphenylacetic acid) and 7.6893 ppm (2-furoylglycine) as shown in Figures 3a and 4a, respectively. In both figures, the conventional RANSY (Figures 3b, 4b) and STOCSY (Figures 3d, 4d) spectra were obtained from the analysis of intact urine spectra, whereas E-RANSY (Figures 3a, 4a) and E-STOCSY (Figures 3c, 4c) were obtained from the analysis of ethyl acetate extracted urine spectra. It can be seen from the two figures that STOCSY, E-STOCSY and even the conventional RANSY fail to clearly identify and differentiate peaks in the complex spectrum that are associated with the driving peaks. By contrast, E-RANSY identified a number of associated peaks in the spectra. The identities of metabolites determined based on the evaluation of the chemical shifts of the identified peaks in the E-RANSY spectra (Figures 3a, 4a), were 4-hydroxyphenylacetic acid and 2-furoylglycine, respectively. They were further confirmed by the HMDB chemical shift library and 2D NMR spectra.8 Using a similar strategy, but a simpler, more intense target peak, identification of hippuric acid established based on E-RANSY and STOCSY (though not as clearly) is shown in Figure S1. It may be noted while only E-RANSY identified 4-hydroxyphenylacetic acid and 2-furoylglycine (Figures 3 a, 4a), both RANSY and E-RANSY, as well as STOCSY identified hippuric acid (Figure S1). The ability to clearly identify hippuric acid even by the conventional RANSY and STOCSY methods arises from the fact that hippuric acid is fairly well resolved and a dominant metabolite in urine NMR spectrum (Figure S2). Thus identification of metabolites such as 4-hydroxyphenylacetic acid and 2-furoylglycine, whose peaks overlap due to the spectral complexity benefits from the new E-RANSY technique. Further, as shown for 4-hydroxyphenylacetic acid, 2-furoylglycine and hippuric acid (Figures S3 to S5), virtually identical E-RANSY spectra are obtained irrespective of the metabolite’s driver peak used for the analysis. These results further substantiate the robustness of the E-RANSY method for identifying peaks from individual metabolites in complex NMR spectra.
Figure 3.
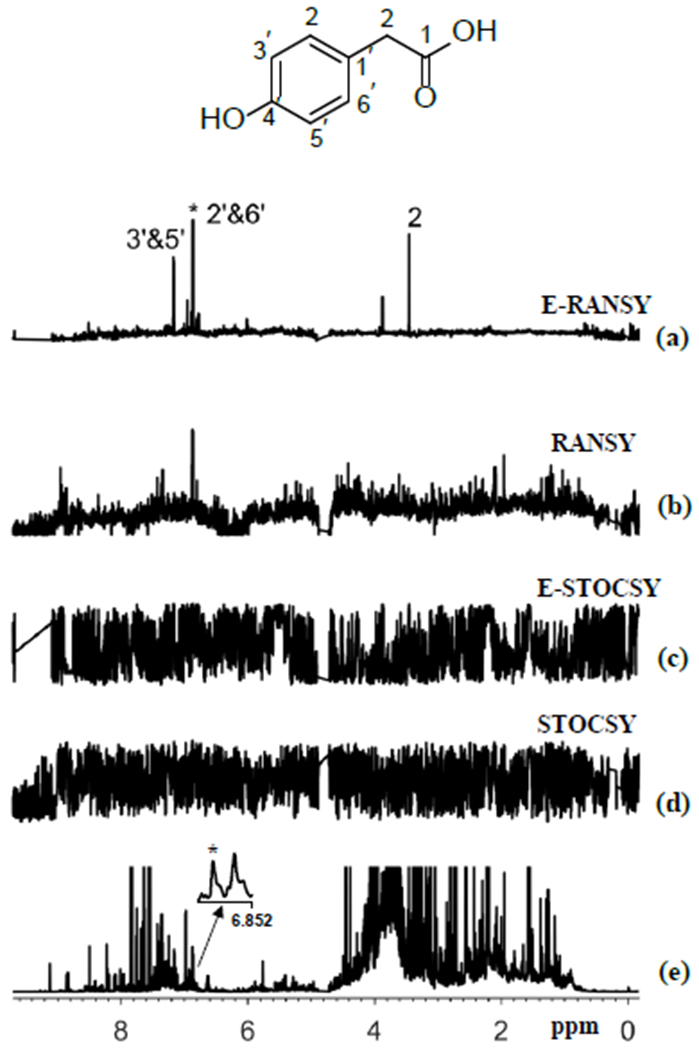
Comparison or the results or ratio analysis ana correlation analysis of either extracted urine or intact urine spectra using the driving peak as indicated by asterisk (*). The spectra shown are (a) E-RANSY; (b) RANSY; (c) E-STOCSY, (d) STOCSY and (e) the intact urine 1D 1H NMR spectrum. The inset shows the structure of 4-hydroxyphenylacetic acid identified based on E-RANSY. Peaks in the E-RANSY spectrum are labeled with corresponding protons as labeled in the structure of the metabolite. For RANSY and STOCSY, intact urine NMR spectra were used; for E-RANSY and E-STOCSY, ethyl acetate extracted urine NMR spectra were used.
Figure 4.
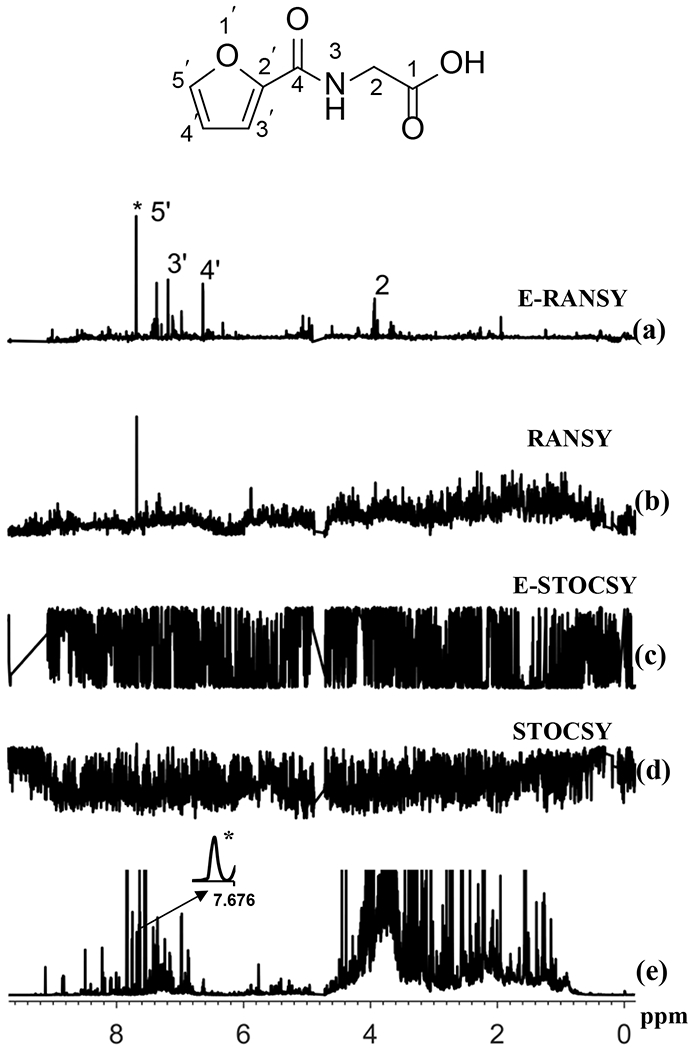
Comparison of the results of ratio analysis and correlation analysis of either extracted urine or intact urine spectra using the driving peak as indicated by asterisk (*). The spectra shown are (a) E-RANSY; (b) RANSY; (c) E-STOCSY, (d) STOCSY and (e) the intact urine 1D 1H NMR spectrum. The inset shows the structure of 2-furoylglycine identified based on E-RANSY. Peaks in the E-RANSY spectrum are labeled with corresponding protons as labeled in the structure of the metabolite. For RANSY and STOCSY, intact urine NMR spectra were used; for E-RANSY and E-STOCSY, ethyl acetate extracted urine NMR spectra were used.
The urine NMR spectrum is one of the most complex among the spectra of virtually all biological mixtures. Hence, despite the many studies that have focused on identifying metabolites in urine,20–22 unknown metabolite identification in urine continues to be a major challenge. This challenge is further compounded by numerous variables including pH, ions concentration, diet and medication use, which cause significant variation in chemical shifts and urine composition. In view of such challenges, unknown metabolite identification using intact urine NMR spectra often fails to yield the desired outcome. Here, spectral simplification is achieved by combining solvent extraction using ethyl acetate at varied pH and ratio analysis spectroscopy. The extraction method was first evaluated using mixtures of standard compounds (Table S1; Table S2; Figure S6) and then applied to urine. The simplification of the NMR spectra using this approach is produced mainly by the selective extraction of carboxylic acid containing metabolites into ethyl acetate under acidic pH conditions. Carboxylic acid containing compounds represent a large and important class of endogenous or exogenous metabolites particularly in urine, and are found in almost all metabolic pathways. Nearly 2500 metabolite features from carboxylic acid containing metabolites have previously been detected by mass spectrometry in human urine,20 highlighting their ubiquitous nature, even when considering that multiple features in mass spectrometry can correspond to a single compound owing to the formation of different types of adducts, isotopes and etc. The identity of a large number of such metabolites, however, continues to be unknown. Hence, given the challenges for unknown metabolite identification, the E-RANSY method described here is a novel method to isolate metabolite peaks from complex NMR spectra and aid unknown identification. In future studies we plan to extend the E-RANSY approach by the use of different extraction solvents to capture different classes of metabolites as well as incorporating 2D NMR methods for improved resolution and reduced peak overlap.
E-RANSY analysis does require multiple NMR spectra, where each spectrum ideally possesses the same metabolite of interest but with different concentrations. Based on the evaluation of different numbers of spectra, from 5 to 80, we have shown previously that RANSY spectra can be generated using as few as 5 NMR spectra; however, increasing the number of spectra up to 20 provides improved resolution and better peak lineshapes.17 In view of these previous results, we have used 14 spectra obtained by the ethyl acetate extraction of the same urine at different pH for E-RANSY analysis. Protonation of carboxylic acid groups is generally high at pH values below the pKa of the acid group, and protonation reduces with increasing pH. Neutral molecules with protonated acid groups are extracted by ethyl acetate, whereas charged species remain in the water layer. Hence the numbers of carboxylic acid containing metabolites extracted into ethyl acetate generally increases as the pH is reduced (see Figure 5). Further, as anticipated, changing the pH helped to make the metabolite levels vary among the different spectra as well as different metabolites. Hence, the NMR peak intensity variations for each metabolite were different from other metabolites at many pH conditions, which is critical for the E-RANSY to efficiently isolate individual metabolites from the complex spectra. Such, intensity variation is governed by the unique physicochemical characteristics including the pKa of the individual metabolites. As an example, Figure S7 illustrates the typical NMR peak intensity variation for four metabolites, 2-furoylglycine, 4-hydroxyphenyl acetic acid, hippuric acid and succinic acid, at different pH. It is clear that the intensity of the peak is dependent on the extraction conditions and tend to match the pKa values of the different metabolites. Nevertheless, there are some metabolites, like 4-hydroxyphenylacetic acid that do not follow the monotonically increasing trend as the pH is lowered. This phenomenon is not fully understood at this time.
Figure 5.
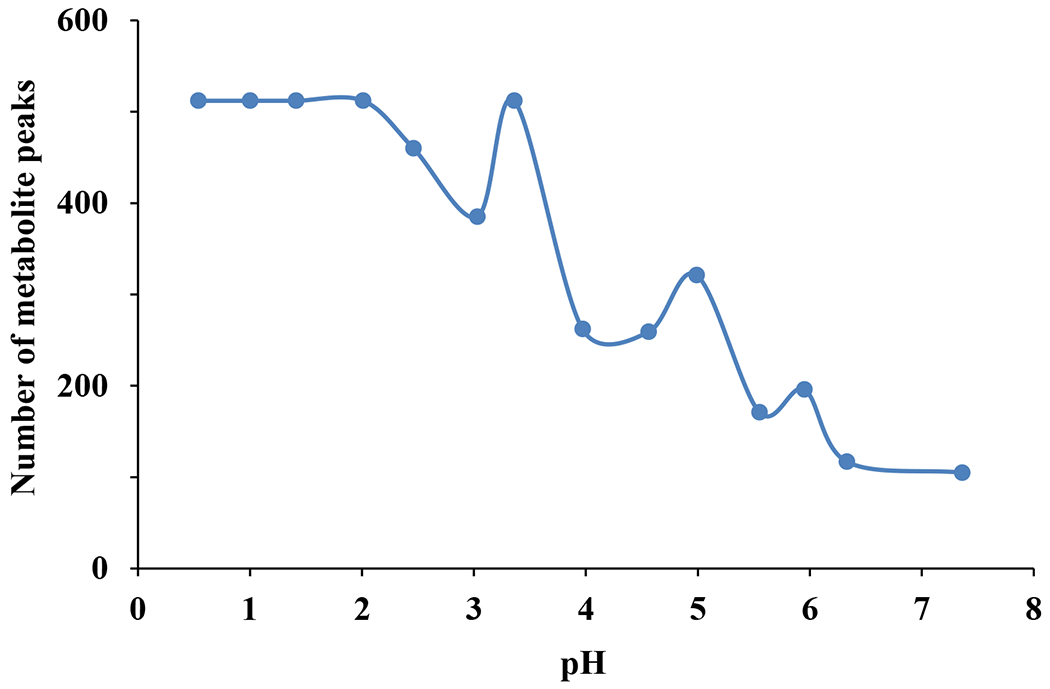
Number of peaks detected in the NMR spectra of urine after extraction into ethyl acetate solvent at different pH. The number is maximum at lower pH and is generally reduced as the pH is increased. Protonation of carboxylic acid groups increases with decreasing pH and hence the number of carboxylic acids class of metabolites extracted into the ethyl acetate solvent increases at lower pH. Note, the number of metabolite peaks was determined based on a minimum intensity threshold (MI) and peak picking sensitivity (PC) of 0.1. The numbers, however, become far higher when a lower threshold is selected.
Incorporation of liquid chromatography (LC) online or offline, in principle, is useful for simplifying the complexity of biological mixtures. However, LC poses numerous challenges for routine applications in NMR. These challenges include the lack of reproducibility (instrument to instrument variation), the need for repeated fraction collections or SPE capture to enhance metabolite concentrations, chemical shift changes due to the changing solvent composition during gradient elution, and co-elution of metabolites or elution within a small retention time window. LC also dilutes the sample, which makes it even more difficult to detect low concentration metabolites by NMR. Although LC-NMR was introduced long ago for such applications, and is certainly useful for a number of analytical problems, the approach has so far failed to achieve the desired success in the metabolomics field. LC-NMR is useful for the analysis of targeted compounds, and many groups, including our own23–25 have demonstrated its utility. On the other hand, the new E-RANSY method presented here is robust, straightforward to perform and requires no repeated fraction collection. It enables metabolite identification, unambiguously, owing to its high reproducibility and resolution (see Figure 2).
In conclusion, we present the E-RANSY method that improves the identification of unknown metabolites by chemical and statistical elimination of unassociated peaks in the NMR spectra of complex biological mixtures. The method combines extraction of urine metabolites using ethyl acetate at varied pH with the RANSY method to isolate spectra of individual metabolites. The new approach was first demonstrated using mixtures of standard compounds and then human urine samples. Unlike correlation and the conventional RANSY analysis, E-RANSY exhibits characteristics suitable for unraveling the spectra of individual metabolites from the spectra of highly complex mixtures. Future studies include the development of methods focused on extracting amines as well as other metabolite classes, and extensions to 2D NMR experiments.17 Considering the fact that unknown metabolite identification continues to be a major challenge in the metabolomics field, this proof of concept method presented here may improve the current situation.
Supplementary Material
Acknowledgments
We acknowledge financial support from the NIH (National Institute of General Medical Sciences 2R01GM085291). The authors thank Fausto Carnevale Neto, Northwest Metabolomics Research Center, for useful discussions and suggestions.
Footnotes
The authors declare the following financial interest: Daniel Raftery reports holding equity and an executive position at Matrix Bio, Inc.
SUPPORTING INFORMATION: Tables S1 to S3, MatLab code for data smoothing and normalization, and Figures S1 to S7.
References
- 1.Bhinderwala F; Lonergan S; Woods J; Zhou C; Fey PD; Powers R Expanding the Coverage of the Metabolome with Nitrogen-Based NMR. Anal. Chem 2018, 90(7), 4521–4528. [DOI] [PMC free article] [PubMed] [Google Scholar]
- 2.Qiu F; Fine DD; Wherritt DJ; Lei Z; Sumner LW PlantMAT: A Metabolomics Tool for Predicting the Specialized Metabolic Potential of a System and for Large-Scale Metabolite Identifications. Anal. Chem 2016,88(23), 11373–11383. [DOI] [PubMed] [Google Scholar]
- 3.Chylla RA; Hu K; Ellinger JJ; Markley JL Deconvolution of Two-Dimensional NMR Spectra by Fast Maximum Likelihood Reconstruction: Application to Quantitative Metabolomics. Anal. Chem 2011, 83(12), 4871–80. [DOI] [PMC free article] [PubMed] [Google Scholar]
- 4.Zhang B; Xie M; Bruschweiler-Li L; Brüschweiler R Nanoparticle-Assisted Removal of Protein in Human Serum for Metabolomics Studies. Anal. Chem 2016, 88(1), 1003–7. [DOI] [PMC free article] [PubMed] [Google Scholar]
- 5.Clendinen CS; Stupp GS; Wang B; Garrett TJ; Edison AS 13C Metabolomics: NMR and IROA for Unknown Identification. Curr. Metabolomics 2016, 4(2), 116–120. [DOI] [PMC free article] [PubMed] [Google Scholar]
- 6.Nagana Gowda GA; Gowda Y; Raftery D Expanding the limits of human blood metabolite quantitation using NMR spectroscopy. Anal. Chem 2015, 87 (1), 706–715. [DOI] [PMC free article] [PubMed] [Google Scholar]
- 7.Nagana Gowda GA; Raftery D Whole Blood Metabolomics by 1H NMR Spectroscopy Provides a New Opportunity To Evaluate Coenzymes and Antioxidants. Anal. Chem 2017, 89(8), 4620–4627. [DOI] [PMC free article] [PubMed] [Google Scholar]
- 8.Wishart DS; Tzur D; Knox C; Eisner R; Guo AC; Young N; Cheng D; Jewell K; Arndt D; Sawhney S; Fung C; Nikolai L; Lewis M; Coutouly MA; Forsythe I; Tang P; Shrivastava S; Jeroncic K; Stothard P; Amegbey G; Block D; Hau DD; Wagner J; Miniaci J; Clements M; Gebremedhin M; Guo N; Zhang Y; Duggan GE; Macinnis GD; Weljie AM; Dowlatabadi R; Bamforth F; Clive D; Greiner R; Li L; Marrie T; Sykes BD; Vogel HJ; Querengesser L HMDB: the Human Metabolome Database. Nucleic Acids Res. 2007, 35(Database issue):D521–526. [DOI] [PMC free article] [PubMed] [Google Scholar]
- 9.Ulrich EL; Akutsu H; Doreleijers JF; Harano Y ; Ioannidis YE; Lin J ; Livny M ; Mading S; Maziuk D; Miller Z; Nakatani E; Schulte CF; Tolmie DE ; Wenger RK; Yao HY; Markley JL Bio Mag Res Bank. Nucleic Acids Res. 2008, 36, D402–D408. [DOI] [PMC free article] [PubMed] [Google Scholar]
- 10.Cui Q; Lewis IA; Hegeman AD; Anderson ME; Li J; Schulte CF; Westler WM; Eghbalnia HR; Sussman MR; Markley JL Metabolite identification via the Madison Metabolomics Consortium Database. Nat Biotechnol. 2008, 26(2), 162–164. [DOI] [PubMed] [Google Scholar]
- 11.Bingol K; Li DW, Bruschweiler-Li L; Cabrera O; Megraw T; Zhang F; Bruschweiler R Unified and isomer-specific NMR metabolomics database for the accurate analysis of (13)C-(1)HHSQC spectra. ACS Chem. Biol 2015; 10, 452–459. [DOI] [PMC free article] [PubMed] [Google Scholar]
- 12.Akiyama K; Chikayama E; Yuasa H; Shimada Y; Tohge T; Shinozaki K; Hirai MY; Sakurai T; Kikuchi J; Saito K PRIMe: a Web site that assembles tools for metabolomics and transcriptomics. In. Silico. Biol 2008, 8, 339–345. [PubMed] [Google Scholar]
- 13.Hao J; Astle W; De Iorio M; Ebbels TMD BATMAN--an R package for the automated quantification of metabolites from nuclear magnetic resonance spectra using a Bayesian model. Bioinformatics. 2012, 28(15), 2088–2090. [DOI] [PubMed] [Google Scholar]
- 14.Ravanbakhsh S; Liu P; Bjordahl TC; Mandal R; Grant JR; Wilson M; Eisner R; Sinelnikov I; Hu X; Luchinat C; Greiner R; Wishart DS Accurate, fully-automated NMR spectral profiling for metabolomics. PLoS ONE 2015, 10(5), e0124219. [DOI] [PMC free article] [PubMed] [Google Scholar]
- 15.Cloarec O; Dumas ME; Craig A; Barton RH; Trygg J; Hudson J; Blancher C; Gauguier D; Lindon JC; Holmes E; Nicholson JK Statistical Total Correlation Spectroscopy: An Exploratory Approach for Latent Biomarker Identification from Metabolic 1H NMR Data Sets. Anal. Chem 2005, 77, 1282–1289. [DOI] [PubMed] [Google Scholar]
- 16.Robinette SL; Lindon JC, Nicholson JK Statistical spectroscopic tools for biomarker discovery and systems medicine. Anal. Chem 2013, 85, 5297–5303. [DOI] [PubMed] [Google Scholar]
- 17.Wei S; Zhang J; Liu L; Ye T; Nagana Gowda GA; Tayyari F; Raftery D Ratio Analysis NMR Spectroscopy (RANSY) for Selective Metabolite Identification in Complex Samples. Anal. Chem 2011, 83, 7616–7623. [DOI] [PMC free article] [PubMed] [Google Scholar]
- 18.Gu H; Nagana Gowda GA; Neto FC; Opp MR; Raftery D RAMSY: ratio analysis of mass spectrometry to improve compound identification. Anal. Chem 2013, 85(22), 10771–9. [DOI] [PMC free article] [PubMed] [Google Scholar]
- 19.Savorani F; Tomasi G; Engelsen SB icoshift: A versatile tool for the rapid alignment of 1D NMR spectra. J. Magn. Reson 2010, 202, 190–202 [DOI] [PubMed] [Google Scholar]
- 20.Peng J; Li L Liquid-liquid extraction combined with differential isotope dimethylaminophenacyl labeling for improved metabolomic profiling of organic acids. Analytica Chimica Acta. 2013, 803, 97–105. [DOI] [PubMed] [Google Scholar]
- 21.Bouatra S; Aziat F; Mandal R; Guo AC; Wilson MR; Knox C; Bjorndahl TC; Krishnamurthy R; Saleem F; Liu P; Dame ZT; Poelzer J; Huynh J; Yallou FS; Psychogios N; Dong E; Bogumil R; Roehring C; Wishart DS The human urine metabolome. PLoS One. 2013, 8(9), e73076. [DOI] [PMC free article] [PubMed] [Google Scholar]
- 22.Zhao S; Li L Dansylhydrazine Isotope Labeling LC-MS for Comprehensive Carboxylic Acid Submetabolome Profiling. Anal Chem. 2018, 90(22): 13514–13522. [DOI] [PubMed] [Google Scholar]
- 23.Appiah-Amponsah E; Shanaiah N; Nagana Gowda GA; Owusu-Sarfo K; Ye T; Raftery D Identification of 4-deoxythreonic acid present in human urine using HPLC and NMR techniques. J Pharm Biomed Anal. 2009, 50(5):878–85. [DOI] [PMC free article] [PubMed] [Google Scholar]
- 24.Djukovic D; Appiah-Amponsah E; Shanaiah N; Nagana Gowda GA; Henry I; Everly M; Tobias B; Raftery D Ibuprofen metabolite profiling using a combination of SPE/column-trapping and HPLC-micro-coil NMR. J Pharm Biomed Anal. 2008, 47(2):328–34. [DOI] [PubMed] [Google Scholar]
- 25.Djukovic D; Liu S; Henry I; Tobias B; Raftery D Signal enhancement in HPLC/microcoil NMR using automated column trapping. Anal Chem. 2006, 78(20):7154–60. [DOI] [PMC free article] [PubMed] [Google Scholar]
Associated Data
This section collects any data citations, data availability statements, or supplementary materials included in this article.


