

Abstract
Purpose.
Women’s cardio-metabolic risk increases in midlife. Previous work relating menopause symptoms to diabetes/Metabolic Syndrome (MetS) does not consider the adverse impact of multiple concurrent physical and psychological symptoms in midlife.
Methods.
Data are from 3097 participants in the Study of Women’s Health Across the Nation, a cohort of midlife women followed for over 20 years. Baseline latent symptom classes (LSC) were derived from 58 questions assessing physical, psychological and menopausal symptoms. Six identified LSCs ranged from 1 (most symptoms present at high severity) to 6 (few symptoms present at low severity). Accelerated failure time models estimated time to onset of type 2 diabetes and MetS for each LSC.
Results.
Women with multiple high/moderate severity symptoms had an earlier onset of diabetes (13.2%, 14.1% and 20.8% earlier onset in LSCs 1, 2, 3, respectively) and MetS (15.5%, 13.0% and 19.7% earlier onset in LSCs 1, 2, 3, respectively) than women with few/low severity symptoms.
Conclusions.
Having multiple concurrent moderate to high intensity physical and psychological symptoms in midlife are associated with early onset of diabetes and MetS. Monitoring and subsequent intervention on a broad range of symptoms in midlife may significantly mitigate cardio-metabolic risk during this critical life stage.
Keywords: Symptoms, Menopause, Metabolic Syndrome, Diabetes, Midlife
Introduction –
Metabolic syndrome (MetS) is a cluster of cardio-metabolic risk factors that is associated with increased risk of diabetes and cardiovascular disease – two of the major causes of decreased lifespan in the United States1. Women’s risk of metabolic syndrome increases sharply in their forties with their highest risk for diabetes onset in midlife (45-60 years old)2–7, the age span during which most women experience menopause. Thus midlife has been highlighted as an important life stage where women are at high risk for cardiovascular disease8.
The menopause marks a period of endocrinologic and physiological change9 which is associated with vasomotor, somatic, mood and urogynecological symptoms10–17. Previous work has documented the frequency of individual menopausal symptoms, such as hot flashes, and also characterized how the range of women’s menopausal and aging-related symptom experience changes across the midlife10,11,13–15. For example, a longitudinal study in Australia identified four major symptom categories present among midlife women: somatic (e.g. headaches/migraine, tiredness, pain etc.), urogynecological (e.g. urination, bowel or hemorrhoid issues), physical (e.g. allergies/hay fever, breathing difficulty, chest pain) and vasomotor (e.g. hot flashes, night sweats)11. Biologic changes during the menopausal transition have system-wide physical and psychological effects10,18–20. Previous studies have documented an array of individual symptoms19–24 including headache, irritability and mood swings19, depression21,22, perceived stress23, sleep18,25, and pain24 that vary during the menopausal transition. Aging-related changes, such as onset of osteoarthritis with its associated pain, also contribute to symptom burden during the midlife26. Given the variety of potential symptoms associated with the midlife and the menopausal transition it may be that the grouped occurrence of symptoms, in their varying forms and severities, may be a more accurate indicator of potential for system-wide dysregulation and cardio-metabolic risk than s individual symptoms alone. Thus in the Study of Women’s Health Across the Nation (SWAN) researchers, using a data-driven approach27,28, identified six latent symptom classes (LSCs) that characterized the burden of menopausal, physical and psychological symptoms in midlife10. The study established that the six LSCs were stable throughout midlife with the more severe LSCs associated with poorer self-rated health10.
A higher symptom burden may indicate higher risk for poor cardio-metabolic health outcomes such as diabetes and metabolic syndrome, especially given that common symptoms have been individually associated with each of these conditions13–15,17,29–32. Specifically urogyneoclogical and vasomotor symptoms have been associated cross-sectionally with metabolic syndrome30, the Framingham risk score, and obesity31. Furthermore, urogynecologic symptoms have been found to be associated longitudinally with obesity and diabetes14,29 Menopausal stage, along with sex hormone levels, have been associated with the metabolic syndrome33–35. In cross sectional analyses, objective indices of sleep were associated with prevalent metabolic syndrome36 among midlife women. Moreover, a history of major depression and the presence of depressive symptoms predicted the development of metabolic syndrome and diabetes respectively37,38. A broad range of physical and psychological symptoms appear to increase risk for system-wide dysregulation such as with diabetes and MetS8,9,39 Therefore, it may be that monitoring total symptom burden may provide a more accurate picture of an individual’s cardio-metabolic risk. This paper extends previous work in SWAN10, and examines the association of previously identified10 latent symptom classes with metabolic syndrome and diabetes.
Methods –
Data was from Study of Women’s Health Across the Nation (SWAN)40 with 3302 women enrolled at seven sites in 1996/1997, with each site enrolling White women and women of another race/ethnicity including Black women at four sites and Chinese, Japanese, or Hispanic at one site each. Eligibility for the cohort study included: aged 42–52 years, intact uterus, at least one menstrual period and no use of reproductive hormones in the past 3 months, and not pregnant or lactating. Following the baseline visit, women participated in up to 15 follow-up visits across 20 years with approximately 75.0% of surviving participants providing follow-up data. The Institutional Review Boards at each study site approved the protocol and participants provided written, informed consent at each visit.
Each visit included interviewer-administered and self-administered questionnaires. Waist circumference was measured with a measuring tape placed horizontally at the level of the natural waist or the narrowest part of the torso. Abdominal obesity was defined as ≥80 cm for Japanese and Chinese women and >88 cm for all other race/ethnic groups. Blood pressure was calculated as the average of two seated measurements using a standard mercury sphygmomanometer. A fasting blood sample was also obtained except at the two non-clinic follow-up visits 11 and 14.
Race/ethnicity was self-defined. Information on highest level of education attained (high school graduate /GED or less than high school versus at least some college), economic strain (“how hard is it to pay for basics (very hard, somewhat hard, or not hard)?), physical activity (Baecke questionnaire, scores range 3-1541), and smoking status (current, past, never) were obtained at baseline.
Assays.
Serum glucose levels were measured using a hexokinase-coupled reaction (Boehringer Mannheim Diagnostics, Indianapolis, IN). Heparin-2M manganese chloride was used to isolate high density lipoprotein cholesterol (HDL)42. Enzymatic methods using the Hatachi 747 analyzer (Boehringer Mannheim Diagnostics, Indianapolis, Indiana) were used to determine fasting triglyceride level43.
Latent Symptom Classes (LSC).
The latent class analysis has been described previously10. Briefly, we used 58 questions from the baseline questionnaire including items from the SF-36 domains of role-physical, bodily pain, role-emotional, vitality and social functioning44, the Center for Epidemiologic Studies Depression Scale (CES-D)45,46, the 4-item Cohen’s Perceived Stress Scale 47 as well as a 14-item list of general symptoms assessed in SWAN and other studies of the menopausal transition including how often in the past two weeks (from not at all to daily) they experienced vasomotor symptoms, mood symptoms, somatic symptoms, fatigue and vaginal dryness,48–50, self-reported sleep quality51,52, involuntary urine loss53 and sexual desire54. Women were excluded from this analysis if information on more than 10 of the included symptoms were missing at baseline. These data were used to construct LSC’s based on the probability of indicating a given level of symptom55. Using Bayesian Information Criterion (BIC), which avoids overfitting by penalizing models with large numbers of classes, as the model selection criterion a total of six LSC’s were identified (figure from original article):
LSC 1 (Many High Intensity Symptoms) is highly symptomatic with high intensity ratings. Women endorse most measured symptoms, including physical, psychological and pain symptoms, poor sleep quality and fatigue.
LSC 2 (Many Moderate Intensity Symptoms) is similar to LC1 in that they endorse most of the measured symptoms but with more moderate intensity ratings.
LSC 3 (Moderate Physical Symptoms with Interference) endorsed a narrower range of predominantly physical symptoms at moderate intensity, including pain, fatigue, sleep and physical health symptoms sufficient to interfere in life activities. They endorsed few psychological symptoms and those they endorsed were at low intensity.
LSC 4 (Mild Psychological Symptoms) also endorsed a narrower range of symptoms, predominantly those that were fatigue-related and psychological symptoms, and with milder intensity ratings.
LSC 5 (Mild Physical Symptoms) is similar to LC3 but did not endorse the physical health interference items and has lower intensity ratings on the other physical symptoms.
LSC 6 (Asymptomatic) is essentially asymptomatic reporting only a few, low intensity symptoms related mostly to fatigue.
Type 2 diabetes.
At each visit, a woman was classified as having type 2 diabetes if she met at least one of the following criteria: 1) a fasting serum glucose level ≥7 mmol/L (not available for clinic visits 2, 9, and 15 or the interim visits 11 and 14), 2) current use of insulin or oral hypoglycemic medication, or 3) self-report of physician diagnosis of type 2 diabetes.
Metabolic Syndrome (MetS).
At each visit, a woman was classified as having metabolic syndrome (MetS) if she met at least three of the following criteria56: 1) obesity defined by waist circumference, 2) fasting glucose ≥100 mg/dL57 or diagnosed diabetes, 3) hypertensive defined by a systolic blood pressure ≥130 mmHg or diastolic blood pressure ≥85 mmHg or taking any blood pressure medication, 4) fasting HDL level <50 mg/dL, and 5) fasting triglycerides ≥150 mg/dL. Fasting glucose level at ≥100 mg/dL was based on guidelines from the National Cholesterol Education Program57,58 to additionally capture pre-diabetes. Data were available to classify MetS status from baseline through visit 15. If information on MetS status was missing for a given visit, status from the previous visit was used.
Statistical Analysis.
We were able to assign 3097 of the 3302 (93.7%) SWAN participants to a baseline LSC. Ten of these women had insufficient information to define MetS status.
Frequencies and percentages were calculated to describe the characteristics of the eligible study sample overall and by LSC. Bivariate analyses were performed to determine the association between LSC and each covariate with prevalent baseline and with incident diabetes and MetS. Interval-censored Kaplan Meier survival curves were estimated for time, measured as years of age, to the first diagnosis of diabetes and to MetS stratified by baseline LSC. To model age of diabetes onset and MetS onset, we used parametric accelerated failure time (AFT) models which include both prevalent cases (at baseline) along with incident cases of diabetes and MetS, We selected a lognormal distribution that yielded the best fit to the data based on log-likelihood measures, allowing regression parameter estimates to be interpreted, after exponentiating, as a percent change in mean time to diabetes onset or MetS onset. For each outcome, initial models estimated the effect of each LSC on survival time, and subsequent models were adjusted for a priori selected10 confounders including race/ethnicity, education, smoking, financial strain, and physical activity. Likelihood ratio tests confirmed inclusion of the confounders in the final models. Analyses were conducted using the LIFEREG procedure in SAS (version 9.4).
Results –
Table 1 provides information on the distribution of latent symptom classes (LSC’s), demographic and lifestyle characteristics at baseline. Most women are in LSC 2 (many moderate intensity), 4 (mild psychological symptoms) and 6 (asymptomatic) (20.0, 23.2 and 20.6 percent, respectively) followed by classes 3 (moderate physical with interference), 5 (mild physical symptoms) and 1 (many high intensity symptoms) (13.0, 12.6, and 10.6, respectively).
Table 1 -.
Baseline Characteristics of the Study Population, Study of Women’s Health Across the Nation (SWAN) (n=3097)
| Latent Symptom Class [% (n)] |
|||||||
|---|---|---|---|---|---|---|---|
| Total | 1 (many high intensity) | 2 (many moderate intensity) | 3 (moderate physical with interference) | 4 (mild psychological) | 5 (mild physical) | 6 (asymptomatic) | |
| Characteristic | 10.6 (328) | 20.0 (618) | 13.0 (404) | 23.2 (717) | 12.6 (391) | 20.6 (639) | |
| Race/Ethnicity | |||||||
| Black | 28.7 | 35.1 | 27 | 31.4 | 24.5 | 24.8 | 32.6 |
| White | 47.9 | 45.7 | 50.5 | 48.3 | 43.5 | 61.1 | 43 |
| Chinese | 7.9 | 4.3 | 5.2 | 6.7 | 12 | 6.1 | 9.9 |
| Hispanic | 6.5 | 12.5 | 9.1 | 6.9 | 7.7 | 0.8 | 3 |
| Japanese | 8.9 | 2.4 | 8.3 | 6.7 | 12.3 | 7.2 | 11.6 |
| Financial Strain1 | |||||||
| Very Hard | 9.1 | 27.7 | 11.3 | 5.9 | 9.1 | 3.3 | 3 |
| Somewhat Hard | 29.3 | 40.5 | 39.2 | 29.7 | 29.8 | 22 | 17.7 |
| Not hard | 61.3 | 31.4 | 49.2 | 64.4 | 60.7 | 74.4 | 79 |
| Education | |||||||
| Some college | 76.4 | 61.9 | 73.5 | 79.5 | 75 | 86.4 | 80.1 |
| HS or less | 23.6 | 38.1 | 26.5 | 20.5 | 25 | 13.6 | 19.9 |
| Smoking2 | |||||||
| Never smoker | 56.9 | 44.2 | 54.4 | 58.9 | 61.6 | 54 | 61 |
| Past smoker | 25.2 | 23.8 | 24.3 | 24 | 23.2 | 34.5 | 23.9 |
| Current smoker | 17 | 31.1 | 20.1 | 16.1 | 14.5 | 10.5 | 14.2 |
| Physical Activity3, mean(sd) | 7.7 | 7 | 7.5 | 7.5 | 7.8 | 8 | 8 |
| Waist Circumference4 in cm, mean(sd) | 86.1 | 92.7 | 87.7 | 90.1 | 83.1 | 85.2 | 82.6 |
9 women have missing information
29 women have missing information
91 women have missing information
31 women have missing information
Among all women, the prevalence of MetS at baseline was 24% and another 21% developed MetS during follow-up. The prevalence of diabetes was 5% at baseline and another 12% developed diabetes during follow-up period. Women belonging to LSC1, 2 and 3 (many high, many moderate, moderate physical with interference, respectively) had higher prevalence of both conditions at baseline and by the end of the study, than women belonging to LSC4, 5 and 6 (mild psychological, mild physical, asymptomatic, respectively), with the highest prevalence observed for women in LSC1 and 3 (Table 2).
Table 2 -.
Prevalence of Diabetes and Metabolic Syndrome (MS) at Baseline and in Follow Up by Latent Symptom Class and Race/Ethnicity
| Prevalence of Diabetes | Prevalence of MS | |||
|---|---|---|---|---|
| Characteristic | Baseline (n = 3097) | Overall1 (n = 3097) | Baseline (n = 29912) | Overall1 (n = 3087) |
| Latent Symptom Class at Baseline | ||||
| 1 (many high intensity) | 7.3 | 22.3 | 32.3 | 57.2 |
| 2 (many moderate intensity) | 6.3 | 18.6 | 28.1 | 50.6 |
| 3 (moderate physical with interference) | 7.4 | 21.3 | 29.4 | 56.4 |
| 4 (mild psychological) | 3.2 | 12.1 | 17.7 | 40.1 |
| 5 (mild physical) | 2.3 | 12.8 | 17.7 | 46.5 |
| 6 (asymptomatic) | 3.3 | 12.5 | 14.2 | 40.7 |
| Race/Ethnicity | ||||
| Black | 8.8 | 24.4 | 30.3 | 58.9 |
| White | 3.2 | 12 | 19.5 | 43 |
| Chinese | 1.2 | 10.6 | 11.9 | 35.4 |
| Hispanic | 7.9 | 20.8 | 31.2 | 52 |
| Japanese | 0.4 | 10.1 | 12.1 | 38 |
Overall prevalence of diabetes/MetS from baseline (1996/1997) through follow-up visit 15.
MetS status was not available for 96 women at baseline.
Figure 1 presents the Kaplan Meier survival curves for each condition by LSC, with the vertical dotted lines representing the youngest age of enrollment into the cohort, 42 years. For MetS, a risk segregation between LSCs 1-3 (many high, many moderate, moderate physical with interference, respectively) and LSC 4-6 (mild psychological, mild physical, asymptomatic, respectively) is clearly evident at the onset of the study and worsens over the course of follow-up. For diabetes, the risk segregation emerges in the forties and widens as women age.
Figure 1 -.
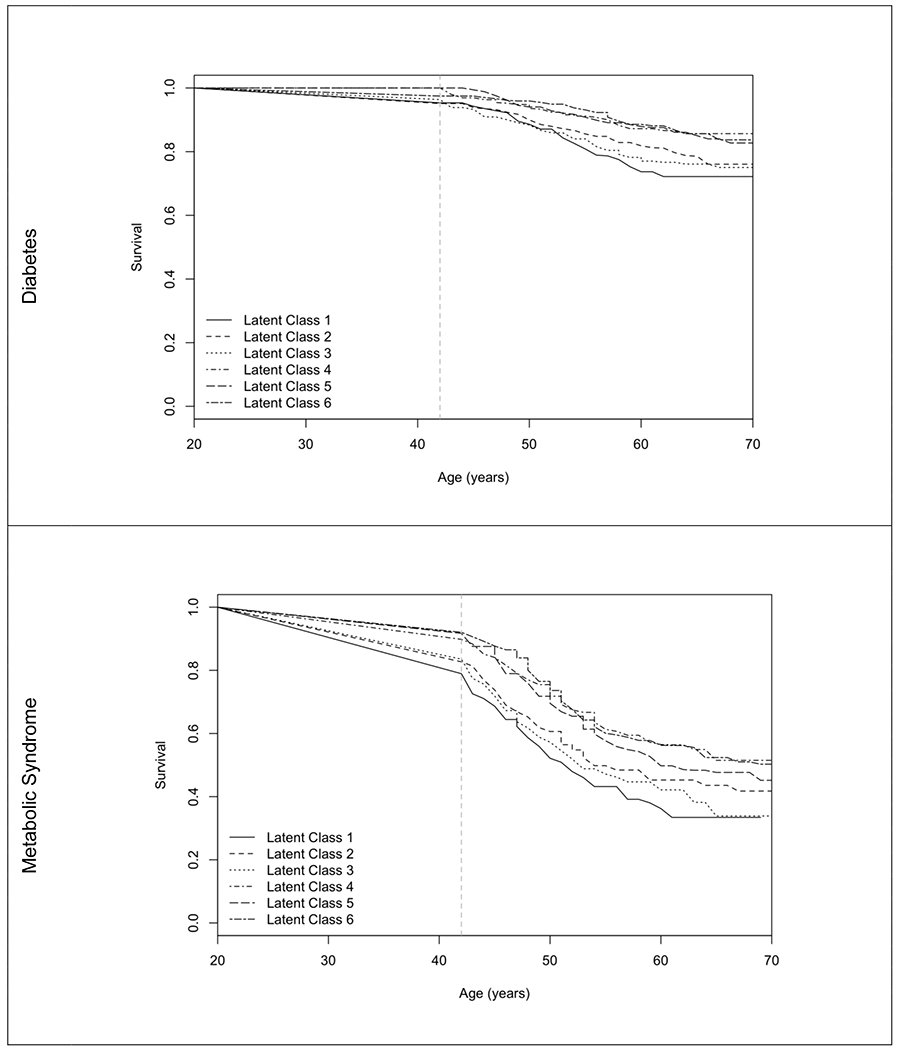
Interval Censored Kaplan-Meier Survival Curve for Diabetes and Metabolic Syndrome by Latent Symptom Class
Note: Latent symptom classes 1 – 6 are many high intensity, many moderate intensity, moderate physical with interference, mild psychological, mild physical and asymptomatic.
Table 3 presents the Accelerated Failure Time (AFT) models for MetS and diabetes. In unadjusted models, women in LSC1, 2 and 3 (many high, many moderate, moderate physical with interference, respectively) developed diabetes 29.0%, 20.9% and 26.3% earlier in life, respectively, than women in the asymptomatic LSC6, age at onset did not differ among women in LSC 4 and 5 (mild psychological and mild physical) compared to LSC 6. Difference in age at onset of diabetes was attenuated to 13.2%, 14.1% and 20.8% earlier after adjustment for confounders. This translates to highly symptomatic classes (LSC 1-3) estimated to develop diabetes approximately 5-8 years earlier than the asymptomatic class (LSC 6). Differences were diminished further and were not statistically significant when additionally adjusting for baseline waist circumference. For METs, women in LSC1, 2 and 3 (many high, many moderate, moderate physical with interference, respectively) developed MetS 29.4%, 19.9% and 24.9% earlier in life, respectively, than women in the asymptomatic LSC6. The difference in age at onset of MetS was attenuated to 15.5%, 13.0% and 19.7% after adjustment for confounders. This translates to highly symptomatic classes (LSC 1-3) estimated to developed MetS approximately 4-7 years earlier than the asymptomatic class (LSC 6). Figure 2 graphically illustrates the adjusted hazards of diabetes and MetS.
Table 3 -.
Percent Reduction in Time to Diabetes and Metabolic Syndrome (MetS) by Latent Symptom Class from Accelerated Failure Time Models (versus latent symptom class 6).
| Diabetes (n = 2944) | Metabolic Syndrome (n = 2961) | ||||
|---|---|---|---|---|---|
| Predictor | Model 1 | Model 2A | Model 2B | Model 1 | Model 2 |
| Latent Symptom Class | |||||
| 1 (many high intensity) | 29.0 (17.8, 38.7) | 13.2 (−0.5, 25.0) | 0.4 (−13.8, 12.9) | 29.4 (21.9, 36.2) | 15.5 (6.5, 23.6) |
| 2 (many moderate intensity) | 20.9 (10.4, 30.2) | 14.1 (3.1, 23.9) | 7.5 (−3.1, 17.1) | 19.9 (13.0, 26.3) | 13.0 (5.7, 19.7) |
| 3 (moderate physical with interference) | 26.3 (15.5, 35.7) | 20.8 (9.9, 30.5) | 8.7 (−2.6, 18.7) | 24.9 (17.5, 31.6) | 19.7 (12.2, 26.5) |
| 4 (mild psychological) | 2.5 (−10.6, 14.1) | 0.2 (−12.6, 11.6) | 0.8 (−10.6, 11.0) | 2.3 (−5.9, 10.0) | 0.3 (−7.8, 7.8) |
| 5 (mild physical) | 1.7 (−13.9, 15.2) | 4.0 (−10.5, 16.6) | -1.3 (−15.1, 10.8) | 7.6 (−1.5, 15.9) | 7.8 (−0.9, 15.7) |
| Race/Ethnicity | |||||
| Black | 24.3 (17.2, 30.8) | 16.5 (9.6, 22.9) | 15.3 (10.0, 20.3) | ||
| Chinese | −9.7 (−28.9, 6.7) | 15.4 (2.1, 26.9) | −18.6 (−31.5, −6.9) | ||
| Hispanic | 12.7 (−2.3, 25.5) | 22.6 (10.7, 32.9) | 5.2 (−6.3, 15.4) | ||
| Japanese | −10.5 (−28.4, 4.9) | 20.8 (9.1, 31.0) | −11.6 (−22.5, −1.6) | ||
| Education | |||||
| HS or less | 13.0 (4.9, 20.4) | 9.4 (1.9, 16.3) | 9.5 (3.6, 15.0) | ||
| Smoking | |||||
| Past smoker | 5.9 (−3.0, 14.1) | −0.8 (−9.5, 7.1) | 4.3 (−1.8, 10.0) | ||
| Current smoker | 4.3 (−6.1, 13.6) | 6.5 (−2.5, 14.7) | 11.4 (4.9, 17.5) | ||
| Financial Strain | |||||
| Very Hard | 16.5 (4.4, 27.1) | 5.0 (−7.4, 16.1) | 10.4 (1.2, 18.7) | ||
| Somewhat Hard | 6.3 (−2.1, 14.1) | −0.1 (−8.2, 7.4) | 8.0 (2.5, 13.3) | ||
| Physical activity | −6.6 (−9.0, −4.1) | −1.4 (−3.5, 0.6) | −6.8 (−8.4, −5.2) | ||
| Waist Circumference | 2.1 (1.8, 2.4) | ||||
Note: Significant effect estimates (α = 0.05) are bold
Figure 2 -.

Percent Reduction in Time to Diabetes and Metabolic Syndrome (MetS) by Latent Symptom Class from Selected Adjusted Accelerated Failure Time Models (versus latent symptom class 6).
Note: Latent symptom classes 1 – 6 are many high intensity, many moderate intensity, moderate physical with interference, mild psychological, mild physical and asymptomatic.
Discussion –
This study found that midlife women who experienced multiple high/moderate severity symptoms across a range of physical and mental health domains, not exclusive to menopausal symptoms, were at higher risk for earlier onset of MetS and diabetes than women with a lesser symptom burden. Specifically, women in LSC’s experiencing a range of moderate to high severity physical and psychological symptoms (LSC 1 and 2), as well as those experiencing moderate to high severity physical health symptoms and low intensity psychological symptoms (LSC 3) were at highest risk of earlier onset of MetS and diabetes. These results are consistent with previous SWAN findings that women in the most symptomatic classes (LSC 1-3) had poorer self-rated health than women in less symptomatic classes10. LSC 3 (moderate physical with interference), which comprised 13% of the sample, was at highest adjusted risk of both diabetes and MetS: This symptom class is characterized by fewer and lower intensity psychological symptoms but moderate intensity symptoms across multiple other domains including vasomotor, pain, fatigue, sleep and physical health symptoms that interfere with life activities10. These findings provide a more comprehensive assessment of the importance of symptom burden as a marker of cardio-metabolic risk in contrast to previous work which has focused on risk of a few, select menopausal symptoms rather than situating common menopausal symptoms (i.e. hot flashes, night sweats etc.) among other important physical and psychological health issues that may heighten with age and throughout the midlife transition11,14,15,17,29–32,59,60.
Findings from this study extend previous research on cardio-metabolic risk associated with individual symptoms and suggest that in the midlife experiencing multiple physical and psychological symptoms concurrently may confer higher cardio-metabolic risk. Many longitudinal studies of midlife women have documented the system-wide ‘adverse changes in body fat distribution, lipids, lipoproteins, as well as structural and functional measures of vascular health’8 during midlife, increasing risk for conditions such as diabetes and MetS39. Furthermore, decreased estrogen and progesterone production can stiffen blood vessels increasing risk of hypertension while also activating the renin-angiotensin aldosterone system increasing endothelial dysfunction which can increase risk for both diabetes and hypertension39. Considerable work on individual menopausal symptoms, suggests that urogynecological and vasomotor symptoms are associated with MetS30, Framingham risk score, diabetes and obesity14,29,31. Previous work has shown that individual symptoms such as depression and poor sleep are associated with diabetes and MetS cross-sectionally36 and longitudinally in midlife women37,38. The variety of mid-life symptoms that have been found to have an association with diabetes and MetS, highlight the fact that the midlife is a critical life-stage during which a variety of symptoms can manifest. Results of this study further the hypothesis that the clustering of adverse physical and psychological symptoms in midlife may be a better, data driven indicator of chronic disease risk during this important life-stage10.
Abdominal obesity, in this study, was found to be a particularly important pre-disposing risk factor. It is a component of the MetS status classification and after adjusting for abdominal obesity, risk of diabetes did not differ across the symptom classes. This finding is consistent with prior findings that obesity was related to more severe urogenital symptoms, hot flushes, depression and muscle/joint pain13,14,32. In the Australian Longitudinal Study on Women’s Health, obesity significantly attenuated the association between vasomotor symptoms and diabetes among women in the late vasomotor symptom class29. Findings suggest that underlying obesity may increase risk for severe menopausal and other physical and psychological symptoms in early midlife and also increase risk for diabetes and MetS.
Results also highlight the importance of monitoring symptoms and cardio-metabolic risk early in midlife. As reported previously10, symptom burden appears to be established by early midlife and remains relatively stable over time in the absence of targeted interventions61,62. Vasomotor symptoms commonly associated with menopause vary across the menopausal transition, in contrast to somatic, urogynecology and physical symptoms that tend to stay constant11. The inclusion of prevalent cases in this analysis was crucial to correctly determining risk, as one-quarter of the cohort had MetS and one in 20 had diabetes at baseline. Research in younger cohorts is needed to establish temporality and to further disentangle the effect of symptoms occurring in midlife, including symptoms related to menopause and those related to aging, and the effect of persisting symptoms with onset in earlier life stages.
This study has some limitations. The SWAN cohort was left-truncated and likely excluded women in frail health or with numerous co-morbidities63. We utilized accelerated failure time models, which include prevalent cases of diabetes and MetS at baseline along with incident cases during follow-up, in order to mitigate potential selection bias related to left-truncation induced from omitting prevalent cases at baseline. Additionally, some bias may exist due to right censoring but retention in the SWAN cohort is high. Only 4.5% of women were known to be deceased through the 15 th follow-up visit; those who died before observed onset of diabetes or MetS were treated as censored. The study has the additional strength of utilizing data from a community based, multiethnic cohort of over 3000 midlife women followed longitudinally.
In conclusion, this paper illustrates that midlife women who experience a substantial symptom burden are at high risk of earlier onset of MetS and diabetes. Nearly one-quarter of the midlife women in this study were highly or moderately symptomatic -- across a broad range of menopausal, physical and psychological symptoms -- as they entered midlife and started the menopausal transition. Monitoring total symptom burden across a broad range of symptoms may more fully capture potential cardio-metabolic risk. Devising interventions that address multiple symptoms simultaneously across the broad range of symptoms that manifest, early and through midlife may be critical to reducing cardio-metabolic risk during this pivotal life-stage.
Acknowledgements -
Alexis Reeves received grant support from the National Institutes of Health, National Institution on Aging’s Ruth L. Kirschtein National Research Service Award (NRSA) Individual Pre-doctoral Fellowship to Promote Diversity in Health-Related Research (1F31AG064856-01).
The Study of Women’s Health Across the Nation (SWAN) received grant support from the National Institutes of Health, Department of Health and Human Services, through the National Institute on Aging, the National Institute of Nursing Research, and the National Institutes of Health Office of Research on Women’s Health (grants NR004061, AG012505, AG012535, AG012531, AG012539, AG012546, AG012553, AG012554, AG012495, as well as grant AG017719 to the SWAN Repository).
We thank the study staff at each site and all the women who participated in SWAN.
Clinical Centers: University of Michigan, Ann Arbor, Michigan—Siobán Harlow, principal investigator (PI), 2011-present, MaryFran Sowers, PI, 1994-2011; Massachusetts General Hospital, Boston, Massachusetts —Joel Finkelstein, PI, 1999—present; Robert Neer, PI, 1994-1999; Rush University, Rush University Medical Center, Chicago, Illinois—Howard Kravitz, PI, 2009-present; Lynda Powell, PI, 1994–2009; University of California, Davis/Kaiser, California —Ellen Gold, PI; University of California, Los Angeles, Los Angeles, California—Gail Greendale, PI; Albert Einstein College of Medicine, Bronx, New York—Carol Derby, PI, 2011-present, Rachel Wildman, PI, 2010-2011; Nanette Santoro, PI, 2004-2010; University of Medicine and Dentistry-New Jersey Medical School, Newark, New Jersey—Gerson Weiss, PI, 1994-2004; and the University of Pittsburgh, Pittsburgh, Pennsylvania—Karen Matthews, PI.
NIH Program Office: National Institute on Aging, Bethesda, Maryland—Winifred Rossi, 2012-present; Sherry Sherman, 1994-2012; Marcia Ory, 1994-2001; National Institute of Nursing Research, Bethesda, Maryland—Program Officers.
Central Laboratory: University of Michigan, Ann Arbor, Michigan—Daniel McConnell (Central Ligand Assay Satellite Services). SWAN Repository: University of Michigan, Ann Arbor, Michigan—Dan McConnell, 2011-present; MaryFran Sowers, 2000-2011. Coordinating Center: University of Pittsburgh, Pittsburgh, Pennsylvania—Maria Mori Brooks, PI 2012-present; Kim Sutton-Tyrrell, PI 2001-2012; New England Research Institutes, Watertown, Massachusetts— Sonja McKinlay, PI 1995-2001.
Steering Committee: Susan Johnson, Current Chair; Chris Gallagher, Former Chair.
The content of this article is solely the responsibility of the authors and does not necessarily represent the official views of the National Institute on Aging, National Institute of Nursing Research, Office of Research on Women’s Health or the National Institutes of Health.
Glossary
- BMI
body mass index
- CESD
Center for Epidemiologic Studies Depression Scale
- Cl
confidence interval
- Cm
centimeter
- dL
deciliter
- HDL
high density lipoprotein cholesterol
- Kg
kilogram
- LSC
latent symptom class
- MetS
metabolic syndrome
- Mg
milligrams
- Sd
standard deviation
- SWAN
Study of Women’s Health Across the Nation
Footnotes
Publisher's Disclaimer: This is a PDF file of an unedited manuscript that has been accepted for publication. As a service to our customers we are providing this early version of the manuscript. The manuscript will undergo copyediting, typesetting, and review of the resulting proof before it is published in its final form. Please note that during the production process errors may be discovered which could affect the content, and all legal disclaimers that apply to the journal pertain.
Conflicts of interest - None declared.
References -
- 1.Kochanek KD, Arias E, Anderson RN. How Did Cause of Death Contribute to Racial Differences in Life Expectancy in the United States in 2010? Hyattsville, MD: National Center for Health Statistics; 2013. [PubMed] [Google Scholar]
- 2.Ford ES. Prevalence of the Metabolic Syndrome Defined by the International Diabetes Federation Among Adults in the U.S. Diabetes Care. 2005;28(11):2745–2749. doi: 10.2337/diacare.28.11.2745 [DOI] [PubMed] [Google Scholar]
- 3.Park Y-W, Zhu S, Palaniappan L, Heshka S, Carnethon MR, Heymsfield SB. The Metabolic Syndrome - Prevalence and Associated Risk Factor Findings in the US Population From the Third National Health and Nutrition Examination Survey, 1988-1994. Arch Intern Med. 2003;163:427–436. doi: 10.1001/archinte.163.4.427 [DOI] [PMC free article] [PubMed] [Google Scholar]
- 4.Aguilar M, Bhuket T, Torres S, Liu B, Wong RJ. Prevalence of the Metabolic Syndrome in the United States, 2003-2012.J Am Med Assoc. 2015;313(19):1973–1974. doi: 10.1001/jama.2015.4260 [DOI] [PubMed] [Google Scholar]
- 5.Wild S, Roglic G, Green A, Sicree R, King H. Global Prevalence of Diabetes - Estimates for the Year 2000 and Projections for 2030. Diabetes Care. 2004;27(5):1074–1053. doi: 10.2337/diacare.27.5.1047 [DOI] [PubMed] [Google Scholar]
- 6.Harris MI, Flegal KM, Cowie CC, et al. Prevalance of Diabetes, Impaired Fasting Glucose, and Impaired Glucose Tolerance in US Adults - The Third National Health and Nutrition Examination Survey, 1988-1994. Diabetes Care. 1998;21(4):518–524. doi: 10.2337/diacare.21.4.518 [DOI] [PubMed] [Google Scholar]
- 7.Saeedi P, Petersohn I, Salpea P, et al. Global and regional diabetes prevalence estimates for 2019 and projections for 2030 and 2045: Results from the International Diabetes Federation Diabetes Atlas, 9th edition. Diabetes Res Clin Pract. 2019;157(107843). doi: 10.1016/j.diabres.2019.107843 [DOI] [PubMed] [Google Scholar]
- 8.El Khoudary SR, Aggarwal B, Beckie TM, et al. Menopause Transition and Cardiovascular Disease Risk: Implications for Timing of Early Prevention. Am Hear Assoc. 2020;142:1–27. doi: 10.1161/CIR.0000000000000912 [DOI] [PubMed] [Google Scholar]
- 9.Harlow SD, Gass M, Hall JE, et al. Executive Summary of the Stages of Reproductive Aging Workshop 10: Addressing the Unfinished Agenda of Staging Reproductive Aging. J Clin Endocrinol Metab. 2012;97(4):1159–1168. doi: 10.1210/jc.2011-3362 [DOI] [PMC free article] [PubMed] [Google Scholar]
- 10.Harlow SD, Karvonen-Gutierrez C, Elliott MR, et al. It is not just menopause: symptom clustering in the Study of Women’s Health Across the Nation. Women’s Midlife Heal. 2017;3(2):1–13. doi: 10.1186/s40695-017-0021-y [DOI] [PMC free article] [PubMed] [Google Scholar]
- 11.Mishra GD, Dobson AJ. Using longitudinal profiles to characterize women’s symptoms through midlife: Results from a large prospective study. Menopause J North Am Menopause Soc. 2012;19(5):549–555. doi: 10.1097/gme.0b013e3182358d7c [DOI] [PubMed] [Google Scholar]
- 12.Sabia S, Fournier A, Mesrine S, Boutron-Ruault M-C, Clavel-Chapelon F. Risk factors for onset of menopausal symptoms - Results from a large cohort study. Maturitas. 2008;60:108–121. doi: 10.1016/j.maturitas.2008.04.004 [DOI] [PubMed] [Google Scholar]
- 13.Chedraui P, Aguirre W, Hidalgo L, Fayad L. Assessing menopausal symptoms among healthy middle aged women with the Menopause Rating Scale. Maturitas. 2007;57:271–278. doi: 10.1016/j.maturitas.2007.01.009 [DOI] [PubMed] [Google Scholar]
- 14.Pastore LM, Carter RA, Hulka BS, Wells E. Self-reported urogenital symptoms in postmenopausal women: Women’s Health Initiative. Maturitas. 2004;49(4):292–303. doi: 10.1016/J.MATURITAS.2004.06.019 [DOI] [PubMed] [Google Scholar]
- 15.Daly E, Gray A, Barlow D, McPherson K, Roche M, Vessey M. Measuring the impact of menopausal symptoms on quality of life. Br Med J. 1993;307:836–840. doi: 10.1136/bmj.307.6908.836 [DOI] [PMC free article] [PubMed] [Google Scholar]
- 16.Reed SD, Ludman EJ, Newton KM, et al. Depressive symptoms and menopausal burden in the midlife. Maturitas. 2009;62:306–310. doi: 10.1016/j.maturitas.2009.01.002 [DOI] [PMC free article] [PubMed] [Google Scholar]
- 17.Wolff EF, He Y, Black DM, et al. Self-reported menopausal symptoms, coronary artery calcification, and carotid intima-media thickness in recently menopausal women screened for the Kronos early estrogen prevention study (KEEPS). Fertil Steril. 2013;99(5):1385–1391. doi: 10.1016/j.fertnstert.2012.11.053 [DOI] [PMC free article] [PubMed] [Google Scholar]
- 18.Freeman EW, Sammel MD, Lin H, Gracia CR. Transition and Reproductive Hormones in Midlife Women. Obstet Gynecol. 2007;110(2):230–240. [DOI] [PubMed] [Google Scholar]
- 19.Freeman EW, Sammel MD, Lin H, Gracia CR, Kapoor S. Symptoms in the Menopausal Transition - Hormone and Behavioral Correlates. Obstet Gynecol. 2008;111(1):127–136. doi: 10.1097/01.aog.0000295867.06184.b1 [DOI] [PubMed] [Google Scholar]
- 20.Woods NF, Mitchell ES. Symptom interference with work and relationships during the menopausal transition and early postmenopause: Observations from the Seattle Midlife Women’s Health Study. Menopause. 2011;18(6):654–661. doi: 10.1097/gme.0b013e318205bd76 [DOI] [PMC free article] [PubMed] [Google Scholar]
- 21.Cohen LS, Soares CN, Vitonis AF, Otto MW, Harlow BL. Risk for new onset of depression during the menopausal transition: The harvard study of moods and cycles. Arch Gen Psychiatry. 2006;63(4):385–390. doi: 10.1001/archpsyc.63.4.385 [DOI] [PubMed] [Google Scholar]
- 22.Freeman EW. Associations of depression with the transition to menopause. Menopause. 2010;17(4):823–827. doi: 10.1097/gme.0b013e3181db9f8b [DOI] [PubMed] [Google Scholar]
- 23.Woods NF, Mitchell ES, Percival DB, Smith-Dijulio K. Is the menopausal transition stressful? Observations of perceived stress from the Seattle Midlife Women’s Health Study. Menopause. 2009;16(1):90–97. doi: 10.1097/gme.0b013e31817ed261 [DOI] [PMC free article] [PubMed] [Google Scholar]
- 24.Mitchell ES, Woods NF. Pain symptoms during the menopausal transition and early postmenopause. Climacteric. 2010;13(5):467–478. doi: 10.3109/13697137.2010.483025 [DOI] [PubMed] [Google Scholar]
- 25.Woods NF, Mitchell ES. Sleep Symptoms During the Menopausal Transition and Early Postmenopause: Observations from the Seattle Midlife Women’s Health Study. Sleep. 2010;33(4). doi: 10.1097/GME.0b013e318284481a [DOI] [PMC free article] [PubMed] [Google Scholar]
- 26.Zhang Y, Jordan JM. Epidemiology of Osteoarthritis. Clin Geriatr Med. 2010;26(3):355–369. doi: 10.1007/978-94-007-5061-6_29 [DOI] [PMC free article] [PubMed] [Google Scholar]
- 27.Miaskowski C, Barsevick A, Berger A, et al. Advancing symptom science through symptom cluster research: Expert panel proceedings and recommendations. J Natl Cancer Inst. 2017;109(4):1–9. doi: 10.1093/jnci/djw253 [DOI] [PMC free article] [PubMed] [Google Scholar]
- 28.Cashion AK, Gill J, Hawes R, Henderson WA, Saligan L. National Institutes of Health Symptom Science Model sheds light on patient symptoms. Nurs Outlook. 2016;64(5):499–506. doi: 10.1016/j.outlook.2016.05.008 [DOI] [PMC free article] [PubMed] [Google Scholar]
- 29.Herber-Gast GCM, Mishra GD. Early severe vasomotor menopausal symptoms are associated with diabetes. Menopause - J North Am Menopause Soc. 2014;21(8):855–860. doi: 10.1097/GME.0000000000000171 [DOI] [PubMed] [Google Scholar]
- 30.Woo S, Hee H, Mee J, et al. Association between menopausal symptoms and metabolic syndrome in postmenopausal women. Arch Gynecol Obstet. 2012;285:541–548. doi: 10.1007/s00404-011-2016-5 [DOI] [PubMed] [Google Scholar]
- 31.Cagnacci A, Cannoletta M, Palma F, Zanin R, Xholli A, Volpe A. Menopausal symptoms and risk factors for cardiovascular disease in postmenopause. Climacteric. 2012;15(2):157–162. doi: 10.3109/13697137.2011.617852 [DOI] [PubMed] [Google Scholar]
- 32.Fernández-Alonso AM, Cuadros JL, Chedraui P, Mendoza M, Cuadros A, Pérez-López FR. Obesity is related to increased menopausal symptoms among Spanish women. Menopause Int. 2010;16:105–110. doi: 10.1258/mi.2010.010029 [DOI] [PubMed] [Google Scholar]
- 33.Polotsky AJ, Allshouse A, Crawford SL, et al. Relative Contributions of Oligomenorrhea and Hyperandrogenemia to the Risk of Metabolic Syndrome in Midlife Women. J Clin Endocrinol Metab. 2012;97(6):E868–E877. doi: 10.1210/jc.2011-3357 [DOI] [PMC free article] [PubMed] [Google Scholar]
- 34.Janssen I, Powell LH, Crawford S, Lasley B, Sutton-Tyrrell K. Menopause and the Metabolic Syndrome - The Study of Women’s Health Across the Nation. Arch Intern Med. 2008;168(14):1568–1575. doi: 10.1001/archinte.168.14.1568 [DOI] [PMC free article] [PubMed] [Google Scholar]
- 35.Torréns JI, Sutton-Tyrrell K, Zhao X, et al. Relative androgen excess during the menopausal transition predicts incident metabolic syndrome in midlife women: SWAN. Menopause. 2009;16(2):257–264. doi: 10.1097/gme.0b013e318185e249 [DOI] [PMC free article] [PubMed] [Google Scholar]
- 36.Hall MH, Okun ML, Sowers M, et al. Sleep Is Associated with the Metabolic Syndrome in a Multi-Ethnic Cohort of Midlife Women: The SWAN Sleep Study. Sleep. 2012;35(6):783–790. doi: 10.5665/sleep.1874 [DOI] [PMC free article] [PubMed] [Google Scholar]
- 37.Goldbacher EM, Bromberger J, Matthews KA. Lifetime History of Major Depression Predicts the Development of the Metabolic Syndrome in Middle-Aged Women. Psychosom Med. 2010;71(3):266–272. doi: 10.1097/PSY.0b013e318197a4d5 [DOI] [PMC free article] [PubMed] [Google Scholar]
- 38.Everson-Rose SA, Meyer PM, Powell LH, et al. Depressive Symptoms, Insulin Resistance, and Risk of Diabetes in Women at Midlife. Diabetes Care. 2004;27(12):2856–2862. doi: 10.2337/diacare.27.12.2856 [DOI] [PubMed] [Google Scholar]
- 39.Mendelsohn ME, Karas RH. The Protective Effects of Estrogen on the Cardiovascular System. Epstein FH, ed. N Engl J Med. 1999;340(23):1801–1811. doi: 10.1056/NEJM199906103402306 [DOI] [PubMed] [Google Scholar]
- 40.Sowers M, Crawford S, Sternfeld B, et al. SWAN: A Multicenter, Multiethnic, Community Based Cohort Study of Women and the Menopausal Transition. In: Menopause: Biology and Pathobiology.; 2000:175–188.
- 41.Baecke J Determinants of Body Fatness in Young Adults Living in a Dutch Community. Dr Diss Baecke. 1982. [Google Scholar]
- 42.Warnick GR, Albers JJ. A comprehensive evaluation of the heparin-manganese precipitation procedure for estimating high density lipoprotein cholesterol. J Lipid Res. 1978;19(1):65–76. [PubMed] [Google Scholar]
- 43.Stiener P, Friedel J, Bremner W, Stein E. Standardization of Micro-Methods for Plasma-Cholesterol, Triglyceride and Hdl-Cholesterol with the Lipid Research Clinics Methodology. J Clin Chem Clin Biochem. 1981;19(8):850–850. [Google Scholar]
- 44.Gandek B, Ware J. The SF-36 Health Survey Manual and Interpretation Guide. In: Boston: - The Health Institute, New England Medical Center.; 1993. [Google Scholar]
- 45.Radloff LS. The CES-D Scale: A Self-Report Depression Scale for Research in the General Population. Appl Psychol Meas. 1977;1(3):385–401. doi: 10.1177/014662167700100306 [DOI] [Google Scholar]
- 46.Roberts RE. Reliability of the CES-D scale in different ethnic contexts. Psychiatry Res. 1980;2:125–134. doi: 10.1016/0165-1781(80)90069-4 [DOI] [PubMed] [Google Scholar]
- 47.Cohen S, Kamarck T, Mermelstein R. A Global Measure of Percieved Stress. J Health Soc Behav. 1983;24(4):385–396. doi: 10.2307/2136404 [DOI] [PubMed] [Google Scholar]
- 48.Avis NE, McKinlay SM. A longitudinal analysis of women’s attitudes toward the menopause: results from the Massachusetts Women’s Health Study. Maturitas. 1991;13:65–79. doi: 10.1016/0378-5122(91)90286-Y [DOI] [PubMed] [Google Scholar]
- 49.Matthews KA, Wing RR, Lewis H, Meilahn EN, Plantinga P. Influence of the Perimenopause on Cardiovascular Risk Factors and Symptoms of Middle-aged Healthy Women. Arch Intern Med. 1994;154:2349–2355. doi: 10.1001/archinte.1994.00420200105011 [DOI] [PubMed] [Google Scholar]
- 50.Neugarten BL, Kraines RJ. “Menopausal Symptoms” in Women of Various Ages. Psychosom Med. 1965;27(3):266–273. doi: 10.1097/00006842-196505000-00009 [DOI] [PubMed] [Google Scholar]
- 51.Levine DW, Kripke DF, Kaplan RM, et al. Reliability and Validity of the Women’s Health Initiative Insomnia Rating Scale. Psychol Assess. 2000;15(2):137–148. doi: 10.1037/1040-3590.15.2.137 [DOI] [PubMed] [Google Scholar]
- 52.Buysse DJ, Reynolds CF III, Monk T, Berman S, Kupfer D. The Pittsburgh Sleep Quality Index: A New Instrument for Psychiatric Practice and Research. Psychiatry Res. 1988;28:193–213. doi: 10.1016/0165-1781(89)90047-4 [DOI] [PubMed] [Google Scholar]
- 53.Sandvik H, Hunskaar S, Seim A, Hermstad R, Vanvik A, Bratt H. Validation of a severity index in female urinary incontinence and its implementation in an epidemiological survey. J Epidemiol Community Health. 1993;47(6):497–499. doi: 10.1136/jech.47.6.497 [DOI] [PMC free article] [PubMed] [Google Scholar]
- 54.Avis NE, Brockwell S, Randolph JF Jr, et al. Longitudinal Changes in Sexual Functioning as Women Transition Through Menopause: Results from the Study of Women’s Health Across the Nation (SWAN). Menopause. 2009;16(3):442–452. doi: 10.1097/gme.0b013e3181948dd0 [DOI] [PMC free article] [PubMed] [Google Scholar]
- 55.Collins L, Lanza S. Latent Class and Latent Transition Analysis : With Applications in the Social Behavioral and Health Sciences. Volume 718. John Wiley & Sons; 2009. [Google Scholar]
- 56.Day C Metabolic syndrome, or What you will: Definitions and epidemiology. Diabetes Vase Dis Res. 2007;4(1):32–38. doi: 10.3132/dvdr.2007.003 [DOI] [PubMed] [Google Scholar]
- 57.Expert Panel on Detection Evaluation and Treatment of High Blood Cholestrol in Adults. Executive summary of the third report of the National Cholesterol Education Program (NCEP) expert panel on detection, evaluation, and treatment of high blood cholesterol in adults (adult treatment panel III). J Am Med Assoc. 2001;285(19):2486–2497. doi: 10.1097/00019048-200106000-00021 [DOI] [PubMed] [Google Scholar]
- 58.Alberti KGMM, Eckel RH, Grundy SM, et al. Harmonizing the metabolic syndrome: A Joint Interim Statement. Circulation. 2009;120(16):1640–1645. doi: 10.1161/CIRCULATIONAHA.109.192644 [DOI] [PubMed] [Google Scholar]
- 59.Ogbera A, Fasanmade O, Kalra S. Menopausal symptoms and the metabolic syndrome in Nigerian women with type 2 diabetes mellitus. Climacteric. 2011;14:75–82. doi: 10.3109/13697130903568526 [DOI] [PubMed] [Google Scholar]
- 60.Chedraui P, Hidalgo L, Chavez D, Morocho N, Alvarado M, Huc A. Menopausal symptoms and associated risk factors among postmenopausal women screened for the metabolic syndrome. Arch Gynecol Obstet. 2007;275:161–168. doi: 10.1007/s00404-006-0239-7 [DOI] [PubMed] [Google Scholar]
- 61.He XZ, Baker DW. Body Mass Index, Physical Activity, and the Risk of Decline in Overall Health and Physical Functioning in Late Middle Age. Am J Public Health. 2004;94(9):1567–1573. doi: 10.2105/ajph.94.9.1567 [DOI] [PMC free article] [PubMed] [Google Scholar]
- 62.Lynch J, Helmrich S, Lakka TA, et al. Moderatley Intense Physical Activities and High Levels of Cardiorespirator Fitness Reduce the Risk of Non-Insulin-Dependent Diabetes Mellitus in Middle-aged Men. Arch Intern Med. 1996;156:1307–1314. doi: 10.1001/archinte.156.12.1307 [DOI] [PubMed] [Google Scholar]
- 63.Cain KC, Harlow SD, Little RJ, et al. Bias Due to Left Truncation and Left Censoring in Longitudinal Studies of Developmental and Disease Processes. Am J Epidemiol. 2011;173(9):1078–1084. doi: 10.1093/aje/kwq481 [DOI] [PMC free article] [PubMed] [Google Scholar]