Abstract
The parabrachial nucleus (PB) is composed of glutamatergic neurons at the midbrain-hindbrain junction. These neurons form many subpopulations, one of which expresses Calca, which encodes the neuropeptide CGRP. This Calca-expressing subpopulation has been implicated in a variety of homeostatic functions, but the overall distribution of Calca-expressing neurons in this region remains unclear. Also, while previous studies in rats and mice have identified output projections from CGRP-immunoreactive or Calca-expressing neurons, we lack a comprehensive understanding of their efferent projections. We began by identifying neurons with Calca mRNA and CGRP immunoreactivity in and around the PB, including populations in the locus coeruleus and motor trigeminal nucleus. Calca-expressing neurons in the PB prominently express the mu opioid receptor (Oprm1) and are distinct from neighboring neurons that express Foxp2 and Pdyn. Next, we used Cre-dependent anterograde tracing with synaptophysin-mCherry to map the efferent projections of these neurons. Calca-expressing PB neurons heavily target subregions of the amygdala, bed nucleus of the stria terminalis, basal forebrain, thalamic intralaminar and ventral posterior parvicellular nuclei, and hindbrain, in different patterns depending on the injection site location within the PB region. Retrograde axonal tracing revealed that the previously unreported hindbrain projections arise from a rostral-ventral subset of CGRP/Calca neurons. Finally, we show that these efferent projections of Calca-expressing neurons are distinct from those of neighboring PB neurons that express Pdyn. This information provides a detailed neuroanatomical framework for interpreting experimental work involving CGRP/Calca-expressing neurons and opioid action in the PB region.
Keywords: parabrachial complex, calcitonin gene related peptide, mu-opioid, central nucleus of the amygdala, amygdalopiriform cortex, prodynorphin, dynorphin, parasubthalamic
Introduction
The parabrachial nucleus (PB) is a group of neurons located in the brainstem, surrounding the superior cerebellar peduncle. These neurons are bounded medially by the locus coeruleus (LC); ventrally by the supratrigeminal and motor trigeminal nuclei; dorsally by the periaqueductal gray matter, cuneiform nucleus, and inferior colliculus; laterally by the cerebellum; rostrally by the pedunculopontine tegmental nucleus; and caudally by the vestibular nucleus. PB neurons have been segregated into different subnuclei based on cytoarchitecture (Fulwiler & Saper, 1984). One of these, the external lateral subnucleus (PBeL), receives heavy axonal projections from the nucleus of the solitary tract and area postrema, and its outer subdivision receives additional input from the spinal cord and spinal trigeminal nucleus (Cechetto, Standaert, & Saper, 1985; Herbert, Moga, & Saper, 1990; Moga et al., 1990), plus descending input from the medial prefrontal cortex and other forebrain sites (Grady, Peltekian, Iverson, & Geerling, 2020; Moga et al., 1990). PBeL neurons project axons to the substantia innominata (Bernard, Carroue, & Besson, 1991; Grove, 1988; Shin, Geerling, Stein, Miller, & Loewy, 2011), bed nucleus of the stria terminalis (Alden, Besson, & Bernard, 1994), amygdala (Bernard, Alden, & Besson, 1993; Bernard et al., 1991; Fulwiler & Saper, 1984), thalamus (Bester, Bourgeais, Villanueva, Besson, & Bernard, 1999; Krout & Loewy, 2000), and cerebral cortex (Grady et al., 2020; Saper, 1982).
Early on, some PBeL neurons were noted to contain the neuropeptide calcitonin gene-related peptide (CGRP) and project axons to the bed nucleus of the stria terminalis, basal forebrain, amygdala, and other sites (de Lacalle & Saper, 2000; Knyihar-Csillik, Boncz, Sary, Nemcsok, & Csillik, 1999; Schwaber, Sternini, Brecha, Rogers, & Card, 1988). CGRP is encoded by Calca, an mRNA splice variant from the calcitonin gene locus (Rosenfeld et al., 1983). This neuropeptide is also a potent vasodilator (Brain, Williams, Tippins, Morris, & MacIntyre, 1985; Fisher et al., 1983) and is implicated in migraine pathophysiology (Ashina et al., 2020; Goadsby, Edvinsson, & Ekman, 1990; Hansen, Hauge, Olesen, & Ashina, 2010; Russo, 2015). Its role in migraine pathogenesis led to the development of CGRP receptor antagonists and monoclonal antibodies, which are now used clinically to treat or prevent migraine headaches (Durham, 2004; Edvinsson, 2008).
Neurons that express Calca mRNA are found in dorsal root ganglia and in select regions of the brain, including the PB. In mice, Calca-expressing neurons in the PB region have been linked to a variety of aversive states, including malaise (Campos et al., 2017), appetite inhibition (Carter, Soden, Zweifel, & Palmiter, 2013), conditioned taste aversion (Carter, Han, & Palmiter, 2015; Chen, Campos, Jarvie, & Palmiter, 2018), affective pain memories (Han, Soleiman, Soden, Zweifel, & Palmiter, 2015), hypercarbic arousal (Kaur et al., 2017), and alarm (Campos, Bowen, Roman, & Palmiter, 2018; Palmiter, 2018; Saper, 2016). Despite the abundance of functional work on Calca-expressing neurons in mice, neither the distribution of these neurons in the PB region nor their axonal projection patterns have been mapped comprehensively. Previous investigators delivered a Cre-conditional vector (AAV1-DIO-Synaptophysin(Syp)-mCherry) into the PB region of Calca-Cre mice and reported Syp-mCherry labeling in several brain regions, including the bed nucleus of the stria terminalis, amygdala, and thalamus (see supplemental figure 6, Chen et al., 2018). Still, we lack detailed information about the overall distribution of neurons that express Calca or contain CGRP in this region, and we lack a systematic analysis of the axonal projections from Calca-expressing neurons in and around the PB. Gaining a more comprehensive understanding of the neurons that express Calca in and around the PB will allow a greater degree of precision in planning and interpreting cell-type-specific work involving these cells.
Here, using in situ hybridization and immunolabeling, we identified and characterized the neurons in and around the PB that express Calca or contain CGRP. Due to reports of mu opioid receptor binding, expression, and activity in PBeL (Chamberlin, Mansour, Watson, & Saper, 1999; Christie & North, 1988; Herkenham & Pert, 1982; Wolinsky, Carr, Hiller, & Simon, 1996) and findings implicating this brainstem region in opioid-induced respiratory depression (Bachmutsky, Wei, Kish, & Yackle, 2020; Hurle, Mediavilla, & Florez, 1985; E. S. Levitt, Abdala, Paton, Bissonnette, & Williams, 2015; Prkic et al., 2012; Saunders & Levitt, 2020; Varga, Reid, Kieffer, & Levitt, 2020), we also compared expression of Calca with Oprm1, which encodes the mu opioid receptor. We then used Cre-conditional labeling to map the output of Calca-expressing PB neurons, comparing their projection pattern to that of other Calca-expressing neurons outside the PB and to surrounding PB neurons that express Pdyn (Huang, Grady, Peltekian, & Geerling, 2020).
Materials and Methods
Mice.
All mice were group-housed in a temperature- and humidity-controlled room on a 12/12-hour light/dark cycle and with ad libitum access to water and standard rodent chow (Teklad 7913). Overall, we used n=28 mice (8 female) mice aged 7 to 19 weeks (20–30 g body weight). We are not aware of any age-related differences in the expression of Calca or connectivity of Calca-expressing neurons across this age range. We used a variety of knockin Cre and Cre-reporter mice; detailed information about each strain is in Table 1. All mRNA, protein, and Cre-reporter labeling was replicated in at least n=3 separate mice. All Cre-driver and Cre-reporter mice were maintained on a C57BL6/J background. We analyzed histologic data previously from two of these mice (Calca-Cre cases 1803, 1808), in a separate study that focused exclusively on connectivity between the PB and cerebral cortex (Grady et al., 2020). We used homozygous Calca-Cre mice as a knockout control for our CGRP antisera, as these mice cannot produce the CGRP neuropeptide due to the Cre:GFP insert disrupting exon 2 in both copies of the Calca gene (Chen et al., 2018). We also conducted our initial set of AAV injections for Cre-conditional anterograde tracing in homozygous mice (n=7: cases 1800, 1802, 1803, 1805, 1807, 1808, 1809), and then repeated this experiment using heterozygous Calca-Cre mice (n=3: cases 4179, 4181, 4182) to compare Syp-mCherry labeling in a variety of terminal fields. Mice were genotyped for the presence of CalcaCre:GFP and wild type Calca using real-time PCR (Transnetyx). All experiments were conducted in accordance with the guidelines of the Institutional Animal Care and Use Committee at the University of Iowa.
Table 1.
Cre driver and reporter mice used in this study
| Strain | Reference | Source information | Key gene |
|---|---|---|---|
| Calca-Cre (CalcaCre:GFP) | Carter, M., Soden, M., Zweifel, L. et al. “Genetic identification of a neural circuit that suppresses appetite.” Nature 503, 111–114 (2013). | Richard Palmiter lab, University of Washington Jax033168 https://www.jax.org/strain/033168 |
Cre:GFP inserted downstream of the endogenous CGRP (calcitonin-gene-related-peptide) gene |
| Pdyn-IRES-Cre | Krashes, Michael J., et al. “An excitatory paraventricular nucleus to AgRP neuron circuit that drives hunger.” Nature 507.7491 (2014): 238. | Jax027958 https://www.jax.org/strain/027958 |
IRES-Cre inserted downstream of the endogenous Pdyn (prodynorphin) gene |
| R26-LSL-L10GFP reporter | Krashes, Michael J., et al. “An excitatory paraventricular nucleus to AgRP neuron circuit that drives hunger.” Nature 507.7491 (2014): 238. | Available from originating investigators http://www.informatics.jax.org/allele/MGI:5559562 |
Floxed transcription STOP cassette followed by EGFP/Rpl10 fusion reporter gene under control of the CAG promoter targeted to the Gt(ROSA)26Sor locus |
Stereotaxic injections.
Mice were anesthetized with isoflurane (0.5–2.0%) and placed in a stereotactic frame (Kopf 1900 or 940). We made a midline incision and retracted the skin to expose the skull, identify bregma, and drill a burr hole. Through a pulled glass micropipette (20–30 μm tip inner diameter), we injected either AAV8-hEf1a-DIO-synaptophysin-mCherry (AAV8-DIO-Syp-mCherry, 2.5 × 10¹³ pfu/mL; purchased from Dr. Rachel Neve at the Massachusetts Institute of Technology McGovern Institute for Brain Research Viral Vector Core) or Fluorogold (Fluorochrome; 2% solution in sterile 0.9% saline). In Calca-Cre mice, we targeted the parabrachial region with AAV injections at coordinates ranging 4.95–5.20 mm caudal to bregma, 1.25–1.58 mm right of midline, and 3.80–4.00 mm deep to bregma. The total injection volume was 20 or 40 nL in each case, with a subset cases receiving two, sequential 20 nL injections at 3.90 then 3.80 mm. In three additional, mixed-background mice (no Calca-Cre), we injected 40 nL of Fluorogold into the medullary reticular formation 1.30 mm right of midline and 6.00 mm deep to bregma and coordinates ranging 6.20–6.90 mm caudal to bregma. Each injection was made over a 5-minute period, using picoliter air puffs through a solenoid valve (Clippard EV 24V DC) pulsed by a Grass stimulator, while monitoring the fluid meniscus in the micropipette using a calibrated reticule in the eyepiece of our operating microscope. The pipette was left in place for an additional 3–5 minutes, then withdrawn slowly before closing the skin with Vetbond (3M). Meloxicam (1 mg/kg s.c.) or carprofen (5 mg/kg s.c.) was provided for postoperative analgesia. AAV-injected mice were allowed to survive for 3–4 weeks after surgery to allow Syp-mCherry production and trafficking into synaptic boutons. Fluorogold-injected mice were perfused 5 days after injection.
Perfusion and tissue sections.
Mice were anesthetized with a mixture of ketamine/xylazine (i.p. 150/15 mg/kg, dissolved in sterile 0.9% saline), then perfused transcardially with phosphate-buffered saline (PBS, prepared from 10× stock; P7059, Sigma), followed by 10% formalin-PBS (SF100–20, Fisher Scientific). After perfusion, the brain was removed and fixed overnight at 4 °C in 10% formalin-PBS, then switched to 30% sucrose-PBS for an additional day at 4 °C. We sectioned each brain into 40 μm-thick coronal slices using a freezing microtome and collected tissue sections into separate, 1-in-3 series. Sections were stored in cryoprotectant solution at −20 °C until further processing.
Immunohistology.
For immunofluorescence labeling, we removed the tissue sections from cryoprotectant and rinsed them in PBS before loading them into a primary antibody solution. Primary antisera (see Table 2 for details) were added to a PBS solution with 0.25% Triton X-100 (BP151–500, Fisher), 2% normal donkey serum (NDS, 017–000-121, Jackson ImmunoResearch), and 0.05% sodium azide (14314, Alfa Aesar) as a preservative (PBT-NDS-azide). We incubated these sections overnight at room temperature on a tissue shaker. The following morning, the sections were washed 3× in PBS and incubated for 2 hours at room temperature in PBT-NDS-azide solution containing species-specific donkey secondary antibodies. These secondary antibodies were conjugated to Cy3, Cy5, Alexa Fluor 488, or biotin (Jackson ImmunoResearch; each diluted 1:500–1,000). When a biotinylated secondary antibody was used, we washed tissue sections 3× and then incubated them for an additional 2 hours in streptavidin-Cy5 (#SA1011; Invitrogen) or streptavidin-Pacific Blue (#S11222; Invitrogen) prepared in PBT-NDS-azide. These sections were then washed 3× in PBS and mounted on glass slides (#2575-plus; Brain Research Laboratories) and coverslipped using Vectashield with DAPI (Vector Labs). Slides were stored in slide folders at 4 °C until imaging.
Table 2.
Antisera used in this study
| Antigen | Immunogen description | Source, Host Species, RRID | Concentration |
|---|---|---|---|
| DsRed | DsRed-Express, a variant of Discosoma sp. red fluorescent protein | Clontech, rabbit polyclonal, cat. # 632496, lot# 1509043, RRID: AB_1001313483. Immunoreactivity is absent in brain tissue from mice lacking a dsRed-derived fluorescent protein. | 1:2,000 |
| mCherry | Full length mCherry fluorescent protein | Life Sciences, rat monoclonal, cat.# M11217, lot# R1240561, RRID AB_2536611. Immunoreactivity is absent in brain tissue from mice lacking a dsRed-derived fluorescent protein. | 1:2,000 |
| Forkhead box protein 2 (FoxP2) | Recombinant human FOXP2 isoform 1 Ala640-Glu715 | R&D Systems, sheep polyclonal, cat.# AF5647, RRID: AB_2107133. | 1:10,000 |
| ChAT | Human placental choline acetyltransferase | Millipore, goat polyclonal, cat.# AB144P, lot: JC1618187, RRID:AB_2079751. | 1:1,000 |
| CGRP | Synthetic peptide corresponding to Rat CGRP aa 23-37 (C terminal). Conjugated to gamma globulin. Sequence: VKDNFVPTNVGSEAF |
Abcam, goat polyclonal, cat.# ab36001, lot# GR3186077-4, RRID: AB_725807. Neuronal immunoreactivity is absent in homozygous Calca-Cre mice, in which a Cre:GFP knockin to exon 2 of the Calca locus disrupts CGRP production (see Supplemental Figure 1). | 1:8,000 |
| CGRP | Synthetic CGRP peptide | Peninsula, rabbit polyclonal, cat.# T-4032, lot# A17601, RRID: AB_518147. Neuronal immunoreactivity is absent in homozygous Calca-Cre mice, in which a Cre:GFP knockin to exon 2 of the Calca locus disrupts CGRP production (see Supplemental Figure 2). | 1:16,000 |
| Cre | Cre recombinase from Escherichia phage P1 | Novagen/Millipore, rabbit polyclonal, cat.# 69050-3, lot# 2811981, RRID: AB_10806983. Immunoreactivity is absent in brain tissue from mice without Cre recombinase. | 1:10,000 |
| GFP | GFP isolated directly from the jellyfish Aequorea victoria. | Invitrogen, chicken polyclonal, cat.#10262, lot: 1829565, RRID: AB_2534023. | 1:3,000 |
| LIM homeobox transcription factor 1 Beta (Lmx1b) | Full-length LIM homeobox transcription factor 1 beta protein from mouse | C. Birchmeier, Max Delbruck Center for Molecular Medicine; Berlin; Germany. RRID: AB_2314752. | 1:8,000 |
| Tyrosine hydroxylase (TH) | Purified, SDS-denatured rat pheochromocytoma TH | Millipore, mouse monoclonal, cat. # MAB318, lot: NG1802536, RRID: AB_2201528. | 1:10,000 |
For brightfield labeling (immunohistochemistry), we removed tissue sections from cryoprotectant, rinsed them in PBS, then incubated them in 0.3% hydrogen peroxide (#H325–100, Fisher) for 30 minutes to quench endogenous peroxidase activity. After washing 3× in PBS, we loaded sections into PBT-NDS-azide containing a rabbit polyclonal antiserum targeting either dsRed (mCherry) or CGRP (see Table 2) overnight at room temperature on a tissue shaker. After 3× PBS washes the following morning, we incubated sections for 2 hours in a 1:500 solution of biotinylated donkey anti-rabbit (#711–065-152; Jackson) in PBT-NDS-azide. Sections were washed 3 more times, then placed for 1 hour in avidin-biotin complex (Vectastain ABC kit PK-6100; Vector), washed 3× in PBS, and incubated in nickel-diaminobenzidine (NiDAB) solution for 10 minutes. Our stock DAB solution was prepared by adding 100 tablets (#D-4418, Sigma, Saint Louis, MO) into 200 mL ddH2O, then filtering it. We then used 1 mL of this DAB stock solution, with 300 μL of 8% nickel chloride (#N54–500, Fisher Chemical) per 6.5 mL PBS. After 10 minutes in NiDAB, we added hydrogen peroxide (0.8 μL of 30% H2O2 per 1 mL PBS-NiDAB) and swirled sections for 2–4 minutes until observing black (nickel-DAB) color change. After two rapid PBS washes, we wet-mounted one or more sections and checked them in a light microscope to ensure optimal staining, and re-immersed in the previous NiDAB-H2O2-PBS solution for up to one additional minute. Finally, after washing an additional 3× in PBS, we mounted sections on glass slides. Slides were air-dried and dehydrated in an ascending series of alcohols then xylenes, then coverslipped with Cytoseal 60 (#8310–16, Thermo Scientific) and stored at room temperature until imaging.
To assess the specificity of anti-CGRP antisera, we used homozygous (CalcaCre/Cre), heterozygous (CalcaCre/WT), and littermate control (CalcaWT/WT) mice for NiDAB immunohistochemical labeling (n=3 each). CGRP-like axonal immunoreactivity was absent from all tissue sections in homozygous Calca-Cre mice, in which an exon 2 insertion of Cre:GFP prevents CGRP production (Chen et al., 2018). Relative to Cre-negative littermates, CGRP immunohistochemical labeling in heterozygotes ranged from intermediate to similar in intensity (Supplemental Figures 1–2).
Nissl counterstaining.
After whole-slide imaging (described below), all slides from Syp-mCherry tracing cases were Nissl-counterstained and re-imaged. First, the coverslips were removed by soaking the slides in xylenes for 1–7 days. Then, after rehydration through 1-minute dips in a graded series of alcohols (400 mL each of 100%, 95%, 70%, 50% EtOH), we rinsed the slides in water and dipped them into a buffer solution containing 0.15% thionin (Fisher Scientific) for 1 minute. Slides were rinsed in tap water until the solution cleared, then dehydrated in an ascending series of alcohols for one minute each (50%, 70%, 95% with 10 drops of glacial acetic acid, 95%, 100%, and 100% EtOH), followed by two xylene solutions. Afterwards, the slides were coverslipped with Cytoseal.
Fluorescence in situ hybridization (FISH).
We used RNAscope Fluorescent Multiplex Detection Reagents (ref# 320851; Advanced Cell Diagnostics) to label mRNA for Calca, Pdyn, and Oprm1. In some cases, we also labeled ubiquitin (Ubc) mRNA for background cytoarchitecture and as a positive control. For detailed information about each FISH probe, see Table 3.
Table 3.
RNAscope probes used in this study
| Probe | Common Name | Channel | ACD Catalog # | Lot # |
|---|---|---|---|---|
| Mm-Calca | Calcitonin gene-related peptide | C1 | 417961 | 17355B |
| Mm-Calca-C2 | Calcitonin gene-related peptide | C2 | 417961-C2 | 18165A |
| Mm-Oprm1-C2 | Mu-Opioid Receptor | C2 | 489311-C2 | 19165B |
| Mm-Pdyn | Prodynorphin | C1 | 318771 | 16347A |
| Mm-Pdyn-C2 | Prodynorphin | C2 | 318771-C2 | 17290A |
| Mm-Slc17a6-C2 | Vesicular glutamate receptor 2 | C2 | 319171-C2 | 17257B |
| Mm-Ubc-C3 | Ubiquitin C | C3 | 310771-C3 | 18085A |
The afternoon before hybridization, we removed six tissue sections containing the PB region from cryoprotectant, rinsed them in PBS at room temperature, and then mounted them on glass slides to dry overnight. In the morning, after dehydrating slides in an ascending series of alcohols for 5 minutes each (50%, 70%, 100%, 100% EtOH), we outlined the sections using a Super-HI PAP pen (Research Products Incorporated) to form a hydrophobic barrier, then washed sections in PBS twice, for 2 minutes each, at room temperature. We then covered sections with Protease IV and placed the slides in a glass petri dish floating in a 40 °C water bath for 30 minutes. After PBS 2 × 2-minute washes, we incubated sections in two or three probes for 2 hours at 40 °C. After that, we added amplification reagents 1–4, in series, for 15–30 minutes each, at 40 °C, with 2 × 2 minute in RNAscope wash buffer (#320058; diluted 1:50 in ddH20) between each step. After a final PBS wash, we coverslipped slides using Vectashield with DAPI.
Imaging, figures, and analysis.
All slides were imaged using an Olympus VS120 slide-scanning microscope. For brightfield images of slides after NiDAB immunohistochemistry (and then Nissl counterstaining), we used a 20× objective and extended focal imaging (EFI) to collect and combine in-focus images from 11 focal planes through the tissue.
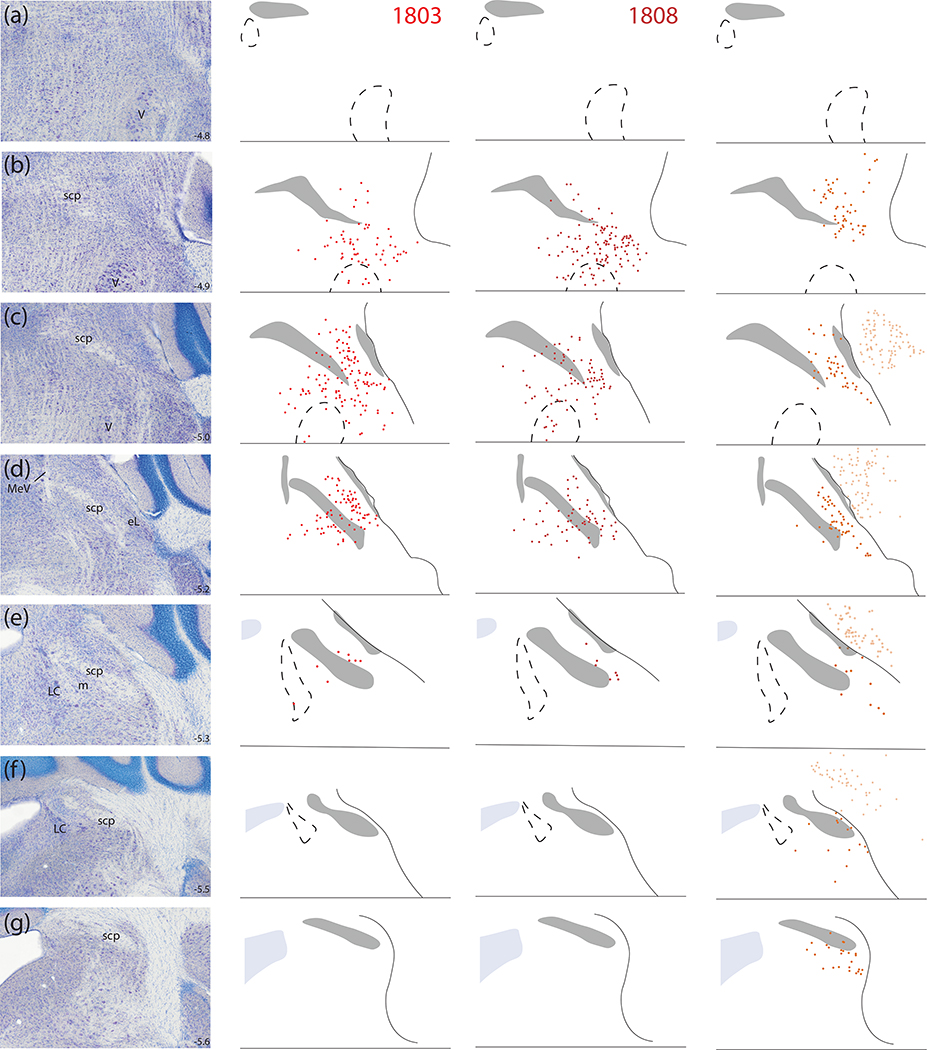
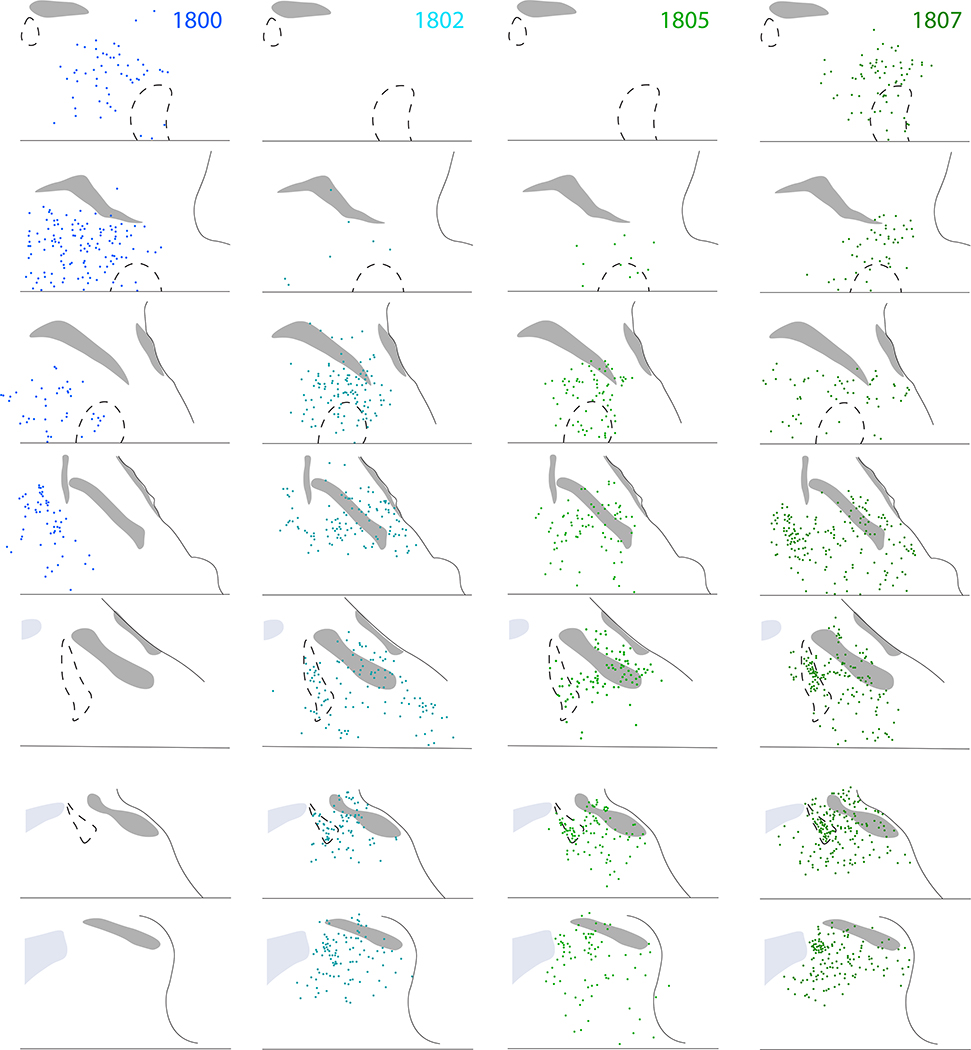
After reviewing all sections from whole-slide images in OlyVIA or VS-ASW software (Olympus), we plotted NiDAB-labeled (Syp-mCherry-expressing) neurons in the PB region across 8 template levels of the PB in Adobe Illustrator (Figure 10). Nissl-counterstained tissue series showing full injection sites from these cases (including sections rostral or caudal to the PB in some) are shown in Supplemental Figure 3.
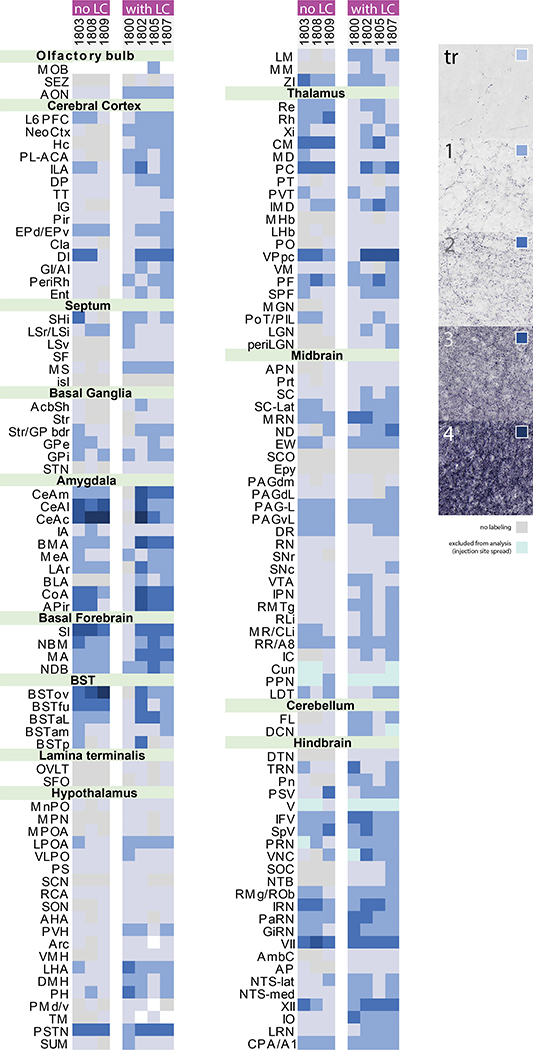
In every axon-tracing case, we immunolabeled, imaged, and reviewed every section from a 1-in-3 series of sections through the full brain, from the olfactory bulbs to the cervical spinal cord. Throughout this paper, we will use the term “boutons” to refer to punctate NiDAB labeling of Syp-mCherry. Immunoelectron and light microscopy studies uniformly localize synaptophysin to presynaptic boutons, where it is an integral membrane protein in all synaptic vesicles (Calhoun et al., 1996; Wiedenmann & Franke, 1985). We first identified all regions containing Syp-mCherry-labeled boutons in NiDAB-labeled images (without Nissl counterstaining). Then, we confirmed cytoarchitectural loci using side-by-side comparison of the image from the same sections after Nissl counterstaining. In each brain region, we scored the density of Syp-mCherry-labeled boutons using a semi-quantitative (0–4) scale. For brain regions containing scattered, minimal labeling, we assigned the intermediate designation of “trace” labeling. Our reference standards are shown in Figure 11. Two independent raters (DK & JCG) scored every region from each brain and reviewed results to reach consensus. We compiled this full-brain information to produce the semi-quantitative, whole-brain comparisons shown in Figure 11.
To plot Syp-mCherry-labeled boutons for illustrations from case 1803 (Figure 12), we used an updated version of the custom algorithm we described in a recent publication (Huang et al., 2020) and available on GitHub (https://github.com/GeerlingLab/Parabrachial_efferents-v2). This algorithm parses full-resolution source images (OME/TIFF exported from VS-ASW; 346 nanometers per pixel) and uses a convolutional neural network to identify and plot each presumptive bouton as a red dot in a PNG file with a transparent background. We aligned each PNG file atop the source (TIFF) histological image and a Nissl-counterstained image of that same section, each in a separate layer in Adobe Illustrator. In an additional layer, we used the aligned Nissl cytoarchitecture to trace the brain borders, major white matter tracts, and cerebral ventricles for illustrations. We also used this Nissl-counterstained image as a cytoarchitectural reference, to confirm the neuroanatomical location of Syp-mCherry-labeled boutons identified and plotted from NiDAB (pre-counterstaining) source images.
For figures that contain brightfield or fluorescence images, we used Adobe Photoshop to crop TIFF images, which were exported from whole-slide imaging files using VS-ASW or cellSens (Olympus), to adjust brightness and contrast, or to combine raw fluorescence data for multicolor combinations. We added lettering and made all drawings in Adobe Illustrator. Scale bars were traced atop calibrated lines from VS-ASW or cellSens to produce a clean white or black line.
For Figures 20–25, we used Adobe Illustrator to resize illustrations from Pdyn-IRES-Cre case 1812 (Huang et al., 2020) and align them with corresponding plots from Calca-Cre case 1803 (this study). To do this, we identified distinct landmarks (third ventricle, anterior commissure, optic chiasm, external capsule, internal capsule, cerebral peduncle, optic tract, medial lemniscus, decussation of the superior cerebellar peduncle, and cerebral aqueduct) that were present in both sections, then linearly translated and stretched the Pdyn section (and its bouton labeling) to best fit the Calca section. This method of transforming the Pdyn plot to match the Calca section resulted in spillover of a small minority of Pdyn boutons into the third ventricle or white matter tracts.
Nomenclature.
Nomenclature in this paper derives from original neuroanatomical work in the peer-reviewed literature. For the PB, this literature stems from a cytoarchitecture-based taxonomy proposed by Fulwiler and Saper in rats (1984) and subsequent work clarifying subnuclear anatomy in mice (Geerling et al., 2016; Kaur et al., 2013). For other brain regions, where possible, we used nomenclature from a major brain atlas (Dong, 2008; Paxinos & Franklin, 2013).
Results
Calca expression in the lateral PB.
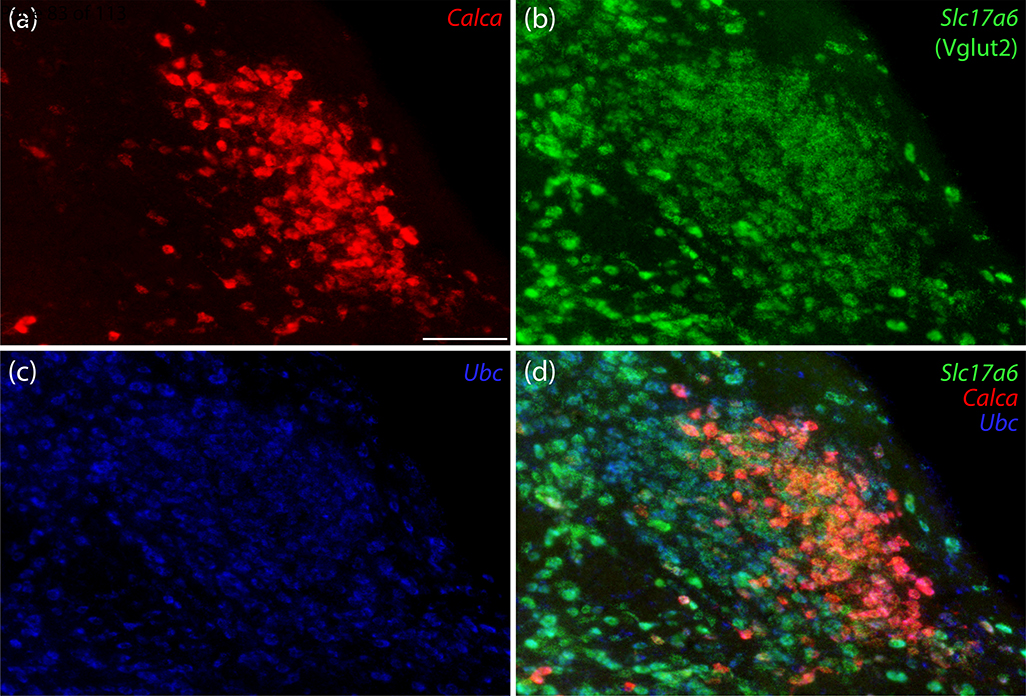
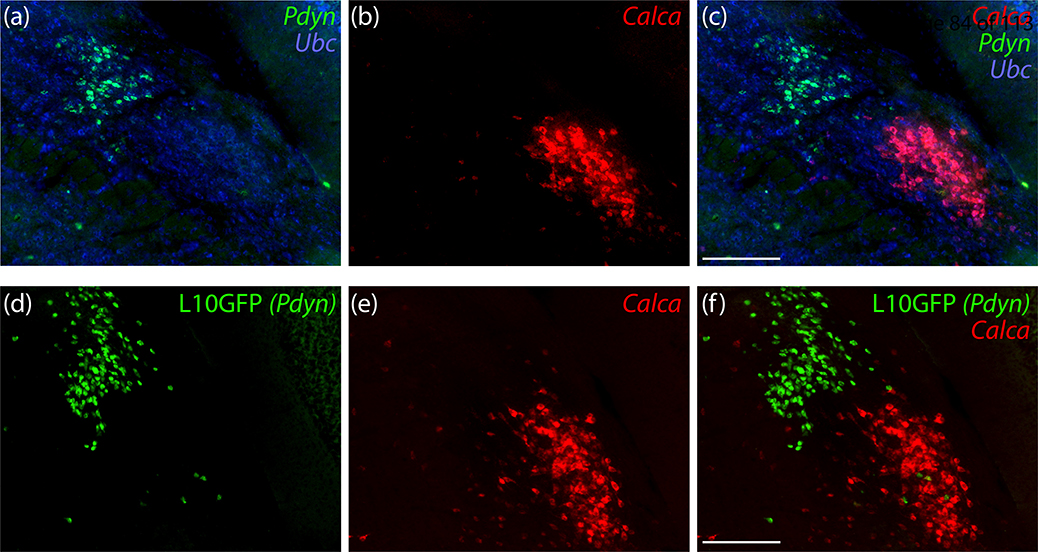
We began by labeling Calca mRNA along with a marker for glutamatergic neurons in the PB. Calca-expressing neurons in the PB uniformly expressed Slc17a6/Vglut2, which encodes vesicular glutamate transporter 2. Calca-expressing neurons were a small subset of glutamatergic PB neurons overall, with a prominent cluster in PBeL (Figure 1). Calca-expressing neurons were distinct from neighboring PB neurons that contain Pdyn mRNA (Figure 2a–c) or that express a GFP Cre-reporter identifying neurons with a history of Pdyn expression (Pdyn-IRES-Cre;R26-lsl-L10GFP; Figure 2d–f). Similar to the distribution of Pdyn mRNA, GFP-expressing neurons concentrated dorsally, in the central lateral (PBcL) and dorsal lateral (PBdL) subnuclei, while most Calca-expressing neurons in the lateral PB subdivision concentrated ventrally, in PBeL.
Figure 1.
Calca mRNA labeling identifies a subpopulation of parabrachial nucleus (PB) glutamatergic neurons. In this example, centered over the external lateral subnucleus (PBeL), (a) Calca mRNA (red) uniformly co-localized with (b) Slc17a6 mRNA (Vglut2, green), and (c) Ubc mRNA (ubiquitin, blue, shown for neuroanatomical background), with the combination of all three genes shown in panel (d). Scale bar in panel (a) is 100 μm and applies to all panels.
Figure 2.
PB neurons that express Calca are mutually exclusive with those that express Pdyn. (a-c) In situ hybridization for Pdyn mRNA (green) and Calca mRNA (red) in a middle level of the PB. (d-f) Cre-dependent expression of a green fluorescent protein reporter (conjugated to the L10 ribosomal subunit; L10GFP) in Pdyn-IRES-Cre;R26-Isl-L10GFP mice reveals neurons with a history of Pdyn expression. In situ hybridization for Calca mRNA is again shown in red. Scale bars in (c,f) are 200 μm and apply to other panels in the same row.
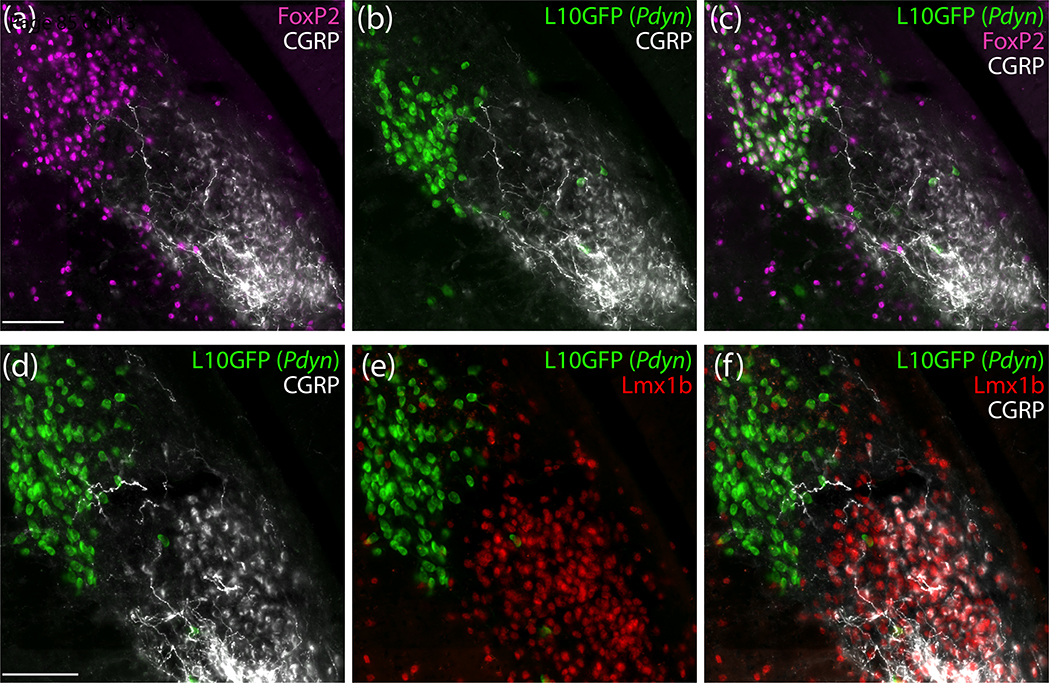
Next, we immunolabeled CGRP (the neuropeptide encoded by Calca) and compared its distribution to nuclear immunolabeling for the transcription factor FoxP2, which identified a larger subpopulation of PB neurons, including most of the Pdyn subpopulation (Figure 3a–c). CGRP and FoxP2 immunoreactivity identified mutually exclusive populations of neurons. At middle levels of the PB, nuclear FoxP2 immunoreactivity distributed medially and dorsally (in PBcL and PBdL), while somatic CGRP immunoreactivity clustered ventrally (in PBeL) similar to Calca mRNA. Also like Calca mRNA, CGRP immunoreactivity was mutually exclusive with GFP in Pdyn Cre-reporter mice (Figure 3b). In adjacent sections, we immunolabeled Lmx1b, a transcription factor that identifies another population of PB neurons that is largely distinct from the FoxP2 population. Every CGRP-immunoreactive neuron contained nuclear immunoreactivity for Lmx1b. Conversely, CGRP and Lmx1b immunoreactivity were mutually exclusive with the GFP Cre-reporter for Pdyn (Figure 3d–f). Of note, while CGRP neurons uniformly contained Lmx1b, a larger population of Lmx1b-immunoreactive neurons without CGRP extended through the inner part of PBeL and several other PB subregions.
Figure 3.
PB neurons with immunoreactivity for calcitonin gene-related peptide (CGRP) do not contain FoxP2 protein or express Pdyn and instead from a subpopulation of the PB neurons that contain the transcription factor Lmx1b. (a-c) Immunofluorescence labeling for FoxP2 (magenta) and CGRP (white) with a Cre-reporter for Pdyn (L10GFP, green). (d-f) Immunofluorescence labeling for Lmx1b (red) and CGRP (white) with a Cre-reporter for Pdyn (green). Scale bar in (a) is 100 μm and applies to (b) and (c). Scale bar in (d) is 200 μm and applies to (e) and (f).
Overall distribution of Calca-expressing neurons in the PB region.
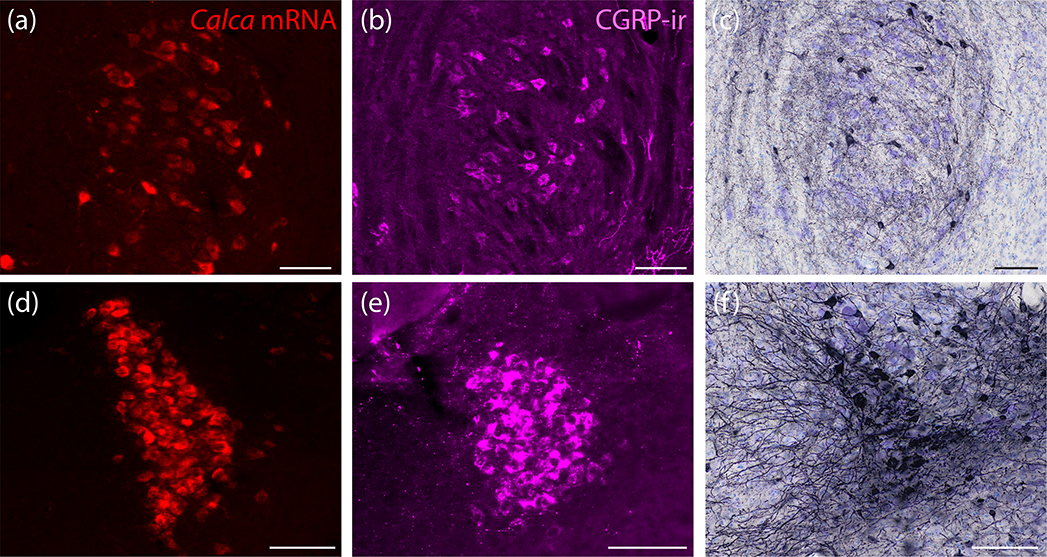
Outside PBeL, many other neurons in and around the PB contained Calca mRNA and CGRP immunoreactivity. Most prominent among these were sparse, large neurons in the motor trigeminal nucleus (V; Figure 4a–b) and tightly packed, medium-sized neurons in the locus coeruleus (LC; Figure 4d–e). In contrast to the PB, Calca did not co-localize with Slc17a6/Vglut2 mRNA in any V or LC neurons (not shown). In the LC, the density of Calca mRNA labeling was nearly as high as in PBeL, and CGRP immunoreactivity was equally prominent. As further evidence that these neurons express Calca, after AAV8-hEf1a-DIO-synaptophysin(Syp)-mCherry injections into this region in adult Calca-Cre mice, neurons in both the LC and V expressed the Cre-conditional construct (Figure 4c,f).
Figure 4.
Neurons in the motor trigeminal nucleus (V) and locus coeruleus (LC) express Calca mRNA, produce CGRP, and exhibit Cre-conditional gene expression in Calca-Cre mice. (a,d) In situ hybridization for Calca mRNA (red) in V (a) and in LC (d). (b,e) Immunofluorescence labeling for CGRP (magenta) in V (b) and in LC (e). (c,f) Nickel-DAB (NiDAB) immunohistochemical labeling for mCherry reveals Calca-Cre-conditional expression of synaptophysin(Syp)-mCherry in V (c) and in LC (f) from case 1807, described below. All scale bars are 100 μm.
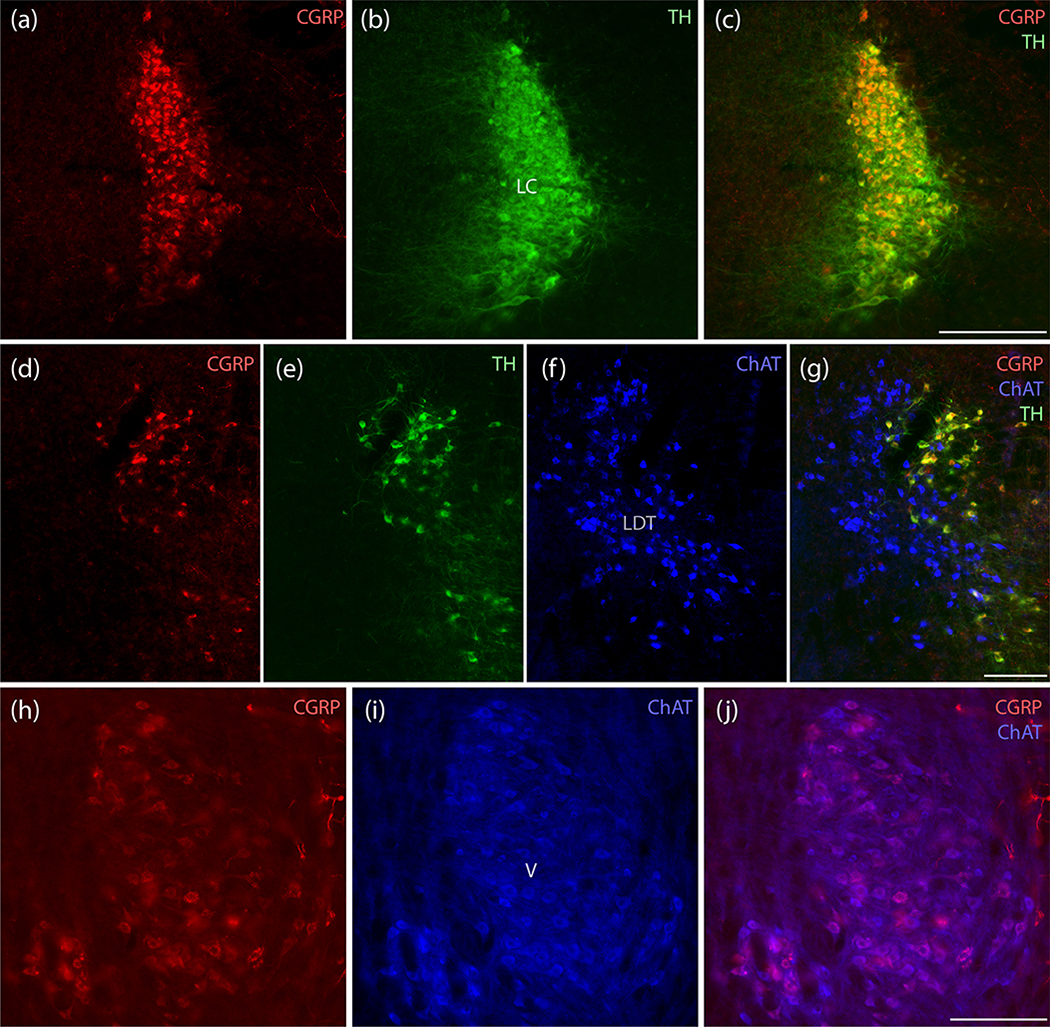
Immunolabeling CGRP in combination with tyrosine hydroxylase (TH) and choline acetyltransferase (ChAT) revealed that CGRP immunofluorescence is denser dorsally in the LC and uniformly co-localizes with TH (Figure 5a–c). In the motor trigeminal nucleus, all CGRP-immunoreactive neurons were cholinergic (Figure 5h–j). Rostrally, no CGRP-immunoreactive neurons co-localized with the prominently ChAT-immunoreactive neurons in the lateral dorsal tegmental nucleus; instead, they contained TH-immunoreactivity, identifying them as a rostral component of the LC (Figure 5d–g).
Figure 5.
CGRP neurons in the LC are catecholaminergic, while those in V are cholinergic. (a–c) All LC neurons containing CGRP immunofluorescence (red) also contain tyrosine hydroxylase (TH, green). All LC neurons appear to contain CGRP, but labeling intensity is greater dorsally. (d–g) Rostrally in this region, CGRP-immunofluorescence is mutually exclusive with cholinergic neurons in the lateral dorsal tegmental nucleus (LDT), which are immunoreactive for choline acetyl transferase (ChAT, blue), and again co-localizes with TH in rostral LC neurons. (h–j) In contrast, the prominent CGRP immunofluorescence in a subset of trigeminal motor neurons uniformly co-localizes with ChAT immunoreactivity (blue). Scale bars are 200 μm (a–c), 200 μm (d–g), and 200 μm (h–j).
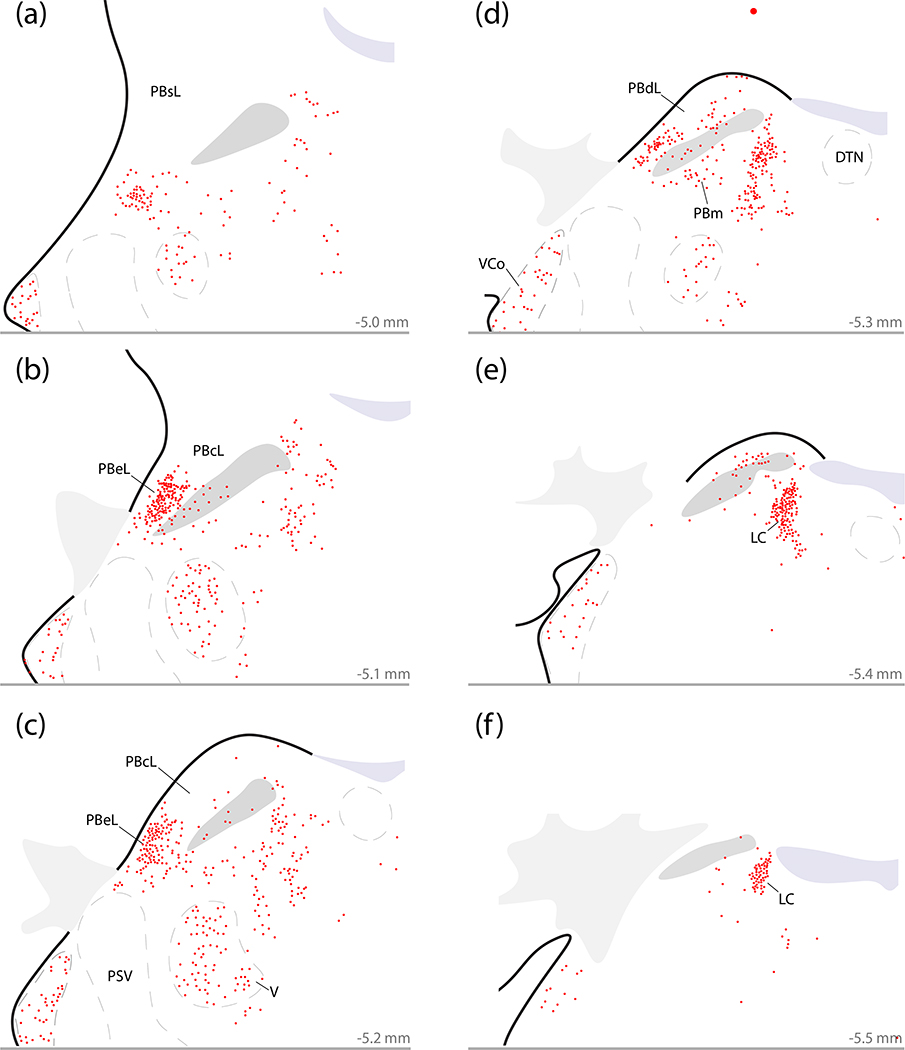
Plotting all neurons with Calca mRNA in and around the PB confirmed that the outer portion of PBeL contains the densest cluster of Calca-expressing neurons in this brainstem region (Figure 6b–c). These Calca-expressing neurons fill the outer portion of the PBeL, decreasing in number at more rostral levels (Figure 6a) up to a point just dorsal to the Kölliker-Fuse nucleus (KF). PB Calca-expressing neurons also distribute medially, though the superior cerebellar peduncle (scp), to form a less concentrated ventral population in PBm (Figure 6d–e). Along the medial border of the PB, the LC contained a dense cluster of Calca-expressing neurons (Figure 6d–f), which extend rostrally into the midbrain and ventrally into the subcoeruleus portion of the reticular formation (Figure 6a–c). Just ventral to the PB, the supratrigeminal region contained fewer, scattered Calca-expressing neurons that extended into the reticular formation rostrally and medially. Below this, the motor trigeminal nucleus also contained many Calca-expressing neurons (Figure 6a–d). In contrast, there was no Calca labeling in the principal sensory trigeminal nucleus. Further laterally, the ventral cochlear nucleus contained a moderate density of Calca-expressing neurons at every rostrocaudal level (Figure 6). Caudal and ventral to the PB, the vestibular nuclear complex contained fewer, scattered Calca-expressing neurons (not shown). Dorsolateral to the PB, we could not identify any Calca–expressing neurons in the cerebellum.
Figure 6.
Distribution of neurons that express Calca mRNA in the PB region. Calca-expressing neurons concentrate in the LC and external lateral PB (PBeL), with fewer in the ventral cochlear nucleus (VCo), V, medial PB (PBm), and surrounding parts of the reticular formation. (a–f) Plots of every neuron labeled by in situ hybridization for Calca mRNA (red) across six rostro-caudal levels through the PB region (approximate distance caudal to bregma is shown at the bottom right of each panel). Other abbreviations: DTN, dorsal tegmental nucleus; PSV, principal sensory trigeminal nucleus.
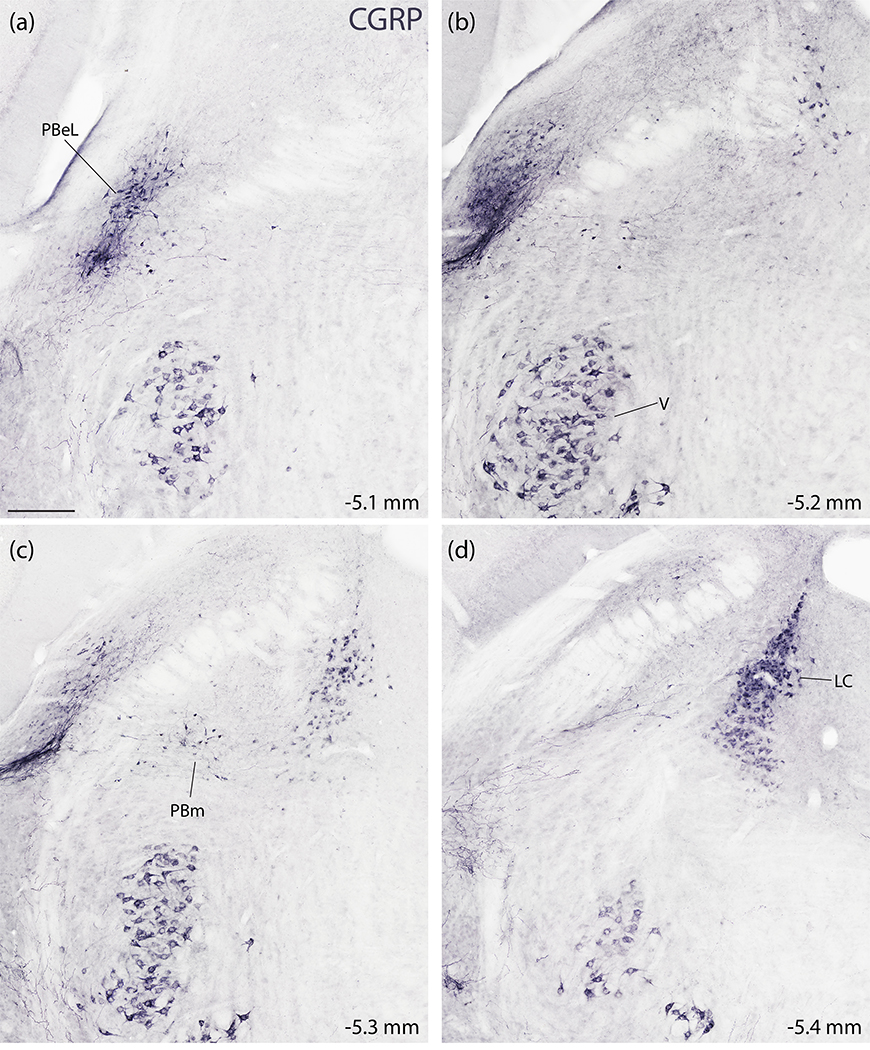
To complement mRNA labeling for Calca in the PB region, we also performed NiDAB immunohistochemical labeling, which identified a similar distribution of CGRP-immunoreactive neurons. The LC and PBeL contained dense concentrations (Figure 7). Between the LC and PBeL, a continuous population of neurons with moderately dense CGRP immunoreactivity (Figure 7c) scattered through the medial PB. Fewer scattered neurons extended ventrally, into the supratrigeminal region. Ventral to that, the motor trigeminal nucleus contained a distinctive population of large neurons with stronger CGRP immunoreactivity (Figure 7a–d). The ventral cochlear nucleus also contained CGRP-immunoreactive neurons (not shown) in the same distribution described above for Calca mRNA. Dorsolateral to the PB, the cerebellum contained no CGRP-immunoreactive neurons, and caudal to the PB, the vestibular nuclear complex contained few, scattered CGRP-immunoreactive neurons. The only notable difference between Calca mRNA and CGRP immunolabeling in this region was the presence of intense CGRP-immunoreactivity in axons forming a prominent, dense streak along the ventral edge of and ventrolateral to PBel (Figure 7b–c).
Figure 7.
Immunohistochemical labeling for CGRP in the PB region. (a–d) NiDAB immunohistochemical staining across four rostral (a) to caudal (d) levels of the PB region. CGRP immunolabeling is strikingly similar to the distribution of Calca mRNA-expressing neurons shown in figure 5. CGRP-immunoreactive neurons concentrate in the LC and the PBeL, with fewer in PBm and more in V (also VCo, not shown). Approximate distance caudal to bregma is shown at the bottom-right of each panel. Scale bar in (a) is 200 μm and applies to all panels.
Co-localization with Oprm1.
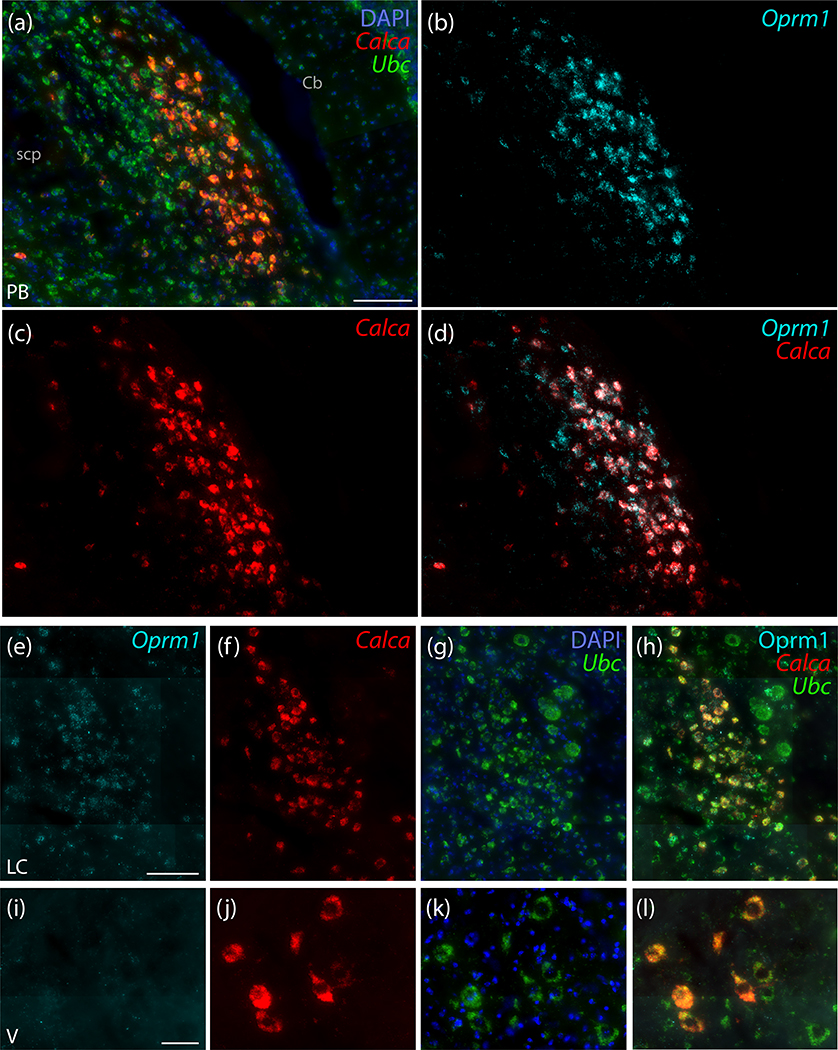
Due to the prominence of mu opioid receptor immunoreactivity in PBeL (Chamberlin et al., 1999), we tested the extent to which Oprm1 (the gene encoding this receptor) co-localizes with Calca. Many neurons in this region contained light Oprm1 mRNA expression, but a subset of Oprm1-expressing neurons in the outer portion of PBeL had much denser mRNA labeling (Figure 8a). This dense Oprm1 expression was largely restricted to neurons that contained Calca mRNA (Figure 8d), not only in PBeL, but also in the contiguous distribution of Calca-expressing neurons medially, extending through the medial and waist PB subnuclei, and rostrally, extending toward the KF. We found dense Oprm1 mRNA labeling in virtually every Calca-expressing neuron, throughout the PB. Few non-Calca-expressing neurons in this brainstem region contained dense Oprm1 labeling; these were located primarily within the inner portion of PBeL. We did not find any prominent labeling for Oprm1 in the KF. The LC, in contrast, contained Oprm1 labeling (Figure 8e) that co-localized with Calca mRNA (Figure 8h). Oprm1 mRNA in LC neurons was noticeably less dense than in the Calca-expressing neurons located laterally, in the PB. Unlike Calca-expressing neurons in the LC and PB, Calca-expressing neurons in the trigeminal motor nucleus contained little to no Oprm1 mRNA (Figure 8i–l).
Figure 8.
Strong expression of mRNA for the mu opioid receptor (Oprm1) co-localizes with Calca mRNA in PBeL. (a–d) In situ hybridization for Oprm1 mRNA (ice blue) co-localizes with Calca mRNA (red) in the outer portion of PBeL. Some neurons without Calca also express Oprm1 in the inner portion of PBeL. (e–h) In the LC, Calca mRNA co-localizes with lighter, per-cell Oprm1 expression. (i–l) Motor neurons in V express little to no Oprm1. Scale bars are: 100 μm in (a; also applies to c–d), 100 μm in panel (e; also applies to f–h), and 50 μm in panel (i; also applies to j–l).
Cre-conditional expression of Syp-mCherry in Calca-Cre mice.
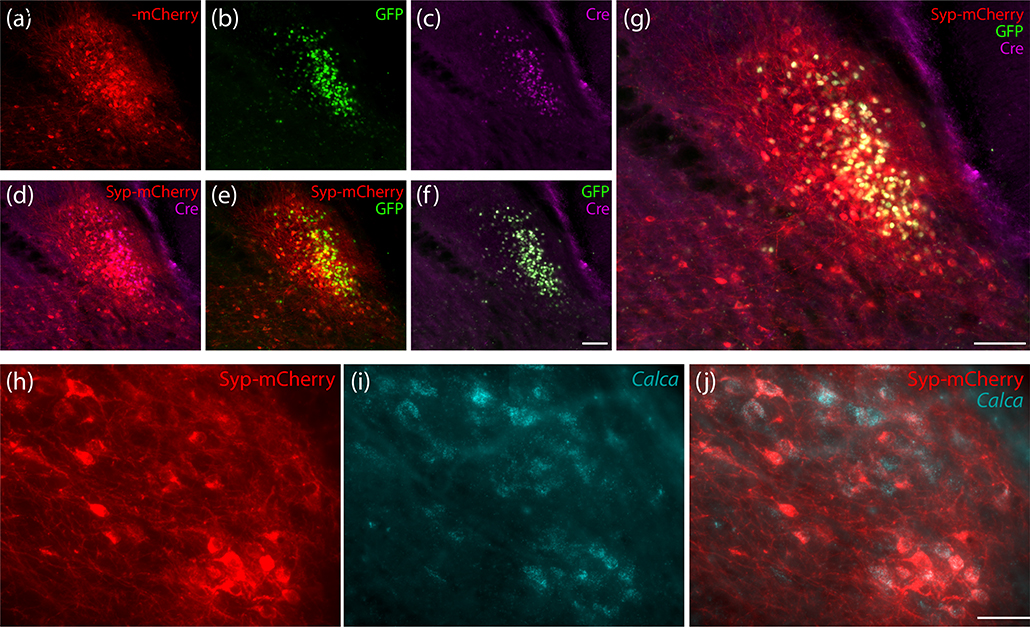
To label the efferent projections of Calca-expressing neurons, we made small (40 nL) injections of a Cre-conditional viral vector (AAV8-hEf1a-DIO-synaptophysin(Syp)-mCherry) into the PB region of Calca-Cre mice (n=7). Figure 9 shows examples of Syp-mCherry expression combined with nuclear Cre:GFP labeling and with Calca mRNA in PBeL. To maximize sensitivity for identifying Syp-mCherry-expressing neurons, we used NiDAB immunohistochemistry to label mCherry in a full, rostral-to-caudal series of sections through each injection site.
Figure 9.
Injection site immunofluorescence labeling for (a) Syp-mCherry, along with (b) GFP and (c) Cre recombinase from the PB of case 1803. Panels (d–f) show pairwise combinations of Syp-mCherry, Cre, and GFP, with all three combined in (g). Scale bars are 100 μm in panels (f; also applies to a–e) and (g). Panels (h–j) show in situ hybridization labeling for Calca mRNA (i, ice blue) with Syp-mCherry immunofluorescence (h) in PBeL from the injection site of a Calca-Cre mouse (case 4181). Scale bar in (j) is 50 μm (also applies to h–i).
No individual AAV injection transduced neurons across all Calca-expressing populations, but every injection site transduced neurons in more than one PB subnucleus, and the combination of all cases encompassed every Calca-expressing subregion of the PB. In addition to neurons within the PB, most injections also transduced neurons in the supratrigeminal region, motor trigeminal nucleus, or reticular formation. One (case 1809) transduced neurons in the molecular layer of the cerebellum, in addition to PBeL. Another (case 1800) transduced neurons primarily in the reticular formation (medial and rostral to the PB). In three cases (1803, 1808, 1809), the distribution of Syp-mCherry-expressing neurons was centered in the PB, with little to no transduction of neurons in the LC. The remaining four cases (1800, 1802, 1805, 1807) transduced some or many neurons in the LC. Due to the diffuse projections of LC axons to every region of the central nervous system (Bruinstroop et al., 2012; B. E. Jones, Halaris, McIlhany, & Moore, 1977; Loughlin, Foote, & Fallon, 1982), we divided our subsequent analysis between injections sites that did or did not transduce neurons in the LC.
Figure 10 shows the full, rostral-to-caudal plot of Syp-mCherry-expressing neurons in each injection site. Photomicrographs of rostral-to-caudal sections through the injection site of these cases are shown in Supplemental Figure 3. Figure 11 shows the resulting density of Syp-mCherry-labeled boutons in target regions throughout the brain in each case.
Figure 10.
Location and distribution plots of Syp-mCherry-transduced neurons in the injection site of each Calca-Cre case. The left-most column on page one (a–h) shows Nissl cytoarchitecture at eight rostro-caudal template levels through the PB region, with the approximate bregma level at the lower right of each panel. Each remaining column contains a plot of Syp-mCherry-transduced (NiDAB-labeled) neurons at each rostrocaudal level from that case (case number at top). Cases on page one (1803, 1808, 1809) had no Syp-mCherry-transduced neurons in the LC. Case on page two (1800, 1802, 1805, 1807) had many Syp-mCherry-transduced neurons in the LC.
Figure 11.
Density of Syp-mCherry-labeled boutons across 147 brain regions in each case. Cases are divided into two groups based on the presence or absence of Syp-mCherry expression in LC neurons. Semi-quantitative density standards used to rate each region are shown in the legend at right. Light gray indicates an absence of labeling. Light-to-dark shades of blue represent increasing densities. Ice blue represents regions excluded from analysis due to Syp-mCherry expression in cell bodies and/or dendrites near the injection site. White represents areas that could not be analyzed due to histologic artifacts. Abbreviation: tr, trace labeling.
Syp-mCherry labeling in cases with and without LC transduction.
Injections that transduced LC neurons produced trace or light Syp-mCherry axonal labeling across most brain regions, with the notable exception of the dorsal striatum. In these cases with neuronal transduction in the LC, Syp-mCherry labeling was much more extensive in the hypothalamus and cerebral cortex than in cases with neuronal transduction primarily in the PB. In cases with LC neuronal transduction, every region of the cerebral cortex contained an unchanging pattern of Syp-mCherry-labeled axons that often crossed at right angles with minimal branching and semi-regularly spaced varicosities, similar to previous descriptions of noradrenergic LC axons (Fritschy & Grzanna, 1989).
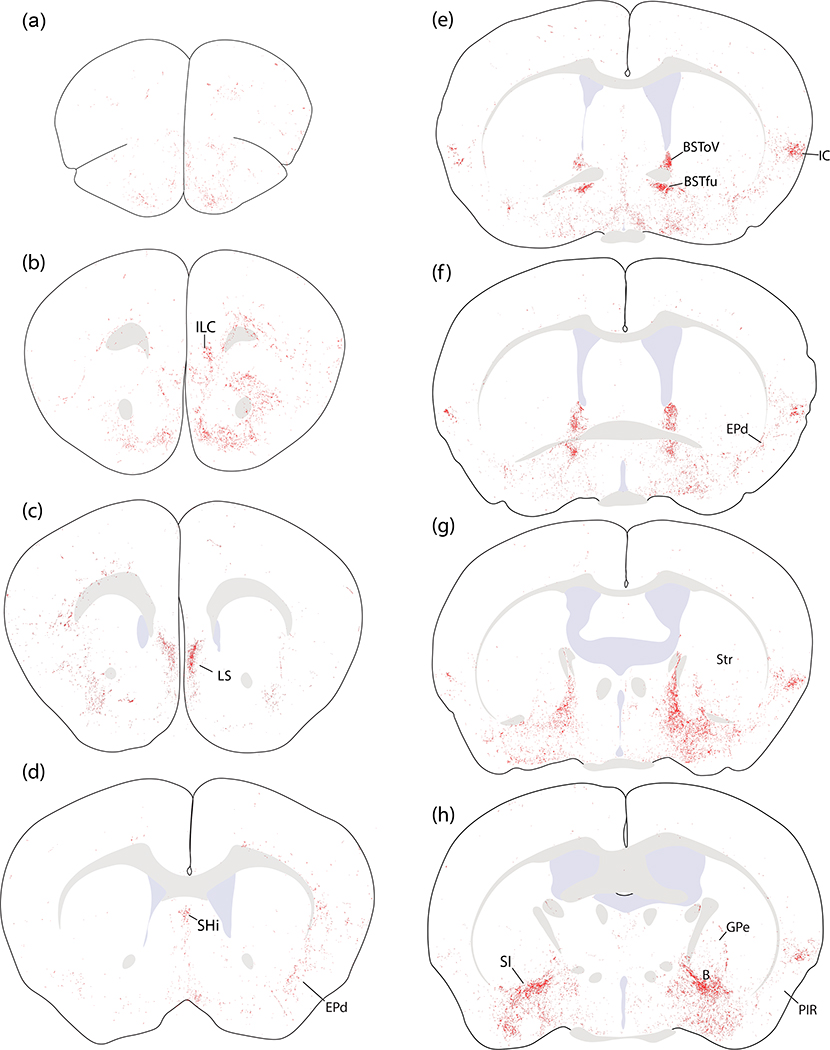
In cases without LC neuronal transduction, Syp-mCherry labeling was less overall, yet denser in certain regions. We will focus primarily on the projections of Calca-expressing PB neurons (cases 1803, 1808, and 1809), but will also discuss salient differences in cases with LC contamination (1800, 1802 1805 and 1807). The brain-wide pattern of Syp-mCherry labeling that best represents the output of Calca-expressing, non-LC neurons from this region is illustrated in Figure 12 (case 1803).
Figure 12.
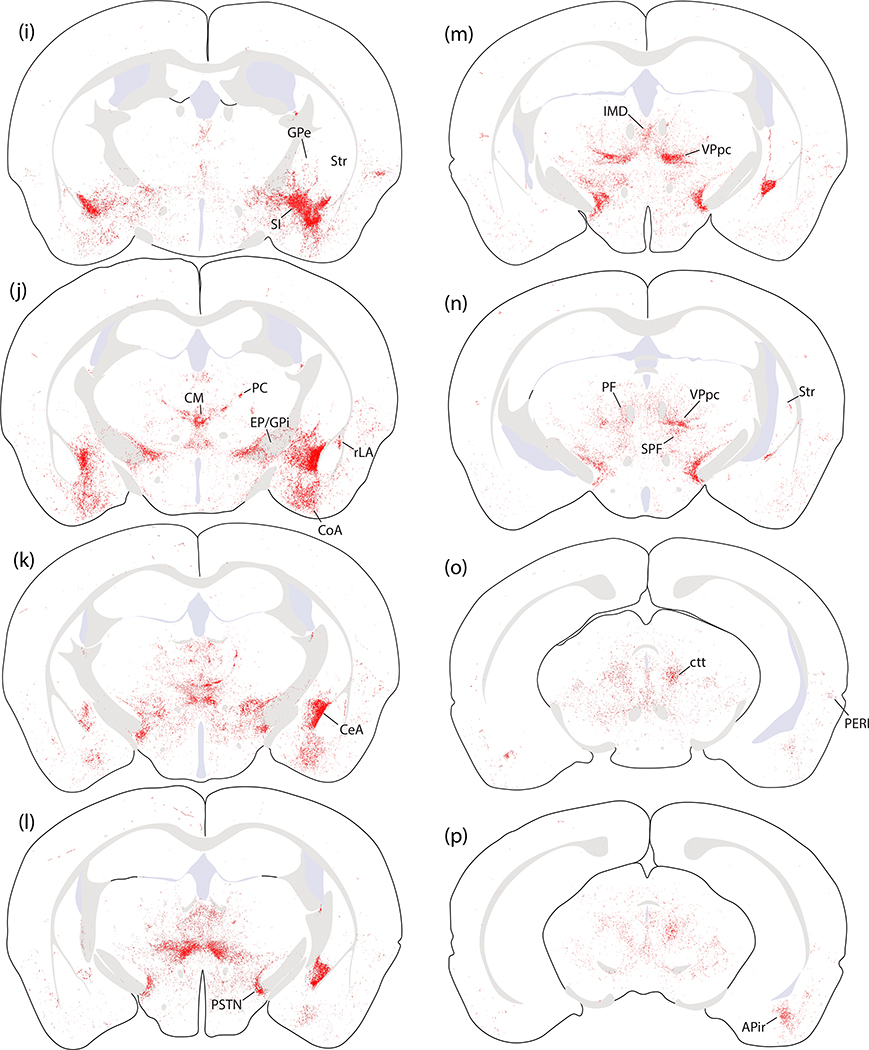
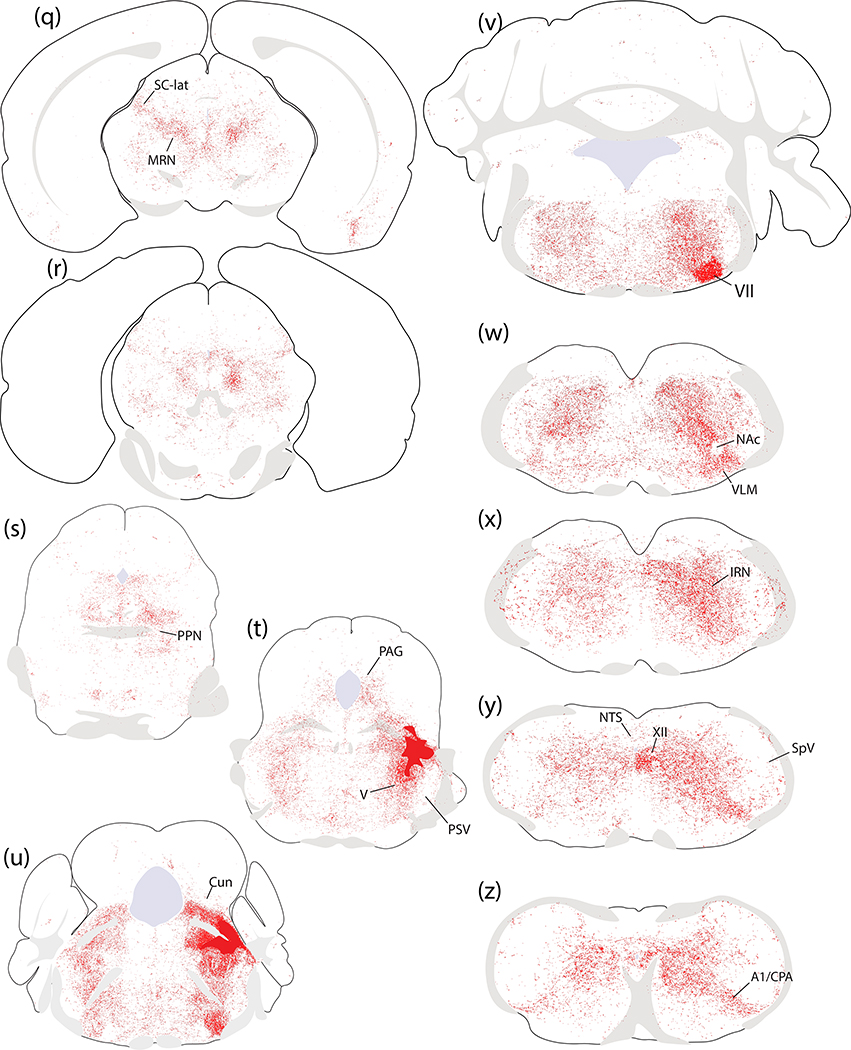
Brain-wide distribution of Syp-mCherry labeling in case 1803. Each of the 26 illustrated sections (a–z) was chosen to best represent all major terminal fields of Calca-expressing neurons. The solid color in panels (t–u) encompass the region of heavy somatic and dendritic Syp-mCherry at the core of the injection site. Other abbreviations: see List of Abbreviations.
Cerebral Cortex.
While cases without LC contamination had very little labeling in the cerebral cortex, and virtually none in the neocortex, a few limbic areas – primarily the insular cortex – received modest input. Syp-mCherry labeling in the dysgranular insular cortex was prominent at rostrocaudal levels of the brain near the decussation of the anterior commissure (Figure 12e–g). This region contained modestly dense labeling in all PB cases except 1809, which had light labeling. Labeling here concentrated superficially, over layers 2–3, with fewer boutons in deeper layers and very few in the underlying claustrum (Figure 12e–g).
Scattered labeling extended rostrally through the insular cortex and then dorsally through layers 5–6 of the overlying prefrontal cortex (Figure 12b–d). This light labeling turned medially and ventrally into the medial prefrontal cortex just rostral to the genu of the corpus callosum. There, light labeling in the infralimbic area (Figure 12b) extended ventrally through the dorsal peduncular cortex, tenia tecta, and septo-olfactory area, then continued caudally into the lateral septum (see below).
Ventral to the insular cortex, light labeling sprinkled through the endopiriform nucleus, with only trace labeling in the overlying piriform cortex (Figure 12b–f). Caudally, light to moderate labeling extended through all levels of the posterior insular cortex, decreasing through the perirhinal cortex then extending ventrally into the rostral entorhinal cortex (Figure 12n–q). Further ventrally, at these caudal levels, the amygdalopiriform transition cortex (APir) contained a modestly dense terminal field (Figure 12o–q) that was more prominent in cases with injection sites centered in the medial PB.
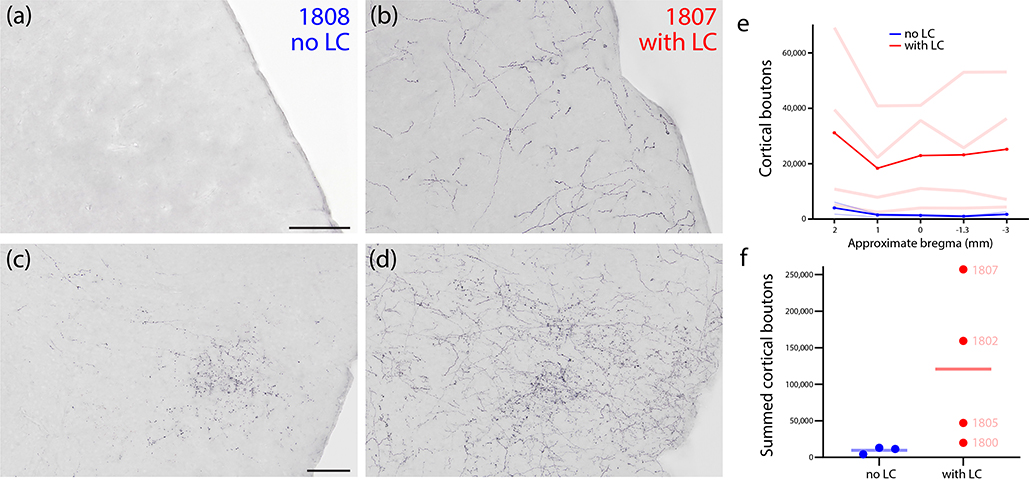
This cortical pattern was similar across cases without LC contamination, with no major discrepancies. However, case 1803 also had sparse axonal labeling scattered throughout the neocortex, which was absent in cases 1808 and 1809. In contrast, all cases with neuronal transduction of LC neurons had a more uniform coating of Syp-mCherry-labeled axons throughout the cerebral cortex, similar to the example in Figure 13b. In cases with neuronal transduction in both the PB and LC (1802, 1805, and 1807), this light, uniform cortical labeling was superimposed on more focal concentrations of grain Syp-mCherry labeling in the insular cortex and other PB target regions, as described above (Figure 13d). To compare the extent of cortical labeling in LC-transduced versus non-LC-transduced cases, we counted the number of cortical boutons across five sections spanning the cerebral cortex in each case. The four LC-transduced cases had a wide range (Figure 13e–f), but even the case with the fewest cortical boutons (1800) had more labeling than cases that lacked LC neuronal transduction.
Figure 13.
Cortical labeling in cases with or without LC contamination. (a) The somatosensory cortex in case 1808 (no transduction of LC neurons) contained no Syp-mCherry labeling, while (b) the same region in case 1807 (many Syp-mCherry-expressing neurons in LC) had a uniform meshwork of Syp-mCherry labeling, similar to the rest of the cerebral cortex. The insular cortex in case 1808 (c) contained a moderate terminal field of grainy boutons, while case 1807 (d) had a similar terminal field, plus superimposed, uniform labeling similar to the rest of the cerebral cortex. (e) Quantification of all Syp-mCherry-labeled boutons across cases at 5 rostro-caudal levels of the cerebral cortex (approximate bregma levels shown along the x-axis). Pale red (LC-transduced) and blue (no LC) lines represent individual cases. Bold red and blue lines represent the average of cases from each group. (f) Summed cortical boutons (across all five counted brain sections) in each case.
Septum and basal forebrain.
Light labeling in the medial prefrontal cortex and septo-olfactory area (above) continued caudally into a thin, rostral region of the lateral septum (Figure 12c). This light labeling extended caudally into the septohippocampal nucleus and ventrally into the medial septum (Figure 12d). These regions contained minimal labeling in all cases except 1803, in which the septohippocampal nucleus contained moderate labeling.
The entire basal forebrain contained scattered boutons, with the exception of dense labeling in the substantia innominata (SI). The SI was extensively labeled in every case (Figure 12h–i) except in one (case 1800) where the injection site missed the PB. Laterally, this dense SI terminal field was continuous with and indistinguishable from the anterior and central nucleus of the amygdala (see below). Medially, this dense SI terminal field faded to light labeling in the lateral preoptic area (Figure 12e–h). Ventral and rostral to the SI, this lighter labeling continued through the magnocellular preoptic nucleus and nucleus of the diagonal band and into the medial septum (Figure 12d–h). Labeling in the SI also extended caudally and medially into the basal nucleus of Meynert. This basal forebrain region contained light to moderate labeling along the ventral fringe of the internal capsule and globus pallidus (Figure 12g–i).
Basal Ganglia.
Labeling in the basal nucleus of Meynert extended dorsally into a thin, curved streak of boutons in-between the striatum and globus pallidus across multiple levels (Figure 12h–i). Light labeling also extended dorsally from the basal nucleus of Meynert, into much of the globus pallidus, and caudally into the entopeduncular nucleus (internal globus pallidus; Figure 12i–j).
Overall, the striatum itself contained very little labeling, with scattered Syp-mCherry-labeled boutons throughout its ventral aspect. The subthalamic nucleus contained no more than trace labeling in any case, contrasting the denser labeling medial and dorsal to it, in the parasubthalamic nucleus and zona incerta (see below).
Amygdala.
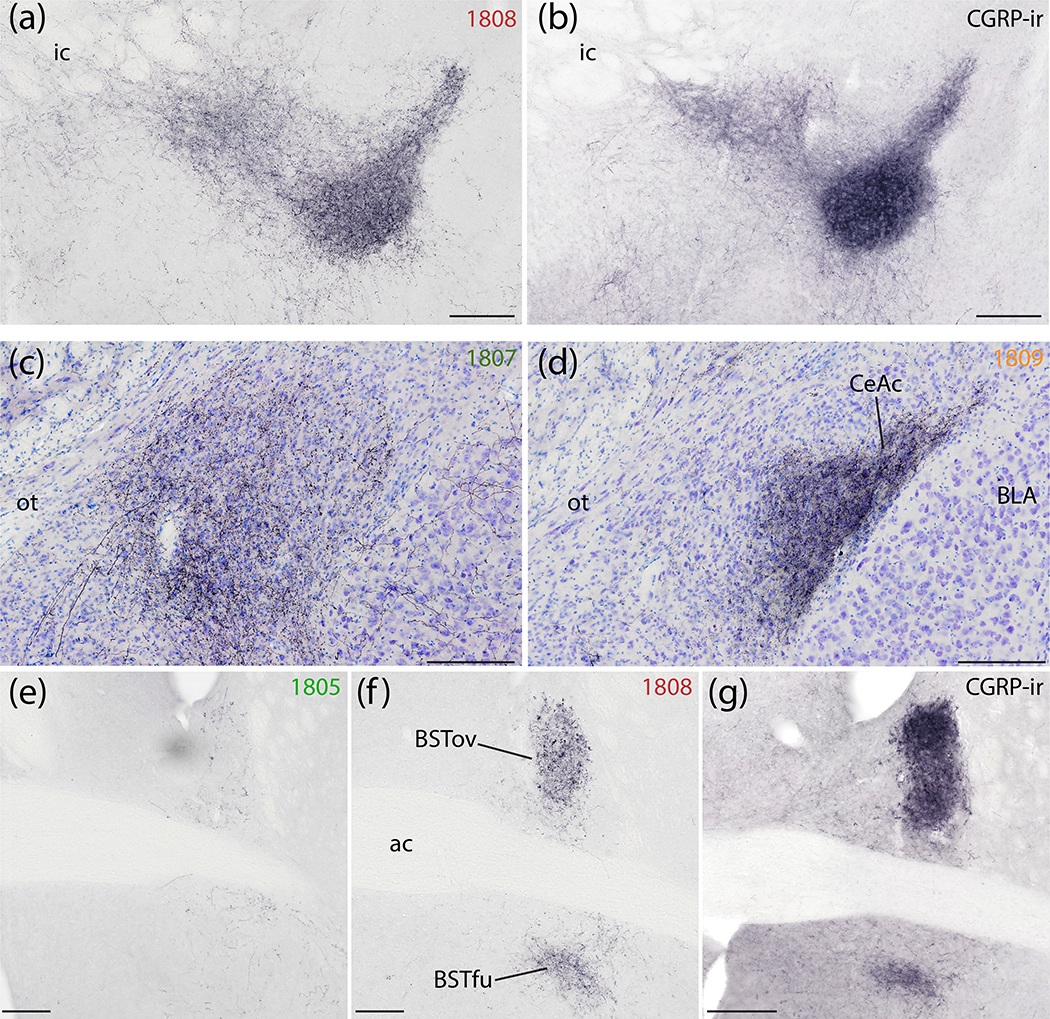
Subregions of the amygdala received dense input in every case except one (case 1800) where the injection site missed the PB. In every case, the central nucleus of the amygdala (CeA) contained the heaviest labeling, but the distribution of labeling across its three subdivisions varied with the medial-to-lateral location of each injection site within the PB. More lateral injection sites (1808, 1809) produced very dense Syp-mCherry labeling in the lateral capsular CeA subdivision (CeAc), with less-dense labeling in the lateral CeA subdivision, and only trace labeling in the medial CeA subdivision (Figure 14d). In these cases, the distribution and density of labeled boutons in CeAc was similar to that of immunohistochemical labeling for CGRP (Figure 14a–b). Conversely, more medial injection sites (1805, 1807) produced more labeling in the medial CeA subdivision (CeAm) with sparser labeling in the lateral subdivision and CeAc (Figure 14d). Between these extremes, one case with an injection site spanning the medial and lateral PB (case 1802) had dense labeling in CeAc, as well as moderate labeling in both CeAl and CeAm. Case 1803 also had an intermediate pattern, closer to the cases with more lateral injection sites (Figure 12j–m).
Figure 14.
Syp-mCherry labeling in the central nucleus of the amygdala (CeA) and bed nucleus of the stria terminalis (BST). (a) NiDAB immunolabeling for Syp-mCherry in the SI and rostral capsular CeA (case 1808) is strikingly similar to (b) CGRP immunolabeling in the same region of an uninjected C57B6/J mouse brain. (c) Syp-mCherry labeling was more prominent in the medial CeA subdivision after a more medial injection site in the PB region (case 1807) and (d) even more dense in the capsular and lateral subdivisions (CeAl and CeAc) following a more lateral injection, in PBeL (case 1809). (e–g) Labeling in the BST followed a topographical organization similar to the CeA. (e) Minimal labeling in the BST after a medial injection site (case 1805). (f) Denser Syp-mCherry labeling in the oval and fusiform subnuclei (BSTov and BSTfu) after a more lateral injection involving PBeL is strikingly similar to (g) CGRP immunolabeling in the same region of a an uninjected C57B6/J mouse brain. Scale bars are 200 μm (a–d) or 500 μm (e–g).
Ventral to the CeA, labeled axons passed through the intercalated amygdalar nucleus, which contained trace to light labeling, to form a moderately dense terminal field in the basomedial and cortical amygdalar nuclei (BMA, CoA; Figure 12j–K). Medial to these, the medial nucleus of the amygdala (MeA) received trace or light input. Caudal and lateral to the CoA, a separate terminal field appeared in the APir transitional cortex wedged between the piriform cortex and the amygdala (Figure 12p–q), as described above. Lateral to the CeA, most of the basolateral nucleus (BLA) was unlabeled (Figure 12j–l). However, along the dorsolateral edge of the BLA, immediately below a fork in the external capsule, the rostral portion of the lateral amygdaloid nucleus (LAr) contained light labeling (Figure 12j).
Bed nucleus of the stria terminalis.
Dorsal to the anterior commissure, Syp-mCherry labeling in the oval subnucleus of the bed nucleus of the stria terminalis (BSTov) varied widely across cases, depending on the location of each injection site. BSTov labeling ranged from light after medial injections (cases 1805 and 1807; Figure 14e) to heavy after more lateral injections (cases 1808 and 1809; Figure 14f), with intermediate densities in cases 1802 and 1803 (Figure 12e–f). In cases with lateral injection sites, the dense Syp-mCherry labeling in BSTov formed distinctive, pericellular rings like those in CeAc. Ventral to the anterior commissure, the fusiform subnucleus (BSTfu) in these cases contained a cluster of Syp-mCherry-labeled boutons with a different, grainy morphology. As in the CeA, the dense Syp-mCherry labeling in BSTov and BSTfu after lateral injections (cases 1808 and 1809) closely resembled immunohistochemical labeling for CGRP (Figure 14g).
This dense labeling in BSTov and BSTfu gave way to lighter labeling in the anterolateral and anteromedial BST subnuclei. The posterior BST contained little to no labeling in most cases, with the exception of light labeling here in case 1802. Case 1800, with an injection site medial and rostral to the PB, produced no more than trace labeling anywhere in the BST.
Preoptic area and hypothalamus.
In cases without LC contamination, most of the hypothalamus contained little or no labeling. However, at caudal levels of the lateral hypothalamic area, the parasubthalamic nucleus (PSTN) contained moderately dense labeling that extended dorsally into a contiguous region of the zona incerta (ZI) (Figure 12k–I). The lateral preoptic area contained the medial fringe of the broader terminal field in the basal forebrain, as described above, but other than this the preoptic area contained little to no labeling in cases without LC neuronal transduction. In contrast, every case with an injection site that transduced LC neurons (including 1800, which missed the PB) had light, uniform labeling across the paraventricular, dorsomedial, lateral, and posterior hypothalamic nuclei.
Thalamus.
Shifting dorsally, the thalamus had a complex labeling pattern. In general, injections that transduced more neurons in the medial PB produced heavier labeling in the thalamus. In the midline, immediately dorsal to the hypothalamus, the reuniens, rhomboid, and xiphoid thalamic nuclei all contained light labeling (Figure 12k). This light labeling extended caudally into a denser patch in the centromedian nucleus (CM; Figure 12j–i) and then laterally in a semicircular streak through the paracentral nucleus (PC; Figure 12j–k), which contained large and bulky boutons.
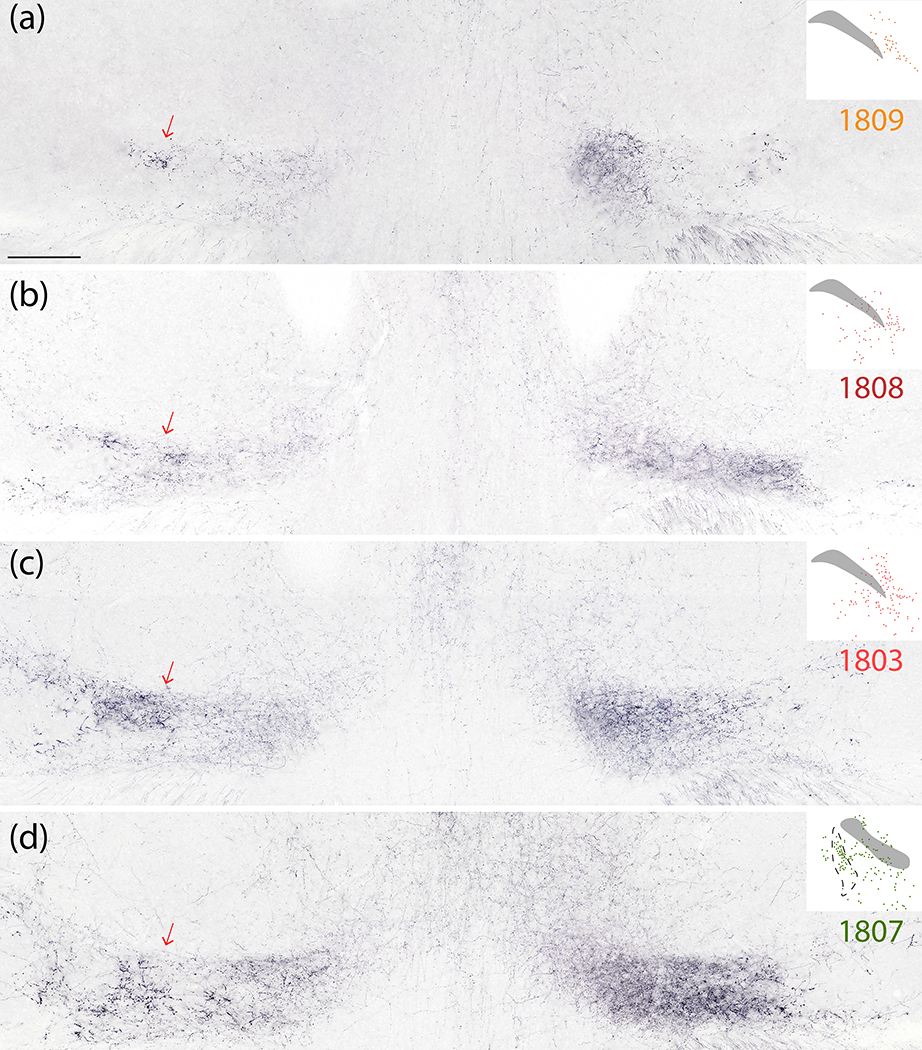
We found similarly large Syp-mCherry-labeled boutons in the lateral aspect of the ventral posterior nucleus of the thalamus (VPpc). While most PB projections are denser ipsilaterally (Huang et al., 2020), these large boutons were noticeably denser in the contralateral VPpc (Figure 15a–d). Medial to these large boutons, the remainder of the VPpc contained uniformly small, grainy boutons that were denser ipsilaterally.
Figure 15.
Syp-mCherry labeling in the thalamic ventral posterior parvicellular nucleus (VPpc) was lighter after injections into the PBeL (case 1809, a) and progressively denser after injections involving more of the medial PB (cases 1808–1803-1807; b–d). Note that the lateral aspect of the VPpc contained large, bulky boutons which were more prominent on the contralateral side (red arrows at left). The medial aspect of the VPpc contained smaller, grainy boutons which were denser on the ipsilateral (right) side in every case. Inset at upper-right of each panel shows the distribution of Syp-mCherry-transduced neurons at the center of the injection site for each case. Scale bar is 500 μm (a) and applies to (b–d).
Dorsal to the VPpc, the intermediodorsal nucleus (IMD) contained lighter labeling (Figure 12m). Similarly light labeling was also present in the neighboring parafascicular (PF), subparafasicular (SPF), and posterior triangular nuclei.
Injection sites that transduced LC neurons produced labeling scattered throughout much of the remaining thalamus. This labeling was less than that in the cerebral cortex except in a handful of nuclei, including the paraventricular (PVT), anteroventral (AV), and lateral geniculate nuclei (LGN), consistent with previous descriptions of catecholamine axonal labeling (Lindvall, Bjorklund, Nobin, & Stenevi, 1974).
Midbrain.
Amid trace Syp-mCherry labeling in many regions of the midbrain, a few areas received slightly more input. These included a subregion of the periaqueductal gray matter (PAG) and several midline structures.
The most prominent labeling in the rostral midbrain, up to the diencephalon, concentrated in bundles of axons in the central tegmental tract (ctt; Figure 12o–p). Lateral to the ctt, the midbrain reticular nucleus (MRN) contained scattered labeling (Figure 12q), which extending dorsally and laterally into the lateral part of the superior colliculus (SC-Lat; Figure 12q). Cases with LC-contaminated injection sites had uniform labeling throughout the superior colliculus with an appearance similar to the overlying cerebral cortex and denser than the modest labeling in the inferior colliculus. Beneath the cerebral aqueduct in all cases, the dorsal and median raphe nuclei contained light labeling, as did the Edinger-Westphal nucleus. Flanking these, the oculomotor and trochlear nuclei contained no more than trace labeling in cases with PB injection sites, and light labeling in cases with LC contamination. In continuity with the MRN, the retrorubral/A8 region contained light labeling (Figure 12s). Scattered labeling also extended medially, into the PAG, and this light labeling continued caudally through its lateral and ventrolateral subdivisions (Figure 12t). Some cases had moderately dense labeling in the nucleus of Darkschwitz (ND; most prominent in case 1807).
The pedunculopontine tegmental (PPN) and cuneiform nuclei, which border the PB rostrally and dorsally, were excluded from analysis due to Syp-mCherry transduction of neurons at the rostral periphery of the injection site in several cases. In case 1809, no neurons were transduced in either region and the cuneiform nucleus had no more than trace labeling, and no region of the PPN contained more than light labeling.
Cases with LC contamination had slightly denser and broader projections to the midbrain overall. In a subset of LC cases (1802 and 1807), the ventral tegmental area (VTA), interpeduncular nucleus, tail of the VTA (rostromedial tegmental nucleus), and inferior colliculus all contained light labeling. Cases without LC contamination had no more than trace labeling in these regions.
Cerebellum.
The cerebellum receives little to no input from the PB (Huang et al., 2020), and the present results were consistent with this pattern. The deep cerebellar nuclei (DCN) had no more than trace labeling in any case. Though devoid of labeling in cases 1803 and 1808, the flocculus of the cerebellum contained trace labeling in one case with an injection site that transduced neurons in the cerebellar molecular and granule cell layers just dorsal to the PB (case 1809; see Figure 10 and Supplemental Figure 3).
In contrast, each case with LC-contaminated injection sites had uniform axonal labeling throughout the cerebellum resembling that in the cerebral cortex. Cases 1805 and 1807, whose injection sites extended slightly caudal to the LC and PB and transduced several Syp-mCherry-expressing neurons in the medial vestibular nucleus, had a small amount of additional labeling in the flocculus, with a mossy fiber morphology similar to case 1809.
Hindbrain.
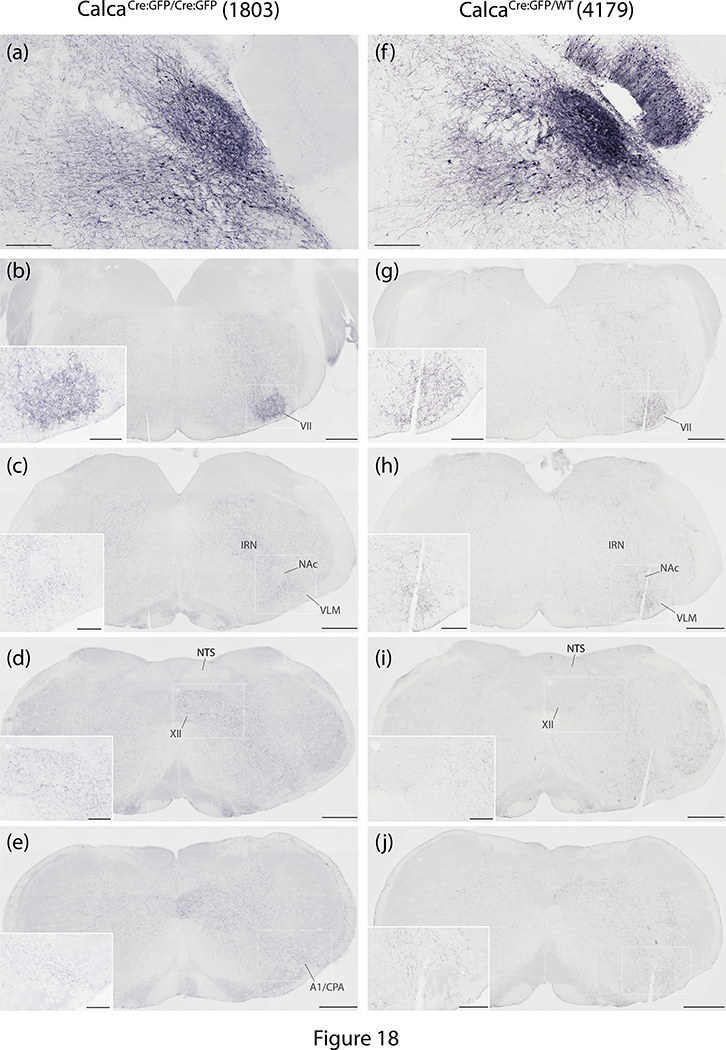
The hindbrain reticular formation contained Syp-mCherry labeling in a similar pattern in every case. Labeled puncta extended caudally through the parvicellular and intermediate reticular nuclei back through levels containing the pyramidal decussation (Figure 12u–z and Figure 18). In the caudal hindbrain, Syp-mCherry labeling in the intermediate reticular nucleus (IRN) excluded the compact formation of the nucleus ambiguus, but continued around it and throughout the ventral respiratory column and paragigantocellularis region of the ventrolateral medulla (VLM; Figures 12w and 18c). In the ventral midline, the raphe magnus and obscurus contained light labeling in most cases. This labeling continued caudally into a lightly labeled area of the VLM bordering the spinal trigeminal nucleus, the caudal pressor area (CPA; Figures 12z and 18e). Dorsally, labeling in the IRN extended into light, scattered labeling in the nucleus of the solitary tract (NTS), and no sections contained more than one or a few individual boutons within the area postrema.
Figure 18.
The pattern of hindbrain Syp-mCherry labeling was similar between homozygous case 1803 and heterozygous case 4179. (a,f) In each case, injection site neuronal labeling was primarily in PBeL, with fewer neurons in PBm and in the supratrigeminal region; the injection in case 4179 also transduced neurons in the overlying cerebellar molecular layer (no cerebellar neurons were transduced in case 1803). (b–j) NiDAB immunohistochemical labeling for Syp-mCherry is shown at successive rostral-to-caudal hindbrain levels beneath each injection site, revealing the extensive bouton labeling at all levels of the hindbrain reticular formation, particularly in the intermediate reticular nucleus (IRN). In both cases, labeled axons formed a moderately dense terminal field in the ventrolateral aspect of the facial motor nucleus (VII), then coursed caudally around the compact portion of the nucleus ambiguus (NAc) to ramify throughout the ventrolateral medulla (VLM), back through levels containing the A1 noradrenergic neurons and the caudal pressor area (CPA). Dorsally, the nucleus of the solitary tract (NTS) contained no more than light labeling, while the hypoglossal motor nucleus (XII) contained moderately dense labeling in 1803 and lighter labeling in 4179. Scale bars are 200 μm in panels (a) and (f). Scale bars in (b–e) and (g–j) are 500 μm (main) and 200 μm (inset).
Immediately ventral to the PB, we excluded V from analysis in most cases because some of its Calca-expressing neurons were transduced in most cases. However, one case with no transduction of V motor neurons (1809) had virtually no Syp-mCherry labeling in V. In contrast, the trigeminal sensory nuclei (principal, interfascicular, and spinal trigeminal nuclei), which did not contain any Calca-expressing neurons or neuronal transduction in any of our cases, did contain light labeling in all cases. Syp-mCherry labeling in the spinal trigeminal nucleus concentrated along its lateral edge, just deep to the spinal trigeminal tract, near the medullary surface.
In every case, the facial motor nucleus (VII) contained labeling (Figures 12u–v and 18b), which was denser in the ventrolateral (nasolabial) part. Labeling density in the hypoglossal motor nucleus (XII) varied from trace to moderate (Figures 12y and 18d–e). Outside these cranial motor nuclei, LC-contaminated cases had slightly more labeling across several hindbrain regions, including the principal sensory trigeminal nucleus, vestibular nucleus, NTS, inferior olivary nucleus, and the lateral reticular nucleus.
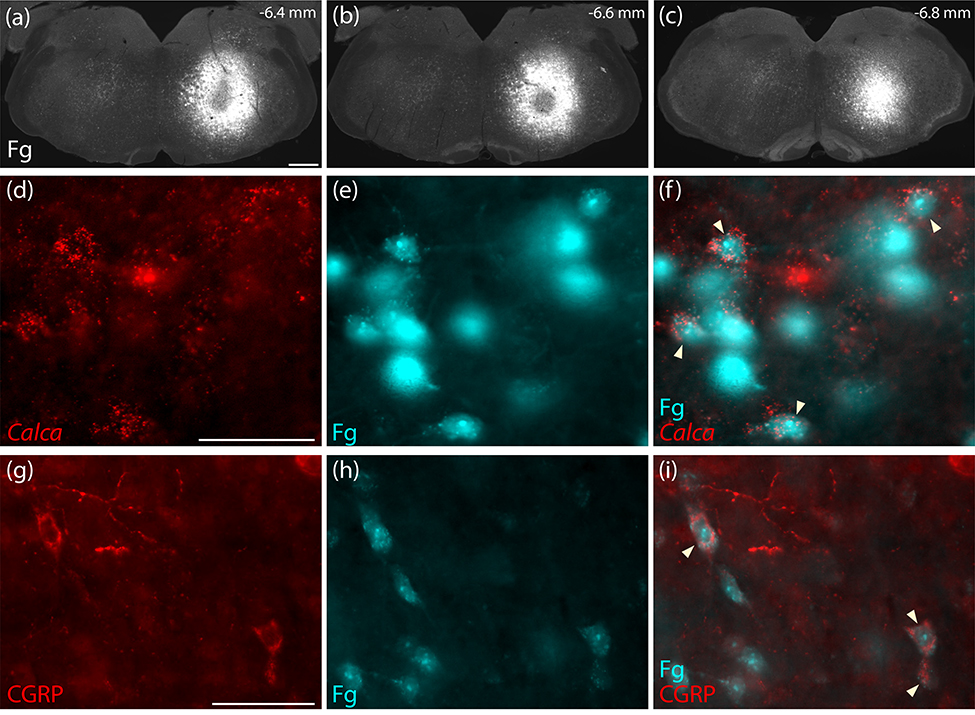
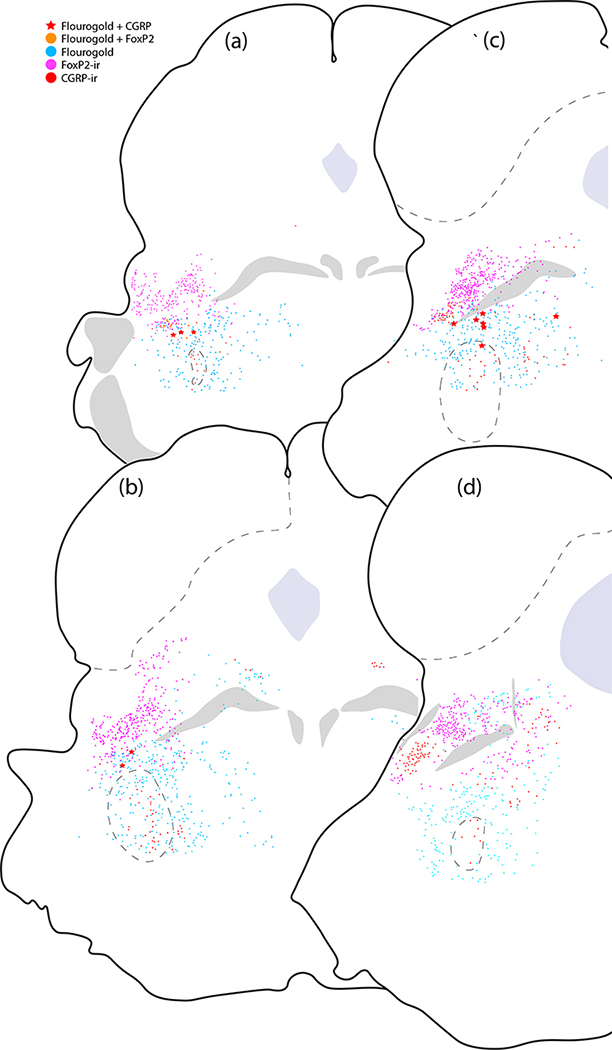
We had not expected to find any descending projections to the medulla, as previous reports using this Cre-driver strain (Chen et al., 2018) or a separate strain with tamoxifen-inducible Cre (Kaur et al., 2017) had not commented on hindbrain labeling after Cre-conditional anterograde tracing from the PB region. Lacking prior information about co-localization of Calca mRNA or CGRP and retrograde tracers after hindbrain injection, we injected Fluorogold into the medullary reticular formation at hindbrain levels containing the facial motor nucleus, nucleus ambiguus, or NTS (n=3). We then labeled Calca mRNA or CGRP in adjacent tissue sections spanning the PB region from these mice. Every case had retrogradely labeled neurons in the PB region with Calca mRNA and CGRP immunoreactivity (Figures 16). These hindbrain-projecting CGRP/Calca neurons formed a rostral subpopulation along the ventrolateral edge of the PB (Figure 17) and extended rostrally into a zone ventromedial to the KF, in which a subset of FoxP2-immunoreactive neurons was retrogradely labeled as well. No CGRP/Calca neurons in the prominent PBeL cluster were retrogradely labeled with Fluorogold. Many other neurons were retrogradely labeled in this part of the brainstem, including a large part of the reticular formation surrounding V, but these did not contain Calca mRNA or CGRP immunoreactivity.
Figure 16.
Retrograde confirmation that PB CGRP/Calca neurons project axons to the hindbrain reticular formation (a–c) Rostrocaudal extent of Fluorogold (Fg) injection into the medullary reticular formation (case 3621). This injection site was centered above to the facial motor nucleus at rostrocaudal levels between the caudal cochlear nucleus and rostral inferior olivary nucleus. (d–f) Neurons in the rostral, ventral PB contain both Calca mRNA (red in d) and Fg (ice-blue in e–f). (g–i) In the same region, CGRP immunofluorescence labeling (red, in g) co-localized with Fg (ice-blue in h-i). Scale bars are 500 μm (a) and 50 μm in (d,g) and apply to the remaining panels in each row.
Figure 17.
Plots of Fluorogold retrograde labeling across four levels of the rostral PB region. Red stars represent neurons with co-localized CGRP immunofluorescence and Fluorogold along the rostral, ventral margin of the PB. Red dots indicate the remaining majority of CGRP-immunoreactive (CGRP-ir) neurons that did not contain Fluorogold. Nearby Fluorogold-labeled neurons with FoxP2-immunoreactivity (FoxP2-ir) are indicated by orange dots, while magenta represents unlabeled FoxP2-immunoreactive neurons and ice-blue dots represent the remaining other Fluorogold-labeled neurons in this region.
Calca-expressing neurons project axons to the forebrain via the central tegmental tract.
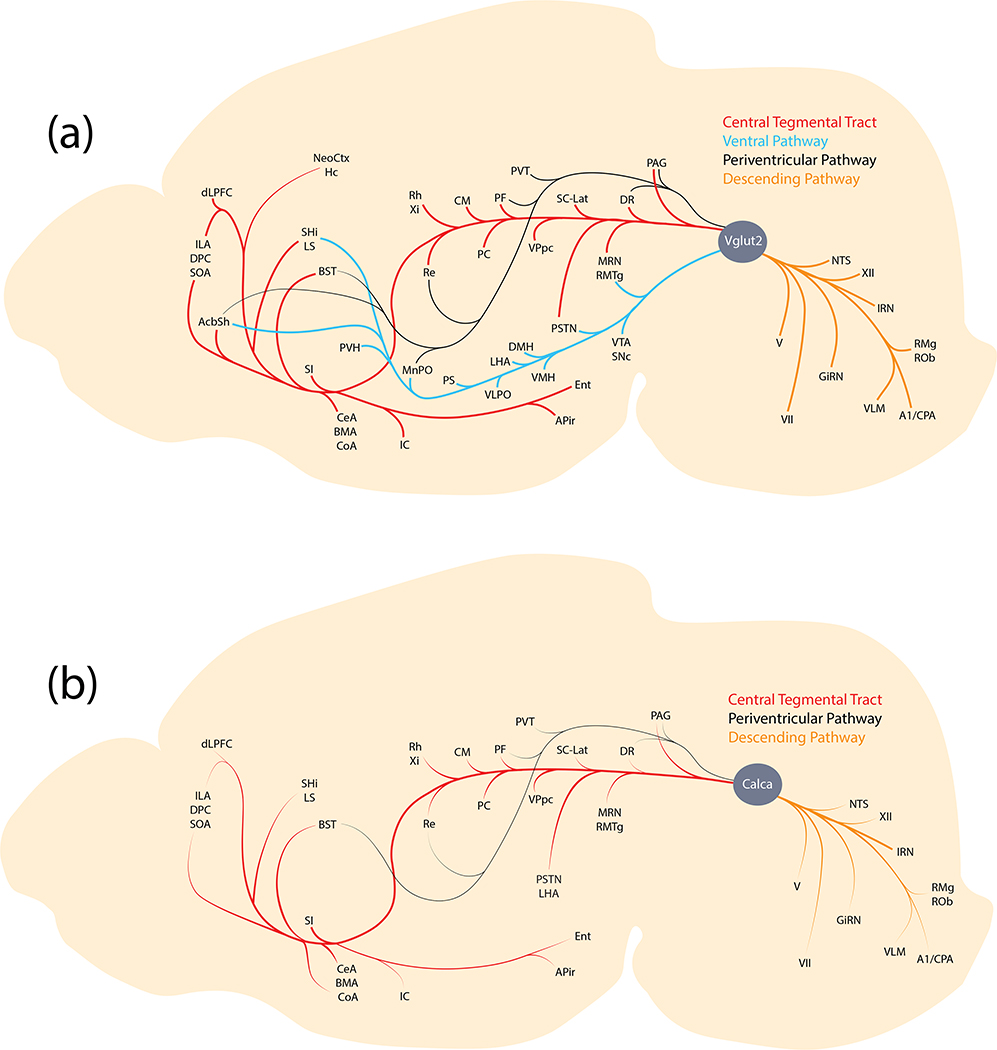
The PB sends axons through four pathways (Figure 19): a periventricular pathway, the ctt, and a ventral pathway each deliver axons to target sites in the forebrain, while a descending pathway carries PB axons to the hindbrain (Huang et al., 2020; Saper & Loewy, 1980). Calca-expressing PB neurons extend axons to the forebrain primarily through the ctt. They also project axons through the periventricular and descending pathways, but the ventral pathway contained little to no labeling. This projection pattern sharply contrasts that of Pdyn-expressing PB neurons, which project axons to the forebrain through the ventral and periventricular pathways, but not the ctt (Huang et al., 2020).
Figure 19.
Axonal pathways and efferent target sites of Calca-expressing neurons in the PB region (b), relative to the larger population of glutamatergic (Vglut2-expressing) PB neurons (a).
Complementary projection patterns of Calca- and Pdyn-expressing neurons.
Due to the mutual exclusivity of PB Calca and Pdyn expression by neurons with diverging axonal trajectories, we directly compared the efferent projection patterns in a representative case from each genotype (Calca-Cre case 1803 with Pdyn-IRES-Cre case 1812 from Huang et al., 2020). We overlaid plots of Syp-mCherry-labeled puncta from each case at brain levels containing the BST and preoptic area, hypothalamus, amygdala, thalamus, cerebral cortex, and midbrain.
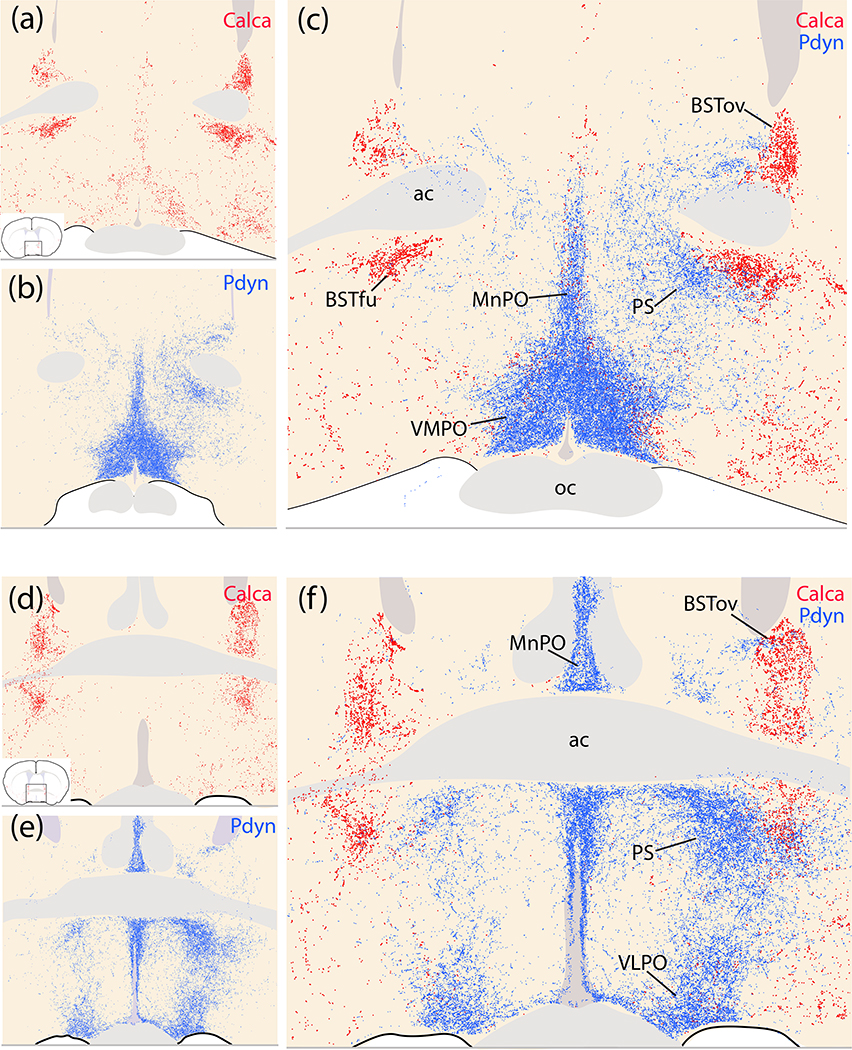
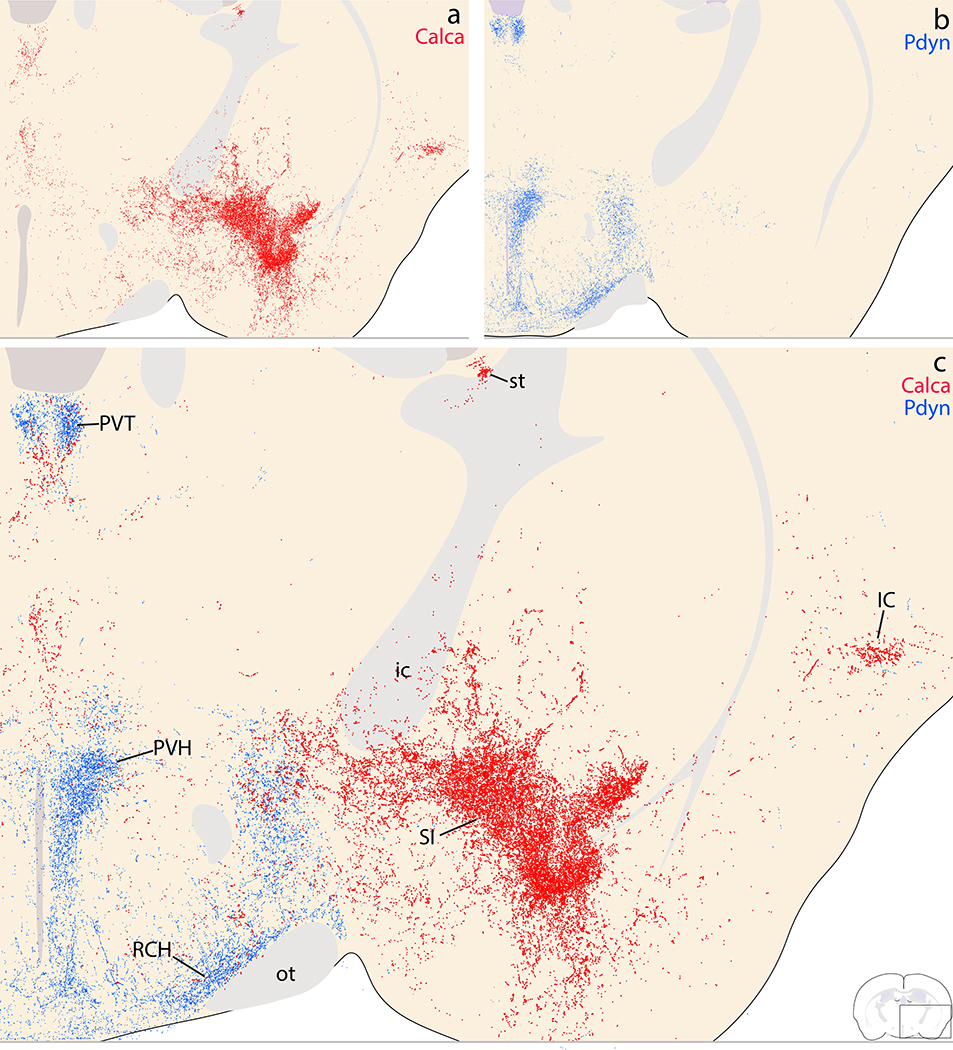
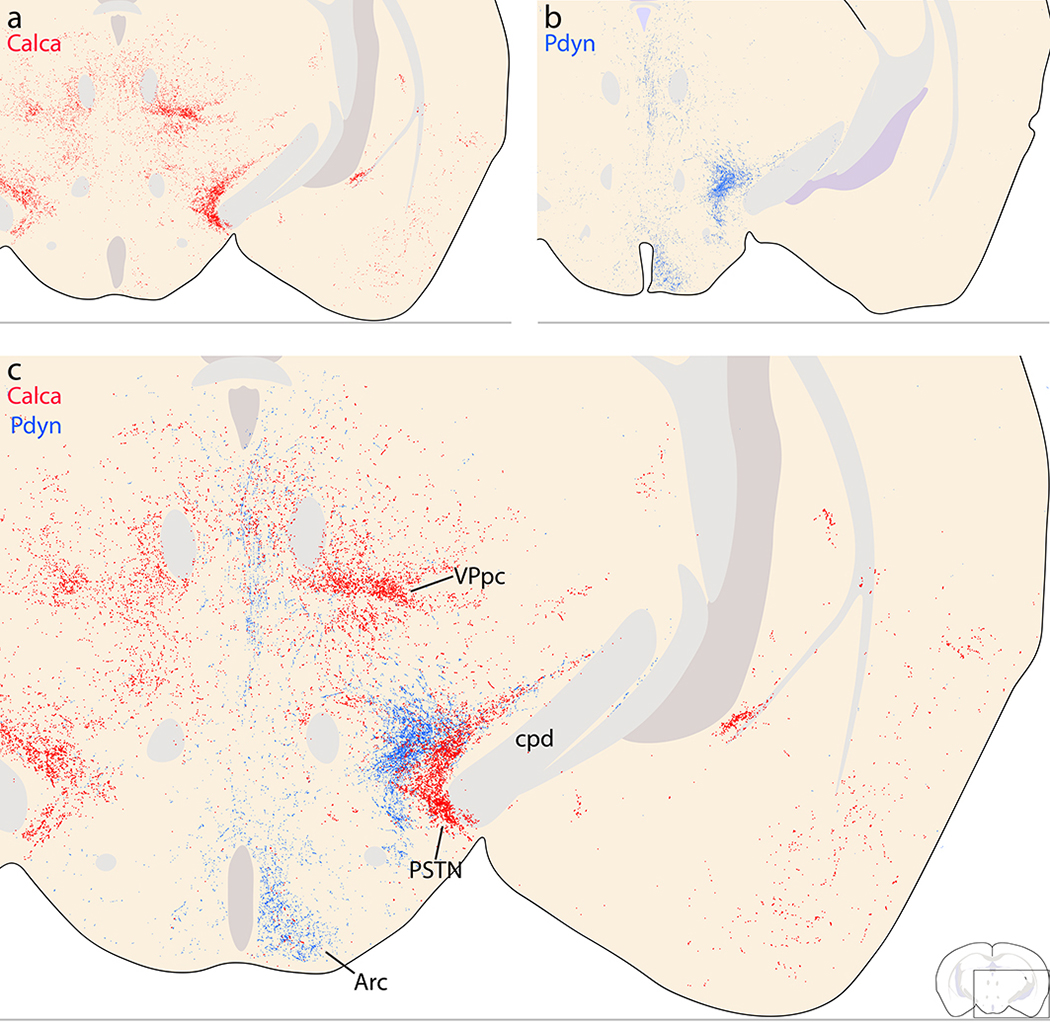
Rostrally, near the decussation of the anterior commissure, Calca boutons (red) targeted the BST (oval and fusiform subnuclei), largely avoiding the preoptic area. In contrast, Pdyn boutons (green) targeted the ventromedial, median, and ventrolateral preoptic nuclei and the parastrial nucleus (Figure 20), largely avoiding the BST. Caudal to this, contiguous Pdyn labeling targeted the paraventricular hypothalamic nucleus and retrochiasmatic area (Figure 21), where Calca labeling was largely absent. Instead, Calca boutons concentrated laterally, in the basal forebrain (NBM and SI). Less-dense labeling from both overlapped in the lateral preoptic area. Further caudally, dense Pdyn labeling filled the dorsomedial hypothalamic nucleus and lateral hypothalamic area, which contained light, scattered Calca labeling (Figure 22). In the caudal hypothalamus, dense collections of Pdyn and Calca boutons wrapped around the internal capsule and subthalamic nucleus in or near the parasubthalamic nucleus (PSTN). Calca labeling filled the PSTN along the cerebral peduncle and bordering the dorsomedial fringe of the subthalamic nucleus. Pdyn boutons complemented this distribution with very little overlap, filling a parallel zone in the LHA and zona incerta, just medial to the Calca terminal field (Figure 23).
Figure 20.
Complementary patterns of Calca (red) and Pdyn (blue) efferent projection patterns in the preoptic area and BST in Calca-Cre case 1803 and Pdyn-IRES-Cre case 01812 (Huang et al., 2020). (a,d) Calca projections target BSTov and BSTfu. (b,e) Pdyn projections minimally target the BST, and instead heavily target the median preoptic (MnPO), ventromedial preoptic (VMPO), ventrolateral preoptic (VLPO), and parastrial (PS) nuclei, as well as a dorsoventral segment of the preoptic area between the VLPO and PS. (c,f) Combined labeling.
Figure 21.
Complementary Calca (red) and Pdyn (blue) patterns in the basal forebrain, hypothalamus, rostral thalamus, and insular cortex. (a) Calca projections densely innervate the substantia innominata (SI), with lighter labeling extending dorsally into the ventral fringe of the internal capsule (ic), globus pallidus, and between the striatum and pallidum. Lateral to the SI, the insular cortex (IC) contains light labeling. Medial to the SI, the hypothalamus has very little labeling. (b) Pdyn projections densely target the paraventricular nucleus of the hypothalamus (PVH) and the retrochiasmatic area (RCA) above the optic tract. In the thalamus, Pdyn projections concentrate beneath the third ventricle, in the dorsal aspect of the paraventricular nucleus of the thalamus (PVT). (c) Combined labeling.
Figure 22.
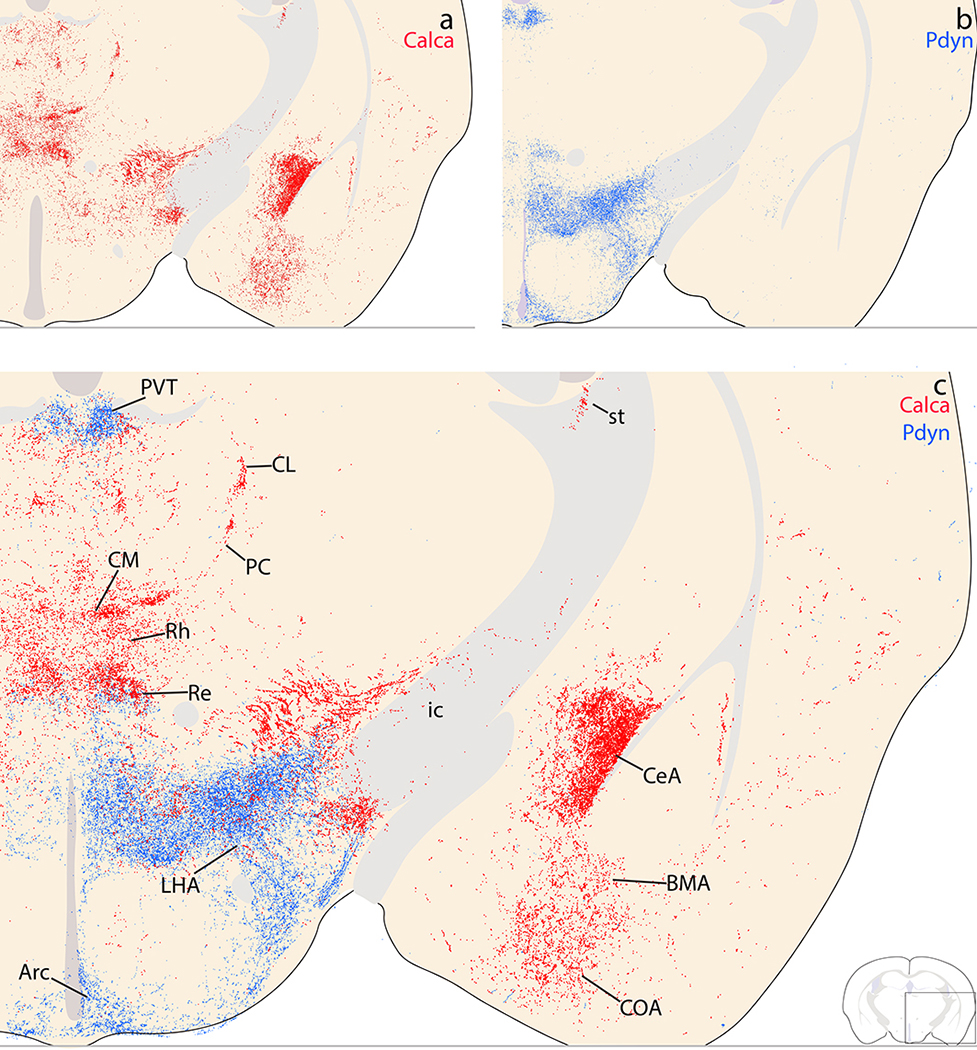
Complementary Calca (red) and Pdyn (blue) patterns in the amygdala, hypothalamus and thalamus. (a) Calca projections densely innervate the lateral and capsular subdivisions of the CeA, with lighter labeling extending ventrally through the basomedial nucleus of the amygdala (BMA) and cortical nucleus of the amygdala (CoA). Medial to the amygdala, the zona incerta and lateral hypothalamic area (LHA) contained modest labeling along the edge of the IC. In the midline and intralaminar thalamus, dense labeling extends through the central median (CM), paracentral (PC), and centrolateral (CL) nuclei, with modest labeling in the xiphoid nucleus and paramedian labeling in the reuniens and rhomboid nuclei. There is also scattered labeling dorsally, in the mediodorsal, intermediodorsal, and paraventricular thalamic nuclei. (b) Pdyn projections avoid the amygdala and the majority of the thalamus, with the exception of dense, focal patch in the PVT, plus lighter labeling in the reuniens and xiphoid nuclei ventrally. In the hypothalamus, Pdyn projections form a continuously dense terminal field covering the LHA, dorsomedial hypothalamic (DMH), posterior hypothalamic (PH) and arcuate nuclei (Arc), encircling the ventromedial hypothalamic nucleus (VMH). (c) Combined labeling.
Figure 23.
Complementary Calca (red) and Pdyn (blue) patterns in the caudal diencephalon. (a) Calca projections target the VPpc and the parasubthalamic nucleus (PSTN). The thalamic parafascicular nucleus (PF) contained light labeling, with lighter, scattered labeling in the posterior thalamic midline. (b) Pdyn projections also lightly innervate this midline region near the midbrain-diencephalic junction. Ventrally, Pdyn projections produce a moderately dense terminal field in the posterior Arc, and similar to Calca projections, also densely innervate a part of the far-lateral, caudal LHA near the cerebral peduncle. However, the combined panel (c) shows that Calca labeling wraps closely over the cerebral peduncle and subthalamic nucleus, while Pdyn labeling is offset medially, further from the cerebral peduncle.
Laterally, in the amygdala, extensive Calca boutons extended through the SI and anterior amygdalar area to form a dense terminal field in the CeA and moderate labeling ventrally, in the BMA and COA. In contrast, PB Pdyn neurons produce virtually no labeling in the amygdala (Figure 24).
Figure 24.
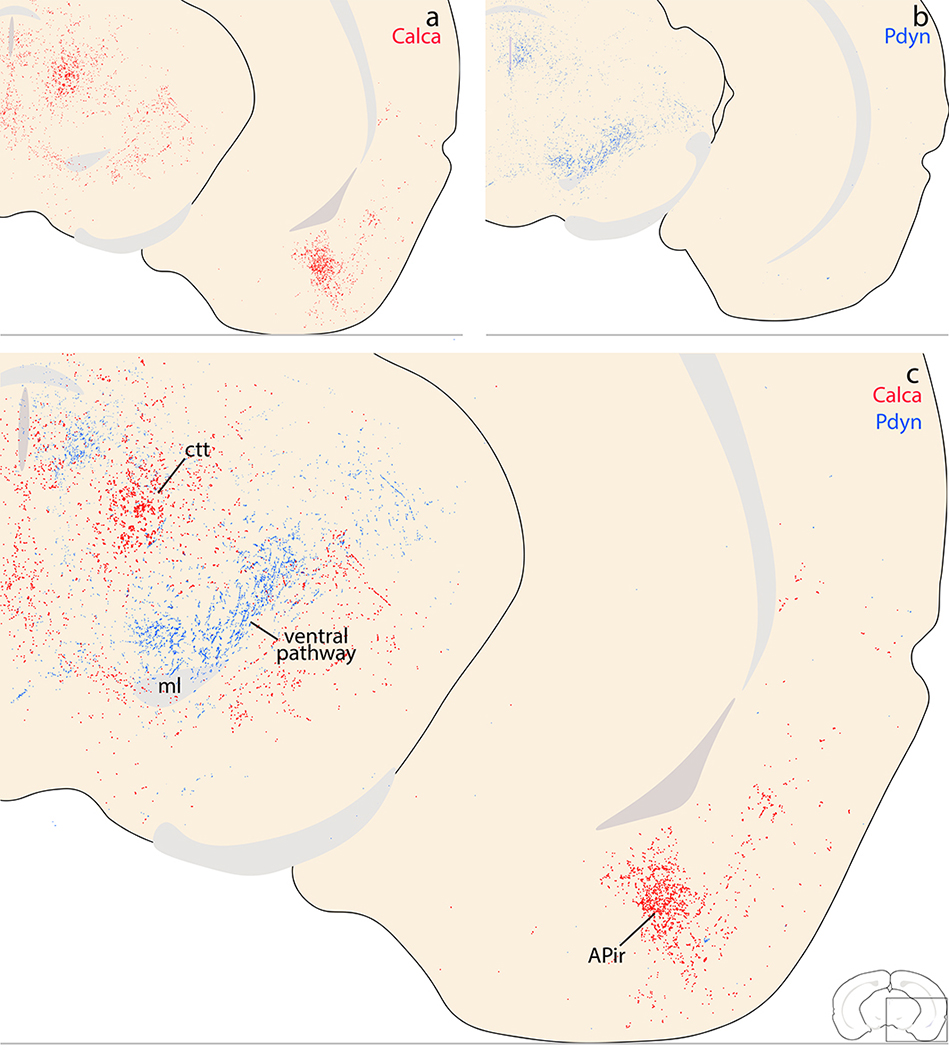
Complementary Calca (red) and Pdyn (blue) patterns in the rostral midbrain. (a) The majority of Calca axons project through the central tegmental tract (ctt), ventrolateral to the periaqueductal gray matter (PAG). Calca projections to the PAG and other midbrain regions are light and scattered, but in the ventral cerebral cortex, a moderately dense terminal field appears in the amygdalopiriform transition area (APir). (b) Pdyn axons project through and form a light terminal field along the dorsolateral fringe of the medial lemniscus (ventral pathway). (c) Combined labeling shows that Calca axons projecting through the ctt are separate from Pdyn axons projecting through the ventral pathway.
Dorsally, the thalamus received a complimentary patterns Calca and Pdyn input. The paraventricular thalamic nucleus (PVT) contained dense Pdyn labeling dorsally, up to the ventricular border, and less dense Calca labeling ventrally (Figures 16–17). In the ventral midline, the reuniens, rhomboid, and xiphoid nuclei received overlapping Calca and Pdyn input, with denser Calca labeling (Figure 22). In the remaining thalamic terminal fields, including the VPpc, CM, and PC, Calca labeling was more extensive than Pdyn, except near the midbrain-diencephalic junction, where light Pdyn labeling was more prominent in the midline (Figure 22).
In the cerebral cortex, as described above, Calca-expressing PB neurons produced a moderate terminal field in the insular cortex (Figure 21), rostral entorhinal cortex, and amygdalopiriform transition area (Figure 24). In contrast, Pdyn-expressing PB neurons produced virtually no cortical labeling.
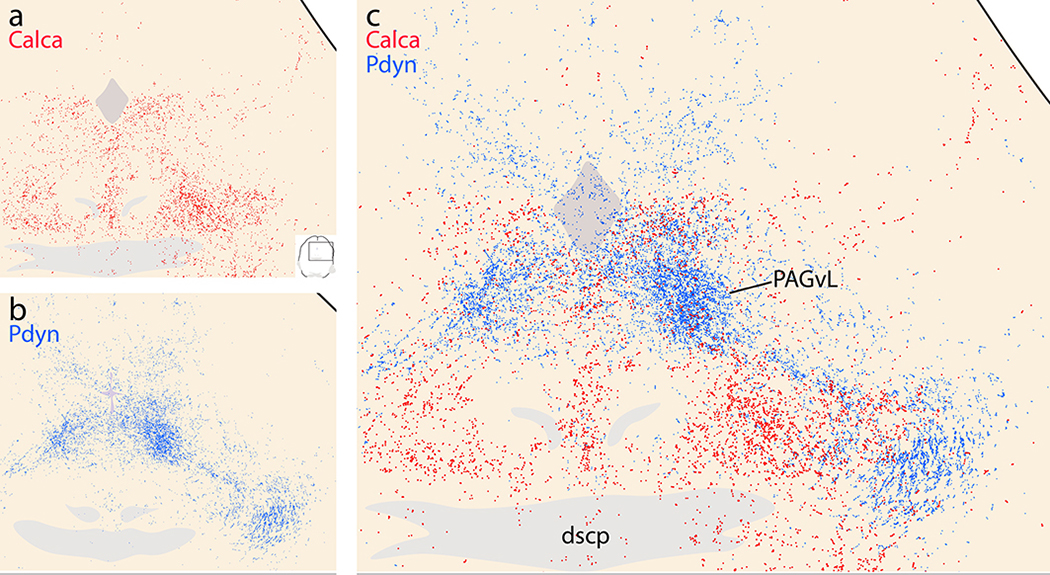
Caudally, in the midbrain, Calca axonal labeling concentrated in the ctt, while Pdyn labeling concentrated in the ventral pathway, near the medial lemniscus (Figure 24). The periventricular pathway contained less-dense labeling in both cases, intermingling through the PAG. At levels containing the decussation of the superior cerebellar peduncle, the ventrolateral PAG received a substantial Pdyn terminal field, but very few Calca boutons (Figure 25). These levels, just rostral to the PB, had dense Pdyn axonal labeling that give rise to both the periventricular pathway (axons coursing dorsomedially toward the PAG) and ventral pathway (axons coursing rostrally through the retrorubral field/A8 region). Calca axons en route to the ctt occupied a zone medial to Pdyn axons and ventrolateral to the PAG (Figure 25). Fewer Calca axons intermingled with Pdyn axons coursing dorsomedially into the periventricular pathway. We did not overlay labeling in the hindbrain, where Pdyn projections are minimal (Huang et al., 2020).
Figure 25.
Complementary Calca (red) and Pdyn (blue) projections through the central midbrain. (a) Scattered Calca (red) terminals target the lateral and ventral PAG. (b) Pdyn projections form a dense terminal field in the ventrolateral PAG subdivision, modest labeling in its dorsolateral subdivision, and lighter, scattered labeling elsewhere in the PAG. (c) Combined labeling shows that Calca and Pdyn projections form two separate bundles, with Pdyn axons and their diffuse terminal field clustering just lateral to Calca projections at this level, slightly rostral to their source neurons in the PB.
Replication experiments in heterozygous Calca-Cre mice.
Based on our results, Calca-Cre mice provide genetic access to a highly specific population of neurons, which are mutually exclusive with surrounding neurons that express Foxp2 or Pdyn. We also showed that the distribution of neurons expressing a Cre-conditional construct in these mice matches the distribution of neurons in the PB region that contain Calca mRNA and CGRP immunoreactivity. However, our tracing results included some unexpected findings, including transduction of LC neurons and other populations outside PBeL, despite injection volumes smaller than those used in previous reports (Chen et al., 2018; Kaur et al., 2017). We suspect that these novel observations followed from a more sensitive and specific method of labeling Syp-mCherry (NiDAB immunohistochemistry). Alternatively, our transduction efficiency may have been improved by performing AAV injections in homozygous mice, which may transcribe two Calca-Cre alleles per Calca neuron, rather than one in heterozygotes.
We therefore repeated our experiments by stereotaxically injecting the same volume (40 nL) of the same AAV (AAV8-hEf1a-DIO-synaptophysin(Syp)-mCherry) in heterozygous Calca-Cre mice (n=3). These injections again transduced neurons in and around the PB, in distributions similar to those in cases described above. One injection (case 4181) transduced neurons predominantly in PBeL, but also in the overlying molecular layer of the cerebellum and in the medial PB, similar to cases 1809 and 1803, respectively. Another (case 4179) was more extensive, covering PBeL plus many neurons in the medial PB, plus some in the supratrigeminal region (similar to case 1803) and overlying cerebellum (similar to case 1809). Yet another (case 4182) was ventromedial to the PB (similar to case 1800), transducing neurons primarily in the ventral LC, reticular formation, supratrigeminal region, and motor trigeminal nucleus, with fewer labeled neurons along the ventral fringe of the PB, and none in PBeL. The patterns of Syp-mCherry labeling in these cases were indistinguishable from those in homozygous cases with similar injection sites.
In the hindbrain, each case had a pattern of labeling that was similar to the homozygous cases described above, as exemplified by a side-by-side comparison of Syp-mCherry labeling between homozygous case 1803 and heterozygous case 4179 (Figure 18). The primary difference between these two cases was the Syp-mCherry labeling density in the hypoglossal motor nucleus (XII), which was moderate in 1803, but light in 4179. Thus, the neuronal transduction and anterograde labeling we described above are not unique to homozygotes, and instead represent repeatable and consistent findings after small injections into the PB region of Calca-Cre mice.
Discussion
CGRP neurons are a prominent component of several nuclei in and around the PB. The locus coeruleus, motor trigeminal nucleus, supratrigeminal region, and PB all contain neurons with prominent Calca expression and CGRP immunoreactivity. Among these, we found strong Oprm1 expression in glutamatergic Calca-expressing neurons in the PB, modest Oprm1 expression in catecholaminergic Calca-expressing neurons in the LC, and little to no Oprm1 expression by cholinergic neurons in the trigeminal motor nucleus. With this improved understanding of the Calca/CGRP distribution, we used a synaptically targeted tracer to analyze the efferent projections of Calca-expressing neurons in this region. In addition to their known output projections to regions including the basal forebrain and amygdala, we identified new brain regions that receive substantial input from CGRP neurons, including the APir, hindbrain reticular formation, and cranial motor nuclei. Superimposing Calca and Pdyn axonal labeling revealed vastly different projection patterns, providing further evidence that the genetic identity of PB neurons determines their axonal trajectories and synaptic targets. After discussing limitations of our approach, we compare these results with previous neuroanatomical literature and highlight several new functional implications.
Limitations.
Cre-conditional expression of synaptophysin-mCherry provides several advantages over previous anterograde tracing techniques. Unlike tracers that distribute uniformly throughout the axoplasm, Syp-mCherry concentrates in presynaptic terminals, highlighting them more than axon shafts. To reach the presynaptic terminal, Syp-mCherry must traffic down the shaft, which results in some labeling in non-synaptic portions of the axon. This light axonal labeling provided an unexpected advantage by allowing us to visualize the separate pathways followed by axonal projections from each PB cell type (Figures 19, 24, and 25). However, even when Syp-mCherry-labeling conforms to the distinct morphology of a presynaptic bouton, learning whether that bouton forms a structural synapse requires immunoelectron microscopy (Wouterlood & Jorritsma-Byham, 1993) and confirming the presence of functional synapses requires patch-clamp electrophysiology (Petreanu, Huber, Sobczyk, & Svoboda, 2007), neither of which is practical at the scale of our study.
To measure bouton density, we used a semi-quantitative scale (Figure 11). This method holds a degree of subjectivity, especially when comparing a large zone with dispersed labeling to a smaller terminal field. To mitigate this, we referenced a consistent labeling standard (Figure 11) for all regions in all cases. Our ratings therefore reflect the density of labeling and not the size of the region. In the future, combining the output of our BoutonCount algorithm with semi-automated methods for atlas alignment and segmentation should allow a more fine-grained approximation and comparison of total bouton counts across regions.
Another important consideration is the specificity of our histologic techniques for labeling Calca and CGRP. Individually, mRNA probes and antisera have potential mechanisms of non-specificity. To mitigate this concern, we labeled and compared both the mRNA and the peptide it encodes. Other than expected labeling of axons by CGRP antisera, these two complementary techniques labeled identical cellular distributions in the PB region. As an additional test for the specificity of our two, commercially available CGRP antisera, we repeated both labeling techniques in homozygous Calca-Cre mice as a knockout control, where the Cre:GFP knockin in exon 2 eliminates their ability to produce CGRP (Chen et al., 2018). Similarly, and in contrast to both wild-type and heterozygous mice, we found no Calca mRNA labeling in these homozygous Calca-Cre mice (not shown). Further, we compared endogenous mRNA and neuropeptide labeling to the expression of a Cre-conditional, double-inversion-orientation construct. The distribution of neurons with Cre-conditional expression of Syp-mCherry matched the patterns of in situ hybridization for endogenous Calca mRNA and antibody labeling for endogenous CGRP. The one exception in some cases was the labeling of neurons in the cerebellar molecular layer, where we did not find Calca mRNA labeling or CGRP immunoreactivity (using two different, commercially available antisera). Labeling in the rat cerebellum was reported after radioactive in situ hybridization (Amara et al., 1985), and immunoreactivity was reported using other CGRP antisera without a knockout-mouse control for labeling specificity (Edvinsson, Eftekhari, Salvatore, & Warfvinge, 2011; Warfvinge & Edvinsson, 2019), but the immunoreactivity in those reports was in Purkinje cells. No Purkinje neurons were transduced in any of our cases, so this discrepancy either reflects a species difference between rats and mice or simply off-target antibody binding. Overall, while Calca expression in the cerebellum appears minimal, the Cre-conditional transduction of neurons here indicates that a subset did transcribe Cre from the Calca gene locus sometime between AAV injection and mouse perfusion.
Finally, it is important to consider the sensitivity and selectivity of our recombinase-conditional targeting strategy. We used exclusively knockin-Cre mice, so the expression of our Cre-conditional construct (DIO-Syp-mCherry) selectively identified cells that expressed Cre from the endogenous locus. We performed all experiments in adult mice, so the results reflect adult expression (between the time of AAV injection and mouse perfusion), not developmental transcription, which may be more widespread. That said, it is important to note that Cre-conditional expression reduces what may be widely ranging levels of gene expression in different cells to a binary read-out. Following Cre-mediated flip/excision, the amount of tracer or reporter is set by the construct’s promoter (here, EF1a), not the endogenous Cre-driver locus. Thus, relative to a cell with low or intermittent Calca (and therefore Cre) transcription, a cell with higher expression may be more likely to activate a DIO construct, but once that construct is live, the amount of Syp-mCherry production in both cells would be similar. This consideration explains why neuronal subpopulations with widely ranging levels of Calca mRNA can exhibit similarly prominent Syp-mCherry labeling. It may also explain the discrepancy between our inability to detect histologic labeling for CGRP or Calca mRNA despite our observation of Cre-conditional expression of Syp-mCherry in a subset of cerebellar neurons in some cases.
Comparison with previous literature.
Multiple studies have reported Calca expression or CGRP immunolabeling in the PB, V, and surrounding nuclei in rats or mice (Amara et al., 1985; Kawai et al., 1985; Kruger, Mantyh, Sternini, Brecha, & Mantyh, 1988; Kruger, Sternini, Brecha, & Mantyh, 1988; Palmiter, 2018; Rethelyi, Metz, & Lund, 1989; Rethelyi, Mohapatra, Metz, Petrusz, & Lund, 1991; Skofitsch & Jacobowitz, 1985a, 1985b; Sugimoto, Fujiyoshi, Xiao, He, & Ichikawa, 1997; van Rossum, Hanisch, & Quirion, 1997; Yasui, Saper, & Cechetto, 1989). Remarkably, despite evidence here that CGRP and Calca mRNA are just as prominent in the mouse LC, we are not aware of any published reports emphasizing Calca expression in LC neurons. We found identical patterns of Calca mRNA labeling and CGRP immunolabeling in the LC, with the specificity of these findings confirmed by an absence of both in homozygous Calca-Cre mice, which cannot produce CGRP (Chen et al., 2018). LC catecholaminergic neurons were transduced in all Calca-Cre mice with an injection site overlapping any part of the LC. We are not aware of any published evidence comparing CGRP and Calca expression in these neurons or showing Calca-Cre conditional expression in the LC, though CGRP immunofluorescence labeling was evident in prior images that included the mouse LC (Figure S7E of Resch et al., 2017), and the LC clearly contains Calca mRNA in images of in situ hybridization in the Allen Brain Atlas (Lein et al., 2007). It is unclear whether LC neurons contain CGRP/Calca in other species, though the results of one previous study included CGRP-like immunoreactivity in the human LC (Tajti, Uddman, & Edvinsson, 2001).
Similarly, we are not aware of any previous work co-localizing Oprm1 and Calca expression. The presence of mu opioid receptors in the LC and lateral PB was established long ago by a convergence of autoradiographic labeling, immunohistochemistry, in situ hybridization, and ex vivo electrophysiology (Atweh & Kuhar, 1977; Bunzow et al., 1995; Chamberlin et al., 1999; Christie & North, 1988; Ding, Kaneko, Nomura, & Mizuno, 1996; Herkenham & Pert, 1980, 1982; Korf, Bunney, & Aghajanian, 1974; Mansour, Fox, Burke, et al., 1994; Mansour, Fox, Thompson, Akil, & Watson, 1994; Pert, Kuhar, & Snyder, 1976; Quirion, Zajac, Morgat, & Roques, 1983; Williams, Egan, & North, 1982; Wolinsky et al., 1996). Our observation that Calca-expressing PBeL neurons contain the most prominent Oprm1 mRNA labeling in this region fits a previous claim that the lateral PB contains the densest mu opioid receptor binding in the entire brainstem (Wolinsky et al., 1996). The unusually high expression of this receptor by PBeL CGRP/Calca neurons may help explain several behavioral and autonomic effects of opioid-narcotic drugs (discussed below).
Comparison with previous neuroanatomical tracing studies.
Our results confirm that the Calca-expressing subpopulation of glutamatergic PB neurons project axons to a limited subset of the brain regions targeted by glutamatergic PB neurons overall (Huang et al., 2020). Our findings are largely consistent with previous results in mice (Chen et al., 2018) and with earlier studies that combined retrograde axonal tracing and CGRP immunofluorescence labeling in rats.
Across these studies, the most well-characterized efferent target of Calca-expressing PB neurons was the CeA. Heavy axonal projections from PBm and PBeL to the CeA were identified in a variety of studies using anterograde and retrograde tracers in rats (Bernard et al., 1993; Bienkowski & Rinaman, 2013; Fulwiler & Saper, 1984; Geerling & Loewy, 2006; Norgren, 1976; Saper & Loewy, 1980). After discovering CGRP-immunoreactive neurons in the PB and CGRP-immunoreactive axon terminals in the CeA, several investigators used retrograde axonal tracing to confirm that a large subset of the PB neurons with direct axonal projections to the CeA contain CGRP (D’Hanis, Linke, & Yilmazer-Hanke, 2007; Kawai et al., 1985; Schwaber et al., 1988; Yamano et al., 1988; Yasui et al., 1989). Anterograde axonal tracer injections into the PB then revealed topographically organized projections from the PB to the amygdala, with lateral injections (in PBeL) labeling axons in the lateral and capsular CeA, and medial injections (in PBm) labeling axons primarily in the medial CeA (Bernard et al., 1993; Karimnamazi & Travers, 1998). Our results indicate that this lateral-to-medial topography holds true not just for PB neurons overall, but also for Calca-expressing neurons, which do not project axons exclusively to the lateral and capsular CeA. It is unclear if this topography represents a gradual transition from Calca-expressing neurons in PBm (which project medially) through PBeL (which project laterally), or if two discrete subpopulations of Calca neurons target separate CeA subdivisions. Until a genetic marker is found to distinguish a medial or lateral subpopulation, investigators should be aware that experiments targeting Calca-expressing neurons in this region will likely include neurons in both PBm and PBeL, with axonal projections targeting all CeA subdivisions.
Another well-studied PB efferent target is the BST. We confirmed that Calca-expressing neurons in PBeL project heavily to the anterior-lateral BST subdivision (Chen et al., 2018). In contrast, we found that Calca-expressing neurons located medially, in PBm, provide minimal input to the BST. Calca axonal projections from PBeL formed two terminal fields in the BST: one in the oval subnucleus, dorsal to the anterior commissure, and the other in the fusiform subnucleus, in the ventrolateral BST beneath the anterior commissure (Ju & Swanson, 1989). Like CGRP immunolabeling and the overall projections of glutamatergic neurons in the lateral PB (Huang et al., 2020), labeled axons and boutons formed dense, pericellular rings in BSTov, while those ventral to the commissure formed a grainy cluster. This dichotomous morphology suggests that each terminal field arises from a separate subpopulation of PB Calca neurons with a separate function. BST neurons in both these target regions interconnect heavily with the CeA (Dong, Petrovich, & Swanson, 2001; Dong, Petrovich, Watts, & Swanson, 2001). This interconnectivity, along with other shared features (Geerling & Loewy, 2006; McDonald, 1982, 1983; Roberts, Woodhams, Polak, & Crow, 1982; Schwaber, Kapp, Higgins, & Rapp, 1982; Shin, Geerling, & Loewy, 2008; Woodhams, Roberts, Polak, & Crow, 1983), led some to refer to the BST and CeA (plus a region of the substantia innominata between them) as the “extended amygdala” (Alheid & Heimer, 1988). Supporting this concept, the pericellular Syp-mCherry-labeled rings in BSTov are strikingly similar to those in the capsular and lateral CeA subdivisions (Geerling & Loewy, 2006; Huang et al., 2020). Our findings complement previous tracing results in rats, where injecting the dorsal BST or the lateral CeA produced identical patterns of retrograde labeling, primarily in PBeL (Moga et al., 1990).
Tracer injections into the substantia innominata (between the BST and CeA) produced a similar retrograde pattern, plus additional neurons in PBm (Moga et al., 1990). Complementary tracer injections into PBeL and PBm produced anterograde axonal labeling in the BST and substantia innominata (Alden et al., 1994; Bernard et al., 1993), and CGRP-immunoreactive axons in these sites were shown to originate from the PB in rats (Chang & Kuo, 1989; Knyihar-Csillik et al., 1999; Schwaber et al., 1988). Our results confirm this PB-to-SI connection, similar to Cre-conditional axonal labeling in a separate strain of mice with tamoxifen-inducible Cre knocked into the Calca locus (Kaur et al., 2017).
Another major region targeted by PB Calca neurons is the thalamus. In rats and mice, the PB sends dense projections to several thalamic nuclei, most prominently the VPpc (Bester et al., 1999; Chen et al., 2018; Huang et al., 2020; Karimnamazi & Travers, 1998; Krout & Loewy, 2000; Yasui et al., 1989). Our results indicate that the thalamic axons of PB Calca-expressing neurons – especially those that produce large boutons in the lateral aspect of the contralateral VPpc – arise largely from the PBm. This conclusion complements previous retrograde tracing data in mice (Tokita, Inoue, & Boughter, 2010) and suggests a medial-to-lateral topography that is the converse of Calca projections to the BST and CeA, which arise primarily from PBeL. Other thalamic nuclei receive moderate input from the PB. In rats, tracer injections in a variety of midline and intralaminar nuclei (including PVT, IMD, Re, Rh, CM, PC, and PF) produced retrograde labeling in various PB subnuclei (Fulwiler & Saper, 1984; Krout & Loewy, 2000), and small anterograde tracer injections into these PB subregions produced complementary patterns of axonal labeling in the thalamus (Bester et al., 1999). Our results show that Calca-expressing PB neurons project axons to a subset of these thalamic nuclei, primarily the Re, Rh, CM, PC, and PF. One target, the PC, was claimed to receive axons exclusively from the internal lateral PB (Bester et al., 1999; Fulwiler & Saper, 1984; Krout & Loewy, 2000). The internal lateral subnucleus contained no Calca mRNA, CGRP-immunoreactivity, or Syp-mCherry neuronal transduction, yet the thalamic labeling in our tracing cases included moderate axonal projections to the PC, which formed large boutons, similar to our description of glutamatergic PB projections to the same thalamic region (Huang et al., 2020). While it is possible that this represents a PBm projection to the oval paracentral subnucleus (OPC; Krout & Loewy, 2000), we did not identify an OPC cluster in mice, and Syp-mCherry labeling in these large bouton clusters formed an extensive streak through the CM and PC, up into the CL in some cases. Thus, a portion of the PB projection to the PC intralaminar thalamic nucleus arises from Calca-expressing neurons, not just from the internal lateral subnucleus.
Next, the cerebral cortex receives a modest, focal input. Separate from the more extensive axonal projections of LC neurons throughout the cerebral cortex, most cortical labeling in Calca-Cre cases without LC contamination concentrated in two regions: the insular cortex and the amygdalopiriform transition area (APir). Multiple studies in mice and rats have described axonal projections from the PB to the insular cortex (Chen et al., 2018; Grady et al., 2020; Lasiter, Glanzman, & Mensah, 1982; Saper & Loewy, 1980; Yasui et al., 1985; Yasui et al., 1989), but the APir has received little attention (Huang et al., 2020; Santiago & Shammah-Lagnado, 2005). Retrograde tracing in rats (Santiago & Shammah-Lagnado, 2005; Figure 6) indicated that axonal projections to APir originate from the caudal PB (PBm, PBwa, and the caudal reaches of PBeL), not from the outer PBeL, which contains the plurality of CGRP neurons here. Our findings support this observation, as an injection that transduced neurons only in the lateral PB (case 1809) produced no labeling in APir, while progressively more medial injections (cases 1808, 1803, 1807, and 1802) produced progressively denser labeling in this transition cortex. Along with the aforementioned topographical projections to BST/CeA and to VPpc, this medial-to-lateral variation further indicates that Calca-expressing PB neurons form either a topographical gradient or distinct medial and lateral subpopulations.
We also found, unexpectedly, that Calca-expressing neurons at the rostral, ventral margin of the PB send a substantial efferent projection to the hindbrain. Calca-expressing neurons in the PB region target primarily the reticular formation and cranial motor nuclei VII and XII, with more diffuse projections to the spinal trigeminal nucleus, nucleus of the solitary tract, and other hindbrain targets. Previous tracing and lesion studies identified projections from the PB or KF to targets in the hindbrain and spinal cord (Fulwiler & Saper, 1984; Geerling, Yokota, Rukhadze, Roe, & Chamberlin, 2017; Herbert et al., 1990; Huang et al., 2020; Y. Q. Li, Takada, & Mizuno, 1993; Saper & Loewy, 1980; Takada et al., 1984; Takeuchi, Uemura, Matsuda, Matsushima, & Mizuno, 1980; Travers & Norgren, 1983; Yoshida et al., 1997), but we are not aware of any previous work identifying CGRP/Calca-expressing neurons as a source of these descending projections. It remains unclear whether to designate the rostral-ventral subpopulation of Calca-expressing neurons as part of the PB proper. Neurons spanning the supratrigeminal region and ventral PBm have been shown to project heavily to V, VII, and XII in past tracing studies (Hattox, Priest, & Keller, 2002; Travers & Norgren, 1983). Our anterograde and retrograde tracing results confirm that Calca-expressing neurons located between the medial PB, KF, and supratrigeminal region supply a subset of the overall glutamatergic projections from the PB region to the hindbrain, substantially more than the hindbrain projections of Pdyn- or Foxp2-expressing PB neurons (Huang et al., 2020). Nonetheless, the descending projections labeled in our Calca cases were less extensive than the overall glutamatergic projections from the PB region. Additional work is needed to determine which other neuronal subpopulations contribute the remainder of glutamatergic axonal projections from the PB to the hindbrain.
CGRP and mu opioid receptors in LC and PB: functional implications.
Calca-expressing neurons are implicated in multiple functions. These range from forming conditioned taste aversions (Carter et al., 2015) to inhibiting appetite (Carter et al., 2013) and more (Campos et al., 2018; Kaur et al., 2017). The importance of PB neurons for conditioned taste aversion was apparent from evidence in rats that included c-Fos activation (Sakai & Yamamoto, 1997; Yamamoto et al., 1992) and lesion studies (Aguero, Arnedo, Gallo, & Puerto, 1993a, 1993b; Yamamoto, Fujimoto, Shimura, & Sakai, 1995). Here, we confirm previous reports that a plurality of PB neurons with CGRP and Calca expression cluster in the outer portion of PBeL and project their axons to forebrain regions implicated in earlier lesion studies of conditioned taste aversion in rats, including the amygdala and insular cortex (Schafe & Bernstein, 1996, 1998; Yamamoto et al., 1995).
We also found prominent CGRP and Calca expression outside PBeL, particularly in the LC. It is unclear whether these more broadly distributed Calca neurons are related, functionally, to Calca-expressing neurons in PBeL. Learning that LC neurons express Calca and produce CGRP in mice raises the possibility that some functions ascribed to Calca-expressing PB neurons (Campos et al., 2018; Kaur et al., 2017) may involve LC neurons or other Calca-expressing neurons between the LC and PBeL. For example, hypercapnia, paw or tail pinch, subcutaneous shocks, and tail heating all robustly excite LC neurons (Cedarbaum & Aghajanian, 1978; Elam, Svensson, & Thoren, 1986; Elam, Yao, Thoren, & Svensson, 1981; Korf et al., 1974), and these same stimuli were reported to activate or exert behavioral effects via Calca-expressing neurons in the PB region (Campos et al., 2018; Kaur et al., 2017; Yokota, Kaur, VanderHorst, Saper, & Chamberlin, 2015). Previous studies included images of the PB without information about the presence or absence of neuronal transduction in the LC, or between it and PBeL (Campos et al., 2018; Kaur et al., 2017). While it is possible that AAVs in these prior experiments did not spread into the LC, injection volumes were up to 10× more than ours (150–500 nL, relative to 40 nL here), and ours transduced neurons outside PBeL in every case. An intersectional targeting strategy combining Calca with Slc17a6 (to target PB and exclude LC neurons) or with Dbh, Th, or Net (to target LC and exclude PB neurons) would help distinguish which functions ascribed to CGRP/Calca neurons in this region are mediated by the PB versus LC.
This raises the question, why do LC neurons produce CGRP? LC neurons receive heavy, excitatory input from C1 neurons in the ventrolateral medulla (Abbott et al., 2012; Aston-Jones, Ennis, Pieribone, Nickell, & Shipley, 1986), which signal pain, hypoxia, hypotension, and hypoglycemia (Guyenet et al., 2013; Hirooka, Polson, Potts, & Dampney, 1997; Morrison & Reis, 1989; M. K. Sun & Reis, 1996). LC neurons also receive descending input from limbic forebrain regions, including the medial prefrontal cortex (Jodo, Chiang, & Aston-Jones, 1998). In turn, LC neurons project axons that branch extensively and, in aggregate, reach the entire cerebral cortex, subcortical structures, the brainstem, and the spinal cord (Chandler et al., 2019; P. Levitt & Moore, 1978; Ungerstedt, 1971). LC axons form diffuse, non-synaptic boutons that are thought to release norepinephrine in a paracrine manner, rather than synaptically (Beaudet & Descarries, 1978; Rajaofetra et al., 1992; Seguela, Watkins, Geffard, & Descarries, 1990). One proposed function of this profuse projection system is to increase cerebral blood flow (Guyenet et al., 2013; Toussay, Basu, Lacoste, & Hamel, 2013), so it is worth noting that CGRP is an incredibly potent vasodilator (Brain et al., 1985; Fisher et al., 1983; Greenberg, Rhoden, & Barnes, 1987; Jansen et al., 1986). Exposure to CGRP promptly dilates cerebral arteries, including pial arteries in the human cerebral cortex (Hanko, Hardebo, Kahrstrom, Owman, & Sundler, 1985). Thus, we predict that LC axons increase cerebral (and spinal) blood flow by releasing CGRP. Neuropeptide release may occur at higher spike rates than small-molecule transmitters (Schone, Apergis-Schoute, Sakurai, Adamantidis, & Burdakov, 2014), so while normal fluctuations in spiking activity release graded amounts of the primary LC neurotransmitter, norepinephrine (Berridge & Abercrombie, 1999), CGRP release may occur after unusually high LC activity in response to severe stressors. The extensive plexus of LC axons (with axonal CGRP immunoreactivity; not shown) throughout layer 1 of the cerebral cortex, where pial arteries enter the brain, provides an optimal location for controlling cerebral vasodilation. CGRP also may enhance presynaptic glutamate release in the insular and medial prefrontal cortex (X. H. Li, Matsuura, Liu, Xue, & Zhuo, 2019; Liu et al., 2020), and it will be important to determine whether this effect derives from paracrine or synaptic release and whether it occurs after endogenous CGRP release from the cortically projecting axons of PB or LC axons.
CGRP release from LC axons may also help explain this neuropeptide’s role in neurogenic vasodilatation during migraine headaches. This is thought to involve CGRP release from trigeminal sensory axons that run along blood vessels in the dura mater (Russell, King, Smillie, Kodji, & Brain, 2014), but could also involve pial arteries, which have similar sensory innervation (Edvinsson, Haanes, Warfvinge, & Krause, 2018). Upon entering the brain, these arteries pass through a thicket of superficial LC axons throughout the cerebral cortex (B. E. Jones & Moore, 1977), which are well-positioned to effect CGRP-mediated vasodilatation in response to elevated LC spiking activity. Stress is a well-known trigger for migraine headaches, and we propose that stress-associated activation of LC neurons may provoke or contribute to migraine pathophysiology by releasing CGRP and increasing cerebral vasodilatation.
Beyond migraine pathophysiology, CGRP has been implicated more generally in nociception (Oku et al., 1987; R. Q. Sun, Lawand, Lin, & Willis, 2004; Zhang et al., 2001), and the LC is thought to play a major role in modulating nociceptive signalling (Brightwell & Taylor, 2009; Hickey et al., 2014; Hirschberg, Li, Randall, Kremer, & Pickering, 2017). Output projections to the cerebral cortex and spinal cord arise from dorsal and ventral aspects of the LC, respectively (Y. Li et al., 2016). Dorsal LC projections to the forebrain may exert hyperalgesic effects, while ventral LC projections to the spinal cord are thought to be analgesic (Hirschberg et al., 2017; S. L. Jones & Gebhart, 1986; Segal & Sandberg, 1977). Learning that LC neurons produce CGRP suggests that it may play a role in one or both of these pain-modulatory systems. We confirmed that LC neurons also express Oprm1, consistent with prior evidence that opioid effects on pain signalling may involve LC neurons. Mu opioid receptor agonists hyperpolarize (inhibit) LC neurons (Aghajanian & Wang, 1987; Williams et al., 1982; Williams, North, & Tokimasa, 1988). Conversely, the mu antagonist naloxone precipitates acute opioid withdrawal symptoms and hyperactivity of LC neurons (Aghajanian, 1978; Akaoka & Aston-Jones, 1991; Rasmussen & Aghajanian, 1989; Rasmussen, Beitner-Johnson, Krystal, Aghajanian, & Nestler, 1990). Given the varied evidence for hyperalgesic and analgesic effects, along with changes in cerebral blood flow, attention, arousal, and more, the net effects of mu opioid inhibition of LC neurons remain unclear.
More than in the LC, we found surprisingly strong Oprm1 expression in PBeL, particularly in Calca-expressing neurons. Activating the mu opioid receptor potently inhibits neurons in the lateral PB (Christie & North, 1988). Given this, and the extensive evidence that CGRP/Calca neurons relay aversive sensations (Campos et al., 2017; Campos et al., 2018; Carter et al., 2015; Chen et al., 2018; Han et al., 2015; Kaur et al., 2017; Saper, 2016; Yamamoto et al., 1995; Yamamoto et al., 1992; Yamamoto, Shimura, Sako, Yasoshima, & Sakai, 1994; Yokota et al., 2015), we predict that a major way that mu opioid agonists produce their therapeutic effects is to blunt aversive signalling by PBeL relay neurons. If so, then removing (opioid withdrawal) or blocking (naloxone/naltrexone) this inhibitory effect may precipitate hyperactivity of CGRP/Calca neurons, which could be responsible for several aversive symptoms of opioid withdrawal (nausea, malaise, appetite loss, pain, and/or anxiety). Consistent with this possibility, naloxone microinjections into the PB/LC region in morphine-addicted animals replicate the behavioral symptoms of systemic opioid withdrawal. Though LC neurons were thought to be responsible, destroying them did not prevent withdrawal symptoms, leaving uncertainty regarding the neuronal substrate of opioid withdrawal (Christie, Williams, Osborne, & Bellchambers, 1997). Instead, we propose that Oprm1-expressing, CGRP/Calca-expressing PB neurons mediate opioid withdrawal symptoms. This prediction could also explain why the behavioral signs of morphine withdrawal are greatly reduced in CGRP knockout mice (Salmon et al., 2001).
Given the extent of previous work focused on the LC (Aghajanian, 1978; Maldonado & Koob, 1993; Rasmussen & Aghajanian, 1989; Rasmussen et al., 1990), plus a growing literature on a role for this region in opioid-induced respiratory depression (Bachmutsky et al., 2020; Hurle et al., 1985; E. S. Levitt et al., 2015; E. S. Levitt & Williams, 2018; Prkic et al., 2012; Saunders & Levitt, 2020; Varga et al., 2020), we were surprised to find such strong Oprm1 expression in the PB, substantially less in the LC, and very little in the KF. Without diminishing the evidence of mu opioid effects on LC neurons or in the KF region, our findings raise new questions about the roles of Calca-expressing PBeL neurons in breathing, appetite, withdrawal, and other effects of opioid-narcotic medications and drugs of abuse. Based on their strong Oprm1 expression and axonal projections to the hindbrain, we predict that opioid-induced respiratory depression is mediated in part by the hindbrain-projecting, Calca-expressing neurons we identified along the rostral, ventral edge of the PB, between PBeL and KF.
Functional perspectives on the efferent projections of Calca-expressing PB neurons.
The functional range of a neuronal population is constrained by its array of synaptic targets. Among the large array of brain regions that receive synaptic input from glutamatergic PB neurons (Huang et al., 2020), a relatively small subset receive input from the Calca-expressing subpopulation and existing information about these target regions is relevant to the possible functions of CGRP neurons.
Their densest terminal zone spans the BST and CeA, and optogenetically stimulating their axons in either site can induce a taste aversion (Chen et al., 2018). The BST and CeA are implicated in a variety of other functions, including behavioral, neuroendocrine, and autonomic responses associated with anxiety and fear conditioning (Braesicke et al., 2005; Choi et al., 2007; Walker, Toufexis, & Davis, 2003). The role of CGRP/Calca neurons in some of these affective functions is largely unknown.
Between the BST and CeA, Calca-expressing PB neurons also project heavily to the basal forebrain (substantia innominata). In mice, this projection is thought to induce arousal from sleep in response to an elevated concentration of inhaled CO2, used to simulate hypercapnia caused by obstructive apneas (Kaur et al., 2017). Calca-expressing neurons also project heavily to the PSTN, a caudal LHA subregion with heavy axonal projections to autonomic regions including the NTS (Goto & Swanson, 2004). Glutamate microstimulation of PSTN neurons reduced sympathetic nerve activity and produced hypotension with bradycardia in rats (Ciriello, Solano-Flores, Rosas-Arellano, Kirouac, & Babic, 2008). Thus, the malaise and anorexia caused by activating PB Calca-expressing neurons (Campos et al., 2017) may involve a PSTN-mediated shift toward parasympathetic hyperactivity, as occurs in response to nociceptive visceral stimuli. The surprising segregation of PB Pdyn and Calca axonal projections to this region suggests that separate PB neurons target separate populations of neurons in or near the PSTN, which is an important topic for future investigation.
In the cerebral cortex, the bulk of an overall minor set of projections from PB Calca-expressing neurons targets the insular cortex. A minority (13%) of PB neurons that project axons directly to the insular cortex express Calca (Grady et al., 2020), and their direct projections primarily target supragranular layers (2–3) of the dysgranular area, though they could also influence neurons in deeper layers via synaptic relays through VPpc. Like the CGRP neurons, the insular cortex processes aversive viscerosensory and nociceptive signals (Cechetto & Saper, 1987; Gehrlach et al., 2019; Mazzola, Isnard, Peyron, & Mauguiere, 2012; Penfield & Faulk, 1955; Yamamoto et al., 1994; Yasui, Breder, Saper, & Cechetto, 1991). Its layer 2–3 pyramidal neurons interconnect heavily with the amygdala and nucleus accumbens (Allen, Saper, Hurley, & Cechetto, 1991; Gehrlach et al., 2019), and it will be interesting to learn how CGRP input to these supragranular layers interacts with these and other subcortical networks to modulate interoceptive processing.
In the thalamus, the VPpc is the primary target of Calca-expressing PB neurons. Historically, the VPpc was considered a relay for gustatory signals traveling from the caudal PB to the insular cortex (Bester et al., 1999; Fulwiler & Saper, 1984; Norgren & Leonard, 1973). However, subsequent work revealed that the VPpc transmits a variety of viscerosensory information (Cechetto & Saper, 1987). It was unclear from lesion experiments whether this thalamic nucleus has a role in conditioned taste aversions (Flynn, Grill, Schulkin, & Norgren, 1991; Flynn, Grill, Schwartz, & Norgren, 1991; Reilly & Pritchard, 1996a, 1996b; Yamamoto et al., 1995) and, unlike the BST and CeA, optogenetic stimulation of PB Calca axons in VPpc failed to induce taste aversion (Chen et al., 2018). It will be important to determine whether CGRP/Calca axonal projections from PB deliver gustatory or other viscerosensory information to VPpc.
Just rostral to the VPpc, the reuniens and rhomboid nuclei are among the few brain regions that receive convergent input from both Calca- and Pdyn/Foxp2-expressing PB neurons (Huang et al., 2020). Along with the APir and lateral septum, these midline thalamic nuclei offer a two-synapse link from the PB to the hippocampus (Herkenham, 1978; Risold & Swanson, 1997; Shammah-Lagnado & Santiago, 1999; Vertes, Hoover, Do Valle, Sherman, & Rodriguez, 2006). This region of the thalamus is important for fear conditioning and for acquiring passive avoidance memories (Davoodi, Motamedi, Akbari, Ghanbarian, & Jila, 2011; Lin, Chiou, & Chang, 2020), and the hippocampal-projecting neurons here offer a previously unappreciated pathway for encoding memory engrams linking PB-relayed painful or aversive visceral sensations (unconditioned stimuli) to environments, tastants, or other contextual information (conditioned stimuli).
Finally, the divergent Calca and Pdyn projections raise the question, do these PB subpopulations exert separate effects through their distinct efferent networks? Each population has been shown to relay a variety of signals. Calca neurons relay visceral malaise and other aversive signals (discussed above), while subsets of Pdyn neurons appear to relay skin temperature (Geerling et al., 2016), sodium depletion (Lee et al., 2019), and gastrointestinal stretch (Kim et al., 2020). Calca neurons inhibit feeding and promote aversive conditioning via downstream targets including the BST and CeA, while Pdyn neurons project more heavily to the hypothalamus (Huang et al., 2020; Kim et al., 2020; Lee et al., 2019). Besides thermoregulatory, thirst, and sleep-related regions of the preoptic area, one of the most prominent Pdyn targets appears to be the hypocretin/orexin population in the LHA (Huang et al., 2020). These Vglut2-expressing neurons are mutually exclusive with Vgat-expressing (GABAergic) LHA neurons (Jennings et al., 2015; Rosin, Weston, Sevigny, Stornetta, & Guyenet, 2003). Stimulating LHA Vglut2 neurons inhibits feeding (Jennings, Rizzi, Stamatakis, Ung, & Stuber, 2013), while stimulating Vgat neurons may promote feeding (Jennings et al., 2015), so Pdyn neurons in the PB may reduce appetite in response to gastric fullness in part by activating glutamatergic hypocretin/orexin neurons. Stimulating the axons of PB Pdyn neurons within the paraventricular nucleus reduced feeding (Kim et al., 2020), but their more extensive output projection to the LHA orexin field was not tested. Thus, while both the Calca and Pdyn PB subpopulations reduce food intake, they may do so in different contexts and by activating different forebrain networks. Calca neurons inhibit food intake by activating brain regions linked to visceral malaise and other aversive stimuli, while Pdyn neurons may curb hunger by activating appetite-control neurons in the hypothalamus.
Conclusion.
Learning that many CGRP/Calca neurons are found outside PBeL and even outside the PB – including in the LC – improves the neuroanatomical framework for interpreting cell-type-specific experiments in this brain region. Our unexpected observation that strong Oprm1 expression in this region co-localizes primarily with Calca highlights a potentially critical neuronal substrate for opioid-induced respiratory depression and for aversive symptoms linked to opioid withdrawal. Finally, our results support the value of subdividing PB neurons based on their genetic identity, rather than their location or cytoarchitecture. The PB molecular ontology that will result from this approach holds the potential to enhance the translation of discoveries in experimental animals to an improved understanding of the human brain.
Supplementary Material
Acknowledgments
Other Acknowledgements
We thank Gabrielle Iverson for technical assistance with in situ hybridization and other histology and Clif Saper for critical feedback regarding the hindbrain projections of CGRP/Calca neurons. We also thank Richard Palmiter for his permission to use and Andy Russo for sharing CalcaCre:GFP mice. Finally, we thank Jadylin Tolda for proofreading the manuscript.
Grant sponsors:
NIH K08 NS099425 (JCG)
List of Abbreviations
- ac
anterior commissure
- AP
area postrema
- APir
amygdalopiriform transition area
- APN
anterior pretectal nucleus
- Arc
arcuate hypothalamic nucleus
- AV
anteroventral thalamic nucleus
- B
basal nucleus of meynert
- BLA
basolateral amygdalar nucleus
- BMA
basomedial amygdalar nucleus
- BST
bed nucleus of the stria terminalis
- BSTal
BST anterolateral subnucleus
- BSTfu
BST fusiform subnucleus
- BSTov
BST oval subnucleus
- BSTp
BST posterior subdivision
- BSTvL
BST ventrolateral subdivision
- Calca
calcitonin related polypeptide alpha
- CeA
central amygdalar nucleus
- CeAc
CeA, (lateral) capsular subdivision
- CeAl
CeA, lateral subdivision
- CeAm
CeA, medial subdivision
- CGRP
calcitonin gene related peptide
- ChAT
choline acetyltransferase
- Cla
claustrum
- CLi
central linear raphe
- CM
centromedian thalamic nucleus
- CoA
cortical amygdalar area
- CPA/A1
caudal pressor area / A1 group
- ctt
central tegmental tract
- Cun
cuneiform nucleus
- DCN
deep cerebellar nuclei
- DI
dysgranular (middle) insular cortex
- dLPFC
dorsolateral prefrontal cortex
- DMH
dorsomedial hypothalamic nucleus
- DP
dorsal peduncular cortical area
- DR
dorsal raphe
- dscp
decussation of the superior cerebellar peduncle
- DTN
dorsal tegmental nucleus
- Ent
entorhinal cortical area
- EP
entopeduncular nucleus
- EPd
endopiriform nucleus, dorsal subdivision
- EPv
endopiriform nucleus, ventral subdivision
- EW
Edinger-Westphal nucleus
- FL
flocculus of cerebellum
- FoxP2
Forkhead box protein P2
- GFP
Green Fluorescent Protein
- GI
granular (dorsal) insular cortex
- GiRN
gigantocellular reticular nucleus
- GPe
globus pallidus pars externa
- GPi
globus pallidus pars interna (entopeduncular)
- Hc
hippocampus
- IA
intercalated amygdalar nucleus
- ic
internal capsule
- IC
insular cortical area
- IFV
interfascicular trigeminal (CN V) nucleus
- IG
induseum griseum
- ILA
infralimbic cortical area
- IMD
intermediodorsal thalamic nucleus
- IO
inferior olivary complex
- IPN
interpeduncular nucleus
- IRN
intermediate reticular nucleus
- Isl
island of Calleja
- KF
Kölliker-Fuse nucleus
- LAr
lateral amygdaloid nucleus
- LC
locus coeruleus
- L6 PFC
layer 6 of the prefrontal cortex
- LDT
laterodorsal tegmental nucleus
- LGN
lateral geniculate nucleus
- LHA
lateral hypothalamic area
- LHb
lateral habenular nucleus
- LM
lateral mammillary nucleus
- Lmx1b
LIM homeobox transcription factor 1 beta
- LPOA
lateral preoptic area
- LRN
lateral reticular nucleus
- LS
lateral septum
- LSi
LS intermediate subdivision
- LSr
LS rostral subdivision
- LSv
LS ventral subdivision
- MA
magnocellular (basal forebrain) nucleus
- MD
mediodorsal thalamic nucleus
- MeA
medial amygdalar nucleus
- MGN
medial geniculate nucleus
- MHb
medial habenular nucleus
- ml
medial lemniscus
- MM
medial mammillary nucleus
- MnPO
median preoptic nucleus
- MOB
main olfactory bulb
- MPN
medial preoptic nucleus
- MPOA
medial preoptic area
- MR
median raphe
- MRN
midbrain reticular nucleus
- MS
medial septum
- NAc
nucleus ambiguus, compact formation
- NBM
nucleus basalis of Meynert
- NDB
nucleus of the diagonal band
- NTB
nucleus of trapezoid body
- NTS
nucleus of the solitary tract
- NTS-lat
NTS lateral subdivision
- NTS-med
NTS medial subdivision
- Oprm1
opiate receptor Mu 1
- OVLT
organum vasculosum of lamina terminalis
- PAG
periaqueductal gray matter
- PAGdL
PAG dorsolateral subdivision
- PAGdm
PAG dorsomedial subdivision
- PAGvL
PAG ventrolateral subdivision
- PaRN
parvicellular reticular nucleus
- PB
parabrachial nuclear complex
- PBcL
central lateral PB subnucleus
- PBdL
dorsal lateral PB subnucleus
- PBsL
superior lateral PB subnucleus
- PC
paracentral thalamic nucleus
- Pdyn
prodynorphin
- periLGN
peri-lateral geniculate nucleus
- PeriRh
perirhinal cortical area
- PF
parafascicular thalamic nucleus
- PH
posterior hypothalamic nucleus
- PHA-L
Phaseolus Vulgaris leukoagglutinin
- PIL
posterior intralaminar thalamic nucleus
- Pir
piriform cortex
- PL-ACA
prelimbic & anterior cingulate cortex
- PMd
posterior mammillary nucleus, dorsal
- PMv
posterior mammillary nucleus, ventral
- Pn
pontine nuclei
- PO
posterior thalamic nuclear complex
- PoT
posterior triangular thalamic nucleus
- PPN
pedunculopontine (tegmental) nucleus
- PRN
pontine reticular nucleus
- Prt
pretectal area
- PS
parastrial nucleus
- PSTN
parasubthalamic nucleus
- PSV
principal sensory trigeminal (CN V) nucleus
- PT
paratenial thalamic nucleus
- PVH
paraventricular hypothalamic nucleus
- PVT
paraventricular thalamic nucleus
- RCA
retrochiasmatic area of the hypothalamus
- Re
reuniens thalamic nucleus
- Rh
rhomboid thalamic nucleus
- rLA
rostral lateral amygdalar nucleus
- RLi
rostral linear raphe
- RMg
raphe magnus
- RMTg
rostromedial tegmental nucleus
- RN
red nucleus
- ROb
raphe obscurus
- RR/A8
retrorubral area / A8 group
- SC-Lat
superior colliculus, lateral aspect
- SCN
suprachiasmatic nucleus
- SCO
subcommissural organ
- scp
superior cerebellar peduncle
- SFO
subfornical organ
- SHi
septohippocampal nucleus
- SI
substantia innominata
- SNc
substantia nigra, pars compacta
- SNr
substantia nigra, pars reticulata
- SOA
septal-olfactory area
- SOC
superior olivary complex
- SON
supraoptic nucleus
- SPF
subparafasicular nucleus
- SpV
spinal trigeminal nucleus
- st
stria terminalis
- STN
subthalamic nucleus
- Str
striatum
- Str/GP bdr
border between striatum and GPe
- SUM
supramammillary nucleus
- Syp-mCherry
synaptophysin-mCherry
- TH
tyrosine hydroxylase
- TM
tuberomammillary nucleus
- TRN
tegmental reticular nucleus
- TT
tenia tecta
- Ubc
ubiquitin C
- V
trigeminal (CN V) motor nucleus
- Vglut2
vesicular glutamate transporter 2 (Slc17a6)
- VII
facial (CN VII) motor nucleus
- VLPO
ventrolateral preoptic nucleus
- VLM
ventrolateral medulla
- VM
ventromedial thalamic nucleus
- VMH
ventromedial hypothalamic nucleus
- VMPO
ventromedial preoptic area
- VNC
vestibular nuclear complex
- VPpc
parvicellular ventral posterior thalamic nucleus
- VTA
ventral tegmental area
- Xi
xiphoid thalamic nucleus
- XII
hypoglossal (CN XII) motor nucleus
- ZI
zona incerta
Data Availability
The data that support the findings of this study are available from the corresponding author upon reasonable request.
References
- Abbott SB, Kanbar R, Bochorishvili G, Coates MB, Stornetta RL, & Guyenet PG (2012). C1 neurons excite locus coeruleus and A5 noradrenergic neurons along with sympathetic outflow in rats. J Physiol, 590(12), 2897–2915. doi: 10.1113/jphysiol.2012.232157 [DOI] [PMC free article] [PubMed] [Google Scholar]
- Aghajanian GK (1978). Tolerance of locus coeruleus neurones to morphine and suppression of withdrawal response by clonidine. Nature, 276(5684), 186–188. doi: 10.1038/276186a0 [DOI] [PubMed] [Google Scholar]
- Aghajanian GK, & Wang YY (1987). Common alpha 2- and opiate effector mechanisms in the locus coeruleus: intracellular studies in brain slices. Neuropharmacology, 26(7B), 793–799. doi: 10.1016/0028-3908(87)90054-2 [DOI] [PubMed] [Google Scholar]
- Aguero A, Arnedo M, Gallo M, & Puerto A (1993a). Lesions of the lateral parabrachial nuclei disrupt aversion learning induced by electrical stimulation of the area postrema. Brain Res Bull, 30(5–6), 585–592. doi: 10.1016/0361-9230(93)90086-q [DOI] [PubMed] [Google Scholar]
- Aguero A, Arnedo M, Gallo M, & Puerto A (1993b). The functional relevance of the lateral parabrachial nucleus in lithium chloride-induced aversion learning. Pharmacol Biochem Behav, 45(4), 973–978. doi: 10.1016/0091-3057(93)90150-r [DOI] [PubMed] [Google Scholar]
- Akaoka H, & Aston-Jones G (1991). Opiate withdrawal-induced hyperactivity of locus coeruleus neurons is substantially mediated by augmented excitatory amino acid input. J Neurosci, 11(12), 3830–3839. [DOI] [PMC free article] [PubMed] [Google Scholar]
- Alden M, Besson JM, & Bernard JF (1994). Organization of the efferent projections from the pontine parabrachial area to the bed nucleus of the stria terminalis and neighboring regions: a PHA-L study in the rat. J Comp Neurol, 341(3), 289–314. doi: 10.1002/cne.903410302 [DOI] [PubMed] [Google Scholar]
- Alheid GF, & Heimer L (1988). New perspectives in basal forebrain organization of special relevance for neuropsychiatric disorders: the striatopallidal, amygdaloid, and corticopetal components of substantia innominata. Neuroscience, 27(1), 1–39. doi: 10.1016/0306-4522(88)90217-5 [DOI] [PubMed] [Google Scholar]
- Allen GV, Saper CB, Hurley KM, & Cechetto DF (1991). Organization of visceral and limbic connections in the insular cortex of the rat. J Comp Neurol, 311(1), 1–16. doi: 10.1002/cne.903110102 [DOI] [PubMed] [Google Scholar]
- Amara SG, Arriza JL, Leff SE, Swanson LW, Evans RM, & Rosenfeld MG (1985). Expression in brain of a messenger RNA encoding a novel neuropeptide homologous to calcitonin gene-related peptide. Science, 229(4718), 1094–1097. doi: 10.1126/science.2994212 [DOI] [PubMed] [Google Scholar]
- Ashina H, Iljazi A, Al-Khazali HM, Christensen CE, Amin FM, Ashina M, & Schytz HW (2020). Hypersensitivity to Calcitonin Gene-Related Peptide in Post-Traumatic Headache. Ann Neurol, 88(6), 1220–1228. doi: 10.1002/ana.25915 [DOI] [PubMed] [Google Scholar]
- Aston-Jones G, Ennis M, Pieribone VA, Nickell WT, & Shipley MT (1986). The brain nucleus locus coeruleus: restricted afferent control of a broad efferent network. Science, 234(4777), 734–737. doi: 10.1126/science.3775363 [DOI] [PubMed] [Google Scholar]
- Atweh SF, & Kuhar MJ (1977). Autoradiographic localization of opiate receptors in rat brain. II. The brain stem. Brain Res, 129(1), 1–12. doi: 10.1016/0006-8993(77)90965-9 [DOI] [PubMed] [Google Scholar]
- Bachmutsky I, Wei XP, Kish E, & Yackle K (2020). Opioids depress breathing through two small brainstem sites. Elife, 9. doi: 10.7554/eLife.52694 [DOI] [PMC free article] [PubMed] [Google Scholar]
- Beaudet A, & Descarries L (1978). The monoamine innervation of rat cerebral cortex: synaptic and nonsynaptic axon terminals. Neuroscience, 3(10), 851–860. doi: 10.1016/0306-4522(78)90115-x [DOI] [PubMed] [Google Scholar]
- Bernard JF, Alden M, & Besson JM (1993). The organization of the efferent projections from the pontine parabrachial area to the amygdaloid complex: a Phaseolus vulgaris leucoagglutinin (PHA-L) study in the rat. J Comp Neurol, 329(2), 201–229. doi: 10.1002/cne.903290205 [DOI] [PubMed] [Google Scholar]
- Bernard JF, Carroue J, & Besson JM (1991). Efferent projections from the external parabrachial area to the forebrain: a Phaseolus vulgaris leucoagglutinin study in the rat. Neurosci Lett, 122(2), 257–260. doi: 10.1016/0304-3940(91)90872-q [DOI] [PubMed] [Google Scholar]
- Berridge CW, & Abercrombie ED (1999). Relationship between locus coeruleus discharge rates and rates of norepinephrine release within neocortex as assessed by in vivo microdialysis. Neuroscience, 93(4), 1263–1270. doi: 10.1016/s0306-4522(99)00276-6 [DOI] [PubMed] [Google Scholar]
- Bester H, Bourgeais L, Villanueva L, Besson JM, & Bernard JF (1999). Differential projections to the intralaminar and gustatory thalamus from the parabrachial area: a PHA-L study in the rat. J Comp Neurol, 405(4), 421–449. [PubMed] [Google Scholar]
- Bienkowski MS, & Rinaman L (2013). Common and distinct neural inputs to the medial central nucleus of the amygdala and anterior ventrolateral bed nucleus of stria terminalis in rats. Brain Struct Funct, 218(1), 187–208. doi: 10.1007/s00429-012-0393-6 [DOI] [PMC free article] [PubMed] [Google Scholar]
- Braesicke K, Parkinson JA, Reekie Y, Man MS, Hopewell L, Pears A, … Roberts AC (2005). Autonomic arousal in an appetitive context in primates: a behavioural and neural analysis. Eur J Neurosci, 21(6), 1733–1740. doi: 10.1111/j.1460-9568.2005.03987.x [DOI] [PubMed] [Google Scholar]
- Brain SD, Williams TJ, Tippins JR, Morris HR, & MacIntyre I (1985). Calcitonin gene-related peptide is a potent vasodilator. Nature, 313(5997), 54–56. doi: 10.1038/313054a0 [DOI] [PubMed] [Google Scholar]
- Brightwell JJ, & Taylor BK (2009). Noradrenergic neurons in the locus coeruleus contribute to neuropathic pain. Neuroscience, 160(1), 174–185. doi: 10.1016/j.neuroscience.2009.02.023 [DOI] [PMC free article] [PubMed] [Google Scholar]
- Bruinstroop E, Cano G, Vanderhorst VG, Cavalcante JC, Wirth J, Sena-Esteves M, & Saper CB (2012). Spinal projections of the A5, A6 (locus coeruleus), and A7 noradrenergic cell groups in rats. J Comp Neurol, 520(9), 1985–2001. doi: 10.1002/cne.23024 [DOI] [PMC free article] [PubMed] [Google Scholar]
- Bunzow JR, Zhang G, Bouvier C, Saez C, Ronnekleiv OK, Kelly MJ, & Grandy DK (1995). Characterization and distribution of a cloned rat mu-opioid receptor. J Neurochem, 64(1), 14–24. doi: 10.1046/j.1471-4159.1995.64010014.x [DOI] [PubMed] [Google Scholar]
- Calhoun ME, Jucker M, Martin LJ, Thinakaran G, Price DL, & Mouton PR (1996). Comparative evaluation of synaptophysin-based methods for quantification of synapses. J Neurocytol, 25(12), 821–828. doi: 10.1007/bf02284844 [DOI] [PubMed] [Google Scholar]
- Campos CA, Bowen AJ, Han S, Wisse BE, Palmiter RD, & Schwartz MW (2017). Cancer-induced anorexia and malaise are mediated by CGRP neurons in the parabrachial nucleus. Nat Neurosci, 20(7), 934–942. doi: 10.1038/nn.4574 [DOI] [PMC free article] [PubMed] [Google Scholar]
- Campos CA, Bowen AJ, Roman CW, & Palmiter RD (2018). Encoding of danger by parabrachial CGRP neurons. Nature, 555(7698), 617–622. doi: 10.1038/nature25511 [DOI] [PMC free article] [PubMed] [Google Scholar]
- Carter ME, Han S, & Palmiter RD (2015). Parabrachial calcitonin gene-related peptide neurons mediate conditioned taste aversion. J Neurosci, 35(11), 4582–4586. doi: 10.1523/JNEUROSCI.3729-14.2015 [DOI] [PMC free article] [PubMed] [Google Scholar]
- Carter ME, Soden ME, Zweifel LS, & Palmiter RD (2013). Genetic identification of a neural circuit that suppresses appetite. Nature, 503(7474), 111–114. doi: 10.1038/nature12596 [DOI] [PMC free article] [PubMed] [Google Scholar]
- Cechetto DF, & Saper CB (1987). Evidence for a viscerotopic sensory representation in the cortex and thalamus in the rat. J Comp Neurol, 262(1), 27–45. doi: 10.1002/cne.902620104 [DOI] [PubMed] [Google Scholar]
- Cechetto DF, Standaert DG, & Saper CB (1985). Spinal and trigeminal dorsal horn projections to the parabrachial nucleus in the rat. J Comp Neurol, 240(2), 153–160. doi: 10.1002/cne.902400205 [DOI] [PubMed] [Google Scholar]
- Cedarbaum JM, & Aghajanian GK (1978). Activation of locus coeruleus neurons by peripheral stimuli: modulation by a collateral inhibitory mechanism. Life Sci, 23(13), 1383–1392. doi: 10.1016/0024-3205(78)90398-3 [DOI] [PubMed] [Google Scholar]
- Chamberlin NL, Mansour A, Watson SJ, & Saper CB (1999). Localization of mu-opioid receptors on amygdaloid projection neurons in the parabrachial nucleus of the rat. Brain Res, 827(1–2), 198–204. doi: 10.1016/s0006-8993(99)01168-3 [DOI] [PubMed] [Google Scholar]
- Chandler DJ, Jensen P, McCall JG, Pickering AE, Schwarz LA, & Totah NK (2019). Redefining Noradrenergic Neuromodulation of Behavior: Impacts of a Modular Locus Coeruleus Architecture. J Neurosci, 39(42), 8239–8249. doi: 10.1523/JNEUROSCI.1164-19.2019 [DOI] [PMC free article] [PubMed] [Google Scholar]
- Chang HT, & Kuo H (1989). Calcitonin gene-related peptide (CGRP) in the rat substantia innominata and globus pallidus: a light and electron microscopic immunocytochemical study. Brain Res, 495(1), 167–172. doi: 10.1016/0006-8993(89)91232-8 [DOI] [PubMed] [Google Scholar]
- Chen JY, Campos CA, Jarvie BC, & Palmiter RD (2018). Parabrachial CGRP Neurons Establish and Sustain Aversive Taste Memories. Neuron, 100(4), 891–899 e895. doi: 10.1016/j.neuron.2018.09.032 [DOI] [PMC free article] [PubMed] [Google Scholar]
- Choi DC, Furay AR, Evanson NK, Ostrander MM, Ulrich-Lai YM, & Herman JP (2007). Bed nucleus of the stria terminalis subregions differentially regulate hypothalamic-pituitary-adrenal axis activity: implications for the integration of limbic inputs. J Neurosci, 27(8), 2025–2034. doi: 10.1523/JNEUROSCI.4301-06.2007 [DOI] [PMC free article] [PubMed] [Google Scholar]
- Christie MJ, & North RA (1988). Agonists at mu-opioid, M2-muscarinic and GABAB-receptors increase the same potassium conductance in rat lateral parabrachial neurones. Br J Pharmacol, 95(3), 896–902. doi: 10.1111/j.1476-5381.1988.tb11719.x [DOI] [PMC free article] [PubMed] [Google Scholar]
- Christie MJ, Williams JT, Osborne PB, & Bellchambers CE (1997). Where is the locus in opioid withdrawal? Trends Pharmacol Sci, 18(4), 134–140. doi: 10.1016/s0165-6147(97)01045-6 [DOI] [PubMed] [Google Scholar]
- Ciriello J, Solano-Flores LP, Rosas-Arellano MP, Kirouac GJ, & Babic T (2008). Medullary pathways mediating the parasubthalamic nucleus depressor response. Am J Physiol Regul Integr Comp Physiol, 294(4), R1276–1284. doi: 10.1152/ajpregu.00437.2007 [DOI] [PubMed] [Google Scholar]
- D’Hanis W, Linke R, & Yilmazer-Hanke DM (2007). Topography of thalamic and parabrachial calcitonin gene-related peptide (CGRP) immunoreactive neurons projecting to subnuclei of the amygdala and extended amygdala. J Comp Neurol, 505(3), 268–291. doi: 10.1002/cne.21495 [DOI] [PubMed] [Google Scholar]
- Davoodi FG, Motamedi F, Akbari E, Ghanbarian E, & Jila B (2011). Effect of reversible inactivation of reuniens nucleus on memory processing in passive avoidance task. Behav Brain Res, 221(1), 1–6. doi: 10.1016/j.bbr.2011.02.020 [DOI] [PubMed] [Google Scholar]
- de Lacalle S, & Saper CB (2000). Calcitonin gene-related peptide-like immunoreactivity marks putative visceral sensory pathways in human brain. Neuroscience, 100(1), 115–130. doi: 10.1016/s0306-4522(00)00245-1 [DOI] [PubMed] [Google Scholar]
- Ding YQ, Kaneko T, Nomura S, & Mizuno N (1996). Immunohistochemical localization of mu-opioid receptors in the central nervous system of the rat. J Comp Neurol, 367(3), 375–402. doi: [DOI] [PubMed] [Google Scholar]
- Dong HW, Petrovich GD, & Swanson LW (2001). Topography of projections from amygdala to bed nuclei of the stria terminalis. Brain Res Brain Res Rev, 38(1–2), 192–246. [DOI] [PubMed] [Google Scholar]
- Dong HW, Petrovich GD, Watts AG, & Swanson LW (2001). Basic organization of projections from the oval and fusiform nuclei of the bed nuclei of the stria terminalis in adult rat brain. J Comp Neurol, 436(4), 430–455. [DOI] [PubMed] [Google Scholar]
- Durham PL (2004). CGRP-receptor antagonists--a fresh approach to migraine therapy? N Engl J Med, 350(11), 1073–1075. doi: 10.1056/NEJMp048016 [DOI] [PubMed] [Google Scholar]
- Edvinsson L (2008). CGRP-receptor antagonism in migraine treatment. Lancet, 372(9656), 2089–2090. doi: 10.1016/S0140-6736(08)61710-9 [DOI] [PubMed] [Google Scholar]
- Edvinsson L, Eftekhari S, Salvatore CA, & Warfvinge K (2011). Cerebellar distribution of calcitonin gene-related peptide (CGRP) and its receptor components calcitonin receptor-like receptor (CLR) and receptor activity modifying protein 1 (RAMP1) in rat. Mol Cell Neurosci, 46(1), 333–339. doi: 10.1016/j.mcn.2010.10.005 [DOI] [PubMed] [Google Scholar]
- Edvinsson L, Haanes KA, Warfvinge K, & Krause DN (2018). CGRP as the target of new migraine therapies - successful translation from bench to clinic. Nat Rev Neurol, 14(6), 338–350. doi: 10.1038/s41582-018-0003-1 [DOI] [PubMed] [Google Scholar]
- Elam M, Svensson TH, & Thoren P (1986). Locus coeruleus neurons and sympathetic nerves: activation by cutaneous sensory afferents. Brain Res, 366(1–2), 254–261. doi: 10.1016/0006-8993(86)91302-8 [DOI] [PubMed] [Google Scholar]
- Elam M, Yao T, Thoren P, & Svensson TH (1981). Hypercapnia and hypoxia: chemoreceptor-mediated control of locus coeruleus neurons and splanchnic, sympathetic nerves. Brain Res, 222(2), 373–381. doi: 10.1016/0006-8993(81)91040-4 [DOI] [PubMed] [Google Scholar]
- Fisher LA, Kikkawa DO, Rivier JE, Amara SG, Evans RM, Rosenfeld MG, … Brown MR (1983). Stimulation of noradrenergic sympathetic outflow by calcitonin gene-related peptide. Nature, 305(5934), 534–536. doi: 10.1038/305534a0 [DOI] [PubMed] [Google Scholar]
- Flynn FW, Grill HJ, Schulkin J, & Norgren R (1991). Central gustatory lesions: II. Effects on sodium appetite, taste aversion learning, and feeding behaviors. Behav Neurosci, 105(6), 944–954. doi: 10.1037//0735-7044.105.6.944 [DOI] [PubMed] [Google Scholar]
- Flynn FW, Grill HJ, Schwartz GJ, & Norgren R (1991). Central gustatory lesions: I. Preference and taste reactivity tests. Behav Neurosci, 105(6), 933–943. doi: 10.1037//0735-7044.105.6.933 [DOI] [PubMed] [Google Scholar]
- Fritschy JM, & Grzanna R (1989). Immunohistochemical analysis of the neurotoxic effects of DSP-4 identifies two populations of noradrenergic axon terminals. Neuroscience, 30(1), 181–197. doi: 10.1016/0306-4522(89)90364-3 [DOI] [PubMed] [Google Scholar]
- Fulwiler CE, & Saper CB (1984). Subnuclear organization of the efferent connections of the parabrachial nucleus in the rat. Brain Res, 319(3), 229–259. doi: 10.1016/0165-0173(84)90012-2 [DOI] [PubMed] [Google Scholar]
- Geerling JC, Kim M, Mahoney CE, Abbott SB, Agostinelli LJ, Garfield AS, … Scammell TE (2016). Genetic identity of thermosensory relay neurons in the lateral parabrachial nucleus. Am J Physiol Regul Integr Comp Physiol, 310(1), R41–54. doi: 10.1152/ajpregu.00094.2015 [DOI] [PMC free article] [PubMed] [Google Scholar]
- Geerling JC, & Loewy AD (2006). Aldosterone-sensitive neurons in the nucleus of the solitary tract: bidirectional connections with the central nucleus of the amygdala. J Comp Neurol, 497(4), 646–657. doi: 10.1002/cne.21019 [DOI] [PMC free article] [PubMed] [Google Scholar]
- Geerling JC, Yokota S, Rukhadze I, Roe D, & Chamberlin NL (2017). Kolliker-Fuse GABAergic and glutamatergic neurons project to distinct targets. J Comp Neurol, 525(8), 1844–1860. doi: 10.1002/cne.24164 [DOI] [PMC free article] [PubMed] [Google Scholar]
- Gehrlach DA, Dolensek N, Klein AS, Roy Chowdhury R, Matthys A, Junghanel M, … Gogolla N (2019). Aversive state processing in the posterior insular cortex. Nat Neurosci, 22(9), 1424–1437. doi: 10.1038/s41593-019-0469-1 [DOI] [PubMed] [Google Scholar]
- Goadsby PJ, Edvinsson L, & Ekman R (1990). Vasoactive peptide release in the extracerebral circulation of humans during migraine headache. Ann Neurol, 28(2), 183–187. doi: 10.1002/ana.410280213 [DOI] [PubMed] [Google Scholar]
- Goto M, & Swanson LW (2004). Axonal projections from the parasubthalamic nucleus. J Comp Neurol, 469(4), 581–607. doi: 10.1002/cne.11036 [DOI] [PubMed] [Google Scholar]
- Grady F, Peltekian L, Iverson G, & Geerling JC (2020). Direct Parabrachial-Cortical Connectivity. Cereb Cortex. doi: 10.1093/cercor/bhaa072 [DOI] [PMC free article] [PubMed] [Google Scholar]
- Greenberg B, Rhoden K, & Barnes P (1987). Calcitonin gene-related peptide (CGRP) is a potent non-endothelium-dependent inhibitor of coronary vasomotor tone. Br J Pharmacol, 92(4), 789–794. doi: 10.1111/j.1476-5381.1987.tb11382.x [DOI] [PMC free article] [PubMed] [Google Scholar]
- Grove EA (1988). Neural associations of the substantia innominata in the rat: afferent connections. J Comp Neurol, 277(3), 315–346. doi: 10.1002/cne.902770302 [DOI] [PubMed] [Google Scholar]
- Guyenet PG, Stornetta RL, Bochorishvili G, Depuy SD, Burke PG, & Abbott SB (2013). C1 neurons: the body’s EMTs. Am J Physiol Regul Integr Comp Physiol, 305(3), R187–204. doi: 10.1152/ajpregu.00054.2013 [DOI] [PMC free article] [PubMed] [Google Scholar]
- Han S, Soleiman MT, Soden ME, Zweifel LS, & Palmiter RD (2015). Elucidating an Affective Pain Circuit that Creates a Threat Memory. Cell, 162(2), 363–374. doi: 10.1016/j.cell.2015.05.057 [DOI] [PMC free article] [PubMed] [Google Scholar]
- Hanko J, Hardebo JE, Kahrstrom J, Owman C, & Sundler F (1985). Calcitonin gene-related peptide is present in mammalian cerebrovascular nerve fibres and dilates pial and peripheral arteries. Neurosci Lett, 57(1), 91–95. doi: 10.1016/0304-3940(85)90045-x [DOI] [PubMed] [Google Scholar]
- Hansen JM, Hauge AW, Olesen J, & Ashina M (2010). Calcitonin gene-related peptide triggers migraine-like attacks in patients with migraine with aura. Cephalalgia, 30(10), 1179–1186. doi: 10.1177/0333102410368444 [DOI] [PubMed] [Google Scholar]
- Hattox AM, Priest CA, & Keller A (2002). Functional circuitry involved in the regulation of whisker movements. J Comp Neurol, 442(3), 266–276. doi: 10.1002/cne.10089 [DOI] [PMC free article] [PubMed] [Google Scholar]
- Herbert H, Moga MM, & Saper CB (1990). Connections of the parabrachial nucleus with the nucleus of the solitary tract and the medullary reticular formation in the rat. J Comp Neurol, 293(4), 540–580. [DOI] [PubMed] [Google Scholar]
- Herkenham M (1978). The connections of the nucleus reuniens thalami: evidence for a direct thalamo-hippocampal pathway in the rat. J Comp Neurol, 177(4), 589–610. doi: 10.1002/cne.901770405 [DOI] [PubMed] [Google Scholar]
- Herkenham M, & Pert CB (1980). In vitro autoradiography of opiate receptors in rat brain suggests loci of “opiatergic” pathways. Proc Natl Acad Sci U S A, 77(9), 5532–5536. doi: 10.1073/pnas.77.9.5532 [DOI] [PMC free article] [PubMed] [Google Scholar]
- Herkenham M, & Pert CB (1982). Light microscopic localization of brain opiate receptors: a general autoradiographic method which preserves tissue quality. J Neurosci, 2(8), 1129–1149. [DOI] [PMC free article] [PubMed] [Google Scholar]
- Hickey L, Li Y, Fyson SJ, Watson TC, Perrins R, Hewinson J, … Pickering AE (2014). Optoactivation of locus ceruleus neurons evokes bidirectional changes in thermal nociception in rats. J Neurosci, 34(12), 4148–4160. doi: 10.1523/JNEUROSCI.4835-13.2014 [DOI] [PMC free article] [PubMed] [Google Scholar]
- Hirooka Y, Polson JW, Potts PD, & Dampney RA (1997). Hypoxia-induced Fos expression in neurons projecting to the pressor region in the rostral ventrolateral medulla. Neuroscience, 80(4), 1209–1224. doi: 10.1016/s0306-4522(97)00111-5 [DOI] [PubMed] [Google Scholar]
- Hirschberg S, Li Y, Randall A, Kremer EJ, & Pickering AE (2017). Functional dichotomy in spinal-vs prefrontal-projecting locus coeruleus modules splits descending noradrenergic analgesia from ascending aversion and anxiety in rats. Elife, 6. doi: 10.7554/eLife.29808 [DOI] [PMC free article] [PubMed] [Google Scholar]
- Huang D, Grady FS, Peltekian L, & Geerling JC (2020). Efferent Projections of Vglut2, Foxp2 and Pdyn Parabrachial Neurons in Mice. J Comp Neurol. doi: 10.1002/cne.24975 [DOI] [PMC free article] [PubMed] [Google Scholar]
- Hurle MA, Mediavilla A, & Florez J (1985). Differential respiratory patterns induced by opioids applied to the ventral medullary and dorsal pontine surfaces of cats. Neuropharmacology, 24(7), 597–606. doi: 10.1016/0028-3908(85)90100-5 [DOI] [PubMed] [Google Scholar]
- Jansen I, Uddman R, Hocherman M, Ekman R, Jensen K, Olesen J, … Edvinsson L (1986). Localization and effects of neuropeptide Y, vasoactive intestinal polypeptide, substance P, and calcitonin gene-related peptide in human temporal arteries. Ann Neurol, 20(4), 496–501. doi: 10.1002/ana.410200409 [DOI] [PubMed] [Google Scholar]
- Jennings JH, Rizzi G, Stamatakis AM, Ung RL, & Stuber GD (2013). The inhibitory circuit architecture of the lateral hypothalamus orchestrates feeding. Science, 341(6153), 1517–1521. doi: 10.1126/science.1241812 [DOI] [PMC free article] [PubMed] [Google Scholar]
- Jennings JH, Ung RL, Resendez SL, Stamatakis AM, Taylor JG, Huang J, … Stuber GD (2015). Visualizing hypothalamic network dynamics for appetitive and consummatory behaviors. Cell, 160(3), 516–527. doi: 10.1016/j.cell.2014.12.026 [DOI] [PMC free article] [PubMed] [Google Scholar]
- Jodo E, Chiang C, & Aston-Jones G (1998). Potent excitatory influence of prefrontal cortex activity on noradrenergic locus coeruleus neurons. Neuroscience, 83(1), 63–79. doi: 10.1016/s0306-4522(97)00372-2 [DOI] [PubMed] [Google Scholar]
- Jones BE, Halaris AE, McIlhany M, & Moore RY (1977). Ascending projections of the locus coeruleus in the rat. I. Axonal transport in central noradrenaline neurons. Brain Res, 127(1), 1–21. [DOI] [PubMed] [Google Scholar]
- Jones BE, & Moore RY (1977). Ascending projections of the locus coeruleus in the rat. II. Autoradiographic study. Brain Res, 127(1), 25–53. [PubMed] [Google Scholar]
- Jones SL, & Gebhart GF (1986). Characterization of coeruleospinal inhibition of the nociceptive tail-flick reflex in the rat: mediation by spinal alpha 2-adrenoceptors. Brain Res, 364(2), 315–330. doi: 10.1016/0006-8993(86)90844-9 [DOI] [PubMed] [Google Scholar]
- Ju G, & Swanson LW (1989). Studies on the cellular architecture of the bed nuclei of the stria terminalis in the rat: I. Cytoarchitecture. J Comp Neurol, 280(4), 587–602. doi: 10.1002/cne.902800409 [DOI] [PubMed] [Google Scholar]
- Karimnamazi H, & Travers JB (1998). Differential projections from gustatory responsive regions of the parabrachial nucleus to the medulla and forebrain. Brain Res, 813(2), 283–302. doi: 10.1016/s0006-8993(98)00951-2 [DOI] [PubMed] [Google Scholar]
- Kaur S, Wang JL, Ferrari L, Thankachan S, Kroeger D, Venner A, … Saper CB (2017). A Genetically Defined Circuit for Arousal from Sleep during Hypercapnia. Neuron, 96(5), 1153–1167 e1155. doi: 10.1016/j.neuron.2017.10.009 [DOI] [PMC free article] [PubMed] [Google Scholar]
- Kawai Y, Takami K, Shiosaka S, Emson PC, Hillyard CJ, Girgis S, … Tohyama M (1985). Topographic localization of calcitonin gene-related peptide in the rat brain: an immunohistochemical analysis. Neuroscience, 15(3), 747–763. doi: 10.1016/0306-4522(85)90076-4 [DOI] [PubMed] [Google Scholar]
- Kim DY, Heo G, Kim M, Kim H, Jin JA, Kim HK, … Kim SY (2020). A neural circuit mechanism for mechanosensory feedback control of ingestion. Nature, 580(7803), 376–380. doi: 10.1038/s41586-020-2167-2 [DOI] [PubMed] [Google Scholar]
- Knyihar-Csillik E, Boncz I, Sary G, Nemcsok J, & Csillik B (1999). Parabrachial origin of calcitonin gene-related peptide-immunoreactive axons innervating Meynert’s basal nucleus. Exp Neurol, 157(2), 268–276. doi: 10.1006/exnr.1999.7050 [DOI] [PubMed] [Google Scholar]
- Korf J, Bunney BS, & Aghajanian GK (1974). Noradrenergic neurons: morphine inhibition of spontaneous activity. Eur J Pharmacol, 25(2), 165–169. doi: 10.1016/0014-2999(74)90045-4 [DOI] [PubMed] [Google Scholar]
- Krout KE, & Loewy AD (2000). Parabrachial nucleus projections to midline and intralaminar thalamic nuclei of the rat. J Comp Neurol, 428(3), 475–494. [DOI] [PubMed] [Google Scholar]
- Kruger L, Mantyh PW, Sternini C, Brecha NC, & Mantyh CR (1988). Calcitonin gene-related peptide (CGRP) in the rat central nervous system: patterns of immunoreactivity and receptor binding sites. Brain Res, 463(2), 223–244. doi: 10.1016/0006-8993(88)90395-2 [DOI] [PubMed] [Google Scholar]
- Kruger L, Sternini C, Brecha NC, & Mantyh PW (1988). Distribution of calcitonin gene-related peptide immunoreactivity in relation to the rat central somatosensory projection. J Comp Neurol, 273(2), 149–162. doi: 10.1002/cne.902730203 [DOI] [PubMed] [Google Scholar]
- Lasiter PS, Glanzman DL, & Mensah PA (1982). Direct connectivity between pontine taste areas and gustatory neocortex in rat. Brain Res, 234(1), 111–121. doi: 10.1016/0006-8993(82)90476-0 [DOI] [PubMed] [Google Scholar]
- Lee S, Augustine V, Zhao Y, Ebisu H, Ho B, Kong D, & Oka Y (2019). Chemosensory modulation of neural circuits for sodium appetite. Nature, 568(7750), 93–97. doi: 10.1038/s41586-019-1053-2 [DOI] [PMC free article] [PubMed] [Google Scholar]
- Lein ES, Hawrylycz MJ, Ao N, Ayres M, Bensinger A, Bernard A, … Jones AR (2007). Genome-wide atlas of gene expression in the adult mouse brain. Nature, 445(7124), 168–176. doi: 10.1038/nature05453 [DOI] [PubMed] [Google Scholar]
- Levitt ES, Abdala AP, Paton JF, Bissonnette JM, & Williams JT (2015). mu opioid receptor activation hyperpolarizes respiratory-controlling Kolliker-Fuse neurons and suppresses post-inspiratory drive. J Physiol, 593(19), 4453–4469. doi: 10.1113/JP270822 [DOI] [PMC free article] [PubMed] [Google Scholar]
- Levitt ES, & Williams JT (2018). Desensitization and Tolerance of Mu Opioid Receptors on Pontine Kolliker-Fuse Neurons. Mol Pharmacol, 93(1), 8–13. doi: 10.1124/mol.117.109603 [DOI] [PMC free article] [PubMed] [Google Scholar]
- Levitt P, & Moore RY (1978). Noradrenaline neuron innervation of the neocortex in the rat. Brain Res, 139(2), 219–231. doi: 10.1016/0006-8993(78)90925-3 [DOI] [PubMed] [Google Scholar]
- Li XH, Matsuura T, Liu RH, Xue M, & Zhuo M (2019). Calcitonin gene-related peptide potentiated the excitatory transmission and network propagation in the anterior cingulate cortex of adult mice. Mol Pain, 15, 1744806919832718. doi: 10.1177/1744806919832718 [DOI] [PMC free article] [PubMed] [Google Scholar]
- Li Y, Hickey L, Perrins R, Werlen E, Patel AA, Hirschberg S, … Pickering, A. E. (2016). Retrograde optogenetic characterization of the pontospinal module of the locus coeruleus with a canine adenoviral vector. Brain Res, 1641(Pt B), 274–290. doi: 10.1016/j.brainres.2016.02.023 [DOI] [PMC free article] [PubMed] [Google Scholar]
- Li YQ, Takada M, & Mizuno N (1993). Identification of premotor interneurons which project bilaterally to the trigeminal motor, facial or hypoglossal nuclei: a fluorescent retrograde double-labeling study in the rat. Brain Res, 611(1), 160–164. doi: 10.1016/0006-8993(93)91789-u [DOI] [PubMed] [Google Scholar]
- Lin YJ, Chiou RJ, & Chang CH (2020). The Reuniens and Rhomboid Nuclei Are Required for Acquisition of Pavlovian Trace Fear Conditioning in Rats. eNeuro, 7(3). doi: 10.1523/ENEURO.0106-20.2020 [DOI] [PMC free article] [PubMed] [Google Scholar]
- Lindvall O, Bjorklund A, Nobin A, & Stenevi U (1974). The adrenergic innervation of the rat thalamus as revealed by the glyoxylic acid fluorescence method. J Comp Neurol, 154(3), 317–347. doi: 10.1002/cne.901540307 [DOI] [PubMed] [Google Scholar]
- Liu Y, Chen QY, Lee JH, Li XH, Yu S, & Zhuo M (2020). Cortical potentiation induced by calcitonin gene-related peptide (CGRP) in the insular cortex of adult mice. Mol Brain, 13(1), 36. doi: 10.1186/s13041-020-00580-x [DOI] [PMC free article] [PubMed] [Google Scholar]
- Loughlin SE, Foote SL, & Fallon JH (1982). Locus coeruleus projections to cortex: topography, morphology and collateralization. Brain Res Bull, 9(1–6), 287–294. doi: 10.1016/0361-9230(82)90142-3 [DOI] [PubMed] [Google Scholar]
- Maldonado R, & Koob GF (1993). Destruction of the locus coeruleus decreases physical signs of opiate withdrawal. Brain Res, 605(1), 128–138. doi: 10.1016/0006-8993(93)91364-x [DOI] [PubMed] [Google Scholar]
- Mansour A, Fox CA, Burke S, Meng F, Thompson RC, Akil H, & Watson SJ (1994). Mu, delta, and kappa opioid receptor mRNA expression in the rat CNS: an in situ hybridization study. J Comp Neurol, 350(3), 412–438. doi: 10.1002/cne.903500307 [DOI] [PubMed] [Google Scholar]
- Mansour A, Fox CA, Thompson RC, Akil H, & Watson SJ (1994). mu-Opioid receptor mRNA expression in the rat CNS: comparison to mu-receptor binding. Brain Res, 643(1–2), 245–265. doi: 10.1016/0006-8993(94)90031-0 [DOI] [PubMed] [Google Scholar]
- Mazzola L, Isnard J, Peyron R, & Mauguiere F (2012). Stimulation of the human cortex and the experience of pain: Wilder Penfield’s observations revisited. Brain, 135(Pt 2), 631–640. doi: 10.1093/brain/awr265 [DOI] [PubMed] [Google Scholar]
- McDonald AJ (1982). Cytoarchitecture of the central amygdaloid nucleus of the rat. J Comp Neurol, 208(4), 401–418. doi: 10.1002/cne.902080409 [DOI] [PubMed] [Google Scholar]
- McDonald AJ (1983). Neurons of the bed nucleus of the stria terminalis: a golgi study in the rat. Brain Res Bull, 10(1), 111–120. doi: 10.1016/0361-9230(83)90082-5 [DOI] [PubMed] [Google Scholar]
- Moga MM, Herbert H, Hurley KM, Yasui Y, Gray TS, & Saper CB (1990). Organization of cortical, basal forebrain, and hypothalamic afferents to the parabrachial nucleus in the rat. J Comp Neurol, 295(4), 624–661. doi: 10.1002/cne.902950408 [DOI] [PubMed] [Google Scholar]
- Morrison SF, & Reis DJ (1989). Reticulospinal vasomotor neurons in the RVL mediate the somatosympathetic reflex. Am J Physiol, 256(5 Pt 2), R1084–1097. doi: 10.1152/ajpregu.1989.256.5.R1084 [DOI] [PubMed] [Google Scholar]
- Norgren R (1976). Taste pathways to hypothalamus and amygdala. J Comp Neurol, 166(1), 17–30. doi: 10.1002/cne.901660103 [DOI] [PubMed] [Google Scholar]
- Norgren R, & Leonard CM (1973). Ascending central gustatory pathways. J Comp Neurol, 150(2), 217–237. doi: 10.1002/cne.901500208 [DOI] [PubMed] [Google Scholar]
- Oku R, Satoh M, Fujii N, Otaka A, Yajima H, & Takagi H (1987). Calcitonin gene-related peptide promotes mechanical nociception by potentiating release of substance P from the spinal dorsal horn in rats. Brain Res, 403(2), 350–354. doi: 10.1016/0006-8993(87)90074-6 [DOI] [PubMed] [Google Scholar]
- Palmiter RD (2018). The Parabrachial Nucleus: CGRP Neurons Function as a General Alarm. Trends Neurosci, 41(5), 280–293. doi: 10.1016/j.tins.2018.03.007 [DOI] [PMC free article] [PubMed] [Google Scholar]
- Penfield W, & Faulk ME Jr. (1955). The insula; further observations on its function. Brain, 78(4), 445–470. doi: 10.1093/brain/78.4.445 [DOI] [PubMed] [Google Scholar]
- Pert CB, Kuhar MJ, & Snyder SH (1976). Opiate receptor: autoradiographic localization in rat brain. Proc Natl Acad Sci U S A, 73(10), 3729–3733. doi: 10.1073/pnas.73.10.3729 [DOI] [PMC free article] [PubMed] [Google Scholar]
- Petreanu L, Huber D, Sobczyk A, & Svoboda K (2007). Channelrhodopsin-2-assisted circuit mapping of long-range callosal projections. Nat Neurosci, 10(5), 663–668. doi: 10.1038/nn1891 [DOI] [PubMed] [Google Scholar]
- Prkic I, Mustapic S, Radocaj T, Stucke AG, Stuth EA, Hopp FA, … Zuperku EJ (2012). Pontine mu-opioid receptors mediate bradypnea caused by intravenous remifentanil infusions at clinically relevant concentrations in dogs. J Neurophysiol, 108(9), 2430–2441. doi: 10.1152/jn.00185.2012 [DOI] [PMC free article] [PubMed] [Google Scholar]
- Quirion R, Zajac JM, Morgat JL, & Roques BP (1983). Autoradiographic distribution of mu and delta opiate receptors in rat brain using highly selective ligands. Life Sci, 33 Suppl 1, 227–230. doi: 10.1016/0024-3205(83)90484-8 [DOI] [PubMed] [Google Scholar]
- Rajaofetra N, Ridet JL, Poulat P, Marlier L, Sandillon F, Geffard M, & Privat A (1992). Immunocytochemical mapping of noradrenergic projections to the rat spinal cord with an antiserum against noradrenaline. J Neurocytol, 21(7), 481–494. doi: 10.1007/BF01186952 [DOI] [PubMed] [Google Scholar]
- Rasmussen K, & Aghajanian GK (1989). Withdrawal-induced activation of locus coeruleus neurons in opiate-dependent rats: attenuation by lesions of the nucleus paragigantocellularis. Brain Res, 505(2), 346–350. doi: 10.1016/0006-8993(89)91466-2 [DOI] [PubMed] [Google Scholar]
- Rasmussen K, Beitner-Johnson DB, Krystal JH, Aghajanian GK, & Nestler EJ (1990). Opiate withdrawal and the rat locus coeruleus: behavioral, electrophysiological, and biochemical correlates. J Neurosci, 10(7), 2308–2317. [DOI] [PMC free article] [PubMed] [Google Scholar]
- Reilly S, & Pritchard TC (1996a). Gustatory thalamus lesions in the rat: I. Innate taste preferences and aversions. Behav Neurosci, 110(4), 737–745. doi: 10.1037//0735-7044.110.4.737 [DOI] [PubMed] [Google Scholar]
- Reilly S, & Pritchard TC (1996b). Gustatory thalamus lesions in the rat: II. Aversive and appetitive taste conditioning. Behav Neurosci, 110(4), 746–759. [PubMed] [Google Scholar]
- Resch JM, Fenselau H, Madara JC, Wu C, Campbell JN, Lyubetskaya A, … Lowell BB (2017). Aldosterone-Sensing Neurons in the NTS Exhibit State-Dependent Pacemaker Activity and Drive Sodium Appetite via Synergy with Angiotensin II Signaling. Neuron, 96(1), 190–206 e197. doi: 10.1016/j.neuron.2017.09.014 [DOI] [PMC free article] [PubMed] [Google Scholar]
- Rethelyi M, Metz CB, & Lund PK (1989). Distribution of neurons expressing calcitonin gene-related peptide mRNAs in the brain stem, spinal cord and dorsal root ganglia of rat and guinea-pig. Neuroscience, 29(1), 225–239. doi: 10.1016/0306-4522(89)90345-x [DOI] [PubMed] [Google Scholar]
- Rethelyi M, Mohapatra NK, Metz CB, Petrusz P, & Lund PK (1991). Colchicine enhances mRNAs encoding the precursor of calcitonin gene-related peptide in brainstem motoneurons. Neuroscience, 42(2), 531–539. doi: 10.1016/0306-4522(91)90395-5 [DOI] [PubMed] [Google Scholar]
- Risold PY, & Swanson LW (1997). Connections of the rat lateral septal complex. Brain Res Brain Res Rev, 24(2–3), 115–195. doi: 10.1016/s0165-0173(97)00009-x [DOI] [PubMed] [Google Scholar]
- Roberts GW, Woodhams PL, Polak JM, & Crow TJ (1982). Distribution of neuropeptides in the limbic system of the rat: the amygdaloid complex. Neuroscience, 7(1), 99–131. doi: 10.1016/0306-4522(82)90156-7 [DOI] [PubMed] [Google Scholar]
- Rosenfeld MG, Mermod JJ, Amara SG, Swanson LW, Sawchenko PE, Rivier J, … Evans RM (1983). Production of a novel neuropeptide encoded by the calcitonin gene via tissue-specific RNA processing. Nature, 304(5922), 129–135. doi: 10.1038/304129a0 [DOI] [PubMed] [Google Scholar]
- Rosin DL, Weston MC, Sevigny CP, Stornetta RL, & Guyenet PG (2003). Hypothalamic orexin (hypocretin) neurons express vesicular glutamate transporters VGLUT1 or VGLUT2. J Comp Neurol, 465(4), 593–603. doi: 10.1002/cne.10860 [DOI] [PubMed] [Google Scholar]
- Russell FA, King R, Smillie SJ, Kodji X, & Brain SD (2014). Calcitonin gene-related peptide: physiology and pathophysiology. Physiol Rev, 94(4), 1099–1142. doi: 10.1152/physrev.00034.2013 [DOI] [PMC free article] [PubMed] [Google Scholar]
- Russo AF (2015). Calcitonin gene-related peptide (CGRP): a new target for migraine. Annu Rev Pharmacol Toxicol, 55, 533–552. doi: 10.1146/annurev-pharmtox-010814-124701 [DOI] [PMC free article] [PubMed] [Google Scholar]
- Sakai N, & Yamamoto T (1997). Conditioned taste aversion and c-fos expression in the rat brainstem after administration of various USs. Neuroreport, 8(9–10), 2215–2220. doi: 10.1097/00001756-199707070-00025 [DOI] [PubMed] [Google Scholar]
- Salmon AM, Damaj MI, Marubio LM, Epping-Jordan MP, Merlo-Pich E, & Changeux JP (2001). Altered neuroadaptation in opiate dependence and neurogenic inflammatory nociception in alpha CGRP-deficient mice. Nat Neurosci, 4(4), 357–358. doi: 10.1038/86001 [DOI] [PubMed] [Google Scholar]
- Santiago AC, & Shammah-Lagnado SJ (2005). Afferent connections of the amygdalopiriform transition area in the rat. J Comp Neurol, 489(3), 349–371. doi: 10.1002/cne.20637 [DOI] [PubMed] [Google Scholar]
- Saper CB (1982). Reciprocal parabrachial-cortical connections in the rat. Brain Res, 242(1), 33–40. doi: 10.1016/0006-8993(82)90493-0 [DOI] [PubMed] [Google Scholar]
- Saper CB (2016). The House Alarm. Cell Metab, 23(5), 754–755. doi: 10.1016/j.cmet.2016.04.021 [DOI] [PubMed] [Google Scholar]
- Saper CB, & Loewy AD (1980). Efferent connections of the parabrachial nucleus in the rat. Brain Res, 197(2), 291–317. doi: 10.1016/0006-8993(80)91117-8 [DOI] [PubMed] [Google Scholar]
- Saunders SE, & Levitt ES (2020). Kolliker-Fuse/Parabrachial complex mu opioid receptors contribute to fentanyl-induced apnea and respiratory rate depression. Respir Physiol Neurobiol, 275, 103388. doi: 10.1016/j.resp.2020.103388 [DOI] [PMC free article] [PubMed] [Google Scholar]
- Schafe GE, & Bernstein IL (1996). Forebrain contribution to the induction of a brainstem correlate of conditioned taste aversion: I. The amygdala. Brain Res, 741(1–2), 109–116. doi: 10.1016/s0006-8993(96)00906-7 [DOI] [PubMed] [Google Scholar]
- Schafe GE, & Bernstein IL (1998). Forebrain contribution to the induction of a brainstem correlate of conditioned taste aversion. II. Insular (gustatory) cortex. Brain Res, 800(1), 40–47. doi: 10.1016/s0006-8993(98)00492-2 [DOI] [PubMed] [Google Scholar]
- Schone C, Apergis-Schoute J, Sakurai T, Adamantidis A, & Burdakov D (2014). Coreleased orexin and glutamate evoke nonredundant spike outputs and computations in histamine neurons. Cell Rep, 7(3), 697–704. doi: 10.1016/j.celrep.2014.03.055 [DOI] [PMC free article] [PubMed] [Google Scholar]
- Schwaber JS, Kapp BS, Higgins GA, & Rapp PR (1982). Amygdaloid and basal forebrain direct connections with the nucleus of the solitary tract and the dorsal motor nucleus. J Neurosci, 2(10), 1424–1438. [DOI] [PMC free article] [PubMed] [Google Scholar]
- Schwaber JS, Sternini C, Brecha NC, Rogers WT, & Card JP (1988). Neurons containing calcitonin gene-related peptide in the parabrachial nucleus project to the central nucleus of the amygdala. J Comp Neurol, 270(3), 416–426, 398–419. doi: 10.1002/cne.902700310 [DOI] [PubMed] [Google Scholar]
- Segal M, & Sandberg D (1977). Analgesia produced by electrical stimulation of catecholamine nuclei in the rat brain. Brain Res, 123(2), 369–372. doi: 10.1016/0006-8993(77)90488-7 [DOI] [PubMed] [Google Scholar]
- Seguela P, Watkins KC, Geffard M, & Descarries L (1990). Noradrenaline axon terminals in adult rat neocortex: an immunocytochemical analysis in serial thin sections. Neuroscience, 35(2), 249–264. doi: 10.1016/0306-4522(90)90079-j [DOI] [PubMed] [Google Scholar]
- Shammah-Lagnado SJ, & Santiago AC (1999). Projections of the amygdalopiriform transition area (APir). A PHA-L study in the rat. Ann N Y Acad Sci, 877, 655–660. doi: 10.1111/j.1749-6632.1999.tb09295.x [DOI] [PubMed] [Google Scholar]
- Shin JW, Geerling JC, & Loewy AD (2008). Inputs to the ventrolateral bed nucleus of the stria terminalis. J Comp Neurol, 511(5), 628–657. doi: 10.1002/cne.21870 [DOI] [PMC free article] [PubMed] [Google Scholar]
- Shin JW, Geerling JC, Stein MK, Miller RL, & Loewy AD (2011). FoxP2 brainstem neurons project to sodium appetite regulatory sites. J Chem Neuroanat, 42(1), 1–23. doi: 10.1016/j.jchemneu.2011.05.003 [DOI] [PMC free article] [PubMed] [Google Scholar]
- Skofitsch G, & Jacobowitz DM (1985a). Calcitonin gene-related peptide: detailed immunohistochemical distribution in the central nervous system. Peptides, 6(4), 721–745. doi: 10.1016/0196-9781(85)90178-0 [DOI] [PubMed] [Google Scholar]
- Skofitsch G, & Jacobowitz DM (1985b). Quantitative distribution of calcitonin gene-related peptide in the rat central nervous system. Peptides, 6(6), 1069–1073. doi: 10.1016/0196-9781(85)90429-2 [DOI] [PubMed] [Google Scholar]
- Sugimoto T, Fujiyoshi Y, Xiao C, He YF, & Ichikawa H (1997). Central projection of calcitonin gene-related peptide (CGRP)- and substance P (SP)-immunoreactive trigeminal primary neurons in the rat. J Comp Neurol, 378(3), 425–442. doi: [DOI] [PubMed] [Google Scholar]
- Sun MK, & Reis DJ (1996). Excitatory amino acid-mediated chemoreflex excitation of respiratory neurones in rostral ventrolateral medulla in rats. J Physiol, 492 ( Pt 2), 559–571. doi: 10.1113/jphysiol.1996.sp021329 [DOI] [PMC free article] [PubMed] [Google Scholar]
- Sun RQ, Lawand NB, Lin Q, & Willis WD (2004). Role of calcitonin gene-related peptide in the sensitization of dorsal horn neurons to mechanical stimulation after intradermal injection of capsaicin. J Neurophysiol, 92(1), 320–326. doi: 10.1152/jn.00086.2004 [DOI] [PubMed] [Google Scholar]
- Tajti J, Uddman R, & Edvinsson L (2001). Neuropeptide localization in the “migraine generator” region of the human brainstem. Cephalalgia, 21(2), 96–101. doi: 10.1046/j.1468-2982.2001.00140.x [DOI] [PubMed] [Google Scholar]
- Takada M, Itoh K, Yasui Y, Mitani A, Nomura S, & Mizuno N (1984). Distribution of premotor neurons for the hypoglossal nucleus in the cat. Neurosci Lett, 52(1–2), 141–146. doi: 10.1016/0304-3940(84)90364-1 [DOI] [PubMed] [Google Scholar]
- Takeuchi Y, Uemura M, Matsuda K, Matsushima R, & Mizuno N (1980). Parabrachial nucleus neurons projecting to the lower brain stem and the spinal cord. A study in the cat by the Fink-Heimer and the horseradish peroxidase methods. Exp Neurol, 70(2), 403–413. doi: 10.1016/0014-4886(80)90037-0 [DOI] [PubMed] [Google Scholar]
- Tokita K, Inoue T, & Boughter JD Jr. (2010). Subnuclear organization of parabrachial efferents to the thalamus, amygdala and lateral hypothalamus in C57BL/6J mice: a quantitative retrograde double labeling study. Neuroscience, 171(1), 351–365. doi: 10.1016/j.neuroscience.2010.08.026 [DOI] [PMC free article] [PubMed] [Google Scholar]
- Toussay X, Basu K, Lacoste B, & Hamel E (2013). Locus coeruleus stimulation recruits a broad cortical neuronal network and increases cortical perfusion. J Neurosci, 33(8), 3390–3401. doi: 10.1523/JNEUROSCI.3346-12.2013 [DOI] [PMC free article] [PubMed] [Google Scholar]
- Travers JB, & Norgren R (1983). Afferent projections to the oral motor nuclei in the rat. J Comp Neurol, 220(3), 280–298. doi: 10.1002/cne.902200303 [DOI] [PubMed] [Google Scholar]
- Ungerstedt U (1971). Stereotaxic mapping of the monoamine pathways in the rat brain. Acta Physiol Scand Suppl, 367, 1–48. doi: 10.1111/j.1365-201x.1971.tb10998.x [DOI] [PubMed] [Google Scholar]
- van Rossum D, Hanisch UK, & Quirion R (1997). Neuroanatomical localization, pharmacological characterization and functions of CGRP, related peptides and their receptors. Neurosci Biobehav Rev, 21(5), 649–678. doi: 10.1016/s0149-7634(96)00023-1 [DOI] [PubMed] [Google Scholar]
- Varga AG, Reid BT, Kieffer BL, & Levitt ES (2020). Differential impact of two critical respiratory centres in opioid-induced respiratory depression in awake mice. J Physiol, 598(1), 189–205. doi: 10.1113/JP278612 [DOI] [PMC free article] [PubMed] [Google Scholar]
- Vertes RP, Hoover WB, Do Valle AC, Sherman A, & Rodriguez JJ (2006). Efferent projections of reuniens and rhomboid nuclei of the thalamus in the rat. J Comp Neurol, 499(5), 768–796. doi: 10.1002/cne.21135 [DOI] [PubMed] [Google Scholar]
- Walker DL, Toufexis DJ, & Davis M (2003). Role of the bed nucleus of the stria terminalis versus the amygdala in fear, stress, and anxiety. Eur J Pharmacol, 463(1–3), 199–216. doi: 10.1016/s0014-2999(03)01282-2 [DOI] [PubMed] [Google Scholar]
- Warfvinge K, & Edvinsson L (2019). Distribution of CGRP and CGRP receptor components in the rat brain. Cephalalgia, 39(3), 342–353. doi: 10.1177/0333102417728873 [DOI] [PubMed] [Google Scholar]
- Wiedenmann B, & Franke WW (1985). Identification and localization of synaptophysin, an integral membrane glycoprotein of Mr 38,000 characteristic of presynaptic vesicles. Cell, 41(3), 1017–1028. doi: 10.1016/s0092-8674(85)80082-9 [DOI] [PubMed] [Google Scholar]
- Williams JT, Egan TM, & North RA (1982). Enkephalin opens potassium channels on mammalian central neurones. Nature, 299(5878), 74–77. doi: 10.1038/299074a0 [DOI] [PubMed] [Google Scholar]
- Williams JT, North RA, & Tokimasa T (1988). Inward rectification of resting and opiate-activated potassium currents in rat locus coeruleus neurons. J Neurosci, 8(11), 4299–4306. [DOI] [PMC free article] [PubMed] [Google Scholar]
- Wolinsky TD, Carr KD, Hiller JM, & Simon EJ (1996). Chronic food restriction alters mu and kappa opioid receptor binding in the parabrachial nucleus of the rat: a quantitative autoradiographic study. Brain Res, 706(2), 333–336. doi: 10.1016/0006-8993(95)01337-7 [DOI] [PubMed] [Google Scholar]
- Woodhams PL, Roberts GW, Polak JM, & Crow TJ (1983). Distribution of neuropeptides in the limbic system of the rat: the bed nucleus of the stria terminalis, septum and preoptic area. Neuroscience, 8(4), 677–703. doi: 10.1016/0306-4522(83)90003-9 [DOI] [PubMed] [Google Scholar]
- Wouterlood FG, & Jorritsma-Byham B (1993). The anterograde neuroanatomical tracer biotinylated dextran-amine: comparison with the tracer Phaseolus vulgaris-leucoagglutinin in preparations for electron microscopy. J Neurosci Methods, 48(1–2), 75–87. doi: 10.1016/s0165-0270(05)80009-3 [DOI] [PubMed] [Google Scholar]
- Yamamoto T, Fujimoto Y, Shimura T, & Sakai N (1995). Conditioned taste aversion in rats with excitotoxic brain lesions. Neurosci Res, 22(1), 31–49. doi: 10.1016/0168-0102(95)00875-t [DOI] [PubMed] [Google Scholar]
- Yamamoto T, Shimura T, Sako N, Azuma S, Bai WZ, & Wakisaka S (1992). C-fos expression in the rat brain after intraperitoneal injection of lithium chloride. Neuroreport, 3(12), 1049–1052. doi: 10.1097/00001756-199212000-00004 [DOI] [PubMed] [Google Scholar]
- Yamamoto T, Shimura T, Sako N, Yasoshima Y, & Sakai N (1994). Neural substrates for conditioned taste aversion in the rat. Behav Brain Res, 65(2), 123–137. doi: 10.1016/0166-4328(94)90097-3 [DOI] [PubMed] [Google Scholar]
- Yamano M, Hillyard CJ, Girgis S, Emson PC, MacIntyre I, & Tohyama M (1988). Projection of neurotensin-like immunoreactive neurons from the lateral parabrachial area to the central amygdaloid nucleus of the rat with reference to the coexistence with calcitonin gene-related peptide. Exp Brain Res, 71(3), 603–610. doi: 10.1007/BF00248753 [DOI] [PubMed] [Google Scholar]
- Yasui Y, Breder CD, Saper CB, & Cechetto DF (1991). Autonomic responses and efferent pathways from the insular cortex in the rat. J Comp Neurol, 303(3), 355–374. doi: 10.1002/cne.903030303 [DOI] [PubMed] [Google Scholar]
- Yasui Y, Itoh K, Takada M, Mitani A, Kaneko T, & Mizuno N (1985). Direct cortical projections to the parabrachial nucleus in the cat. J Comp Neurol, 234(1), 77–86. doi: 10.1002/cne.902340106 [DOI] [PubMed] [Google Scholar]
- Yasui Y, Saper CB, & Cechetto DF (1989). Calcitonin gene-related peptide immunoreactivity in the visceral sensory cortex, thalamus, and related pathways in the rat. J Comp Neurol, 290(4), 487–501. doi: 10.1002/cne.902900404 [DOI] [PubMed] [Google Scholar]
- Yokota S, Kaur S, VanderHorst VG, Saper CB, & Chamberlin NL (2015). Respiratory-related outputs of glutamatergic, hypercapnia-responsive parabrachial neurons in mice. J Comp Neurol, 523(6), 907–920. doi: 10.1002/cne.23720 [DOI] [PMC free article] [PubMed] [Google Scholar]
- Yoshida A, Chen K, Moritani M, Yabuta NH, Nagase Y, Takemura M, & Shigenaga Y (1997). Organization of the descending projections from the parabrachial nucleus to the trigeminal sensory nuclear complex and spinal dorsal horn in the rat. J Comp Neurol, 383(1), 94–111. [PubMed] [Google Scholar]
- Zhang L, Hoff AO, Wimalawansa SJ, Cote GJ, Gagel RF, & Westlund KN (2001). Arthritic calcitonin/alpha calcitonin gene-related peptide knockout mice have reduced nociceptive hypersensitivity. Pain, 89(2–3), 265–273. doi: 10.1016/s0304-3959(00)00378-x [DOI] [PubMed] [Google Scholar]
Associated Data
This section collects any data citations, data availability statements, or supplementary materials included in this article.
Supplementary Materials
Data Availability Statement
The data that support the findings of this study are available from the corresponding author upon reasonable request.


