Abstract
Objective
We aimed to establish and evaluate a time series model for predicting the seasonality of acute upper gastrointestinal bleeding (UGIB).
Methods
Patients with acute UGIB who were admitted to the Emergency Department and Gastrointestinal Endoscopy Center of Guangdong Provincial Hospital of Traditional Chinese Medicine from January 2013 to December 2019 were enrolled in the present study. The incidence trend of UGIB was analyzed by seasonal decomposition method. Then, exponential smoothing model and autoregressive integrated moving average model (ARIMA) were used to establish the model and forecast, respectively.
Results
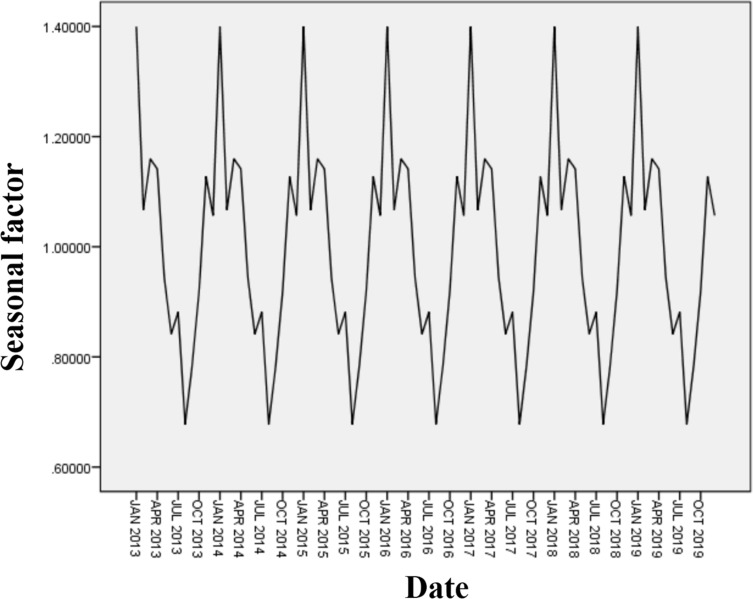
Finally, the exponential smoothing model with better fitting and prediction effect was selected. The smooth R2 was 0.586, and the Ljung-Box Q (18) statistic value was 22.272 (P = 0.135). The incidence of UGIB had an obvious seasonal trend, with a peak in annual January and a seasonal factor of 140%. After that, the volatility had gradually declined, with a trough in August and a seasonal factor of 67.8%. Since then, it had gradually increased.
Conclusion
The prediction effect of exponential smoothing model is better, which can provide prevention and treatment strategies for UGIB, and provide objective guidance for more medical staff in Emergency Department and Gastrointestinal Endoscopy Center during the peak period of UGIB.
Keywords: acute upper gastrointestinal bleeding, time series model, exponential smoothing model, autoregressive integrated moving average model, seasonality, incidence trend
Introduction
Acute upper gastrointestinal bleeding (UGIB) is one of the most common clinical acute and critical illnesses. Patients with UGIB often present with hematemesis and melena.1 If not diagnosed and treated in time, it may be life-threatening. The common causes of UGIB include peptic ulcer, rupture of esophageal and gastric varices, upper gastrointestinal tumor, gastric cardia mucosal tear, vascular malformation, etc. Wang et al reviewed the epidemiological trend of upper gastrointestinal bleeding in China in the past 15 years and found that peptic ulcer bleeding was the most important cause of UGIB (52.7%), followed by esophageal and gastric varices (15.1%) and malignant tumors (9.2%).2
Moreover, scholars at home and abroad have found that temperature and solar terms have a certain impact on UGIB. Lin Ping and others found that the incidence of UGIB was concentrated in solar terms, with the peak period from the summer heat in the previous year to the spring equinox of the year, and was positively correlated with the temperature difference.3 Prechter et al analyzed 5310 cases of UGIB and found that lower ambient temperature and the daytime temperature difference were related to esophageal-gastric varices bleeding, while ulcer bleeding was related to changes in air pressure.4 Correlation analysis, logistic regression, Poisson regression and other statistical methods were used to analyze the relationship between weather and UGIB in previous study. However, the incidence frequency of UGIB changes with time, with clear chronological order and long-term changes. Therefore, in this study, we innovatively used time series models to analyze and predict the seasonal changes and trends of the incidence of UGIB.
Subjects and Methods
Subjects
Patients with acute UGIB who were admitted to the Emergency Department and Gastrointestinal Endoscopy Center of Guangdong Provincial Hospital of Traditional Chinese Medicine from January 2013 to December 2019 were enrolled in the present study. Among them, the data of patients admitted from January 2013 to June 2019 are used for modeling, and the data of patients admitted from July to December 2019 are used as an internal verification set to evaluate the prediction effect of the model. This study was approved by the ethics committee of the Second Affiliated Hospital of Guangzhou University of Traditional Chinese and complied with the guidelines outlined in the declaration of Helsinki were followed. The written consent was received from all participants.
Modeling
Time series modeling is widely used in the field of econometrics and infectious diseases. In this study, seasonal decomposition and modeling prediction are mainly used. A time series may contain four kinds of information, including long-term trend, cyclical trend, seasonal change and irregular change. The basic idea of seasonal decomposition is to remove seasonal changes from the variation of the original time series, and generate a sequence composed of the remaining three parts to meet further analysis requirements.5 The modeling of time series focuses on the development and change of variables in terms of time. The modeling methods mainly include exponential smoothing model and Ljung-Box Q (18), also known as autoregressive integrated moving average model (ARIMA). The exponential smoothing model used in our study adopts the weighted average of the past values of the time series to predict the future value, and assigns a greater weight to the recent data in the time series and a smaller weight to the long-term data.6 The seasonal ARIMA model is expressed as SARIMA (p, d, q) (P, D, Q) s model, where p is the order of autoregression, q is the order of moving average, d is the difference number of stationarity, P and Q are the order of seasonal autoregression and moving average, D is the number of seasonal difference, and s is the seasonal period.7 In this study, the value of S is 12, which means that 12 months is a cycle of data. The values of the other parameters are subjective, with the range of 0–2. We tried repeated combinations, and finally selected the combination with the highest stable R2 as the final model.
Statistical Methods
The time series prediction module of SPSS 24.0 software was used for analysis. The analysis steps were as follows. (1) The original sequence was decomposed seasonally, multiplication model was selected, and “endpoint weighted by 0.5” was selected as moving average weight; (2) The original sequence is smoothed, and the autocorrelation and partial correlation of the difference sequence are made; (3) The exponential smoothing model and SARIMA model are established respectively to select the best model; (4) The fitting effect of the model was evaluated; (5) The prediction effect of the model was evaluated.
Results
Original Sequence and Seasonal Decomposition
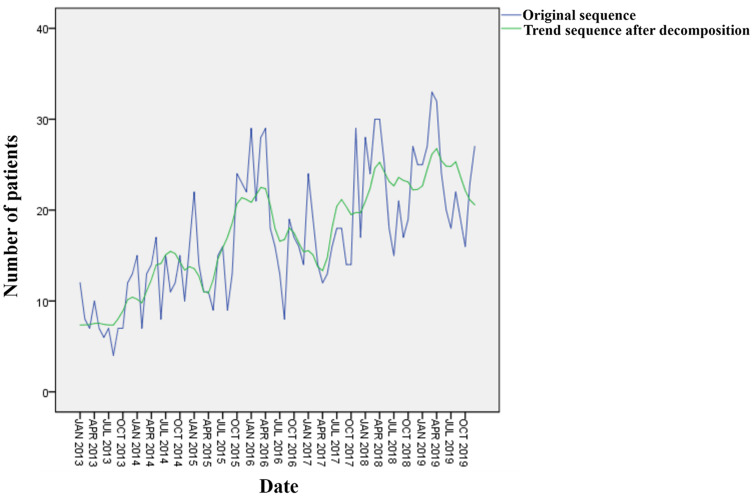
As shown in Figure 1, the line with larger fluctuations was the original sequence. The line with smaller fluctuations was the growth trend sequence after removing seasonal changes, cyclic trends and irregular changes, and the range of fluctuation in the sequence had become relatively gentle. The trend of the two sequences was upward growth, which showed that the number of UGIB patients in our hospital is increasing year by year. The number of patients increased from 5–10 per month in 2013 to 15–30 in 2019, which is related to the gradual maturity of emergency endoscopic technology and the growth of business volume in our hospital. The original sequence did not fluctuate around a certain average value, which indicated that the sequence was a non-stationary sequence. Moreover, as shown in Figure 2, the seasonal factor sequence diagram reflected the trend of the number of UGIB patients admitted each month. The peak was January every year with the seasonal factor of 140%. After that, the trend gradually fluctuated and decreased. August was the trough with the seasonal factor of 67.8%. The incidence trend from August to December raised gradually again. The results suggested that the incidence of UGIB had obvious seasonal changes.
Figure 1.
Original sequence and trend sequence after decomposition.
Figure 2.
Sequence of seasonal factors.
Stable Processing
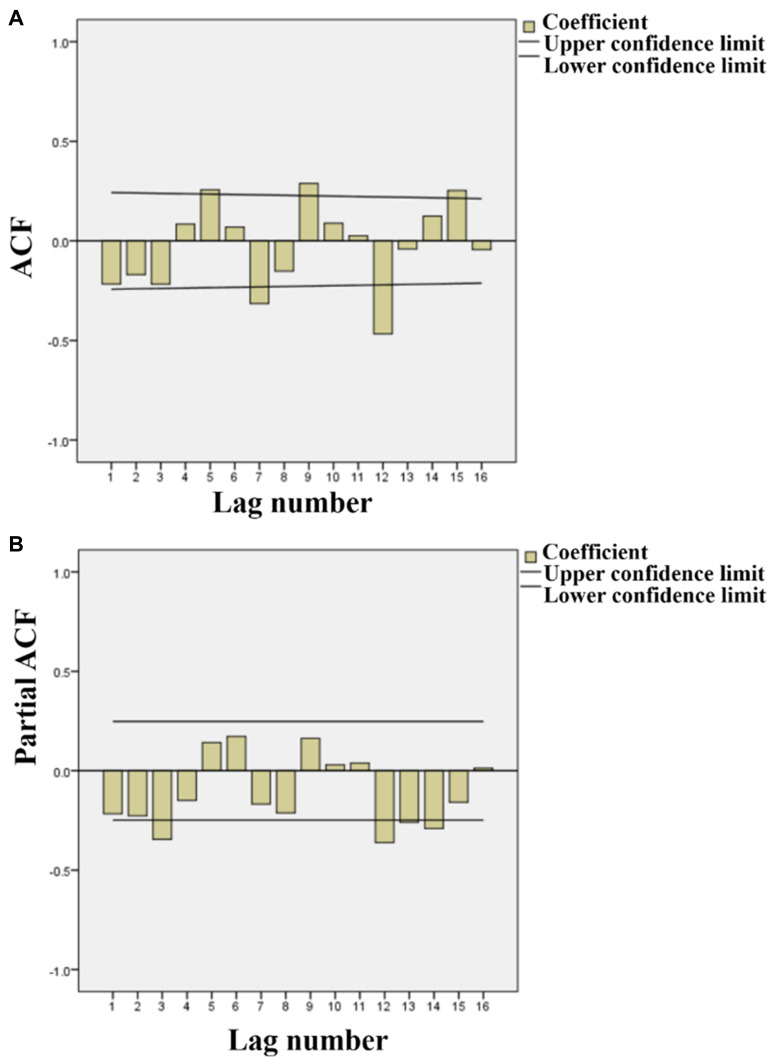
The original sequence needed to be smoothed before modeling and forecasting. First-order difference and first-order seasonal difference were used to obtain autocorrelation graph and partial autocorrelation graph (Figure 3). The autocorrelation diagram showed that the autocorrelation coefficient of the sequence was always small. From the first order, it fluctuated within the bounds of the confidence interval, and was always controlled within 2 times the standard deviation range. It can be considered that the series fluctuated around the zero axis from beginning to end, which was the characteristic of autocorrelation graph usually possessed by stationary time series with strong randomness.
Figure 3.
Autocorrelation graph and partial correlation graph after difference of original sequence. (A) Autocorrelation graph; (B) partial correlation graph.
Establish and Screen Model
The smooth R2 of 0.586, and the Ljung-Box Q (18) statistic value was 22.272 in exponential smoothing model (P = 0.135), which indicated that the residuals were independent of each other, there was no autocorrelation, and the model had no outliers (Table 1). In the process of establishing SARIMA model, the best fitting model was SARIMA (0,1,1) (1,1,0) after exploring the model parameters for many times. Its stable R2 was only 0.457, which was not as good as exponential smoothing model. Finally, the exponential smoothing model was selected.
Table 1.
Comparison of Fitting Effect Between Exponential Smoothing Model and SARIMA Model
| Models | Stable R2 | Ljung-Box Q (18) | Significance | Number of Outliers |
|---|---|---|---|---|
| Exponential smoothing model | 0.586 | 22.272 | 0.135 | 0 |
| SARIMA (0,1,1) (1,1,0) | 0.457 | 12.581 | 0.703 | 0 |
Model Fitting and Prediction
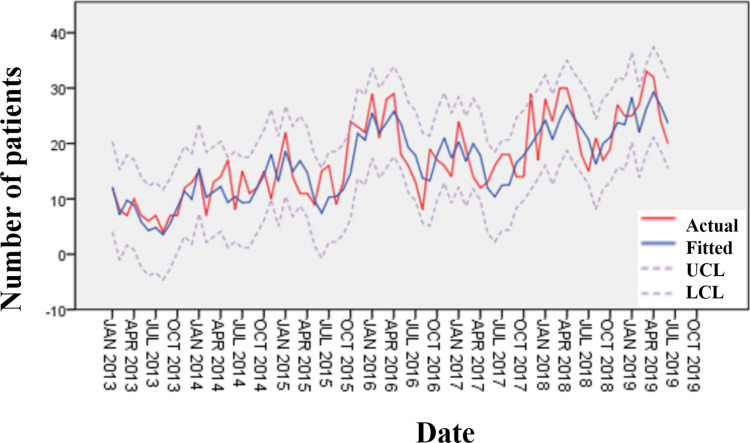
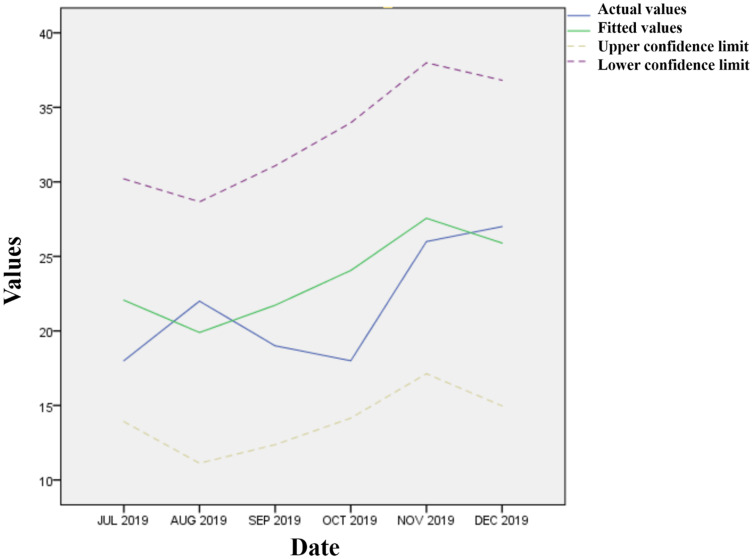
As shown in Figure 4, the two curves of the fitted value and the measured value were relatively close, indicating that the model had a better fitting ability. Figure 5 sshowsthat the predicted values all were within the 95% confidence interval. However, in October, the predicted values were higher than the actual values, which may be because the National Day holiday affected patients’ willingness to go to hospital.
Figure 4.
Fitting graph of the number of patients with UGIB from January 2013 to June 2019.
Figure 5.
Forecast graph of the number of patients with UGIB from July 2019 to December 2019.
Discussion
With the continuous in-depth study of time medicine, people gradually realize that time is closely related to disease, treatment, and death. There have been many studies at home and abroad to explore the relationship between climate factors and the incidence of UGIB. Ping et al found that the incidence of UGIB was positively correlated with poor temperature (r=0.799, P<0.01), and it was more likely to occur during heavy snow. Moreover, the incidence of UGIB was negatively correlated with minimum temperature, average temperature, maximum temperature, precipitation, and rainy days (r = −0.832, −0.823, −0.758, −0.600 and −0.503, respectively; P<0.05).3 Zhiquan et al found that there are significant differences in the incidence of UGIB between seasons and solar terms (P<0.05).8 The incidence is more frequent in winter and spring than in summer and autumn. The incidences in Awakening from Hibernation, Qingming, Grain Rain, Frost’s Descent, Beginning of Winter, and Scouther are more frequent.
Correlation analysis has showed that the incidence of UGIB is positively correlated with mean atmospheric pressure (r = 0.719, P = 0.008), and negatively correlated with average human comfort index (r = −0.727, P = 0.007). Jiaping et al also have found that the occurrence of esophagogastric variceal bleeding is associated with air pressure and temperature, but without humidity, wind speed, precipitation and sunshine time.9 Jian et al have established the equation through linear regression, in which the monthly incidence of UGIB = - 1211.401 + 0.349 × monthly average temperature + 1.254 × monthly average atmospheric pressure.10 In foreign countries, Lenzen et al also have found that UGIB has seasonal and circadian distribution differences, and its incidence is increased in winter and night.11 Through retrospective logistic regression analysis, Tahri et al also have found that esophagogastric variceal bleeding occurs most frequently in winter (OR = 3.2; 95% CI = 1.6–6.54), and stormy weather is also an independent factor, with (OR=13.4; 95% CI = 1.5–118.5).12 A study that includes 348,958 patients hospitalized with esophagogastric variceal bleeding over the past decade in the USA also has reached a similar conclusion, that is, there are seasonal changes in the incidence and mortality of variceal bleeding.13 December is the month with the highest number of daily hospitalizations, and June is the lowest one. These studies mostly use correlation analysis and multivariate logistic regression.
In the present study, we innovatively used a time series model to analyze the number of UGIB patients admitted to our hospital. Through seasonal decomposition, we have found that the incidence trend of UGIB has obvious seasonality. It is the peak in annual January, and then the trend gradually fluctuates and declines. August is the trough, and the incidence trend fluctuates and rises again from August to December.
Traditional Chinese medicine believes that exogenous pathogenic factors and meteorological factors are inseparable, and the exogenous pathogenic factors of UGIB have been paid more and more attention. The most influential meteorological factors on human body are temperature and atmospheric pressure. It has been reported that the onset of UGIB may also be related to the rhythm of solar terms and months.14 However, we have found that the incidence of UGIB is only related to months, which may be related to the change of temperature in different months. Different from the climate of the provinces and cities in northern China, the alternation of autumn and winter is not obvious in Guangzhou City. The temperature begins to drop sharply in January every year and the temperature difference is large.15 Lower temperature can lead to poor blood flow, aggravate the pathological changes of bleeding and increase the incidence of UGIB.16,17 Moreover, patients with UGIB often have underlying diseases with a long course of disease. Cold season can damage the spleen and stomach, so the incidence of acute hemorrhage increases.8
Time series is a mathematical model established according to the change regularities of historical data with time, with high short-term forecast accuracy.18 The exponential smoothing model and the ARIMA model are based on completely different theories.19 The former tends to be a malleable forecast, and it is difficult to adapt to sudden upward or downward trends. The latter focuses on forecasting, it has relatively high requirements for the stability of the data, and it also needs to evaluate the lag order.20 This study compared the fitting effect of exponential smoothing model and ARIMA model. The fitting effect index of stable R2 was 0.586, and the statistical value of Ljung box Q (18) was 22.272 (P = 0.135), indicating that the prediction accuracy of the model was higher. This may be because the seasonal fluctuation of data is more stable, which is more suitable to use exponential smoothing model for modeling. For the prediction effect of the model, we took the data from July 2019 to December 2019 as the internal verification, and the predicted values were within the range of 95% CI, which further indicated that the prediction effect of the model is better.
This study also has some limitations. First of all, this study is a single-center study, and the research subjects are all residents of Guangzhou and its vicinity. Our conclusion cannot be generalized to regions with different geography and climate environment. In the future, we can perform a multi-center and large-sample research. Secondly, only the number of UGIB cases in our hospital was collected as univariate analysis of time series. This study failed to further include more meteorological conditions such as temperature, humidity, and pressure at that time, and it can only indirectly speculate that the incidence of UGIB is related to temperature changes. In the future, relevant meteorological data can be further collected for Granger causality test.
Conclusion
In conclusion, the time series model has great application value in the seasonal incidence trend analysis and incidence prediction effect of UGIB. The prediction effect of exponential smoothing model is better, which can provide prevention and treatment strategies for UGIB, and provide objective guidance for more medical staff in Emergency Department and Gastrointestinal Endoscopy Center during the peak period of UGIB.
Ethical Statement
This study was approved by the ethics committee of the Second Affiliated Hospital of Guangzhou University of Traditional Chinese and complied with the guidelines outlined in the declaration of Helsinki were followed. The written consent was received from all participants. We confirm that all patients were informed about the purpose of the study.
Disclosure
The authors report no conflicts of interest in this work.
References
- 1.Emergency physicians branch of Chinese Medical Association. Expert consensus on emergency diagnosis and treatment process of acute upper gastrointestinal bleeding. Emerg Med China. 2015;35:873. [Google Scholar]
- 2.Wang J, Cui Y, Wang J, et al. Clinical epidemiological trend of upper gastrointestinal bleeding in 15 years. Chin J Gastrointest Surg. 2017;20(4):425–431. [PubMed] [Google Scholar]
- 3.Ping L, Xiaoyan H, Qiang Z, et al. Clinical reanalysis of the influence of temperature and solar term on upper gastrointestinal bleeding. J Guangzhou Univ Trad Chin Med. 2007;1:5–8, 16. [Google Scholar]
- 4.Prechter F, Bürger M, Lehmann T, et al. A study on the correlation of gastrointestinal bleeding and meteorological factors–is there a weather condition for GI bleeding? Z Gastroenterol. 2019;57(12):1476–1480. doi: 10.1055/a-1008-9863 [DOI] [PubMed] [Google Scholar]
- 5.Wei WWS. Time series analysis. In: Little TD, Editor. The Oxford Handbook of Quantitative Methods in Psychology; Oxford, UK: Oxford University Press; 2006. [Google Scholar]
- 6.De Livera AM, Hyndman RJ, Snyder RD. Forecasting time series with complex seasonal patterns using exponential smoothing. J Am Stat Assoc. 2011;106(496):1513–1527. doi: 10.1198/jasa.2011.tm09771 [DOI] [Google Scholar]
- 7.Lee YS, Tong LI. Forecasting time series using a methodology based on autoregressive integrated moving average and genetic programming. Knowl Based Syst. 2011;24(1):66–72. doi: 10.1016/j.knosys.2010.07.006 [DOI] [Google Scholar]
- 8.Zhiquan F, Caijuan H, Chunxia L, et al. Rhythm of acute upper gastrointestinal hemorrhage and its correlation with meteorology. Chin Trad Med Sci Technol. 2013;06:5–9. [Google Scholar]
- 9.Jiaping X, Jingrun Z, Ruiying S, et al. Seasonal onset of esophageal and gastric variceal bleeding and the influence of related meteorological factors. Chin J Gastroenterol. 2011;31(4):271–273. [Google Scholar]
- 10.Jian L, Baihua H, Yuqin L, et al. Correlation between upper gastrointestinal bleeding and seasonal variation and meteorological factors. Chin J Clin. 2015;4:581–584. [Google Scholar]
- 11.Lenzen H, Musmann E, Kottas M, et al. Acute gastrointestinal bleeding cases presenting to the emergency department are associated with age, sex and seasonal and circadian factors. Eur J Gastroenterol Hepatol. 2017;29(1):78–83. doi: 10.1097/MEG.0000000000000752 [DOI] [PubMed] [Google Scholar]
- 12.Tahri N, Amouri A, Fekih H, et al. Meteorologic conditions and esophageal varices rupture. Ann Med Interne. 2003;154(8):509–514. [PubMed] [Google Scholar]
- 13.Siddiqui MT, Bilal M, Haq KF, et al. Seasonal impacts on the incidence of esophageal variceal hemorrhage: a nationwide analysis across a decade. Clin Endosc. 2019. doi: 10.5946/ce.2019.094 [DOI] [PMC free article] [PubMed] [Google Scholar]
- 14.Caijuan H, Zhiquan F, Zhen L, et al. Research progress on correlation between acute upper gastrointestinal bleeding and TCM time phase and meteorology. Chin J Trad Chin Med. 2012;08:159–162. Chinese. [Google Scholar]
- 15.Xiaoyan L, Zhaolan Z, Jie H, et al. Analysis of the relationship between TCM syndrome types of upper gastrointestinal bleeding and temperature and solar term changes. Journal of Emergency in Traditional Chinese Medicine,2012;21(3):370. Chinese. [Google Scholar]
- 16.Shuqing S. Syndrome differentiation and treatment of upper gastrointestinal bleeding. Chin Med Emerg. 2014;23(6):1135–1136. Chinese. [Google Scholar]
- 17.Liu Y. Pathogenesis of upper gastrointestinal bleeding in traditional Chinese medicine. Heilongjiang Trad Chin Med. 2006;3:4–5. Chinese. [Google Scholar]
- 18.Li Q, Guo NN, Han ZY, et al. Application of an autoregressive integrated moving average model for predicting the incidence of hemorrhagic fever with renal syndrome. Am J Trop Med Hyg. 2012;87(2):364–370. doi: 10.4269/ajtmh.2012.11-0472 [DOI] [PMC free article] [PubMed] [Google Scholar]
- 19.Peng W, Ying P, Xiaobing Y. Application of ARIMA model and Holt winters exponential smoothing model in prediction of influenza like cases in Wuhan. Mod Prev Med. 2018;45(3). Chinese. [Google Scholar]
- 20.Zhixing P, Changjun B, Yang Z, et al. Arima product seasonal model and its application in prediction of infectious diseases. Math Stat Manag. 2008;27(2):362. Chinese. [Google Scholar]


