

Abstract
Introduction: Iron deficient erythropoiesis and Thalassaemia are both associated with microcytic erythropoiesis albeit from different pathological mechanisms. Given the high prevalence of Hemoglobinopathies in the Mediterranean region, discriminating these two conditions is important. Several algorithms using conventional red cell indices have been developed to facilitate diagnosis, however, their diagnostic accuracy is low. The new generation haematology analyzers enabled the use of more innovative parameters such as reticulocyte parameters. We aimed to evaluate the diagnostic performance of the reticulocyte parameters on the Sysmex XN 1000 to distinguish between IDA and Thalassemia in our population. Methods: We performed a retrospective analysis of blood samples sent to our laboratory for haemoglobin electrophoresis screening. We categorized our cohort into Thalassemia and Iron Deficient patients based on known diagnostic criteria. We analyzed the reticulocyte parameters using receiver operator curve analysis (ROC) and determined the cut off value for each parameter. Results: Reticulocyte parameters most accurate for discriminating IDA from Thalassemia patients was: RET, RET-HE and IRF. The RET-HE had the best statistical significance for IDA patients with AUC = 0.69 for cut off 22.25. The RET-HE for dual positive patients was more accurate with AUC = 0.78 for cut off 21.25. The IRF had the best statistical significance for Alpha Thalassemia with AUC = 0.66 for cut off value 18. Conclusion: An IRF cut off below 15.5 and RET-HE cut off below 22.25 was the most accurate variable in predicting IDA with a sensitivity of 59.4% and 68.3%.
Keywords: Reticulocyte haemoglobin concentration, thalassaemia, iron deficiency anaemia, sysmex XN 1000
Introduction
Anemia is a global public health problem which affects 1.62 billion people according to the World Health Organization WHO with approximately 50% due to Iron Deficiency related to diet, women with increased menstrual loss, pregnancy and in young children [1]. In Saudi Arabia, the overall country prevalence of Iron Deficiency anemia is 30-56% [2].
Hemoglobinopathies due to a genetic disorder of hemoglobin synthesis occurs in approximately 7% of the world population with a high prevalence in Middle Eastern Regions and Africa [3-6]. In particular, Saudi Arabia has one of the highest prevalence’s of Alpha and Beta Thalassaemia in the world with 0.4% in the northern region and 5.9% in the eastern region [7].
Iron deficiency anemia (IDA) and Thalassemia are both associated with microcytic erythropoiesis albeit from different pathological mechanisms. Given the high prevalence of hemoglobinopathies in Mediterranean, Africa and Asian areas, discriminating these two conditions is of paramount importance to avoid unnecessary iron therapy or development of hemosiderosis. Several algorithms using conventional red cell indices have been developed to facilitate discrimination of these two diseases. However, several reports using these algorithms have shown appropriate classification in only 30-40% of cases [8]. Evaluation of new diagnostic algorithms which incorporates reticulocyte parameters demonstrated better performance compared to conventional algorithms increasing sensitivities to 70% [9-11]. However, none of the algorithms reported 100% sensitivity and 100% specificity in discriminating IDA and Thalassemia patients. Discriminating microcytic anemias where hemoglobinopathies are prevalent remains a challenge.
DNA analysis is currently the state of the art for diagnosing Alpha Thalassaemia, however this diagnostic analytical system is not currently available in our laboratory and also would be further time consuming where a rapid diagnosis is required for mandatory screening programmes in Saudi Arabia. We, therefore have to rely on high through put analyzers such as the Sysmex series.
The Sysmex XN 1000 evaluates reticulocytes by calculating their fraction, the immature reticulocyte fraction (IRF) and their hemoglobin content, the reticulocyte hemoglobin content (RET-HE). The use of these reticulocyte parameters have been largely limited to diagnosis and management of anemia’s in the bone marrow transplant setting and in monitoring of iron replacement or erythropoietin in therapy. However, there is a paucity of data in the literature which evaluates the diagnostic accuracy of reticulocyte parameters in discriminating IDA and Thalassemia. To the best of our knowledge, no such data has been reported from our region.
Objectives
Our objective was to test the diagnostic performance of the reticulocyte parameters (Reticulocyte count (RET), immature reticulocyte fraction (IRF) and reticulocyte hemoglobin content (RET-HE)) measured on the Sysmex XN 1000 to screen and discriminate IDA and Thalassemia patients in our region where the prevalence of hemoglobinopathies is high.
Materials/study samples
This study is a retrospective analysis of samples sent to the Central Military Laboratory and Blood Bank laboratory at Prince Sultan Military Medical City, Riyadh, Kingdom of Saudi Arabia for detection of hemoglobinopathies. We collected 446 EDTA full blood samples from patients 6 months or older between the period March 2019 and October 2019. We collected the samples from the routine samples sent to laboratory for assessment. The primary reasons for referral were to exclude IDA or Thalassemia. All our samples are scanned and processed immediately on arrival to our laboratory to ensure that all pre analytical variations are minimized. Samples are drawn by dedicated Haematology nursing staff and sent to the laboratory by pneumatic tube systems. Table 1 shows the inclusion and exclusion criteria.
Table 1.
Inclusion criteria for IDA and Thalassemia patients
| Red Cell Parameter | Iron Deficiency Anemia (IDA) diagnostic criteria | Thalassemia diagnostic criteria |
|---|---|---|
| Hemoglobin (HB) | < 13 g/dl males and < 12 g/dl females (WHO) | < 13 g/dl males and < 12 g/dl females (WHO) |
| Red Cell Count (RCC) | < 5.0 × 10^12/l | > 5.0 × 10^12/l |
| Mean Cell Volume (MCV) | < 80 fl | < 80 fl |
| Mean Cell Hemoglobin (MCH) | < 24 pg | Not applicable |
| Mean Cell Hemoglobin Concentration (MCHC) | < 31 pg | Not applicable |
| Ferritin levels | < 12 ng/ml females, < 15 ng/ml males | > 12 ng/ml |
| HBA2 | < 2.2% | > 3.5% for Beta Thalassemia |
| Mentzer Index (MI): MCV/RCC | > 13 | < 13 for Alpha Thalassemia |
We selected all patients with microcytic anemia fulfilling the criteria of IDA or Thalassemia. Reference: Mentzer Index < 13, HBA2 < 2.2, Ferritin levels < 12 ng/ml females, < 15 ng/ml males (Table 1).
We excluded all samples with spurious red cell indices (incorrect red cell indices due to failed quality control samples) and newborn samples due to inaccuracy of new born samples for Hemoglobinopathies. Samples with normal capillary electrophoresis were classified as no Hemoglobinopathies. The study was approved by the Institutional Review Board IRB #HP-01-R079.
Methods
Blood samples collected into EDTA test tubes were analyzed on the SYSMEX XN 1000 Hematology analyzer (Sysmex Corporation, Kobe, Japan). For each sample we obtained HB, RCC, MCV, MCH, MCHC, RDW, RET (reticulocyte count), IRF (immature reticulocyte fraction) and RET-HE (reticulocyte hemoglobin content).
The SYSMEX XN 1000 evaluates the maturation of reticulocytes by quantitating the fraction of reticulocytes within low-middle and high fluorescence intensity regions. The IRF is the sum of the fraction of high-fluorescence plus middle-fluorescence. The mean forward light scatter intensity of stained reticulocytes (RET-HE) is measured in the reticulocyte channel of the Sysmex XN 1000 (Sysmex Corporation, Kobe, Japan) analyzer. Internal and external quality control schemes were adhered to at all stages of processing.
Sebia Capillary electrophoresis (Exry, France) was performed on all samples sent to the laboratory for hemoglobin electrophoresis testing. The parameters obtained are HBA, HBA2, HBF and variants. A HBA2 between 1.5-3.5% was accepted as normal. HBA2 > 3.5% was considered as Beta Thalassemia if no other abnormal hemoglobin was found. The Mentzer Index (MCV/RCC) < 13 was regarded as Alpha Thalassemia.
Serum ferritin levels were determined on a routine chemo luminescence analyzer (chemo luminescence immunoassay; Advia Centaur, Siemans, Tarrytown, NY, USA). A serum ferritin below 15 and 12 ng/ml for males and females respectively indicated IDA.
Statistical analysis
Statistica 13.5 software programme in R was used for analysis. The data was expressed as medians and mean ± standard deviations. The measurement of uncertainty was 2 standard deviations.
Correlation analysis was performed using Pearson’s or Spearman’s correlation coefficient. The differences between each of the groups were compared by t-test or Mann-Whitney U test. Receiver operating characteristics (ROC) curve analysis was performed using the p ROC library in R to evaluate the diagnostic efficiency of the reticulocyte parameters and to determine the best cutoff values for the discrimination of IDA, Alpha and Beta Thalassemia trait and dual positive (IDA + Alpha Thalassemia) patients. A p value of less than 0.05 was considered to be statistically significant.
Results
Data collection
We collected a total of 440 patients, 280 females and 160 males with a median age 23 years. A total of 143 patients had IDA, 167 patients had Alpha Thalassemia and 69 patients had Beta Thalassemia. A total of 61 patients had normal capillary electrophoresis and normal ferritin levels. This group which showed normal capillary electrophoresis was regarded as the control group or negative for IDA/Thalassemia group.
Correlation analysis
Correlation analysis of the reticulocyte parameters showed that, RET-HE had strong positive correlations with the IDA group (r value: 0.7) (p value < 0.01). There was a weak positive correlation of RET-HE in Thalassemia patients (r value: 0.07). The IRF had a weak positive correlation with the Mentzer Index < 13 for Thalassemia patients (r value: 0.29) and poor correlation with MCH < 24 (IDA patients) (r value: 0.03). The RET showed a moderate positive correlation in both Thalassemia and IDA patients (r value: 0.41 and 0.26 respectively).
Analysis of variants
Analysis of variances showed statistically significant values for all reticulocyte parameters. The RET, IRF and RET-HE mean was lowest in the IDA group compared to the Thalassemia groups. RET-HE mean value was below normal mean in IDA patients and in Alpha Thalassemia patients. Dual positive patients (IDA + Alpha Thalassemia) had the lowest RET-HE mean values compared to all groups. The IRF mean values in Alpha Thalassemia patients was significantly lower than patients with no Alpha Thalassemia, IDA patients, Beta Thalassemia and dual positive (IDA + Alpha Thalassemia) patients. The RET in Beta Thalassemia patients was significantly above mean values compared to both IDA patients and Alpha Thalassemia patients (Table 2).
Table 2.
Reticulocyte parameter mean values in IDA and Thalassemia patients and t-test p values indicating differences between positive and negative for each parameter (p value < 0.05 statistically significant)
| Reticulocyte Parameters | IDA | P-Value | Alpha Thal | P-Value | Beta Thal | P-Value | Dual positive (IDA + Alpha Thal) patients | P-Value |
|---|---|---|---|---|---|---|---|---|
| Reticulocyte Hemoglobin content (RET-HE) | 21.7 | 0.00 | 22.32 | 0.01 | 23.04 | 0.7 | 20.5 | 0.00 |
| Immature Reticulocyte Fraction (IRF) | 19.58 | 0.97 | 15.17 | 0.00 | 26.51 | 0.00 | 18 | 0.32 |
| Reticulocyte count (RET) | 1.76 | 0.00 | 1.49 | 0.00 | 4.33 | 0.08 | 1.7 | NA |
Receiver operator analysis (ROC)
To determine the diagnostic accuracy for each parameter, receiver operator analysis (ROC) curves were plotted and the AUC (area under the curve) for each reticulocyte parameter in the different groups was applied to establish an optimal cut off value.
All studied parameters showed an AUC > 0.4. The RET-HE was the most sensitive parameter for detecting IDA patients (AUC = 0.69, sensitivity = 68.3% and specificity = 62.9%) and dual positive (IDA + Alpha Thalassemia) patients (AUC = 0.7, sensitivity = 74.2% and specificity = 57.4%). The RET (AUC = 0.69, sensitivity = 54.5%, specificity = 77.2%) and IRF (AUC = 0.66, sensitivity = 54.5%, specificity = 70.7%) was the most sensitive parameters for detecting Alpha Thalassemia. The RET (AUC = 0.75, sensitivity = 63.8%, specificity = 78.5%) and the IRF (AUC = 0.68, sensitivity = 65.2%, specificity = 64.5%) was the most sensitive and specific parameters for Beta Thalassemia diagnosis. The cut off values for all reticulocyte parameters (RET, IRF and RET-HE) was higher for Thalassemia (both Alpha and Beta) patients compared to IDA patients (Table 3). The RET-HE cut off value was the best discriminator for IDA and dual positive (IDA + Alpha Thalassemia) patients. IDA patients also had the lowest cut off value for IRF compared to other groups (Figures 1, 2 and 3).
Table 3.
Reticulocyte parameters showing sensitivity, specificity, AUC and cut off values in IDA, Alpha/Beta Thalassemia and Dual positive (IDA + Alpha Thalassemia) patients
| Reticulocyte parameter | Iron deficiency Anemia | Alpha Thalassemia | Beta Thalassemia | Dual positive patients (IDA + Alpha Thalassemia) |
|---|---|---|---|---|
| Reticulocyte count (RET) | Sensitivity = 54.1% | Sensitivity = 54.5% | Sensitivity = 63.8% | NA |
| Specificity = 58% | Specificity = 77.2% | Specificity = 78.5% | ||
| AUC = 0.58 | AUC = 0.69 | AUC = 0.75 | ||
| Cut-off = 1.54 | Cut-off = 1.67 | Cut-off = 2.06 | ||
| Immature Reticulocyte Fraction (IRF) | Sensitivity = 59.4% | Sensitivity = 54.5% | Sensitivity = 65.2% | Sensitivity = 51.9% |
| Specificity = 50.2% | Specificity = 70.7% | Specificity = 64.5% | Specificity = 55.3% | |
| AUC = 0.54 | AUC = 0.66 | AUC = 0.68 | AUC = 0.48 | |
| Cut-off = 15.15 | Cut-off = 18 | Cut-off = 19.7 | Cut-off = 16.75 | |
| Reticulocyte hemoglobin content (RET-HE) | Sensitivity = 68.3% | Sensitivity = 46.2% | Sensitivity = 46.4% | Sensitivity = 74.2% |
| Specificity = 62.9% | Specificity = 62.9% | Specificity = 61% | Specificity = 57.4% | |
| AUC = 0.69 | AUC = 0.56 | AUC = 0.51 | AUC = 0.7 | |
| Cut-off = 22.25 | Cut-off = 23.85 | Cut-off = 22.15 | Cut-off = 21.25 |
Figure 1.
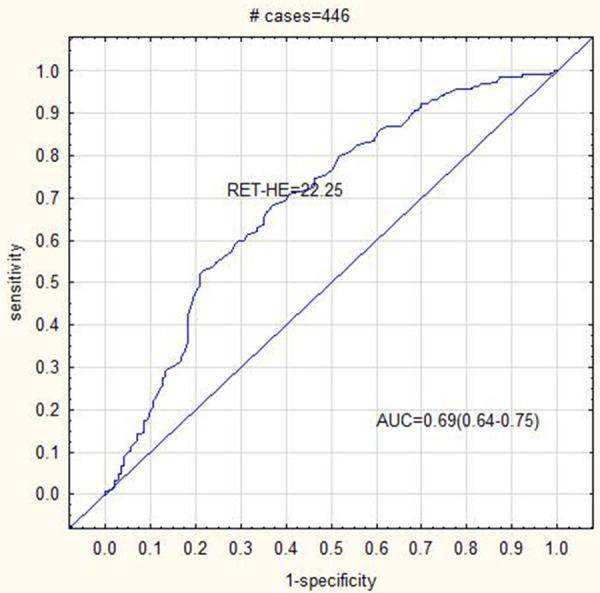
ROC curve analysis showing AUC = 0.69 for RET-HE cut off 22.25 in IDA patients.
Figure 2.
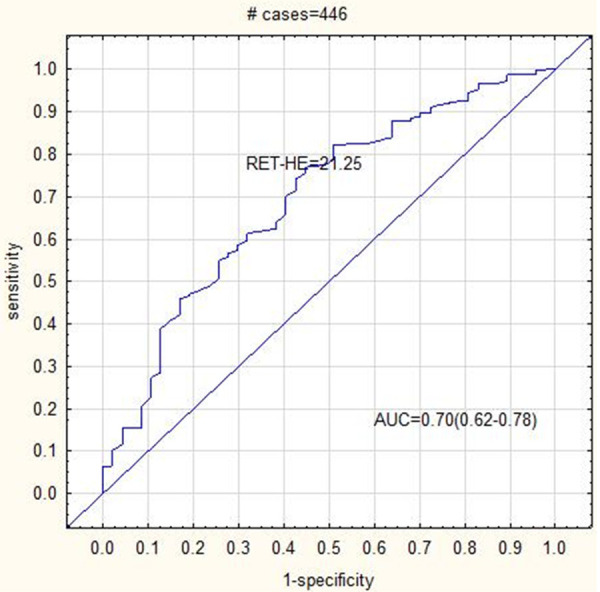
ROC curve analysis showing AUC = 0.7 for RET-HE cut off 21.25 in Dual positive patients (IDA + Alpha Thalassemia).
Figure 3.
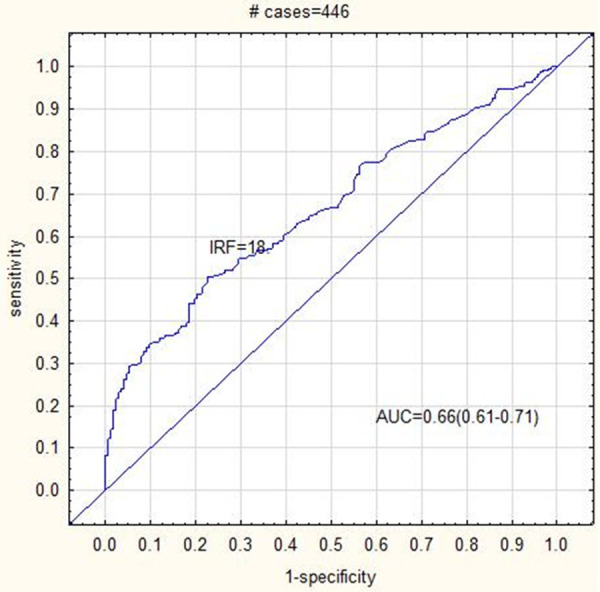
ROC curve analysis showing AUC = 0.66 for IRF cut off 18 in Alpha Thalassemia patients.
Discussion
IDA patients
We evaluated the screening and diagnostic potential of reticulocyte parameters and in particular RET-HE values using Ferritin level < 12 ug/l and MCH < 24 as the gold standard for IDA diagnosis. We found that a RET-HE cut off < 22.25 had an AUC: 0.69 for diagnosing IDA. Our cut off is lower than that reported in other studies [12,13]. Although Reticulocyte parameter reference ranges have not been standardized, studies have reported levels in healthy adults as mean values of 32.5 pg with cut off values as < 29.5 pg [12]. Studies which did not use ferritin as the gold standard for determining iron deficiency found overall higher RET-HE values compared to our study [12]. The differences are likely attributed to the different study population, geographic area and use of more specific and accurate parameters for IDA diagnosis.
We found that the RET-HE cut off < 22.25 with an AUC = 0.69 could discriminate IDA patients from Thalassemia patients in our cohort, comparable to other studies. In addition, our data showed that dual positive patients (IDA + Alpha Thalassemia) had the lowest RET-HE cut off compared to other groups. Our RET-HE cut off was the lowest when compared to previous similar studies [14].
RET-HE cut off values was < 27 pg. in dual positive IDA and Thalassemia patients in Thailand [15]. Studies which also considered ferritin levels found RET-HE cut off < 18 pg in patients with lower ferritin levels (< 5 ug/l) compared to a RET-HE cut-off < 26 pg in patients with higher ferritin levels (> 5-20 and > 20 ug/l) [16]. Higher serum ferritin levels > 30 ug/l suggests the presence of concomitant infection/inflammation. CRP-levels may be regarded as a marker if inflammation and should be compared to ferritin levels to confirm inflammation/infection. Although we did not compare the ferritin values in our study to CRP-levels, these study comparisons suggest that the lower specificity observed in our study is likely due to higher serum ferritin levels induced by infection or inflammation.
Thalassemia patients
In our Thalassemia patients, mean values for RET, IRF and RET-HE showed statistically significance values compared to negative patients. The RET-HE mean values in Thalassemia patients were higher than IDA patients. This is similar to previous studies which reported higher RET-HE mean values in Thalassemia patients [17]. Studies which used DNA analysis to diagnose Alpha Thalassemia found lower RET-HE cut off values with more alpha gene deletions [18]. Although our study could not compare our results to DNA analysis, it is likely that our cohort has fewer alpha gene deletions present.
Interestingly, we noted that that the most sensitive parameter to discriminate IDA from Alpha Thalassemia (MI index < 13) was the RET and the IRF. The IRF in particular showed markedly reduced mean values in Alpha Thalassemia patients compared to both IDA and dual positive patients. The lower mean IRF in Alpha Thalassemia patients appeared to be specific for this disease entity as a statistically significant increase in the mean IRF occurred when patients with co-inherited Sickle Cell Anemia and Alpha Thalassemia were analyzed. Few studies have explored the IRF as a potential diagnostic parameter for Alpha Thalassemia patients to the best of our knowledge [19-21].
Using ROC curve analysis to determine the diagnostic accuracy (p values < 0.05), we found that the IRF cut off value < 15.15 (AUC = 0.54) in IDA patients was lower than Alpha Thalassemia patients (cut off value < 18, AUC = 0.61) and also lower than dual positive (IDA + Alpha Thalassemia) patients (cut off value < 16, 75, AUC = 0.48). The IRF is also a parameter that has not been standardized. The values reported for IRF in healthy adults are much lower than those reported in patients with erythropoietic disorders suggesting a potential use for this parameter. The IRF which is an early indicator of stimulated erythropoiesis appears to be a potential diagnostic discriminator for Alpha Thalassemia in our study.
In Beta Thalassemia patients the RET and IRF mean values were significantly increased unlike Alpha Thalassemia which showed values below mean (in comparison to control group). This data most likely reflects more activity in the beta chain for erythropoiesis. The RET and IRF concurred with Alpha Thalassemia showing the most sensitivity on ROC curve analysis with cut off values RET < 2.06 and IRF < 19.7.
Our data concurs with previous reports which suggest that reticulocyte indices can differentiate IDA from Thalassemia. Although, our sensitivity and specificity values were not higher than 70%, these values are comparable to other studies of a similar nature [13,22,23]. Overall, reticulocyte parameters most statistically significant for discriminating IDA from Thalassemia patients in our cohort were: RET-HE and IRF. The RET-HE was the most sensitive reticulocyte diagnostic parameter for IDA and dual positive (IDA + Alpha Thalassemia) patients and the IRF was the most sensitive diagnostic parameter for Alpha Thalassemia patients. An IRF cut off below 15.5 and RET-HE cut off below 22.25 was the most valuable parameters in predicting IDA. RET-HE was a potential competitor for Ferritin levels in the diagnosis of IDA and the IRF was a potential competitor for MI index in the diagnosis of Alpha Thalassemia in our cohort. Additional studies exploring the relationship between Thalassemia, Sickle Cell Anemia and IRF in our population is required. In order to discriminate IDA from Thalassemia patients, both IRF and RET-HE should be utilized.
Limitations of the study
The advantages of our study are that we collected samples with microcytic anemia from a targeted population where the prevalence of Hemoglobinopathies is high. We also used very strict diagnostic parameters as the gold standard to diagnose IDA and Thalassemia respectively and we were able to collect a large number of patients for our study. In addition, we compared reticulocyte parameters in patients with IDA and Thalassemia to a control group of patients who presented with microcytic anemia but was negative for Hemoglobinopathies and had normal ferritin levels, enhancing the accuracy of our results. The limitation of our study is that we were not able to compare our results to genetic studies for Hemoglobinopathies diagnosis. Another limitation of our study was that we did not compare ferritin levels to other markers of inflammation/infection such as CRP-levels.
Conclusion
We established cut off values for reticulocyte indexes in our population which is comparable to previous studies [24,25]. We found that these mean and cut off values are useful for discriminating the microcytic anemia’s IDA and Thalassemia in our laboratory setting. These discriminant parameters are particularly valuable for use during screening in indeterminate cases where a rapid diagnosis is required. We advise that further use of discriminating algorithms using reticulocyte parameters should be integrated into an easily accessible software programme linked to hematology equipment to improve discrimination between IDA and Thalassemia.
Acknowledgements
We thank the medical laboratory scientists at the Prince Sultan Military Medical City for assistance in obtaining hematology and chemistry results for our data. Sysmex co represeted by Arabian Medical and Pharmaceutical Company (AMPC) for their help and support this study. The authors take full responsibility for the content and results stated in this manuscript.
Disclosure of conflict of interest
None.
References
- 1.Freire WB. Strategies of the Pan American Health Organization/World Health Organization for the control of iron deficiency in Latin America. Nutr Rev. 1997;55:183–188. doi: 10.1111/j.1753-4887.1997.tb01605.x. [DOI] [PubMed] [Google Scholar]
- 2.Al-Quaiz JM. Iron deficiency anemia. A study of risk factors. Saudi Med J. 2001;22:490–496. [PubMed] [Google Scholar]
- 3.Higgs DR. Gene regulation in hematopoiesis: new lessons from thalassemia. Hematology Am Soc Hematol Educ Program. 2004:1–13. doi: 10.1182/asheducation-2004.1.1. [DOI] [PubMed] [Google Scholar]
- 4.Higgs DR. The molecular basis of alpha-thalassemia. Cold Spring Harb Perspect Med. 2013;3:a011718. doi: 10.1101/cshperspect.a011718. [DOI] [PMC free article] [PubMed] [Google Scholar]
- 5.Modell B, Darlison M. Global epidemiology of haemoglobin disorders and derived service indicators. Bull World Health Organ. 2008;86:480–487. doi: 10.2471/BLT.06.036673. [DOI] [PMC free article] [PubMed] [Google Scholar]
- 6.Mitchell JJ, Capua A, Clow C, Scriver CR. Twenty-year outcome analysis of genetic screening programs for Tay-Sachs and beta-thalassemia disease carriers in high schools. Am J Hum Genet. 1996;59:793–798. [PMC free article] [PubMed] [Google Scholar]
- 7.Weatherall DJ. The inherited diseases of hemoglobin are an emerging global health burden. Blood. 2010;115:4331–4336. doi: 10.1182/blood-2010-01-251348. [DOI] [PMC free article] [PubMed] [Google Scholar]
- 8.Schoorl M, Schoorl M, Linssen J, Villanueva MM, NoGuera JA, Martinez PH, Bartels PC. Efficacy of advanced discriminating algorithms for screening on iron-deficiency anemia and beta-thalassemia trait: a multicenter evaluation. Am J Clin Pathol. 2012;138:300–304. doi: 10.1309/AJCP20UTTCAYKUDX. [DOI] [PubMed] [Google Scholar]
- 9.Mentzer WC Jr. Differentiation of iron deficiency from thalassaemia trait. Lancet. 1973;1:882. doi: 10.1016/s0140-6736(73)91446-3. [DOI] [PubMed] [Google Scholar]
- 10.England JM, Fraser PM. Differentiation of iron deficiency from thalassaemia trait by routine blood-count. Lancet. 1973;1:449–452. doi: 10.1016/s0140-6736(73)91878-3. [DOI] [PubMed] [Google Scholar]
- 11.Green R, King R. A new red cell discriminant incorporating volume dispersion for differentiating iron deficiency anemia from thalassemia minor. Blood Cells. 1989;15:481–491. [PubMed] [Google Scholar]
- 12.Bartels PC, Schoorl M, Schoorl M. Hemoglobinization and functional availability of iron for erythropoiesis in case of thalassemia and iron deficiency anemia. Clin Lab. 2006;52:107–114. [PubMed] [Google Scholar]
- 13.Brugnara C, Schiller B, Moran J. Reticulocyte hemoglobin equivalent (Ret He) and assessment of iron-deficient states. Clin Lab Haematol. 2006;28:303–308. doi: 10.1111/j.1365-2257.2006.00812.x. [DOI] [PMC free article] [PubMed] [Google Scholar]
- 14.Weimann A, Cremer M, Hernaiz-Driever P, Zimmermann M. Delta-He, Ret-He and a new diagnostic plot for differential diagnosis and therapy monitoring of patients suffering from various disease-specific types of anemia. Clin Lab. 2016;62:667–677. doi: 10.7754/clin.lab.2015.150830. [DOI] [PubMed] [Google Scholar]
- 15.Kadegasem P, Songdej D, Lertthammakiat S, Chuansumrit A, Paisooksantivatana K, Mahaklan L, Wongwerawattanakoon P, Tangbubpha N, Sirachainan N. Reticulocyte hemoglobin equivalent in a thalassemia-prevalent area. Pediatr Int. 2019;61:240–245. doi: 10.1111/ped.13775. [DOI] [PubMed] [Google Scholar]
- 16.Sudmann AA, Piehler A, Urdal P. Reticulocyte hemoglobin equivalent to detect thalassemia and thalassemic hemoglobin variants. Int J Lab Hematol. 2012;34:605–613. doi: 10.1111/j.1751-553X.2012.01442.x. [DOI] [PMC free article] [PubMed] [Google Scholar]
- 17.Lian Y, Shi J, Nie N, Huang Z, Shao Y, Zhang J, Huang J, Li X, Ge M, Jin P, Wang M, Zheng Y. Reticulocyte hemoglobin equivalent (Ret-He) combined with red blood cell distribution width has a differentially diagnostic value for thalassemias. Hemoglobin. 2019;43:229–235. doi: 10.1080/03630269.2019.1655440. [DOI] [PubMed] [Google Scholar]
- 18.Butthep P, Wisedpanichkij R, Jindadamrongwech S, Fucharoen S. Elevated erythropoietin and cytokines levels are related to impaired reticulocyte maturation in thalassemic patients. Blood Cells Mol Dis. 2015;54:170–176. doi: 10.1016/j.bcmd.2014.11.007. [DOI] [PubMed] [Google Scholar]
- 19.Bagdasaryan R, Glasser L, Quillen K, Chaves F, Xu D. Effect of hydroxyurea on immature reticulocyte fraction in sickle cell anemia. Lab Hematol. 2007;13:93–97. [PubMed] [Google Scholar]
- 20.Grotto HZ, Teixeira SM, Cortelazzi LC. [Reticulocyte indices in the differential diagnosis of iron-deficiency anemia and heterozygote beta-thalassemia] . Rev Assoc Med Bras (1992) 2003;49:135–136. [PubMed] [Google Scholar]
- 21.Mullier F, Lainey E, Fenneteau O, Da Costa L, Schillinger F, Bailly N, Cornet Y, Chatelain C, Dogne JM, Chatelain B. Additional erythrocytic and reticulocytic parameters helpful for diagnosis of hereditary spherocytosis: results of a multicentre study. Ann Hematol. 2011;90:759–768. doi: 10.1007/s00277-010-1138-3. [DOI] [PubMed] [Google Scholar]
- 22.Chouliaras GL, Stamoulakatou A, Tsiftis G, Perissaki G, Premetis E, Lycopoulou L. Age, beta thalassaemia trait, and iron-deficient anaemia significantly affect reticulocyte indices in pre-school children. Eur J Pediatr. 2010;169:1097–1104. doi: 10.1007/s00431-010-1186-7. [DOI] [PubMed] [Google Scholar]
- 23.d’Onofrio G, Chirillo R, Zini G, Caenaro G, Tommasi M, Micciulli G. Simultaneous measurement of reticulocyte and red blood cell indices in healthy subjects and patients with microcytic and macrocytic anemia. Blood. 1995;85:818–823. [PubMed] [Google Scholar]
- 24.Ogawa C, Tsuchiya K, Maeda K. Reticulocyte hemoglobin content. Clin Chim Acta. 2020;504:138–145. doi: 10.1016/j.cca.2020.01.032. [DOI] [PubMed] [Google Scholar]
- 25.Buttarello M, Rauli A, Mezzapelle G. Reticulocyte count and extended reticulocyte parameters by Mindray BC-6800: reference intervals and comparison with Sysmex XE-5000. Int J Lab Hematol. 2017;39:596–603. doi: 10.1111/ijlh.12705. [DOI] [PubMed] [Google Scholar]