Abstract
Diffusion-weighted imaging (DWI) is sensitive to the mobility of water molecule at cellular and macromolecular level, much smaller than the spatial resolution of the images. It is commonly based on single shot echo-planar imaging sequence with the addition of motion-probing gradient pulses and fat suppression. DWI is increasingly incorporated into routine body magnetic resonance imaging protocols. However, the liver is particularly affected by physiological motions such as respiration; the left liver is also affected by cardiac motion artifacts and susceptibility artefact due to contents in the stomach. Intravoxel incoherent motion (IVIM) DWI data analysis requires high-quality data acquisition using multiple b-values and confidence in the measurements at low b-values. This article reviews the technical developments of DWI and its applications in the liver. Challenges and some solutions for the quantification of apparent diffusion coefficient and intravoxel incoherent motion are discussed. Currently, acquisition protocols vary between research groups; patient preparation and data post-processing are not standardized. Increased standardization, both in data acquisition and in image analysis, is imperative so to allow generation of reliable DW-MRI biomarker measures that are broadly applicable.
Keywords: Liver, MRI, magnetic resonance imaging, diffusion weighted imaging, intravoxel incoherent motion (IVIM)
Introduction
Diffusion-weighted magnetic resonance imaging (DW-MRI, or DWI) assesses microscopic thermal motion of water molecules in biologic tissues, which is influenced by the interaction of water molecules with cellular membranes, macromolecules, variations in size of the extracellular extravascular space, the degree of cellular density, and motion of water molecules associated with blood flow in living tissues. The ability to obtain perfusion and diffusion information non-invasively have contributed to the growing interests in clinical applications of DW-MRI. However, to do this in a meaningful way demands insight into the approaches and a clear understanding of the strengths and limitations of the method. The purpose of this article is to review the principles of diffusion quantification, the techniques for diffusion weighted imaging acquisition, and various methods to estimate diffusion parameters. This article focuses on liver DW-MRI and discusses the potentials and limitations of quantitative diffusion measures. Some solutions for the quantification of apparent diffusion coefficient (ADC) and intravoxel incoherent motion (IVIM) are presented.
Diffusion weighted MR imaging and apparent diffusion coefficient (ADC) measure
Basic techniques of diffusion weighted MRI
Any particle at a temperature above absolute zero possesses thermal energy that manifests as random movement (“molecular diffusion”). Using pure water at body temperature (37°C) as a reference standard, the average displacement of water molecules during a 50-millisecond (ms) interval is approximately 30 μm [1]. At room temperature (298 K), a sample containing a small molecule, such as water, has a self-diffusion coefficient of about 2.3 × 10⁻³ mm2/s [2]. Cell membranes and macromolecules will impede the motion of water. Diffusion in biologic systems is affected by water exchange between intracellular and extracellular compartments and the tortuosity of the extracellular space (which in turn is affected by cell sizes, organization, and packing density). The observed or “apparent” diffusion of water within tissues is much less than in pure water.
Diffusion measurements are usually performed using a pulsed field gradient pulse sequence. A spin-echo (SE) sequence is used, and the 180° radio-frequency pulse refocuses chemical shifts and the frequency dispersion due to the residual B0 inhomogeneity and susceptibility effects. Stejskal and Tanner [3] introduced a T2-weighted SE sequence for diffusion measurement method that uses two large gradient pulses with a short duration δ and separated by a variable time interval Δ. With the symmetric pair of diffusion sensitizing gradients on either side of the 180° refocusing pulse, for non-diffusing spins the phase shifts induced by two opposing gradients are refocused. However, for moving (diffusing) spins, the cancellation is incomplete leading to residual phase dispersal and signal attenuation (Figure 1). The echo signal in a typical spin-echo sequence combines T2 and diffusion-weighting (with only negligible T1 weighting) [3-5] follows equation-1:
Figure 1.
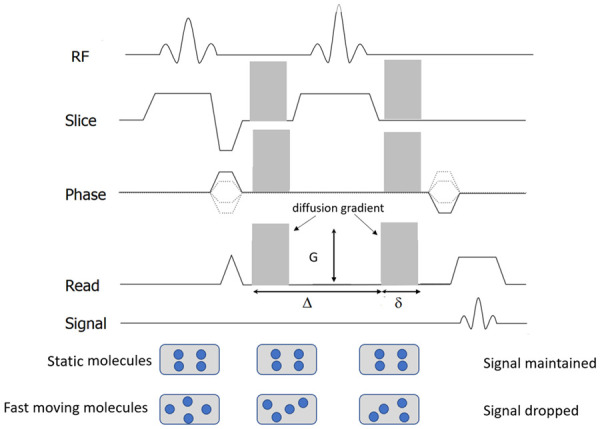
Diagram of diffusion-weighted sequence. It is based on T2-weighted spin-echo sequencing with application of two equal gradient pulses (a dephasing gradient and a rephasing gradient) on each side of the 180° radiofrequency pulse. Static molecules are dephased by the first diffusion gradient and rephased by the second diffusion gradient; therefore measured high signal intensity is maintained. In contrast, moving molecules undergo dephasing by the first diffusion gradient but are not entirely rephased by the second gradient because of their motion, thereby resulting in signal loss. Diffusion sensitizing is commonly applied in three orthogonal directions at the same time for DW-MRI.
 |
Where Sb and S0 are the signal intensity with and without diffusion respectively and b-value controls the degree of diffusion weighting in an image and Symbol, where γ is the gyromagnetic ratio and G is the amplitude of the diffusion gradients in mT/m. Thus, the sensitivity of the imaging sequence to water diffusion can be altered by changing the b-value, or b-factor. Increasing b-value can be theoretically obtained by 1) increasing the strengths (heights) of the diffusion sensitizing gradients, 2) increasing their durations, and 3) increasing the gap between the paired gradient lobes.
 |
In order to remove the effect of TE (time of echo) on diffusion measurement, increased b-values are obtained by increasing the strength of the diffusion gradients to keep TE value the same. By measuring the signal at two different b-values the effects of T2 decay can be removed leaving just the diffusion-weighted attenuation (Equation-2):
 |
A more accurate estimate can be obtained via linear regression with a series of different b-values.
For DW-MRI, a fast acquisition insensitive to bulk motion is essential. This is because it takes time to perform the strong diffusion sensitizing gradient pulses especially when high b-values are needed and maximum gradient amplitude generated by scanner hardware is limited. It is therefore desirable to acquire all the data needed to reconstruct the DW image after a single excitation and diffusion sensitizing instead of repeating the diffusion sensitizing multiple times. DW-MRI most commonly uses single-shot spine-echo echo-planar imaging (EPI) technique to sample all the K-space data points necessary to reconstruct the image using a gradient echo train after a single 90-180 pair of radiofrequence pulses. In EPI sequence, the chemical shift of fat resonance causes a large displacement of fat signal along the phase encoding direction. If the fat signal is not completely suppressed, it may superimpose on the region of interest. For DW-EPI in abdomen where fatty tissue is extensively present, reliable fat suppression (e.g., spectral attenuated inversion recovery or chemical excitation with spectral suppression) is necessary.
Because of the relatively short T2-relaxation time of the normal liver parenchyma, i.e., 46 ± 6 ms at 1.5T and 34 ± 4 ms at 3.0T, the highest b-values used in clinical imaging are typically no higher than 1000 s/mm2. Liver signal is low at b-values greater than 800 s/mm2, and noise may contribute substantially to the signal and influence the calculation of diffusion coefficients [6,7]. To generate higher b-values, longer pulsed field gradient pulses with relatively long TE is needed. The minimum TE of DW-spine-echo-EPI depends on the largest b-value used. Choosing a larger maximum b-value will force a longer TE for the acquisitions at all b-values which will reduce the signal due to T2 decay. For DW-MRI of kidney, the consensus recommendation is the maximum b value ≤ 800 s/mm2 [8].
DW-MRI can be extended to three dimensions by applying diffusion-weighting gradients in any direction. Liver DW-MRI is usually measured in three orthogonal gradient directions and the signals averaged, producing the corresponding b-value trace images. Trace image SD can be computed using a geometric average of the DW images acquired in three orthogonal directions to average out the effects of anisotropy (Equation-3):
Parallel imaging is used routinely to accelerate DWI acquisition. By reducing the echo train length with parallel imaging in DW-spine-echo-EPI sequence, the minimal TE can also be reduced. A shorter echo train length through parallel imaging also mitigate geometric distortion. Another technique for the acceleration of DWI is simultaneous multi-slice excitation. In simultaneous multi-slice excitation, a multiband RF pulse excites multiple 2D slices at the same time and the signals from simultaneous acquired slices are separated based on the coil sensitivity profile difference in the slice direction. Slice acceleration and multi-slice excitation can be combined to achieve even higher acceleration factor [9].
Overall, an optimized DW-spine-echo-EPI for liver should employ a robust fat suppression technique to reduce the chemical shift artifact, a combination of parallel imaging, partial Fourier and reasonable high receiver bandwidth to minimize the TE and distortion artifact, and an appropriate scheme to compensate for respiratory motion (and cardiac motion if necessary) [9,10].
Apparent diffusion coefficient (ADC) quantification
When performing liver DW-MRI, both low and high b-values are used. The signal intensity from protons with larger diffusion distances per unit time (e.g., blood flow associated pseudo-diffusion) is attenuated even at low b-values. Thus, images with low b-value nulls the intrahepatic vascular signal which improves detection of focal liver lesions, while higher b values (≥ 500 s/m2) provide diffusion information that helps focal liver lesion characterization.
Monoexponential apparent diffusion coefficient (ADC) quantification model is most popular due to its simplicity in fitting and modest acquisition requirements. It assumes a uniform Gaussian displacement distribution of the water molecules corresponding to a monoexponential diffusion-weighted signal decay of the MR signal. Calculation of an ADC value is typically performed utilizing a mono-exponential fit of the diffusion signal at different b-values. The slope of this line is the ADC value, which is typically expressed in units of 10-3 mm2/s. In its simplest form, the slope of the line that describes the relationship between the logarithm of the signal intensity and the b-value is the ADC (Equation-4):
Where SIb1 and SIb2 denote the signal intensity acquired with the b-factor value of b = b1 and b = b2 s/mm2, respectively. As the calculated diffusion coefficients can be influenced by tissue perfusion and other experimental errors, they are often referred to as apparent diffusion coefficient (ADC). Although an ADC map may be generated under optimal measurement conditions by using two b-values, using more than two b-values generally gives more accurate ADC values and improves scan-rescan reproducibility (Figure 2).
Figure 2.
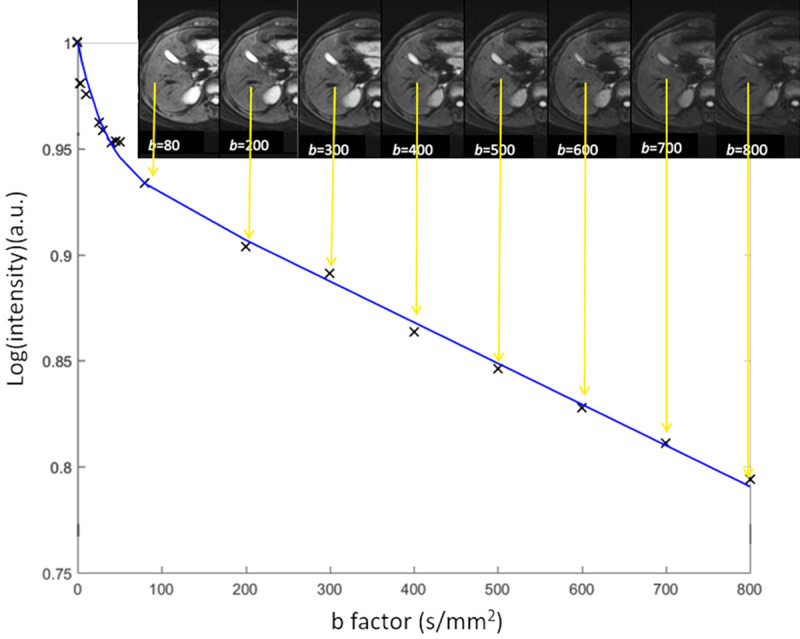
A simplified scheme shows diffusion-weighted imaging ADC calculation with various b-values. For each image voxel (or region-of-interest) acquired at same anatomic position at increasing b value, logarithm of relative signal intensity is plotted against b-values. Slope of line (monoexponential fit) is ADC of that image voxel (or region-of-interest). Note that gallbladder cyst also shows high signal on most of b-value images due to relatively long T2 relaxation time. This is the phenomenon known as “T2-shine through”.
The value of the ADC strongly depends on the b-values chosen for its calculation (Figure 3). ADC is overestimated when b = 0 s/mm2 is used to calculate it because the effect of perfusion is also incorporated in the calculation (see the IVIM paragraphs below). For DW-MRI of kidney, the consensus recommendation emphasizes the importance of several key b value regimes: low (0-200 s/mm2), intermediate (200-400 s/mm2), and high (600-800 s/mm2) [8]. For monoexponential kidney DWI studies, consensus recommends more than two b-values, including values < 200 s/mm2 [8]. For b-values > 50-100 s/mm2, signal attenuation can be considered mono-exponential, and ADC calculated with b > 50 s/mm2 as the first value is more reproducible [10]. Differences in reported ADC values are largely attributed to differences in acquisition sequence particularly the choice of b-values and the sequence TE. For cross-study comparison, acquisition parameters across participating sites/scanners should be matched as best as possible, in particular b-values and TE.
Figure 3.
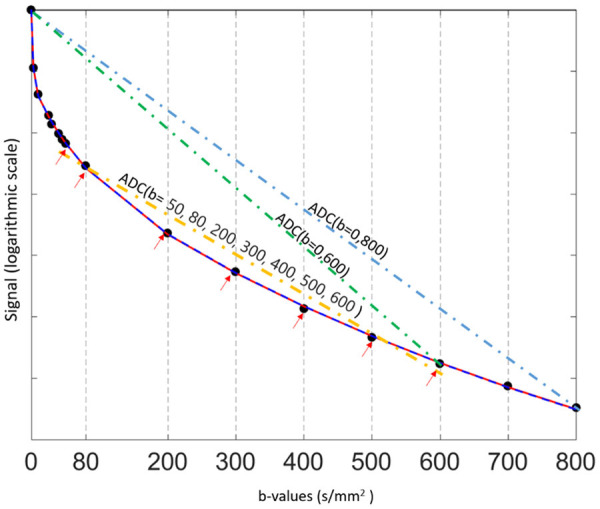
Relationship between diffusion-weighted signal and b-values ( 0, 3, 10, 25, 30, 40, 45, 50, 80, 200, 300, 400, 500, 600, 700, and 800 s/mm2) in a normal liver. In a semi-logarithmic projection, a mono-exponential curve gives a straight line, whose slope is ADC. The first part (0 < b < 50 s/mm2) of the fitting curve represents both diffusion and perfusion, whereas the second part (> 50 s/mm2) reflects mostly diffusion. The ADC (i.e. the slope) varies considerably (and is overestimated) when b = 0 s/mm2 is used to calculate it. In this example, ADC (b = 0, 600) > ADC (b = 0, 800) > ADC (b = 50, 80, 200, 300, 400, 500, 600).
If the calculation is repeated for each voxel of the DW-MRI, then the ADC value for every image voxel can be derived and displayed as a parametric ADC map. Thus, voxels that show a steeper slope of signal attenuation with increasing b-values will have higher ADC values (indicating higher water diffusivity) compared with voxels that show a gradual slope of signal attenuation.
It is possible to fractionate the calculation of the ADC if three or more b values are used at DW-MRI. For example, if there are three b values of 0, 100, and 500 s/mm2, ADC can be calculated by using all three b-values. Or, a perfusion-insensitive ADC can be calculated by using just the higher b-values (100-500 s/mm2), and a perfusion-sensitive ADC can be calculated by using the lower b-values (0-100 s/mm2).
The diffusion image signal intensity is dependent on both water proton diffusivity as well as the tissue T2-relaxation time. This means that a lesion may appear to show restricted diffusion on high b-value images due to long T2-relaxation time rather than the limited mobility of water protons. This phenomenon is called T2 shine-through effect. This phenomenon can be observed in the normal gallbladder, cystic lesions, and hemangiomas (Figure 2).
As a malignant liver tumor can have both restricted water motion and in the meantime increased perfusion. For ADC computed with b = 0 images, these two effects in the opposite directions may cancel each other to various extents, thus ADC becomes a less sensitive biomarker.
Reproducibility of ADC measurement
A major prerequisite for the use of ADC as a valuable quantitative tool is the reproducibility of measured values over time. DW images’ signal can be much affected by noise. The liver also poses additional challenges compared with other organs, because of its proximity to the diaphragm and heart, with related respiratory and cardiac motions. Even with the rapid acquisition speed of single-shot EPI, physiologic respiratory and cardiac motion persists and can result in artefacts that can alter ADC values. The reproducibility of ADC has been reported to a modest or good, depending on the data acquisition as well as the analysis approaches [11].
The ADC values for all voxels can be displayed as a parametric map. Unless detailed attentions are paid for the image acquisition and analysis, simplistic ADC measurement using ADC parametric map generally reports only modest reproducibility. Braithwaite et al. [12] tested short and midterm reproducibility of ADC measurements on 16 healthy male volunteers at 3.0T using b-values of 0 and 400 s/mm2, with scan-rescan interval of 147 ± 20 day. They noted the mean CoV (coefficient-of-variation) for the reproducibility of ADCs for small region-of-interests (ROIs) over short- and midterm was 14%; and suggest, for an individual subject, ADC values must change from pretreatment to post-treatment by approximately 27% (1.96 × CoV) to be considered a reflection of underlying tissue changes rather than measurement errors (for a normally distributed variable, the 95% confidence interval is 1.96 standard deviations from the mean). Miquel et al. [13] studied 10 healthy volunteers at 1.5T using six b-values of 0, 100, 200, 500, 750 and 1000 s/mm2. Repeatability of the volunteer population was assessed on two occasions with on average 6 days apart. Mono-exponential ADC maps were fitted ex-cluding b = 0 image. The authors suggested that if considering a single small ROI measurement on ADC parametric map, only changes greater than 23.1% would be statistically significant. This value is substantially lower (7.9%) if volumes-of-interest (VOIs) analysis is applied. Colagrande et al. [14] compared ADC measurement repeatability and reproducibility of an abdominal DW-MRI on 30 healthy volunteers at 1.5T field strength with b-values of 0 and 1000 s/mm2. They also showed that larger ROIs improved ADC measure reproducibility.
Hollingsworth and Lomas [15] showed that there was no significant difference between pre- and post-prandial ADC estimates derived from the posterior right lobe of the liver using b-values of 0 and 500 s/mm2 or 0 and 750 s/mm2, whereas the anterior right lobe showed a significant increase in ADC estimates post-prandially. Their data also demonstrated a significant increase in ADC estimates in both posterior and anterior right lobes in ADCs derived from low b-values (0 and 200 s/mm2). With ADC estimated from b-values of 100, 500 and 900 s/mm2 (i.e., perfusion sensitivity b = 0 image was not included), Winfield et al. [16] reported there was no significant difference in ADC estimates between fasted and non-fasted measurements, indicating that the perfusion sensitivity of such ADCs is sufficiently low that changes in blood flow in the liver after eating are undetectable beyond the variability in the measurements.
With ADC values for all pixels displayed as a parametric map, there is a possibility of liver slice position shift during data acquisition of image of different b-values. In such a case, when a particular pixel at b = 0 image (or another lowest b-value) is mapped to the corresponding pixel at b = 1000 (or other high b-value) image, these two pixels may not match. This will lead to quantification error. For ROI image analysis (rather than using parametric map), ADC can be calculated based on the mean signal intensity of the whole ROIs, which offers better estimation than pixel-wise fitting when the signal-to-noise ratio (SNR) of images is low [17].
Nonlinearity in the applied diffusion gradients can be a major source of spatial DWI bias and variability in off-centre ADC measurements. This bias is dependent on system design and diffusion gradient direction. Malyarenko et al. [18] demonstrated that the measured systematic ADC errors scaled quadratically with offset from a magnet’s isocentre.
However, with careful b-value selection (with images of more than two b-values) and excluding of very low b-values, it is possible that ADChigh (similar to Dslow in IVIM, with b = 0 and very low b-values excluded) analysis can have very good scan-rescan reproducibility.
1.5T vs. 3T for liver diffusion evaluation
EPI acquisition is very sensitive to the local magnetic field inhomogeneity which also increases with field strength. Despite improvements in MR technology and sequence optimization, DW-MRI of the upper abdomen at 3.0T remains a challenge. The theoretical advantage of an increased signal-to-noise ratio (SNR) provided by the higher field strength is paralleled by disadvantages and challenges, such as a less homogeneous radiofrequency excitation field and increased magnetic susceptibility and eddy current-related effects [9]. The liver in general and the left liver lobe in particular are prone to cardiac motion artifacts and radiofrequency field inhomogeneity at higher field strengths; the latter possibly could be reduced by applying dual-source parallel radiofrequency excitation instead of single-source transmission.
In 2011 Rosenkrantz et al. [19] studied DW-MRI of abdominal organs between 1.5T and 3.0T in healthy volunteers in terms of image quality, ADC values, and ADC reproducibility. Eight healthy volunteers underwent two consecutive scans at both 1.5 and 3.0T, which included breathhold and free-breathing DWI using a wide range of b-values (0 to 800 s/mm2). They reported subjective image quality was significantly lower at 3.0T. ADC values were similar at 1.5T and 3.0T for all assessed organs. There was no significant difference in CoV of ADC between field strengths.
Donati et al. [20] performed DW-MRI on 10 healthy men to determine the variability of ADC values in various anatomical regions in the upper abdomen using six systems from three different vendors (Philips, Siemens, GE) at 1.5T and 3.0T field strengths, with 10 b-values ranging from 0 to 1000 s/mm2. They noted there were no significant differences between ADC values measured at 1.5T and those measured at 3.0T. CoV of right liver was 17.8% and 24.8% for 1.5T and 3T respectively, and CoV of left liver was 13.9% and 27.1% for 1.5T and 3T respectively, with smaller CoV for 1.5T. Cui et al. [21] reported ADC values had good reproducibility between 1.5T and 3.0T platforms.
Impact of Gadolinium contrast agent administration on liver diffusion evaluation
It has been demonstrated that that DW-MRI acquired after gadolinium contrast administration (including hepatocyte-specific agent Gd-EOB-DTPA) does not significantly affect ADC values [22-24]. Thus, though usually DW-MRI is performed prior to contrast agent administration, performing DW-MRI after the gadolinium agent administration may not affect DW-MRI assessment. Currently, Gd-EOB-DTPA-enhanced MRI is widely used for the detection of liver lesions. However, it is necessary to wait for about 20 min for optimal liver parenchymal enhancement. When performing Gd-EOB-DTPA-enhanced MRI, the “wait time” between early dynamic imaging and hepatobiliary phase imaging can be used to minimize examination time. Colagrande et al. [25] reported ADC, as well as Dslow, Dfast, PF (based on biexponential IVIM model based analysis), do not show difference before and after gadolinium contrast agent administration.
Fatty liver and DW MR imaging
The presence of fat within the liver is associated with lower ADC measure. NAFLD (non-alcoholic fatty liver disease) and steatosis are correlated with decreased ADC [26-30]. Intracellular lipid restricts diffusion of water within hepatocytes. Lipid peaks near water are often incompletely suppressed by the chemical shift-dependent suppression techniques used by the DWI sequence; if so, the measured diffusivity may incorporate the diffusion constant of lipid, which is much slower than water [31].
For the healthy population, it should be noted that older age is associated higher prevalent of liver steatosis, and liver steatosis is more prevalent in men than women up to the age of 60 years. Beyond menopause, the prevalence of fatty liver rises sharply in women and exceeds that observed in their male counterparts [32].
Effects of iron deposition in DW-MR imaging
Higher liver iron content is known to be associated with lower liver ADC measure. EPI, the most widely used sequence for DWI, is subject to ghosting and susceptibility artefacts, and ADC may decrease as a result of the T2* shortening effect [27,33,34]. The iron deposition extent in the liver is higher in men than in women, and increases over aging, and in women liver iron content increases significantly after menopause [35-40]. Chronic liver diseases are often associate with iron overload [41-43]. Therefore, if very low ADCs are obtained in the liver, iron overload should be suspected.
Age and gender dependence of ADC values
In a study of 34 men and 52 women with normal liver, Metens et al. [44] investigated how normal liver parenchyma visibility on DWI and ADC quantification are influenced by age and iron content. Liver visibility (lower visibility denotes higher liver iron concentration, and vice versa) was better in young women but degrades with age in both genders. For b = 1000 s/mm2 images (other b-value images showed the same trend), inverse correlation between liver visibility score and age was significant with a Spearman coefficient = -0.58 in women (P < 0.0001) and = -0.44 in men (P < 0.01). The liver average ADC was negatively and weakly correlated with age (P = 0.05), and the values were higher in women than in men (P = 0.027) (see the IVIM paragraphs below).
Applications of Liver diffusion weighted image and ADC
Liver tumor detection
Cellular tissues, such as tumors, demonstrate restricted diffusion (high signal intensity) on higher b-value (≥ 500 s/mm2) images and low ADC value (Figure 4). DW-MRI at high b-values (≥ 100 sec/mm2) also provide a low background signal of normal liver parenchyma and thereby results in increased contrast between the background liver and lesions, enhancing the detection of focal liver lesions (Figure 5), thus help to detect small lesions. DW-MRI adds value in oncologic patients by depicting more liver lesions when combined with contrast-enhanced MRI protocols, and improves reader confidence in lesion detection, particularly for small tumors [45-48]. The reason(s) why malignant tumors have lower ADC values are poorly understood but is probably related to a combination of higher cellularity, tissue disorganization, and increased extracellular space tortuosity, all contributing to the reduced motion of water [49,50]. By contrast, cystic or necrotic tissues show a greater degree of signal attenuation on higher b-value diffusion images and have higher ADC value.
Figure 4.
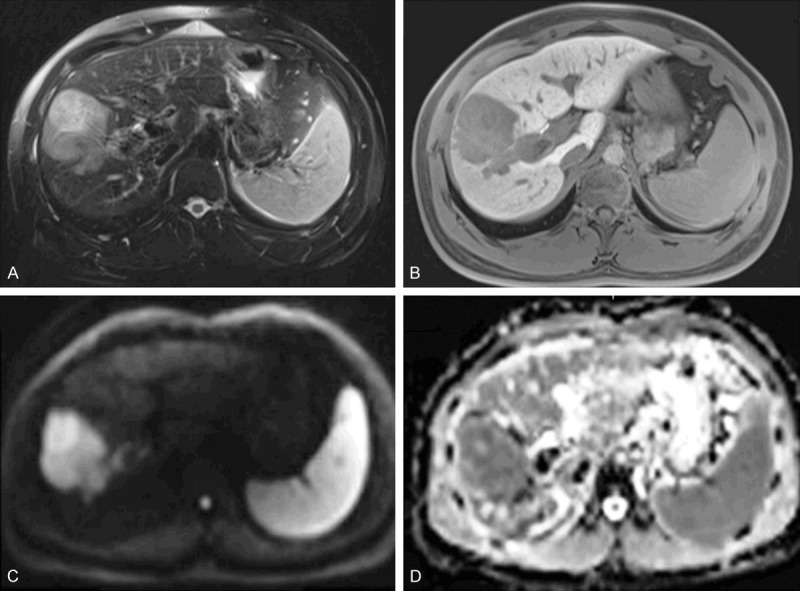
MRI of a 31-year-old male patient with a pathologically verified hepatocellular carcinoma of Edmondson-Steiner grade III. The patient suffered intrahepatic recurrence at 8 months after tumor resection. A 6.3 cm tumor in right lobe of the liver shows heterogeneous hyperintensity on T2-weighted image (A), hypointensity on 20-min hepatobiliary phase (B) and restricted diffusion on the diffusion-weighted image with a b-value of 700 s/mm2 (C). ADC (D) shows lower signal intensity compared with that of liver parenchyma. [Reproduced with permission from reference [51]].
Figure 5.

A colon cancer patient with a small metastasis nodule in liver (arrow). (A) Fat suppressed T2 weighed image; (B) Diffusion weighted image (b = 1000 s/mm2); (C) ADC map. This small metastasis nodule is best shown on diffusion weighted image with high signal (B). ADC shows this nodule has restricted diffusion.
Liver lesion characterization
In general, malignant lesions such as HCC (hepatocellular carcinoma) and liver metastases usually display low ADC values except when treated and/or necrotic, whereas normal/benign/reactive tissues have higher ADC value with a variable degree of overlap. Hyper-intensity on high b-value DW images associated with lower ADC value suggesting active tumor. Tumor necrosis corresponds to higher ADC values compared with viable tumor.
ADC value correlates with histopathological differentiation and microvascular invasion with poorly differentiated HCCs showing lower ADC than well-differentiated and moderately differentiated HCC. Kim et al. [48] reported that early HCCs showed hyperintensity on DWI which was strongly associated with their progression to hypervascular HCCs. Focal nodular hyperplasia (FNH) and adenomas have intermediate ADC value that can overlap with those of malignant lesions and normal liver parenchyma.
Liver cysts show pronounced decrease in signal intensity with increasing b-values and the highest ADC values, followed by hemangiomas. The presence of cellular components and fibrous tissue in hemangiomas results in restricted diffusion compared with other cystic lesions with a more complete fluid content.
The variability inherent in selecting an ROI on a single image is an important underlying cause for inconsistent correlation between lesion ADC values and tumor grade. Because HCCs often contain a few components with different histological grades, their DWI appearances are often inhomogeneous. To generate standardized and reproducible quantitative ADC metrics, various histogram-derived ADC parameters are used. These metrics provide a whole-lesion assessment and aid in the differentiation between low-grade, intermediate-grade, and high grade lesions. This technique is especially helpful in evaluating tumors with central necrosis, which can elevate the mean of ADC measures. The regions with the lowest values (ADCmin) are postulated to correspond to areas of the highest cellularity and to most accurately predict tumor behaviour [52]. Minimum-spot ADC was reported to be significantly lower in poorly differentiated HCC than in well-differentiated HCC and moderately differentiated HCC [53]. Three-dimensional histogram analysis of an entire lesion likely lead to a more accurate assessment [54].
Hepatic metastases that demonstrate substantial central necrosis can demonstrate high ADC. Mucinous malignant lesions that may show a low restriction to diffusion and high ADC and can be misdiagnosed as benign lesions. Hammer et al. [55] reported that liver abscesses have a variable appearance, with both central and peripheral diffusion restriction patterns observed frequently. Given these variabilities, caution should be exercised in making differential diagnosis based on ADC measure alone.
DW-MRI in assessment of tumor response to treatment
DW-MRI is increasingly applied to evaluate tumor response to various therapies. Generally speaking, effective tumor treatment results in an increase in the ADC value, which can occur prior to a measurable change in tumor size [49]. Higher ADC value likely represents post-therapeutic liquidation, whereas lower value parts are suspicious for active disease. An increase in ADC values following systemic chemotherapy can be a sign of tumor response with non-responders showing lower ADC values than responders. However, a transient ADC decrease phase within 24-48 hours after initiation of treatment has been observed, which may be related to cellular swelling, reductions in blood flow, or reduction in extracellular space [49]. Following the increase in ADC with treatment, the ADC can eventually decrease, which is related to tumor repopulation and fibrosis.
Liver cirrhosis with DW MR imaging
It is well established that liver cirrhosis is associated with low ADC [56-58]. The mechanism of diffusion restriction in liver cirrhosis/fibrosis is possibly related to increased connective tissue in the liver, which is proton poor, and decreased blood flow.
Do et al. [58] studied 34 patients and 22 control subjects, using b-values of 0, 50, and 500 s/mm2. Liver ADC and normalized liver ADC (defined as the ratio of liver ADC to spleen ADC) were compared. They noted liver ADC failed to distinguish individual stages of fibrosis, except between stages 0 and 4. There were significant differences in normalized liver ADC between control livers and intermediate stages of fibrosis (stages 2-3) and cirrhosis (stage 4) and between stages 1 and 4, and there was a trend toward significance between stages 0 and 1 (P = 0.051) and stages 1 and 3 (P = 0.06). ROC analysis showed that normalized liver ADC was superior to liver ADC for detection of stage ≥ 2 (area under the ROC curve, 0.864 vs. 0.655; P = 0.013) and stage ≥ 3 (0.805 vs. 0.689; P = 0.015), without a difference for diagnosing cirrhosis (0.935 vs. 0.720; P = 0.185). Repeatability was assessed using two paired consecutive MR studies in 7 subjects. Normalized liver ADC had higher reproducibility than ADC (mean CoV, 3.5% vs. 12.6%).
However, it can also be concluded that simple ADC measurement is not sufficiently sensitive for reliable early-stage liver fibrosis evaluation [59]. As both HCC and cirrhosis have decreased ADC, thus in some cases HCCs may become difficult to differentiate from surrounding cirrhotic changes or dysplastic nodules on DW images.
ADC measure in orthotopic liver transplantation
Sandrasegaran et al. [60] evaluated parenchymal disorders following orthotopic liver transplantation by DW-MRI with b-values of 50, 400 (or 500), and 800 s/mm2. ADC values were measured in 41 patients who had 56 MRI scans. There was a significant difference in ADC values associated with a histological abnormality seen on core biopsy (n = 43, ADC: 0.91 ± 0.15 × 10⁻³ mm2/s) and those associated with no histological abnormality (n = 13, ADC: 1.11 ± 0.17 × 10⁻³ mm2/s; P = 0.003). The parenchymal histological abnormalities included acute cellular rejection, and recurrence of fibrosis in all patients, and the recurrence of viral hepatitis in patients with hepatitis C. When the ADC value was < 0.99 × 10⁻³ mm2/s, there was a sensitivity and specificity of 85% and 72% in predicting a parenchymal histological abnormality.
Technical aspects of intravoxel incoherent motion (IVIM) analysis
Basic principle of IVIM
There is a growing interest in techniques beyond simple ADC calculation to tease out the effects of microcapillary perfusion from DW-MRI data of abdominal organs [61] (Figure 6). To show the influence of tissue perfusion on ADC, a number of preclinical studies compared ADC obtained in living vs. postmortem animals. Using implanted human tumors in nude mice, Sakuma et al. [62] showed that the measured ADC in tumors was higher in living mice compared with that in sacrificed mice. Sun et al. [63] calculated perfusion-sensitive ADCs (using b-values of 0-100 s/mm2) and perfusion-insensitive ADCs (using b-values of 500-1000 s/mm2) in rat livers implanted with rhabdomyosarcoma in living and postmortem animals; they reported that the perfusion-sensitive ADC significantly decreased in tumors and normal liver in the postmortem state, but no significant change was observed in the perfusion-insensitive ADC. Lemke et al. [64] investigated the vascular contribution to IVIM, the signal was measured in the healthy pancreas with and without suppression of the vascular component. It was shown that the perfusion fraction (PF) in the pancreatic tissue measured with blood suppressed MR sequence decreased significantly, whereas the ‘pure’ diffusion coefficient (Dslow) did not change with blood suppression.
Figure 6.
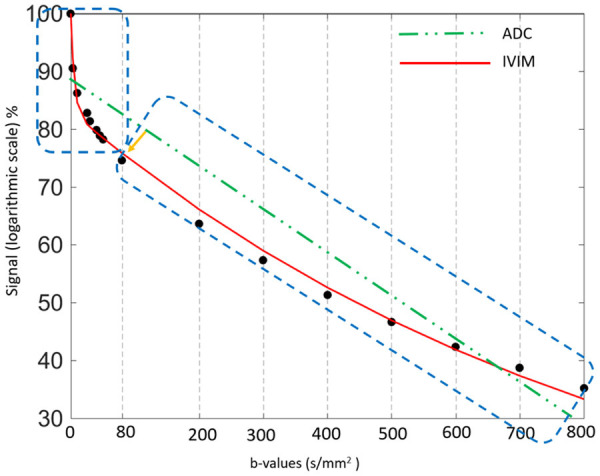
Plots show logarithm of relative signal intensity vs. b-values from normal liver parenchyma. There is an initially steeper decrease in plotted signal values at low b-values which represents substantial perfusion component, and a more gradual attenuation of signal at higher b-values which mainly represent diffusion component. Using simple monoexponential apparent diffusion coefficient (ADC) line fitted to data (dotted green line) provides suboptimal characterization of signal attenuation behaviour. IVIM: Intravoxel incoherent motion.
Incoherent motion leads to a distribution of position of the particles under consideration in a given direction and after a given amount of time, while coherent motion leads to an identical translation in a given direction of all particles. Intravoxel incoherent motion (IVIM) was proposed by Le Bihan et al. [4,5] to account for the effect of vessel/capillary perfusion on the aggregate DWI signal. According to IVIM theory, the fast component of diffusion is related to micro-perfusion, whereas the slow component is linked to molecular diffusion. The signal decay of IVIM diffusion MRI is therefore described with a bi-exponential model (Equation-5):
Where SI (b) and SI0 denote the signal intensity acquired with the b-factor value of b and b = 0 s/mm2, respectively. Dslow (or D) is the diffusion coefficient representing the slow ‘pure’ molecular diffusion (unaffected by perfusion). The perfusion fraction (PF, or f) represents the fraction of the compartment related to microcirculation, which can be understood as the proportional incoherently flowing fluid (i.e. blood) volume. Dfast (or D*) is the perfusion-related diffusion coefficient representing the incoherent microcirculation within the voxel, which holds information on blood perfusion’s speed. PF is expected to correlate with histological microvascular density (MVD); accordingly, most published works found a fair to good correlation between PF and MVD [65].
Conceptually, the attempt to measure perfusion with IVIM is based on the assumption that the effect of incoherent motion from blood motion can be separated from other incoherent effects. While confounding sources of incoherent motion in biological tissue might be present, the IVIM model basically assumes that a biological tissue has two major compartments with specific and significantly different diffusion coefficients, a (micro-) vascular and a non-vascular compartment. Therefore, two fixed compartments are assumed in the IVIM model, but certainly the separation of perfusion and thermal diffusion effects using this model should be understood as an approximate description of a sum of complex motion inside each voxel of the biological tissue under consideration. It is also considered that this model is used for b-values between 0 and 1000 s/mm2, because at higher b-values additional effects due to motion restrictions of water molecules through biological barriers (such as cell membranes and organelles) are visible, resulting in non-Gaussian diffusive motion [66]. The rate of signal attenuation resulting from perfusion is typically an order of magnitude greater than tissue diffusion because of larger distances of proton displacement during the application of the motion-probing gradients. Therefore, in normal perfused tissue at higher b-values, perfusion accounts for only a small proportion of the measured signal in each imaging voxel. However, at lower b-values, perfusion’s contribution to the DW-MRI signal is rather significant (Table 1) [67].
Table 1.
Signal contribution at each b-values of the slow and fast compartments using bi-exponential decay model and averaged 50 scans of 18 young healthy volunteers
| b-value (s/mm2) | Average measured SI (± SD) | Predicted signal by full Fitting | Predicted signal by Segmented Fitting | ||||
|---|---|---|---|---|---|---|---|
|
|
|
||||||
| TSI | Cslow/TSI | Cfast/TSI | TSI | Cslow/TSI | Cfast/TSI | ||
| 0 | 100.0 ± 0.0 | 100.0 | 83.1 | 16.92 | 100.0 | 76.7 | 23.26 |
| 3 | 90.5 ± 2.7 | 92.3 | 89.7 | 10.26 | 96.4 | 78.9 | 21.13 |
| 10 | 86.3 ± 3.3 | 84.6 | 97.1 | 2.89 | 89.9 | 83.3 | 16.72 |
| 25 | 82.7 ± 4.2 | 80.9 | 99.8 | 0.17 | 81.8 | 90.2 | 9.76 |
| 30 | 81.4 ± 4.0 | 80.3 | 99.9 | 0.06 | 80.1 | 91.9 | 8.08 |
| 40 | 79.8 ± 3.5 | 79.4 | 100.0 | 0.01 | 77.6 | 94.5 | 5.50 |
| 45 | 78.9 ± 3.9 | 78.9 | 100.0 | 0.00 | 76.7 | 95.5 | 4.52 |
| 50 | 78.2 ± 4.0 | 78.5 | 100.0 | 0.00 | 75.9 | 96.3 | 3.71 |
| 80 | 74.6 ± 4.1 | 75.8 | 100.0 | 0.00 | 72.6 | 98.9 | 1.11 |
| 200 | 63.6 ± 3.9 | 66.1 | 100.0 | 0.00 | 64.0 | 100.0 | 0.01 |
| 300 | 57.3 ± 3.6 | 59.0 | 100.0 | 0.00 | 57.8 | 100.0 | 0.00 |
| 400 | 51.3 ± 3.0 | 52.6 | 100.0 | 0.00 | 52.1 | 100.0 | 0.00 |
| 500 | 46.6 ± 3.4 | 46.9 | 100.0 | 0.00 | 47.1 | 100.0 | 0.00 |
| 600 | 42.3 ± 2.9 | 41.9 | 100.0 | 0.00 | 42.5 | 100.0 | 0.00 |
| 700 | 38.7 ± 2.7 | 37.3 | 100.0 | 0.00 | 38.3 | 100.0 | 0.00 |
| 800 | 35.2 ± 2.4 | 33.3 | 100.0 | 0.00 | 34.6 | 100.0 | 0.00 |
Average measured signal intensity (SI): average of the normalized measured liver signal of 50 scans. TSI: Total diffusion weighted imaging signal predicted by the model. Cslow and Cfast are related to the true diffusion compartment signal [(1-PF) × exp (-b × Dslow)] and the pseudo-diffusion compartment signal [PF × exp (-b × Dfast)] respectively. Ci/TSI: Signal contribution of the compartment i in the total signal predicted signal, in %. [reproduced with permission from reference [67].
The bi-exponential decay behavior of signal intensity on MR image and b-factor as shown Equation-5 can be analyzed with segmented fitting or full fitting. For the segmented fitting, the signal value at each b-value is normalized by attributing a value of 100 at b = 0 s/mm2 (SInorm = (SI(b)/SI0) × 100, where SInorm is the normalized signal, SI(b) = signal at a given b-value, and SI0 = signal at b = 0 s/mm2). The estimation of Dslow is obtained by least-squares linear fitting of the logarithmized image intensity at the b-values greater than a threshold b-value (such as 200 s/mm2 or 60 s/mm2) to a linear equation [5,67,68]. The fitted curve is then extrapolated to obtain an intercept at b = 0. The ratio between this intercept and the SI0 gives an estimate of PF. Finally, the obtained Dslow and PF are substituted into Eq. [5] and are non-linear least-square fitted against all b-values to estimate Dfast. With the full fitting method, all the parameters (Dslow, Dfast, PF) are estimated by a single least-squares nonlinear regression. Full fitting uses all the data points with different b-values in order to find the best fit. Theoretically, full fitting shall allow more flexibility and therefore the possibility to produce results closer to the true physiological value of IVIM parameters. While the segmented fitting approach is shown to improve the stability of fitting, it will also unavoidably introduce biases in the results. Segmented fitting emphasizes the accuracy of Dslow estimation while allows less flexibility for Dfast calculation [67].
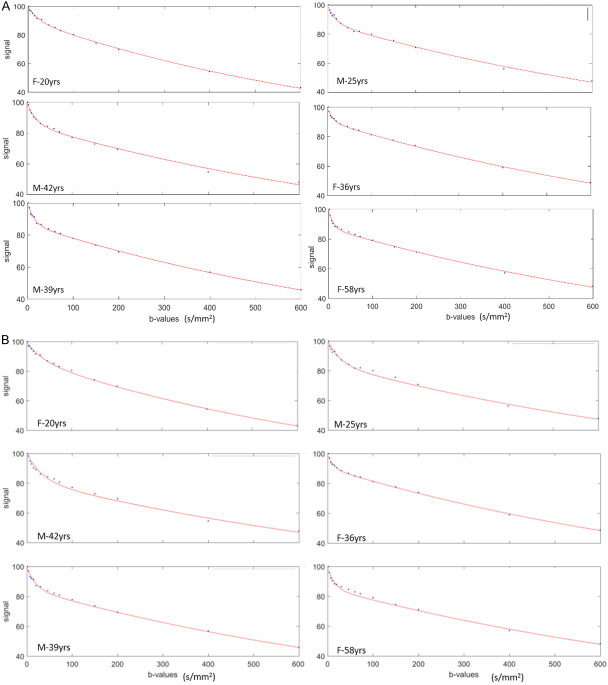
The value of three IVIM parameters derived from IVIM analysis depends on the b-value distribution, the fitting method, as well as the threshold b-value for segmented fitting. As compared with choosing threshold b-value of 200 s/mm2, choosing threshold b-value of 60 s/mm2 improves the quality of data fitting (Figure 7). Huang et al. [69] used a 1.5T scanner and 15 b-values of 2, 4, 7, 10, 15, 20, 30, 46, 60, 72, 100, 150, 200, 400, 600 s/mm2, and fitting starts from b = 2 s/mm2 image (b = 0 discarded), and demonstrated remarkably similar results for those derived from full fitting and those derived from segmented fitting with threshold b-value of 60 s/mm2 (Figure 8). Typically, for healthy liver and bi-exponential fitting starting from b = 0, Dslow is around 1.0-1.1 (× 10-3 mm2/s), PF is around 18%-22%; Dfast value can vary more widely, ranging from 50 to 200 (typically 150, × 10-3 mm2/s) [70,71]. These values are also affected by how ROI is drawn. With ROI including more vessel pixels, IVIM parameter values increase. For assessing liver parenchyma diseases such as liver fibrosis, big vessels should be excluded for ROI segmentation. An example of our approach is shown in Figure 9.
Figure 7.
IVIM signal bi-exponential decay curve is better fitted with threshold b-value of 60 s/mm2 than with threshold b-value of 200 s/mm2. (A) Six consecutive healthy participants’ liver IVIM bi-exponential segmented fitting curves with threshold b value of 60 s/mm2, all demonstrating very good fitting. (B) The same six study participants’ IVIM bi-exponential segmented fitting curves with threshold b-value of 200 s/mm2. Compared with (A), it can be visually noted that the fittings in (B) are less optimal. Data include 15 b-values of 2, 4, 7, 10, 15, 20, 30, 46, 60, 72, 100, 150, 200, 400, 600 s/mm2, and fitting starts from b = 2 s/mm2 image. M: male; F: females. [Reproduced with permission from reference [69]].
Figure 8.
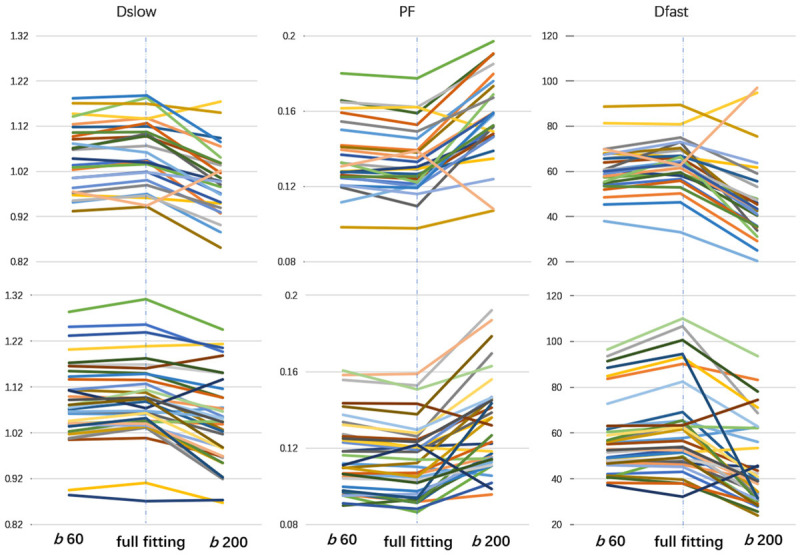
IVIM results of full fitting, segmented fittings with threshold b = 60 s/mm2 (b 60) and 200 s/mm2 (b 200). Results of full fitting have excellent agreement, subject-by-subject, with those of segmented fitting using threshold b of 60 s/mm2. Upper row for healthy men males (n = 26) and lower row for healthy women (n = 36). Each line represents one subjects. [Reproduced with permission from reference [69]].
Figure 9.
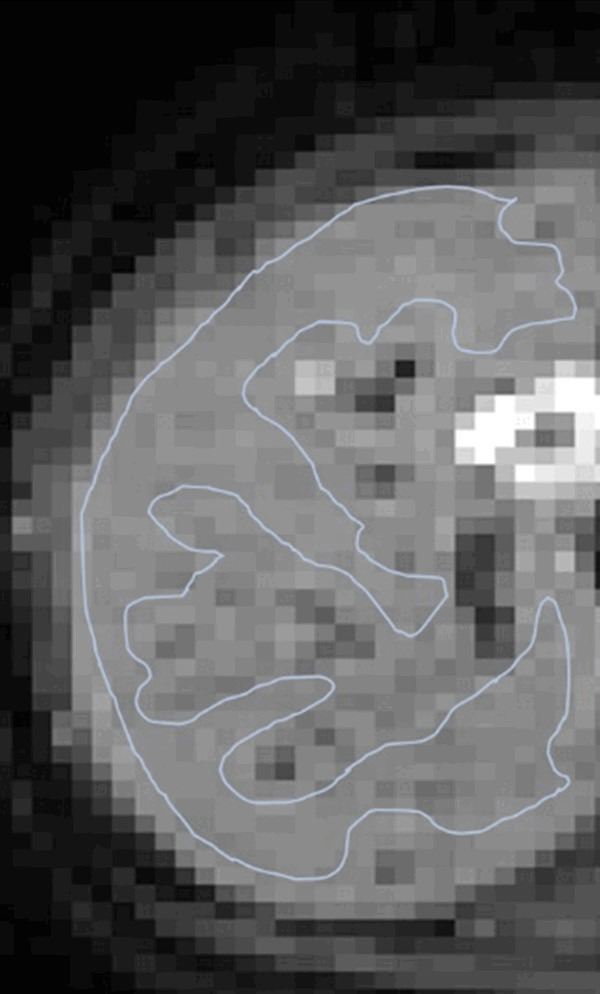
An example of region of interest (ROI) drawn over right liver parenchyma (b = 2 s/mm2 image) for IVIM bio-exponential processing. This ROI excludes apparent vasculature as well as keeps certain distance from the liver borders so to minimize the potential impact of respiratory motion.
For the segmented fitting, a higher threshold b-value is associated with flatter Dslow curve (i.e., lower Dslow value) and leads to higher PF measurement. A lower threshold b-value leads to Dslow curve containing more perfusion compartment, and therefore higher Dslow measurement and lower PF measurement (Figure 10). Only including very low b-values which correlate to the initial steep signal decay leads to higher Dfast measurement [67,70]. Wang et al. [72] noted that the dependence of PF, Dslow, and Dfast on threshold b-value differs between healthy livers and fibrotic livers; with the healthy livers showing a higher degree of dependence due to more perfusion component in healthy livers than in fibrotic livers.
Figure 10.
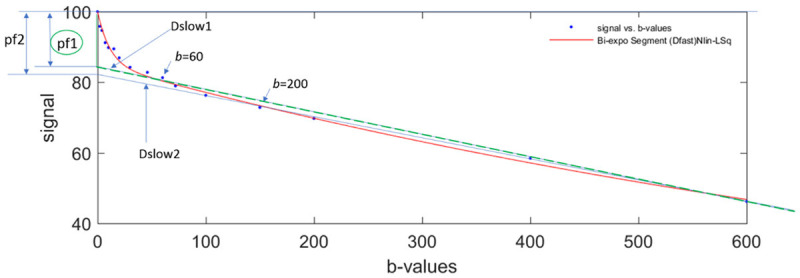
Bi-exponential segmented fitting curve of parenchyma in a healthy liver. The b-value distribution is 0, 2, 4, 7, 10, 15, 20, 30, 46, 60, 72, 100, 150, 200, 400, 600 s/mm2, and fitting starts from b = 0 image. When a higher threshold b-value (such as b = 200 s/mm2) is used, the Dslow value (slope of blue Dslow2 line) will be smaller than when a lower threshold b-value (such as b = 60 s/mm2) is selected (slope of green Dslow1 line). On the other hand, the computed PF is larger when a higher threshold b-value is used (height of pf2) than when a lower threshold b-value is used (height of pf1).
Time of Echo and B0 field strength’s effect on IVIM quantification
Blood and liver tissue have different T2 values, and failure to account for this in the IVIM model can lead to incorrect estimation of PF. As blood has a longer T2 than liver tissue, the PF is overestimated as a function of increasing TE [64]. Lemke et al. [64] demonstrated that PF increase significantly with increasing TE. The longer the TE, the greater the signal decays at low b-values, thus indicating PF increase (13.3 ± 4.0% for TE = 50 ms, 20.2 ± 5.8% for TE = 70 ms, 26.3 ± 5.0% for TE = 100 ms). In general, PF may be reduced by ~40% in the liver if the TE is reduced from 100 ms to 50 ms [73,74]. This phenomenon has been also noted in IVIM of other tissues such as the prostate [75]. Lemke et al. [64] and Jerome et al. [76] also proposed computational methods to correct this bias. For cross-study comparison, it is important to keep TE value consistent. For liver IVIM studies, a modest short TE value of 50-60 ms is commonly used, thus most of the studies would be comparable in this aspect. In a preliminary study, Riexinger et al. [73] noted that, in contrast to PF, Dfast shows almost no echo time dependence in healthy livers.
A recent study by Riexinger et al. [77] investigated the B0 field strength’s effect on IVIM quantification. They studied 20 healthy volunteers at two field strengths (1.5T and 3T). Diffusion-weighted images of the abdomen were acquired at 24 b-values: 0.2, 0.4, 0.7, 0.8, 1.1, 1.7, 3, 3.8, 4.1, 4.3, 4.4, 4.5, 4.9, 10, 15, 20, 30, 50, 60, 90, 95, 150, 180 and 500 s/mm2. They reported liver Dslow = 1.22/1.00 × 10-3 mm2/s at 1.5/3T, PF = 0.286/0.303 at 1.5/3T; and Dfast = 308/260 × 10-3 mm2/s at 1.5/3T. Our review article [70] included 28 human studies of normal liver parenchyma also indicated a slightly lower Dslow at 3T (compared with 1.5T), and a slightly higher value of PF at 3T, which agrees well with Riexinger et al.’s results. Note that, Riexinger et al. ‘s study was performed with an extensive array of b-values, which could allow the detection of small difference previously not detected by ADC studies on 1.5T vs. 3T difference.
IVIM bi-exponential fitting without b = 0 image
With most of the reported IVIM analyses, the diffusion image signal decay is computed starting from b = 0 s/mm2 image and then increasingly higher b-values using a bi-exponential decay model. However, this decay process does not follow the bi-exponential model at least for ROI (region-of-interest) based analysis. The signal difference between b = 0 s/mm2 image and b = 1 or b = 2 s/mm2 images can be very substantial, the vessels (including small vessels) particularly show high signal without diffusion gradient while showing dark signal when the diffusion gradient is on even at b = 1 s/mm2 (Figure 11). Indeed, it can be shown that even when ROI is drawn on liver parenchyma to exclude bright pixels which would contain ‘visible’ vessels, a steep drop of signal from b = 0 to b = 2 can still be seen, suggesting the inability of a bi-exponential model to describe the signal decay at very low b-values (Figure 12).
Figure 11.
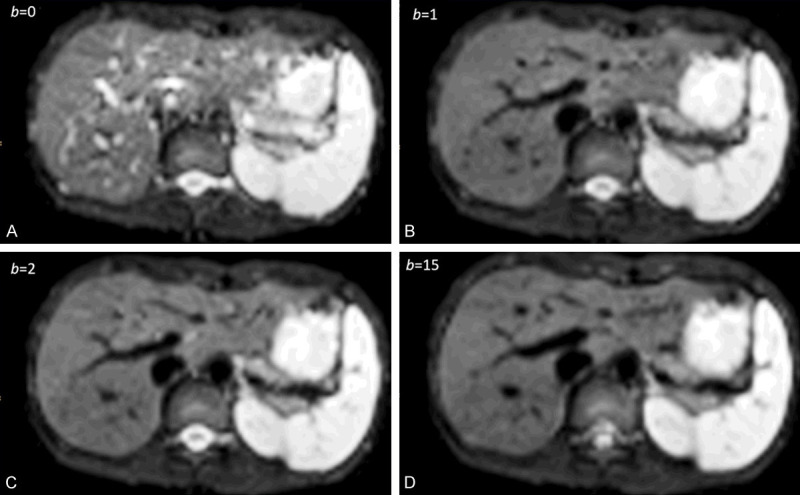
1.5T liver IVIM diffusion images with b-value = 0, 1, 2, 15 s/mm2. The signal difference between b = 0 s/mm2 image and b = 1 or 2 s/mm2 images is dramatic, particularly the vessels show high signal without diffusion gradient while showing dark signal when the diffusion gradient is on even at b = 1 s/mm2. [Reproduced with permission from reference [72]].
Figure 12.
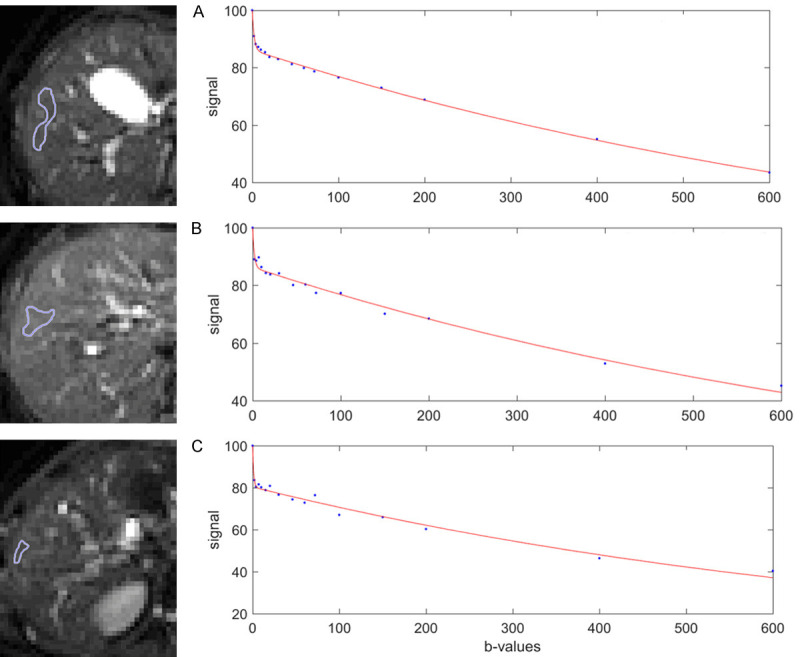
Bi-exponential full fitting curves of three portions of liver parenchyma from three healthy livers. On b = 0 images, small ROIs are drawn on liver parenchyma excluding bright pixels which would contain ‘visible’ vessel. The b-value distribution is 0, 2, 4, 7, 10, 15, 20, 30, 46, 60, 72, 100, 150, 200, 400, 600 s/mm2, and fitting starts from b = 0 image. Note despite the ROIs do not contain visible vessel, a steep drop of signal from b = 0 to b = 2 can still be seen, this would be caused by sub-pixel micro-vessels which show high signal on b = 0 image while low signal on b = 2 image. [Reproduced with permission from reference [6]].
Wang [78] proposed that the relationship between liver DWI signal and b-value can be separated into two parts: part-1 is the signal difference between b = 0 image and the first very low b-value image (usually b = 2 s/mm2 image), and the rest is part-2 and fitted with bi-exponential decay. Thus, part-1 denotes the signal difference between images when the diffusion gradient is off (i.e., b = 0, vessel showing high signal) and images when the diffusion gradient is on (e.g., b = 2 s/mm2, vessel showing signal void), which would reflect the extent of tissue vessel density. Therefore, liver vessel density can be measured by a DWI derived micro-perfusion volume surrogate biomarker (DDVD: diffusion derived vessel density, equation-6) [78,79]:
Where Sb0 refers to the measured liver signal intensity when b = 0 s/mm2, and Sb1 refers to the measured liver signal intensity when b = 1 s/mm2. ROIarea0 and ROIarea1 refer to the region-of-interest on b = 0 s/mm2 and b = 1 s/mm2 images, respectively. Sb1 and ROIarea1 can also be approximated by other low b-value diffusion image’s data such as Sb2 which is the measured liver signal intensity when b = 2 s/mm2. Sb2 may be preferable in cases when Sb1 contain residual high blood signal. For part-2 of bi-exponential decay analysis with b = 2 s/mm2 image (or b = 1 s/mm2 image) as the starting point, the signal value at each b-value is normalized by attributing a value of 100 at b = 2 s/mm2 (Snorm = (SI(b)/SI2) × 100, where Snorm is the normalized signal, SI(b) = signal at a given b-value, and SI2 = signal at b = 2 s/mm2). The signal attenuation is modelled according to equation-7 [78-80]:
Where SI(b) and SI2 denote the signal intensity acquired with the b-factor value of b and b = 2 s/mm2. The analysis of a few randomly selected healthy volunteers and liver fibrosis’s result are shown in Figure 13 [78]. Li et al. [80] demonstrated that compared with IVIM analysis starting from b = 2 s/mm2, IVIM analysis included b = 0 s/mm2 led to higher inter-subject variation among healthy young volunteers, and the ratios of mean value for liver fibrosis patients vs. mean value for healthy volunteers was smaller by IVIM analysis without b = 0 s/mm2 (thus easier to sperate patients and normal subjects) than by IVIM analysis including b = 0 s/mm2.
Figure 13.

Results of the initially analyzed subjects from the study of Li et al. [80]. b-values distribution: 0, 2, 5, 10, 15, 20, 25, 30, 40, 60, 80, 100, 150, 200, 400, 600 s/mm2, and threshold b-value is 60 s/mm2, 3T scanner. (A) Four healthy volunteers and three liver fibrosis patients cannot be separated by Dslow when b = 0 image is included for bi-exponential IVIM analysis; while the volunteers and three liver fibrosis patients can be separated by Dslow when b = 0 image is not included for bi-exponential decay IVIM analysis. (B) The same study subjects as in (A), healthy volunteers and liver fibrosis patients cannot be separated by PF when b = 0 image was included for analysis; while volunteers and three liver fibrosis patients can be separated by PF when b = 0 image was not included for analysis. (C): Seven healthy volunteers (green dots) and six liver fibrosis patients (red dots) can be separated by 3-dimensional display of three IVIM parameters (PF, Dfast, Dslow). [Reproduced with permission from reference [78]].
Another way to address the initial fast signal decay at very low b-value is to apply tri-exponential decay fitting [67,77]. To ensure stable fitting of tri-exponential decay model, images of extensive b-values, particularly of very low b-values, need to be acquired [74]. This is not feasible for many MRI scanners currently in clinical use.
For liver parenchyma DDVD measurement, recently Xiao et al. published a method (Figure 14) [79]. Only the liver tissue right to the right border of the vertebral body (or the right border of the vena cava if it is more to the right) is included. ROI for right liver parenchyma is segmented on the b = 0 s/mm2 image and the b = 2 s/mm2 image respectively. Since liver fibrosis mainly affect small/micro-vessels, while big vessels may even be dilated in severe fibrotic livers, ‘big’ vessels are removed from analysis. For this ‘vessel-pixel removing’ process, on the b = 0 s/mm2 image a threshold is evaluated and selected to remove all visible vessels which are of bright signal; on the b = 2 s/mm2 image, a threshold is evaluated and selected to remove all visible vessels which are of ‘signal void’. In some cases it is possible that b = 2 s/mm2 image may contain some residual bright signals as well as bright signal of biliary system. Using the same principle as for b = 0 s/mm2 images, bright signals on b = 2 s/mm2 image are also removed. Based on visual assessment, the threshold to remove signal vessels is determined individually for each slice and for each case. Within one study, the threshold to remove bright signal vessels on b = 0 s/mm2 images and the threshold to remove signal void vessels on b = 2 (or 15 s/mm2) images should be broadly similar across study subjects so to avoid human induced bias. DDVD analysis, which requires DWI image sets of two b-values (such as b = 0/2 or b = 0/10 s/mm2), has the advantage of simplicity, and image data can be acquired by a single breath-hold.
Figure 14.
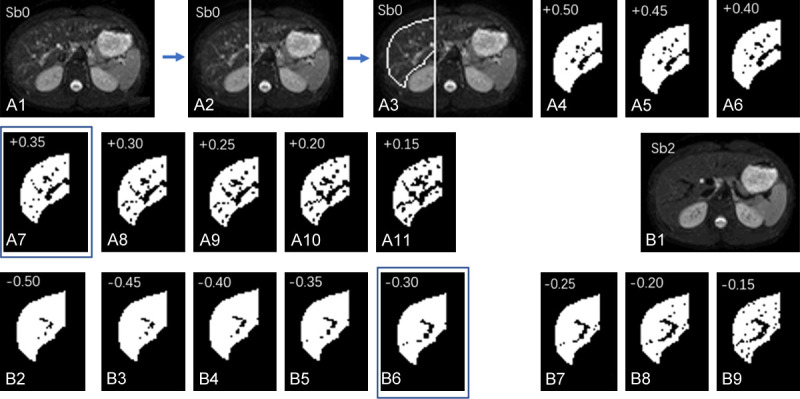
An example of ‘vessel-pixel-removal’ postprocessing of Sb0 image (b-value = 0 s/mm2) and Sb2 image (b-value = 2 s/mm2). (A1) The original Sb0 image. (A2) A vertical line is drawn along the right border of vertebral body, the liver left to this line is excluded from analysis; (A3) The liver right to the vertical line is segmented manually, resulting in an area0. (A3) The pixels with signal 50% higher than the mean signal of segmented liver is tentatively excluded; (A4) The pixels with signal 45% higher than the mean signal of segmented liver is tentatively excluded. (A5-A11) follow the same rule as (A3 and A4). (A7) With the pixels of signal 35% higher than the mean signal excluded shows best results (compromise) in removing ‘bright’ vessel pixels in this case. (A8-A11) are considered to have too much ‘over-kill’. (B1) The original Sb2 image; (B2) The right liver is segmented similarly to (A3), resulting in an area2, and the pixels with signal 50% lower than the mean signal of segmented liver is excluded. (B3-B9) follow the same rule as (B2). (B6) With the pixels of signal 30% lower than the mean signal of segmented liver excluded show best results (compromise) in removing ‘signal-void ‘vessel pixels’ for this case. (B7-B9) are considered to have too much ‘over-kill’. [Reproduced with permission from reference [79]].
A moderate and significant positive correlation was found between DDVD vs. PF, DDVD vs. Dfast, and DDVD vs. Dslow [79] (Figure 15). Since DDVD reflects vessel density, it is indeed expected that DDVD would be positively correlated with PF and Dfast (PF and Dfast are themselves positively and highly correlated). The positive correlation between DDVD and Dslow can be explained in that livers with richer vasculature will be associated with larger areas for freer diffusion (i.e., the same principle for higher diffusion of liver haemangioma).
Figure 15.
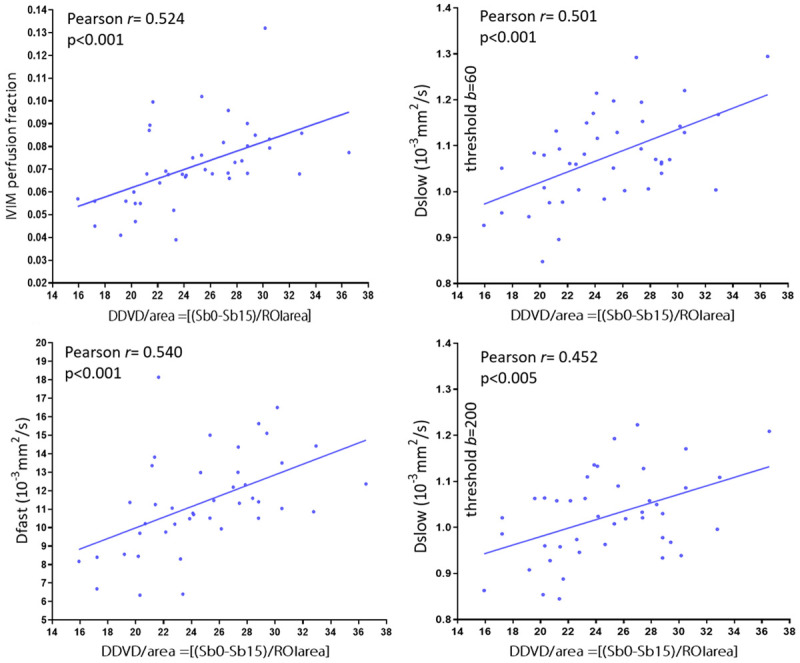
Correlation between DDVD and IVIM parameters. Data are from 26 healthy volunteers, 4 patients without fibrosis and 12 patients with various degree of viral hepatitis type-b induced fibrosis. A moderate and significant correlation is found between DDVD vs. PF, DDVD vs. Dfast, and DDVD vs. Dslow. A shift of threshold b-value from 60 s/mm2 to 200 s/mm2 only minimally weakens the correlation (Pearson r value from 0.501 to 0.452). [Results derived from reference [79], with permission].
Our tests showed DDVD (b0b2) and DDVD (b0b15) (or DDVD (b0b10)) report similar information (Figure 16) [69,79]. For scanners which do not allow non-zero b-value less than 10 s/mm2, DDVD (b0b10) may be used to represent DDVD (b0b2). For scanners which allow b value = 2 s/mm2, the average of DDVD (b0b2) and DDVD (b0b10) may be taken to increase the stability of DDVD measurement.
Figure 16.
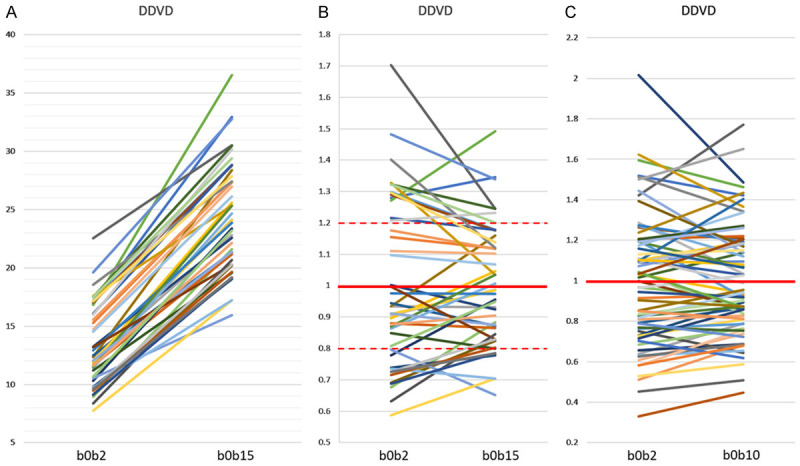
Correlations between DDVD (b0b2) vs. DDVD (b0b15) and DDVD (b0b2) vs. DDVD (b0b10). Hereby b0b2, b0b10, and b0b15 refer to the signal differences between b = 0 image and b = 2 s/mm2 image, between b = 0 image and b = 10 s/mm2 image, and between b = 0 image and b = 15 s/mm2 image, respectively. (A and B) are with data from reference 79 containing both healthy livers and fibrotic livers. (C) is with data from reference 69 containing only healthy livers. One line represents one study subject. As expected, DDVD (b0b15) values are all higher than DDVD (b0b2) values (A). In (B and C), the means of DDVD (b0b2) values and DDVD (b0b15, or b0b10) values are taken as 1, and individual values are normalised with the mean value. (B) shows, for those with DDVD (b0b2) value above 1, the corresponding DDVD (b0b15) values are also mostly above 1. For those with DDVD (b0b2) value between 1~0.8. the corresponding DDVD (b0b15) values are also mostly between 1~0.8. (C) shows the similar trend as in (B). (B and C) show DDVD (b0b15) or DDVD (b0b10) values are less scattered than DDVD (b0b2) values. [Original data from references [69,79], reproduced with permission].
IVIM b-value selection and image post-processing
One of the most important challenges to obtaining a good biexponential fitting of DW-MRI data is the ability to measure the tissue signal attenuation at low b-values. To select optimal b-value distribution and image post-processing method for IVIM analysis is critical. Currently, some MRI platforms do not have the flexibility to allow users to specify b-values and only fixed values or increments can be chosen, which limits the magnitude and number of lower b values that can be applied for IVIM acquisition. Future effort is required to ensure that all MRI scanners can deliver very low small b-values. Generally, more b-values will improve fitting stability [70]. ter Voert et al. [81] recommended 16 b-values for liver IVIM study. With respiratory gating, it is one respiration cycle per acquisition (usually taking place at the end of expiration when motion is minimal), thus TR refers to the time from radiofrequency excitation pulse to echo signal acquisition, and the respiration cycle of typically 4000 ms allows magnetization longitudinal recovery. A 16 b-values liver IVIM study commonly incurs a scan duration of around 5 min. Free-breathing DWI acquisition is more time efficient. Free-breathing DWI acquisition relies on multiple excitations to average out the motion effect since acquisitions with different b-values or repeated acquisition with the same b-value is likely to be from different parts of the respiratory cycle. Our own initial results suggest that, at least for ROI based analysis, respiratory triggered acquisition technique and free breathing generate very similar results of IVIM parameters. To mitigate respiration induced liver position shift, the concept of single-breathhold IVIM image series acquisition has been proposed [78].
An important point requires caution when estimating IVIM with parametric map is that, the bi-exponential nature of the signal as a function of b-values can be violated in voxels for various reasons, such as motion or susceptibility artifacts, leading to totally erroneous values if a fit of a bi-exponential signal equation is attempted. Thus, we favour ROI based analysis (instead of pixel-wise parametric analysis) whenever it is reasonable [17]. Images without sufficient SNR should also be removed from analysis. We also recommend discarding liver IVIM image series with substantial respiratory motions and poorly fitted curves [71]. During the image post-processing, it is critically important to check the quality of the fitting curves before adopting the fitted results (Figure 17).
Figure 17.
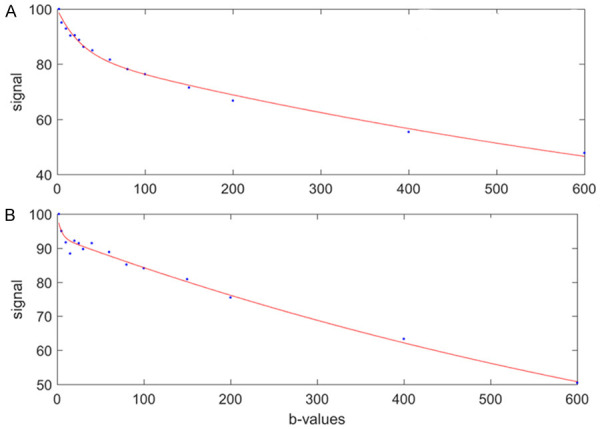
Bi-exponential segmented fitting curves of two liver IVIM scans with ROI (region-of-interest) based analysis. The b-value distribution is 2, 5, 10, 15, 20, 25, 30, 40, 60, 80, 100, 150, 200, 400, and 600 s/mm2, and fitting starts from b = 2 image. (A) represents a good fit and (B) represents an unacceptable fit that does not provide reliable measure. [Reproduced with permission from reference [6]].
With bi-exponential full fitting, the perfusion related fast compartment is estimated to contribute for around 17% of the total signal at b = 0 s/mm2, then decreases to become negligible at b ≥ 25 s/mm2 (Table 1) [67]. Thus, the commonly used threshold b-value of 200 s/mm2 (or 150 s/mm2) to separate a fast component and a slow component may be too high. Based on resulting smallest residuals, Wurnig et al. [82] suggested the optimal b-value threshold value should be 20 s/mm2 for right liver lobe and 40 s/mm2 for left liver lobe. When b = 0 image was not included for bi-exponential decay fitting, Wang et al. empirically showed that, as compared with the threshold b-value of 40, 80, 100, 150, and 200 s/mm2, the threshold b-value of 60 s/mm2 to separate Dfast and Dslow performed better in separating normal livers and fibrotic livers [72,80,83,84]. Huang et al. [69] also showed that the IVIM parameters derived with full fitting are very similar to the results from segmented fitting with threshold b of 60 s/mm2, while differ substantially from the results from segmented fitting with threshold b of 200 s/mm2 (Figure 8). As segmented fitting is by definition arbitrary, full fitting with sufficient b-values may be advocated.
Currently we use a 16 b-value series of 0, 2, 4, 7, 10, 15, 20, 30, 46, 60, 72, 100, 150, 200, 400, 600 s/mm2 [6,69]. The b-values selection is based our own experience and with the following considerations: 1) in most clinical scanners, the maximum b-value number allowed is 16; 2) image with b-value > 600 s/mm2 tend to have too much noise; 3) to densely sample images with b-value < 10 s/mm2 to model the initial fast signal decay, and 4) to relatively densely sample images with b-values around 60 s/mm2. The signal difference between b = 0 and b = 2 s/mm2 images is used for DDVD calculation. IVIM analysis is performed with fitting starting from b = 2 s/mm2. With standardized image analysis, our initial results suggest that IVIM results are comparable cross-scanners from different sites (unpublished data).
Riexinger et al. [74] proposed an optimized b-value distribution for tri-exponential IVIM analysis of the liver, which includes 16 b-values of 0, 0.3, 0.3, 1, 1.2, 1.5, 3.5, 5, 6, 45, 60, 70, 70, 70, 200, and 800 s/mm2. Low b-values are emphasized than high b-values. They suggested that, ideally, 16 or more b-values should be acquired. It is interesting that, the same to our recommendation [72], Riexinger et al. also emphasize the b-value data points around 60 and 70 s/mm2, even for tri-exponential fitting.
Bayesian probability (BP) analysis has been applied mainly to situations in which there is uncertainty in the problem (i.e., noise in the data) such that no unique solution exists. All of the information relevant to estimating a parameter is summarized in a probability density function. BP analysis offers another advantage in that the probability density function is obtained as an inherent part of the process of estimating each parameter and provides information regarding the uncertainty of the parameter estimate, with the shape of the probability density function reflecting data sets of different quality. Prior information can be incorporated into the BP analysis to improve the accuracy of the estimates. Recently, BP-based fitting methods have been explored with promising results for IVIM analysis. Neil et al. [85] suggested that BP performed substantially better than nonlinear least squares (NLLS) under conditions of relatively low SNR. In a healthy subject study for upper abdomen organ IVIM, Barbieri et al. [86] applied BP analysis and reported low inter-reader variability, low inter-subject variability, and high precision and accuracy, as compared other five methods (Levenberg-Marquardt (LM, full fitting), Trust-Region, Fixed-Dfast, Segmented-Unconstrained, and Segmented Constrained). However, fundamentally, the quality of parameter estimation is dependent upon the signal quality of the image data [87]. Neil et al. [85] note that, all else being equal, at high SNR, both BP and NLLS provide good parameter estimates. At low enough SNR, neither method provides good parameter estimates. However, there is a window in which BP provides good parameter estimates and NLLS does not, i.e., BP allows reasonable estimates at lower SNR than NLLS. BP provides an advantage over NLLS in parameter estimation under certain, but not all, circumstances.
In recent years, there has been a renewed interest in the use of artificial neural networks (ANNs) for data classification and regression analysis. Bertleff et al. [88] applied ANNs for voxel-wise parameter estimation with a combined IVIM and kurtosis model. The ANN approach was compared with conventional least-squares regression (LSR) and multi-step fitting (LSR-MS) in Monte-Carlo simulations and in vivo human brain DWI in terms of estimation accuracy and precision, number of outliers and sensitivity in the distinction between grey and white matters. They noted that estimations of all IVIM parameters (PF, Dslow, Dfast) were in good agreement with the literature using ANN, whereas LSR-MS resulted in Dfast overestimation and LSR yielded increased values for PF and Dfast, as well as decreased values for K of kurtosis model. Outliers were reduced with ANN. They suggest that ANNs may be a promising alternative to ordinary LSR with good resilience to noise and outliers. Barbieri et al. [89] reported the feasibility of training a deep neural network (DNN) for IVIM model fitting to liver DWI data, and the results were compared to least-squares and Bayesian approaches to IVIM fitting. They reported that parametric maps computed by the proposed algorithm were improved compared with least-squares and BP approaches. Furthermore, the RMSE (Root Mean Square Error) of estimated IVIM parameters based on simulated signals with a known ground truth was lowest for the DNN derived data. Further studies involving validation using diseased liver data acquired under various acquisition conditions remain to be pursued.
Clinical applications of liver intravoxel incoherent motion (IVIM) imaging
IVIM technique has been investigated in a number of clinical applications, most notably in liver fibrosis, NAFLD and nonalcoholic steatohepatitis (NASH), and liver tumors. It is generally accepted that Dfast is more difficult to evaluate than PF, particularly pixel-by-pixel Dfast map can be noisy, and therefore clinical studies have mostly concentrated on PF. During IVIM data acquisition and image analysis, efforts should be made particularly to ensure the reliability of PF estimation.
Age and gender dependence of IVIM parameters
The age dependent reduction in liver blood flow has been well documented using a variety of technical methods including histology, dye dilution, indicator clearance [90-93]. Huang et al. reported that DDVD analysis shows liver parenchyma has an age-dependent decrease of micro-perfusion volume (more so in women) [69]. Overall, young and middle-aged women tend to have higher micro-perfusion volume than that of age-matched men (Figure 18).
Figure 18.
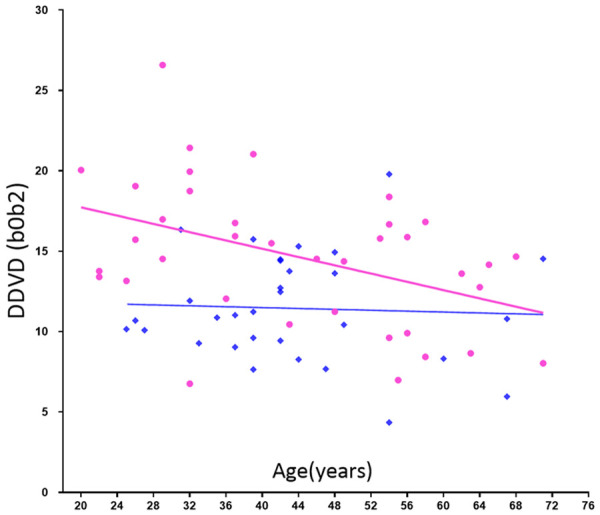
DDVD (b0b2) measure (Y-axis) of healthy volunteers and their age (X-axis). Results of women (pink balls) show a trend of decreasing as age increases. Young and middle-aged women tend to have higher DDVD measure than that of men (blue squares) of similar age. [Reproduced with permission from reference [69]].
Huang et al. [69] showed there is an age dependent Dslow decline in females (Figure 19). The age dependent Dslow decline for men is less apparent. We hypothesize this age dependent Dslow decline could be at least partially caused by age dependent iron deposition in the liver. Another possibility would be the influence of liver steatosis. Older age is associated higher prevalent of liver steatosis, and liver steatosis is more prevalent in men than women up to the age of 60 years. Beyond menopause, the prevalence of fatty liver rises sharply in women and exceeds that observed in their male counterparts [32]. Moreover, since aging is associated with a reduction of DDVD and Dslow is positively associated DDVD (Figure 15), a reduction of DDVD over aging may also partially contribute to Dslow decline in elderly subjects. As the magnitude of age and gender related liver IVIM differences is expected to be small compared with pathology induced differences, these results suggest the relative precision of IVIM quantification.
Figure 19.
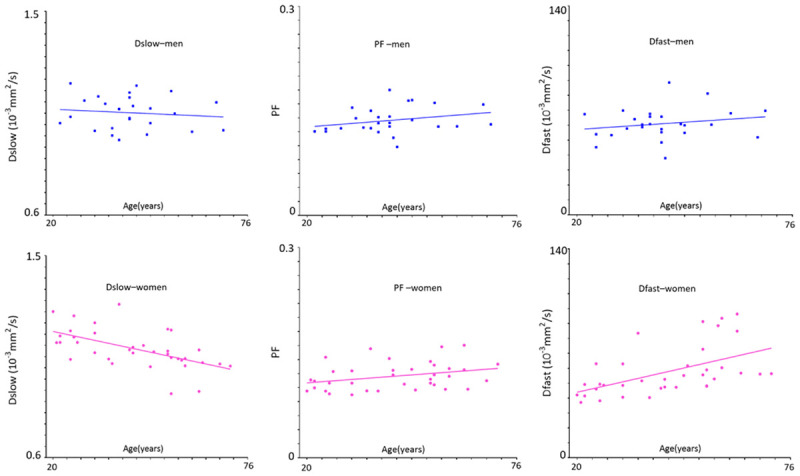
Relationship between IVIM measures and age in healthy volunteers. As the age increases, men’s Dslow shows a weak trend of decreasing, while women’s Dslow has significant reduction. Men and women’s PF and Dfast show a trend of increasing. Compared with young women, young men tend to have lower DDVD and Dslow measures and higher PF and Dfast measures; while around the age group of 40-55 years, all these measures are similar between men and women. The IVIM post-processing was based on segmented fittings with threshold b = 60 s/mm2 (full fitting shows similar trends). Blue square: males, red ball: females. [Modified with permission from reference [69]].
Paradoxically, Huang et al. [69] showed age dependent PF and Dfast increases (Figure 19). Thus, the PF and Dfast results give contradictory results compared with DDVD and known physiology of the liver aging. DDVD, PF and Dfast may measure different aspects of the liver perfusion to a certain extent. Due to their relative larger size and volume, micro-perfusion volume biomarker DDVD may measure more of veins than arteries. On the other hand, PF and Dfast may measure more of the arteries, which has faster flowing blood, than the veins. The study of Huang et al. demonstrated that the quantifications of both PF and Dfast are constrained by Dslow, i.e., lower Dslow may lead to higher PF and Dfast measurement, and even for full fitting and even PF and Dfast did not increase or even declined. More broadly, we argue that according to currently prevalent IVIM modeling there is a mutual constraining of diffusion component measure and perfusion component measure, i.e., if one component’s measure, being that of perfusion component or diffusion component, changes toward one direction (i.e., increase or decrease), the other component’s measure is constrained to change toward the opposite direction to a certain extent [94,95]. Note that, in the study by Riexinger et al. [77] investigating the 1.5T vs. 3T field strength’s effect on IVIM quantification with 20 healthy volunteers (age: 19-28 years) and 24 b-values: 0.2, 0.4, 0.7, 0.8, 1.1, 1.7, 3, 3.8, 4.1, 4.3, 4.4, 4.5, 4.9, 10, 15, 20, 30, 50, 60, 90, 95, 150, 180 and 500 s/mm2, they reported liver Dslow = 1.22/1.00 × 10-3 mm2/s at 1.5/3T, PF = 0.286/0.303 at 1.5/3T, thus also showing 1.5T scanner’s results had higher Dslow and lower PF, while 3.0T scanner’s results lower Dslow and higher PF (i.e., thus suggesting a trend of mutual constraining of diffusion measure and perfusion measure). This constrain is not absolute. For example, cerebral stroke can cause the reduction of both PF and Dslow in the ischemic core [96,97]. Examples, including those of our own [83,84,98], demonstrated the value of IVIM metrics as useful approximations in some scenarios , but not in all scenarios [94]. Considering that Dslow is likely affected by tissue iron deposition and steatosis, and also the measurement for PF and Dfast may be constrained by Dslow, Dslow, PF, and Dfast may be better called ‘Measured Dslow’, ‘Measured PF’, and ‘Measured Dfast’. Chronic liver diseases are often associated with iron overload and thus decreased Dslow. In such cases, the true PF and true Dfast would be lower than the ‘Measured PF’ and ‘Measured Dfast’ value. Since chronic liver diseases are usually associated with reduction in perfusion, the DWI measurement sensitivity of perfusion reduction would be attenuated by the liver iron overload. In a recent study, Lefebvre et al. [98] also noted that PF was positively correlated with steatosis (P = 0.001). As liver steatosis is expected to induce PF reduction, while in their study, as expected, Dslow was negatively correlated with steatosis (P < 0.001), it is possible that their PF was artificially promoted by IVIM modeling due to the ‘truly’ decreased Dslow [94].
Around and after menopause age, women and age-matched men have broadly similar DDVD and IVIM measures [69]. For the age group of 40-55 years, Huang et al. reported that DDVD (b0b2), DDVD (b0b10), Dslow, PF, and Dfast were 12.26 ± 3.90 au (arbitrary unit)/pixel, 16.95 ± 5.45 au/pixel, 1.072 ± 0.067 (10-3 mm2/s), 0.141 ± 0.025, 61.0 ± 14.0 (10-3 mm2/s) for men, and 13.35 ± 3.6 au/pixel, 17.20 ± 3.62 au/pixel, 1.069 ± 0.074 (10-3 mm2/s), 0.119 ± 0.014, 57.1 ± 13.2 (10-3 mm2/s) for women, respectively. Hereby DDVD (b0b2) and DDVD (b0b10) refer to signal difference between b = 0 vs. b = 2 s/mm2 images and b = 0 vs. b = 10 s/mm2 images respectively [69]. To derive these values, 15 b-values of 2, 4, 7, 10, 15, 20, 30, 46, 60, 72, 100, 150, 200, 400, 600 s/mm2 for IVIM analysis were used. The full fitting results were very similar to segmented fitting results with threshold b-value of 60 s/mm2 [69].
Applications of IVIM in liver fibrosis
Hepatic fibrosis can develop in patients with any chronic liver disease including hepatitis C, hepatitis B, alcoholic liver disease, and nonalcoholic fatty liver disease hepatitis. The progression from hepatic fibrosis to cirrhosis is generally slow, taking place over decades in conditions such as hepatitis C viral infection or NASH, but can occur more rapidly in the presence of biliary obstruction, immunosuppression in post-liver transplant patients, or with human immunodeficiency virus co-infection. If hepatic fibrosis is diagnosed at an early stage, it can be treated and reversed with weight loss in NASH and anti-viral therapy for hepatitis B or C infections [99]. The diagnosis and staging of hepatic fibrosis are important in clinical decision making. However, it is known that morphologic signs of cirrhosis on US, CT, and MRI alone are unreliable and are seen only with advanced disease.
Liver fibrosis can be associated with all three IVIM parameters decreased. However, among the three IVIM parameters, PF has consistently been shown to be the most responsive to liver fibrotic changes, probably due to that Dfast remains difficult to be estimated precisely [6,80,83,84]. On the other hand, Dslow can indeed decrease substantially in some fibrotic livers (Figure 20).
Figure 20.
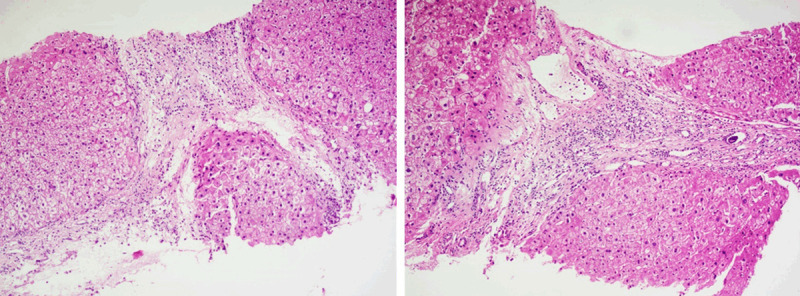
Histology results (right and left, both biopsy sample HE staining, magnification: × 100) from a patient with viral hepatitis-B induced liver cirrhosis (stage-4) in the study in reference 80. The Dslow was 0.75 × 10⁻³ mm-2/s, the reference for normal young livers was 1.16 × 10⁻³ mm2/s.
Wang et al. [84], Huang et al. [83], and Li et al. [80] recently published encouraging results (Figure 21). The report of Wang et al. had 16 healthy volunteers and 33 hepatitis B liver fibrosis patients, among them 15 patients had stage-1 liver fibrosis. The report of Huang et al. had 26 healthy volunteers and 12 hepatitis B liver fibrosis patients, among them 4 patients had stage-1 liver fibrosis. The report of Li et al. had 20 healthy volunteers and 28 hepatitis B liver fibrosis patients, among them 11 patients had stage-1 liver fibrosis. In these three studies, all fibrotic liver patients and healthy volunteers can be separated by IVIM analysis except one stage-2 fibrosis case in the study of Li et al. Interestingly, the studies of Huang et al. and Li et al. both had 4 patients respectively with biopsy showing no fibrosis, and these 8 subjects’ diffusing MRI measurements resembled healthy volunteers. Thus, while pathological process of fibrosis can drive down the liver blood perfusion (as shown with decreased Dfast and PF), mere viral hepatitis-b without fibrosis could show normal liver blood perfusion as well as diffusion. The study of Li et al. also demonstrated potential correlation between PF, Dfast and serum liver function biomarkers [80]. Weak correlations were shown with lower PF and lower Dfast associated with lower total protein, lower albumin (Figure 22), higher ALT, higher AST; higher total bilirubin, and higher direct bilirubin. No correlation was noted with Dslow and serum liver function biomarkers.
Figure 21.
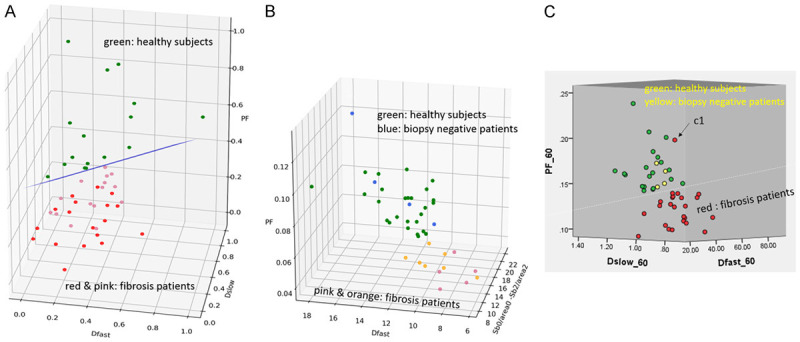
IVIM parameter three-dimensional plot of three studies by (A) Wang et al. [84], (B) Xiao et al. [79], and Li et al. (C) [80]. All modified with permission. The initial plot of Wang et al. in [84] has been re-drawn. (A) Green dots, liver of healthy volunteers; pink dot: stage-1/2 fibrotic livers; red dot: stage-3/4 fibrotic livers; (B) Green dot, liver of healthy volunteers; blue dots: 1 patient with mild simple steatosis and 3 viral hepatitis-b patients without liver fibrosis; orange dots: stage-1/2 patients; pink dots: stage-3/4 patients. (C) Green dot, liver of healthy volunteers; yellow dot: viral hepatitis-B patients without fibrosis; red dot: fibrotic livers.
Figure 22.
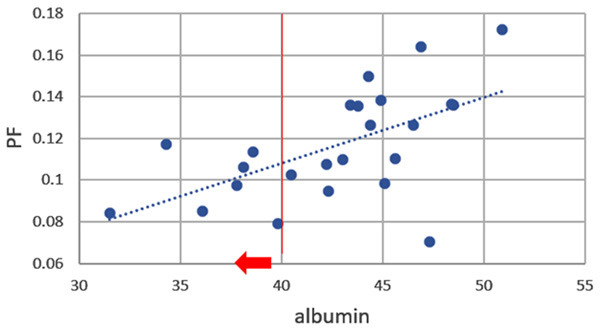
Correlation between IVIM readout PF and serum liver function biomarker of albumin (normal range: 40-55 g/L). Vertical redline separates normal range and abnormal values which is further marked by red arrow. The patients’ result in this study shows if PF value is above 0.12, then albumin value will not be abnormally low. [Reproduced with permission from reference [80]].
Previous studies showed there is a positive association between the severity of necroinflammatory activity and the development of fibrosis or cirrhosis [100-103]. Conceptually, liver inflammation would be associated with increased IVIM measures. This has been tentatively demonstrated by Li et al.’s work. Li et al. [80] show a trend that, grade-2 inflammation might be associated with higher liver perfusion as compared with grade-1 inflammation (Figure 23). In interpreting Figure 23, it should be noted that, since higher grade of inflammation is associated with higher grade of fibrosis and liver fibrosis is associated with a decrease of PF, Dfast and Dslow, then if inflammation does not influence diffusion and perfusion, grade-2 inflammation livers would demonstrate lower IVIM parameters. Since Figure 23 shows grade-1 inflammation livers and grade-2 inflammation livers had similar mean PF values, it is likely that inflammation might have promoted higher PF. On the other hand, Lefebvre et al. [98] reported that while fibrosis is a significant confounder on the association between inflammation and PF, PF correlated negatively with inflammation grade, even when accounting for steatosis and fibrosis. To assess fibrosis and inflammation’s relative contributions to PF requires accurate and reliable quantification of PF. More studies are needed to disentangle the relative contributions of fibrosis and inflammation.
Figure 23.
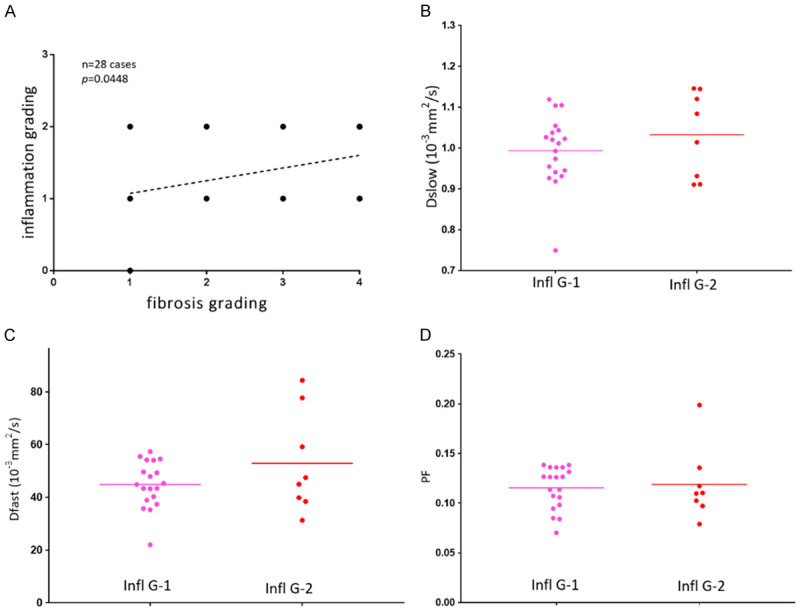
Relationship between IVIM measures and severity of inflammatory in liver fibrosis patients caused by viral hepatitis-B. (A) Correlation between fibrosis grading and inflammation. Inflammation grading includes grade-0, grade-1, and grade-2. There is a positive correlation between fibrosis grading and inflammation grading (P = 0.0448). Scatter plots and mean of Dslow (B), Dfast (C) and PF (D) for inflammation grade-1 (n = 19) and grade-2 (n = 8) patients with liver fibrosis (one fibrosis patient with inflammation grade-0 is not included). Infl G1: inflammation grade-1, Infl G2: inflammation grade-2. [Reproduced with permission from reference [80]].
As discussed earlier, a true lowering of Dslow can induce artificial elevation of PF, and a true lowering of PF can induce artificial elevation of Dslow [94,95]. It is possible that, for the published IVIM studies for liver fibrosis, both the magnitude of reduction for PF and Dslow have been both underestimated due to the currently prevalent IVIM modeling [95]. Thus, for each study, it is important to take consideration of all DWI metrics [84]. In a proof-of-concept study, Xiao et al. [79] demonstrated that DDVD helped the separation of fibrotic livers which tend to have a lower DDVD measure from livers without fibrosis, and livers with severe fibrosis tended to have even lower DDVD measurement than those with milder liver fibrosis. Furthermore, the combination of DDVD and IVIM parameters improved the separation of fibrotic and non-fibrotic livers [79]. It is important to develop a true diffusion metric which is not compromised by the perfusion component measure.
Applications of IVIM in NAFLD and NASH
NAFLD is defined by the deposition of lipids within hepatocytes in the absence of substantial alcohol intake. Approximately 20% of patients with NAFLD have a progressive form of the condition known as NASH, which is characterized by the presence of inflammation and hepatocellular injury in addition to steatosis. Patients with NASH may develop fibrosis and can progress to cirrhosis.
It is well established that liver steatosis is associated with lower Dslow [47,59,98,104]. Presence of fat may decrease the diffusion coefficient of water in tissue by restricting the diffusion of water within hepatocytes. Moreover, lipid signal peaks near water are often incompletely suppressed by the fat suppression techniques; and the measured diffusivity may incorporate the diffusion constant of lipid, which is much slower than water, with higher b-values leading to even lower observed diffusion coefficient [105,106]. Echo planar image acquisition commonly uses spatial-spectral pulses for fat suppression (i.e., water-only excitation). Water excitation pulses have a spectral bandwidth centered on the water peak (located at 4.7 ppm), while the NMR spectrum of triglycerides in liver fat has several peaks (between 4.2 and 5.3 ppm) close to the water peak [105]. Water excitation pulses, even in the absence of B0 inhomogeneities will excite about 9% of the triglyceride proton magnetization [106]. While liver steatosis is associated with lower Dslow, NASH and fibrosis are associated with lowered PF (and Dfast). In a study in adults , Murphy et al. reported that steatosis was associated with reduced Dslow and fibrosis with reduced PF [31]. Furthermore, in a study in children, Manning et al. also demonstrated ADC and Dslow decreased with steatosis and PF decreased with fibrosis [107]. Shin et al. [108] studied 123 children with 8 in the normal group, 93 in the fatty liver group, and 22 in the fibrotic liver group. They reported that Dfast value was lower in the fibrotic liver group compared with those of the normal and fatty liver groups. The PF value was lower in the fibrotic liver group compared with the fatty group. The Dslow and ADC values were not responsive for fibrotic liver changes [108]. In 59 type 2 diabetic patients, Parente et al. [109] reported that both NASH and fibrosis were associated with lower Dslow and lower Dfast. In an animal model, Joo et al. [110] reported that PF was significantly lower in rabbits with NAFLD than in those with a normal liver, and it decreased further as severity of NAFLD increased, with medians of 22.2%, 14.8%, 11.3%, and 9.5% in the rabbits in the normal, NAFLD, borderline, and NASH groups, respectively. Xie et al. [111] introduced liver NASH model in rabbits by feeding a varied duration of high-fat, high-cholesterol diet. In their pre-clinical model, they noted that PF had a moderate negative correlation with overall lesion activity, and a combination of PF and T1rho measured at hepatobiliary phase after Gd-EOB-DTPA administration offers highest diagnostic value for NASH (AUC = 0.971).
Applications of IVIM in liver tumors
Malignant liver tumors tend to have lower Dslow due to restricted diffusion (with high cellular density) and higher fast compartment measure (higher PF or/and higher Dfast) due to the increased tumor neovasulature. PF correlates with the extent and degree of tumor nodule enhancement in the arterial phase during contrast enhanced scan [112-114]. Woo et al. [112] reported that Dslow and ADC values were both significantly lower in high-grade HCC than in low-grade HCC, while this trend was better shown with Dslow than with ADC (as ADC including b = 0 image mixes both diffusion and perfusion compartments)
Wei et al. [115] reported that reduced ADC and Dslow were related to microvascular invasion of HCC at univariate analysis; while at multivariate analysis, only Dslow value was the independent risk factor for microvascular invasion of HCC. Choi et al. [116] reported similar PF for HCC and metastasis, but intrahepatic cholangiocarcinomas had lower PF. Compared with intrahepatic cholangiocarcinomas, HCC tends to be more hypervascular, which may explain a higher PF value for HCCs than for intrahepatic cholangiocarcinomas. Jerjir et al. [117] used IVIM (four b-values 0, 10, 150 and 800 s/mm-2) and dynamic contrast-enhanced MRI (DCE-MRI) to separate hepatocellular adenomas from focal nodular hyperplasias (FNHs). They included 8 hepatocellular adenomas and 13 FNHs, and showed hepatocellular adenomas had lower values for Ktrans (mean 1.45 vs. 2.68 min-1; P = 0.029) and Dslow (mean 1.02 vs. 1.22 × 10⁻³ mm2/s; P = 0.033). Both parameters showed diagnostic accuracy of 76%. Klauss et al. [118] reported FNH has higher Dslow and ADC than HCC, indicating FNH’s benign nature as compared with HCC. Moreover, both Klauss et al. and the Universitätsklinik Bonn group [119,120] reported higher PF in FNH than HCC, reflecting the rich vasculature nature of FNH.
The anti-angiogenic agent sorafenib (Nexavar) inhibits tumor-cell proliferation and tumor angiogenesis, prolongs the median survival and time to progression of patients with advanced HCC. This drug prolongs the stable state of HCC by reducing blood flow to the tumor and by increasing tumor-cell apoptosis, rather than by decreasing tumor size. The therapeutic effect of sorafenib could not be accurately evaluated using the Response Evaluation Criteria in Solid Tumors (RECIST). It has been proposed that assessing the effect on blood flow is more useful for the evaluation of the therapeutic outcomes, and IVIM may reflect tumor necrosis and neovascular inhibition resulting from the therapeutic effect of sorafenib. As compared with ADC and Dslow, it has also been shown that PF is a more responsive marker of sorafenib treatment for HCC. Granata et al. [121] also applied IVIM-MRI in the assessment of unresectablliver metastases from colorectal cancer treated with FOLFIR, 5-fluorouracil, leucovorin, irinotecan, and bevacizumab. Bevacizumab has several mechanisms of action that result in inhibition of new vessel growth, regression of newly formed tumor vasculature, normalization of tumor blood flow, and direct effects on tumor cells. MRI was performed for 36 metastases at baseline and after 14 days from starting the treatment. There was no statistically significant difference in Dslow between the pretreatment and the post-treatment findings. PF values showed a statistical difference between responder and non-responder lesions (n = 24 and n = 12 respectively, with a decrease of PF in responders), and they suggest percentage change of PF represents the most effective DWI marker for tumor treatment response. Shirota et al. [122] reported a decrease in the PF after 1 week of sorafenib treatment for HCC in the responders.
In a rabbit liver VX2 tumour model, Joo et al. [123] found a significant reduction in PF and Dfast just 4 hours after a vascular disrupting agent (CKD-516) administration. Further, a larger decrease in PF at 4-hour was correlated with a smaller increase in tumor size on Day 7 after treatment. Partial or complete recovery of IVIM parameters was observed at 24 h, suggesting tumor revascularization. In another study [124], Joo et al. investigated whether IVIM parameters correlate with DCE-MRI in longitudinal settings for monitoring the therapeutic effects of CKD-516 in rabbit VX2 liver tumors. They demonstrated that, in the treated group, Dfast, PF, Ktrans, and iAUC (initial area under the gadolinium concentration-time curve until 60 seconds) significantly decreased at 4-hour after CKD-516 administration. Dfast and PF showed significant positive correlations with Ktrans and iAUC. They suggested that IVIM perfusion parameters can be used as alternatives to DCE-MRI in reflecting the dynamic changes in tumor perfusion during the longitudinal monitoring of vascular disrupting agent treatment.
The recent finding that there is a mutual constraining of diffusion component measure and perfusion component measure calls for caution in interpretation IVIM metrics derived from the currently prevalent bi-exponential decay modelling (Equation-5) [69,94,95]. Most malignant liver tumors have low diffusion (due to higher cellularity etc.), this will lead to their IVIM derived perfusion can ‘always’ be high as PF is artificially promoted due to low Dslow. On the other hand, since malignant tumors tend to have high blood perfusion and PF, their Dslow will be measured ‘always’ lower.
Applications of IVIM in hepatic sinusoidal obstruction syndrome
Hepatic sinusoidal obstruction syndrome (SOS) is a toxic liver injury affecting sinusoidal endothelial cells caused by systemic chemotherapy, hematopoietic stem cell transplantation, or some herb medications [125,126]. SOS is histologically characterized by hepatocyte necrosis, endothelial damage, and sinusoidal fibrosis, which change both liver diffusion and perfusion. In a pre-clinical study based on rat model with hepatic SOS induced by monocrotaline gavage, Hong et al. [127] noted that ADC, Dslow, and PF of the liver parenchyma were significantly different according to SOS severity groups and significantly decreased as SOS severity increased. Among ADC and IVIM-derived parameters, PF provided the highest area under the ROC curves for detecting ≥ mild, ≥ moderate, and severe SOS (0.803, 0.890, and 0.991, respectively). These observations concur with the liver fibrosis studies [80-84,111], where PF is the most responsive parameter to fibrosis.
Of note, for all pathologies, it is more likely that the measured PF and Dfast change in the same direction (i.e., both increase or both decrease), as intuitively and evidently measured PF and Dfast are highly correlated (Figure 24) [83]. In cases when PF and Dfast change in opposite directions, measurement reliability should be carefully re-checked. It is well known that unless very low b-value images are densely sampled, it is difficult to determine Dfast accurately [70,128].
Figure 24.
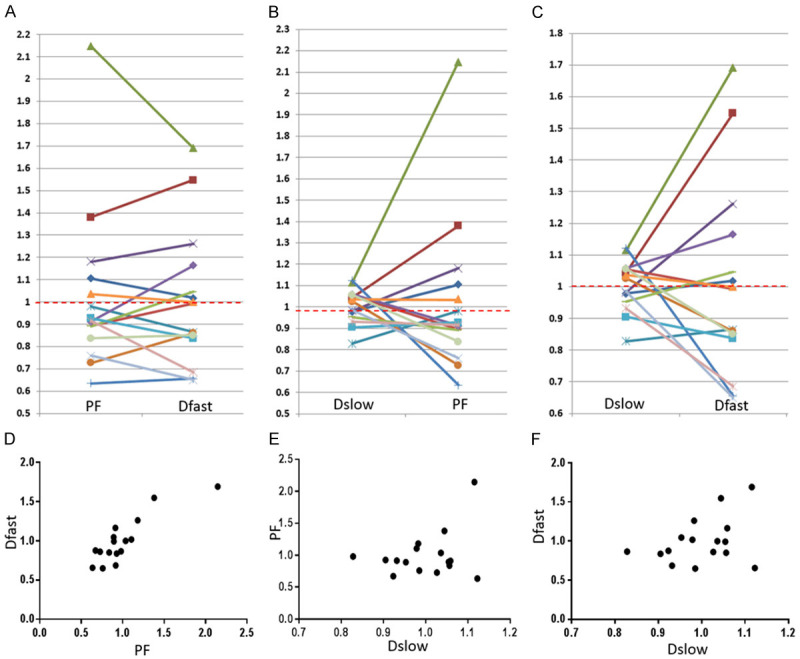
Graphical demonstration of the correlations among PF, Dfast, and Dslow. The mean measures of PF, Dslow, and Dfast for 16 patients are re-scaled to be 1. Each line or dot represents one study subject. Most of the PF measurements smaller than 1 are associated with Dfast smaller than 1, and vice versa. The lowest PF measurement is associated with the lowest Dfast measurement, and highest three PF measurements are associated with the highest three Dfast measurements (A, D). On the other hand, the associations between Dslow vs. PF or between Dslow vs. Dfast are scattered (B, C, E, F). A number of Dslow measurements larger than 1 are associated with PF or Dfast measurements smaller than 1. Pearson correlation coefficient r was 0.865 (P < 0.001) for PF vs. Dfast (not significant for Dslow vs. PF and Dslow vs. Dfast). [Reproduced with permission from reference 83]].
Moreover, as DDVD can be conveniently derived and DDVD is not constrained by IVIM modelling, it is highly anticipated that the integration of DDVD into conventional IVIM parameters can improve diagnostic performance of liver DWI [69,79].
Finally, as also demonstrated with ADC studies, post-meal and fasted status may influence (portal) blood flow to the liver, it can be recommended that patients fast for 6 hours before liver IVIM imaging [129].
In conclusion, using DW-MRI to derive living tissue perfusion and diffusion information can potentially have important clinical applications. In the meantime, users should be aware that currently there are significant challenges and uncertainties in implementing quantitative DW-MRI analysis. IVIM data analysis requires high-quality data acquisition using multiple b-values and confidence in the measurements at low b-values. With the currently prevalent IVIM biexponential decay modeling method, the perfusion parameter measure and the diffusion parameter measure are mutually constrained, the values of IVIM metrics can only be considered as useful approximations. Further research into IVIM modeling to better separate diffusion component and perfusion component should be pursued. Currently, acquisition protocols vary between research groups; patient preparation, data post-processing and image analysis are also not standardized. Better standardization is imperative, standardization of data acquisition and processing processes may allow generation of reliable diffusion MRI biomarkers broadly applicable in clinical practice and allow cross-center comparison of results.
Acknowledgements
The writing-up of this paper was partially supported by a Hong Kong GRF grant (Project No. 14109218).
Disclosure of conflict of interest
None.
References
- 1.Norris DG. The effects of microscopic tissue parameters on the diffusion weighted magnetic resonance imaging experiment. NMR Biomed. 2001;14:77–93. doi: 10.1002/nbm.682. [DOI] [PubMed] [Google Scholar]
- 2.Mills R. Self-diffusion in normal and heavy-water in range 1-45 degrees. J Phys Chem. 1973;77:685–688. [Google Scholar]
- 3.Stejskal EO, Tanner JE. Spin diffusion measurements: spin echoes in the presence of a time-dependent field gradient. J Cheml Phys. 1965;42:288–92. [Google Scholar]
- 4.Le Bihan D, Breton E, Lallemand D, Grenier P, Cabanis E, Laval-Jeantet M. MR imaging of intravoxel incoherent motions: application to diffusion and perfusion in neurologic disorders. Radiology. 1986;161:401–7. doi: 10.1148/radiology.161.2.3763909. [DOI] [PubMed] [Google Scholar]
- 5.Le Bihan D, Turner R, Moonen CT, Pekar J. Imaging of diffusion and microcirculation with gradient sensitization: design, strategy, and significance. J Magn Reson Imaging. 1991;1:7–28. doi: 10.1002/jmri.1880010103. [DOI] [PubMed] [Google Scholar]
- 6.Wang YX, Wang X, Wu P, Wang Y, Chen W, Chen H, Li J. Topics on quantitative liver magnetic resonance imaging. Quant Imaging Med Surg. 2019;9:1840–1890. doi: 10.21037/qims.2019.09.18. [DOI] [PMC free article] [PubMed] [Google Scholar]
- 7.Taouli B, Koh DM. Diffusion-weighted MR imaging of the liver. Radiology. 2010;254:47–66. doi: 10.1148/radiol.09090021. [DOI] [PubMed] [Google Scholar]
- 8.Ljimani A, Caroli A, Laustsen C, Francis S, Mendichovszky IA, Bane O, Nery F, Sharma K, Pohlmann A, Dekkers IA, Vallee JP, Derlin K, Notohamiprodjo M, Lim RP, Palmucci S, Serai SD, Periquito J, Wang ZJ, Froeling M, Thoeny HC, Prasad P, Schneider M, Niendorf T, Pullens P, Sourbron S, Sigmund EE. Consensus-based technical recommendations for clinical translation of renal diffusion-weighted MRI. MAGMA. 2020;33:177–195. doi: 10.1007/s10334-019-00790-y. [DOI] [PMC free article] [PubMed] [Google Scholar]
- 9.Ni P, Lin Y, Zhong Q, Chen Z, Sandrasegaran K, Lin C. Technical advancements and protocol optimization of diffusion-weighted imaging (DWI) in liver. Abdom Radiol (NY) 2016;41:189–202. doi: 10.1007/s00261-015-0602-x. [DOI] [PubMed] [Google Scholar]
- 10.Guiu B, Cercueil JP. Liver diffusion-weighted MR imaging: the tower of Babel? Eur Radiol. 2011;21:463–7. doi: 10.1007/s00330-010-2017-y. [DOI] [PubMed] [Google Scholar]
- 11.Jafar MM, Parsai A, Miquel ME. Diffusion-weighted magnetic resonance imaging in cancer: reported apparent diffusion coefficients, in-vitro and in-vivo reproducibility. World J Radiol. 2016;8:21–49. doi: 10.4329/wjr.v8.i1.21. [DOI] [PMC free article] [PubMed] [Google Scholar]
- 12.Braithwaite AC, Dale BM, Boll DT, Merkle EM. Short- and midterm reproducibility of apparent diffusion coefficient measurements at 3.0-T diffusion-weighted imaging of the abdomen. Radiology. 2009;250:459–465. doi: 10.1148/radiol.2502080849. [DOI] [PubMed] [Google Scholar]
- 13.Miquel ME, Scott AD, Macdougall ND, Boubertakh R, Bharwani N, Rockall AG. In vitro and in vivo repeatability of abdominal diffusion-weighted MRI. Br J Radiol. 2012;85:1507–1512. doi: 10.1259/bjr/32269440. [DOI] [PMC free article] [PubMed] [Google Scholar]
- 14.Colagrande S, Pasquinelli F, Mazzoni LN, Belli G, Virgili G. MR-diffusion weighted imaging of healthy liver parenchyma: repeatability and reproducibility of apparent diffusion coefficient measurement. J Magn Reson Imaging. 2010;31:912–920. doi: 10.1002/jmri.22117. [DOI] [PubMed] [Google Scholar]
- 15.Hollingsworth KG, Lomas DJ. Influence of perfusion on hepatic MR diffusion measurement. NMR Biomed. 2006;19:231–5. doi: 10.1002/nbm.1028. [DOI] [PubMed] [Google Scholar]
- 16.Winfield JM, Papoutsaki MV, Ragheb H, Morris DM, Heerschap A, ter Voert EG, Kuijer JP, Pieters IC, Douglas NH, Orton M, de Souza NM QuIC-ConCePT Consortium. Development of a diffusion-weighted MRI protocol for multicentre abdominal imaging and evaluation of the effects of fasting on measurement of apparent diffusion coefficients (ADCs) in healthy liver. Br J Radiol. 2015;88:20140717. doi: 10.1259/bjr.20140717. [DOI] [PMC free article] [PubMed] [Google Scholar]
- 17.Yuan J, Wong OL, Lo GG, Chan HH, Wong TT, Cheung PS. Statistical assessment of bi-exponential diffusion weighted imaging signal characteristics induced by intravoxel incoherent motion in malignant breast tumors. Quant Imaging Med Surg. 2016;6:418–29. doi: 10.21037/qims.2016.08.05. [DOI] [PMC free article] [PubMed] [Google Scholar]
- 18.Malyarenko DI, Newitt D, J Wilmes L, Tudorica A, Helmer KG, Arlinghaus LR, Jacobs MA, Jajamovich G, Taouli B, Yankeelov TE, Huang W, Chenevert TL. Demonstration of nonlinearity bias in the measurement of the apparent diffusion coefficient in multicenter trials. Magn Reson Med. 2016;75:1312–23. doi: 10.1002/mrm.25754. [DOI] [PMC free article] [PubMed] [Google Scholar]
- 19.Rosenkrantz AB, Oei M, Babb JS, Niver BE, Taouli B. Diffusion-weighted imaging of the abdomen at 3.0 Tesla: image quality and apparent diffusion coefficient reproducibility compared with 1.5 Tesla. J Magn Reason Imaging. 2011;33:128–135. doi: 10.1002/jmri.22395. [DOI] [PubMed] [Google Scholar]
- 20.Donati OF, Chong D, Nanz D, Boss A, Froehlich JM, Andres E, Seifert B, Thoeny HC. Diffusion-weighted MR imaging of upper abdominal organs: field strength and intervendor variability of apparent diffusion coefficients. Radiology. 2014;270:454–463. doi: 10.1148/radiol.13130819. [DOI] [PubMed] [Google Scholar]
- 21.Cui Y, Dyvorne H, Besa C, Cooper N, Taouli B. IVIM diffusion-weighted Imaging of the Liver at 3.0T: comparison with 1.5T. Eur J Radiol Open. 2015;2:123–128. doi: 10.1016/j.ejro.2015.08.001. [DOI] [PMC free article] [PubMed] [Google Scholar]
- 22.Chiu FY, Jao JC, Chen CY, Liu GC, Jaw TS, Chiou YY, Hsu FO, Hsu JS. Effect of intravenous gadolinium-DTPA on diffusion-weighted magnetic resonance images for evaluation of focal hepatic lesions. J Comput Assist Tomogr. 2005;29:176–180. doi: 10.1097/01.rct.0000157472.98277.5c. [DOI] [PubMed] [Google Scholar]
- 23.Saito K, Araki Y, Park J, Metoki R, Katsuyama H, Nishio R, Kakizaki D, Moriyasu F, Tokuuye K. Effect of Gd-EOB-DTPA on T2-weighted and diffusion-weighted images for the diagnosis of hepatocellular carcinoma. J Magn Reson Imaging. 2010;32:229–234. doi: 10.1002/jmri.22219. [DOI] [PubMed] [Google Scholar]
- 24.Choi JS, Kim MJ, Choi JY, Park MS, Lim JS, Kim KW. Diffusion-weighted MR imaging of liver on 3.0-Tesla system: effect of intravenous administration of gadoxetic acid disodium. Eur Radiol. 2010;20:1052–1060. doi: 10.1007/s00330-009-1651-8. [DOI] [PubMed] [Google Scholar]
- 25.Colagrande S, Mazzoni LN, Mazzoni E, Pradella S. Effects of gadoxetic acid on quantitative diffusion-weighted imaging of the liver. J Magn Reson Imaging. 2013;38:365–370. doi: 10.1002/jmri.23978. [DOI] [PubMed] [Google Scholar]
- 26.Leitão HS, Doblas S, Garteiser P, d’Assignies G, Paradis V, Mouri F, Geraldes CF, Ronot M, Van Beers BE. Hepatic fibrosis, inflammation, and steatosis: influence on the MR viscoelastic and diffusion parameters in patients with chronic liver disease. Radiology. 2017;283:98–107. doi: 10.1148/radiol.2016151570. [DOI] [PubMed] [Google Scholar]
- 27.Bülow R, Mensel B, Meffert P, Hernando D, Evert M, Kühn JP. Diffusion-weighted magnetic resonance imaging for staging liver fibrosis is less reliable in the presence of fat and iron. Eur Radiol. 2013;23:1281–7. doi: 10.1007/s00330-012-2700-2. [DOI] [PubMed] [Google Scholar]
- 28.Leitão HS, Doblas S, d’Assignies G, Garteiser P, Daire JL, Paradis V, Geraldes CF, Vilgrain V, Van Beers BE. Fat deposition decreases diffusion parameters at MRI: a study in phantoms and patients with liver steatosis. Eur Radiol. 2013;23:461–7. doi: 10.1007/s00330-012-2626-8. [DOI] [PubMed] [Google Scholar]
- 29.Poyraz AK, Onur MR, Kocakoç E, Oğur E. Diffusion-weighted MRI of fatty liver. J Magn Reson Imaging. 2012;35:1108–11. doi: 10.1002/jmri.23519. [DOI] [PubMed] [Google Scholar]
- 30.Anderson SW, Soto JA, Milch HN, Ozonoff A, O’Brien M, Hamilton JA, Jara HJ. Effect of disease progression on liver apparent diffusion coefficient values in a murine model of NASH at 11.7 Tesla MRI. J Magn Reson Imaging. 2011;33:882–8. doi: 10.1002/jmri.22481. [DOI] [PubMed] [Google Scholar]
- 31.Murphy P, Hooker J, Ang B, Wolfson T, Gamst A, Bydder M, Middleton M, Peterson M, Behling C, Loomba R, Sirlin C. Associations between histologic features of nonalcoholic fatty liver disease (NAFLD) and quantitative diffusion-weighted MRI measurements in adults. J Magn Reson Imaging. 2015;41:1629–38. doi: 10.1002/jmri.24755. [DOI] [PMC free article] [PubMed] [Google Scholar]
- 32.Gan L, Chitturi S, Farrell GC. Mechanisms and implications of age-related changes in the liver: nonalcoholic fatty liver disease in the elderly. Curr Gerontol Geriatr Res. 2011;2011:831536. doi: 10.1155/2011/831536. [DOI] [PMC free article] [PubMed] [Google Scholar]
- 33.Le Bihan D, Poupon C, Amadon A, Lethimonnier F. Artifacts and pitfalls in diffusion MRI. J Magn Reson Imaging. 2006;24:478–488. doi: 10.1002/jmri.20683. [DOI] [PubMed] [Google Scholar]
- 34.Chandarana H, Do RK, Mussi TC, Jensen JH, Hajdu CH, Babb JS, Taouli B. The effect of liver iron deposition on hepatic apparent diffusion coefficient values in cirrhosis. AJR Am J Roentgenol. 2012;199:803–808. doi: 10.2214/AJR.11.7541. [DOI] [PubMed] [Google Scholar]
- 35.Schwenzer NF, Machann J, Haap MM, Martirosian P, Schraml C, Liebig G, Stefan N, Häring HU, Claussen CD, Fritsche A, Schick F. T2* relaxometry in liver, pancreas, and spleen in a healthy cohort of one hundred twenty-nine subjects-correlation with age, gender, and serum ferritin. Invest Radiol. 2008;43:854–60. doi: 10.1097/RLI.0b013e3181862413. [DOI] [PubMed] [Google Scholar]
- 36.Weinfeld A, Lundin P, Lundvall O. Significance for the diagnosis of iron overload of histochemical and chemical iron in the liver of control subjects. J Clin Pathol. 1968;21:35–40. doi: 10.1136/jcp.21.1.35. [DOI] [PMC free article] [PubMed] [Google Scholar]
- 37.Zacharski LR, Ornstein DL, Woloshin S, Schwartz LM. Association of age, sex, and race with body iron stores in adults: analysis of NHANES III data. Am Heart J. 2000;140:98–104. doi: 10.1067/mhj.2000.106646. [DOI] [PubMed] [Google Scholar]
- 38.Charlton RW, Hawkins DM, Mavor WO, Bothwell TH. Hepatic storage iron concentrations in different population groups. Am J Clin Nutr. 1970;23:358–70. doi: 10.1093/ajcn/23.3.358. [DOI] [PubMed] [Google Scholar]
- 39.Gautier du Défaix H, Puente R, Vidal B, Pérez E, Vidal H. Liver storage iron in normal population of Cuba. Am J Clin Nutr. 1980;33:133–6. doi: 10.1093/ajcn/33.1.133. [DOI] [PubMed] [Google Scholar]
- 40.Chen L, Zhu Z, Peng X, Wang Y, Wang Y, Chen M, Qi Wang Q, Jin J. Hepatic magnetic resonance imaging with T2* mapping of ovariectomized rats: correlation between iron overload and postmenopausal osteoporosis. Eur Radiol. 2014;24:1715–24. doi: 10.1007/s00330-014-3178-x. [DOI] [PubMed] [Google Scholar]
- 41.Ludwig J, Hashimoto E, Porayko MK, Moyer TP, Baldus WP. Hemosiderosis in cirrhosis: a study of 447 native livers. Gastroenterology. 1997;112:882–8. doi: 10.1053/gast.1997.v112.pm9041250. [DOI] [PubMed] [Google Scholar]
- 42.Lefkowitch JH, Yee HT, Sweeting J, Green PH, Magun AM. Iron-rich foci in chronic viral hepatitis. Hum Pathol. 1998;29:116–8. doi: 10.1016/s0046-8177(98)90219-2. [DOI] [PubMed] [Google Scholar]
- 43.Cojocariu C, Trifan A, Mihailovici MS, Danciu M, Stanciu C. Liver hemosiderosis study in chronic viral hepatitis. Rev Med Chir Soc Med Nat Iasi. 2008;112:914–21. [PubMed] [Google Scholar]
- 44.Metens T, Ferraresi KF, Farchione A, Moreno C, Bali MA, Matos C. Normal hepatic parenchyma visibility and ADC quantification on diffusion-weighted MRI at 3 T: influence of age, gender, and iron content. Eur Radiol. 2014;24:3123–33. doi: 10.1007/s00330-014-3353-0. [DOI] [PubMed] [Google Scholar]
- 45.Yu MH, Lee JM, Hur BY, Kim TY, Jeong SY, Yi NJ, Suh KS, Han JK, Choi BI. Gadoxetic acid-enhanced MRI and diffusion weighted imaging for the detection of colorectal liver metastases after neoadjuvant chemotherapy. Eur Radiol. 2015;25:2428–2436. doi: 10.1007/s00330-015-3615-5. [DOI] [PubMed] [Google Scholar]
- 46.Koh DM, Collins DJ, Wallace T, Chau I, Riddell AM. Combining diffusion-weighted MRI with Gd-EOB-DTPA-enhanced MRI improves the detection of colorectal liver metastases. Br J Radiol. 2012;85:980–989. doi: 10.1259/bjr/91771639. [DOI] [PMC free article] [PubMed] [Google Scholar]
- 47.Lim KS. Diffusion-weighted MRI of hepatocellular carcinoma in cirrhosis. Clin Radiol. 2014;69:1–10. doi: 10.1016/j.crad.2013.07.022. [DOI] [PubMed] [Google Scholar]
- 48.Kim YK, Lee WJ, Park MJ, Kim SH, Rhim H, Choi D. Hypovascular hypointense nodules on hepatobiliary phase gadoxetic acid-enhanced MR images in patients with cirrhosis: potential of DW imaging in predicting progression to hypervascular HCC. Radiology. 2012;265:104–114. doi: 10.1148/radiol.12112649. [DOI] [PubMed] [Google Scholar]
- 49.Padhani AR, Liu G, Koh DM, Chenevert TL, Thoeny HC, Takahara T, Dzik-Jurasz A, Ross BD, Van Cauteren M, Collins D, Hammoud DA, Rustin GJ, Taouli B, Choyke PL. Diffusion-weighted magnetic resonance imaging as a cancer biomarker: consensus and recommendations. Neoplasia. 2009;11:102–25. doi: 10.1593/neo.81328. [DOI] [PMC free article] [PubMed] [Google Scholar]
- 50.Fliedner FP, Engel TB, El-Ali HH, Hansen AE, Kjaer A. Diffusion weighted magnetic resonance imaging (DW-MRI) as a non-invasive, tissue cellularity marker to monitor cancer treatment response. BMC Cancer. 2020;20:134. doi: 10.1186/s12885-020-6617-x. [DOI] [PMC free article] [PubMed] [Google Scholar]
- 51.Cao L, Chen J, Duan T, Wang M, Jiang H, Wei Y, Xia C, Zhou X, Yan X, Song B. Diffusion kurtosis imaging (DKI) of hepatocellular carcinoma: correlation with microvascular invasion and histologic grade. Quant Imaging Med Surg. 2019;9:590–602. doi: 10.21037/qims.2019.02.14. [DOI] [PMC free article] [PubMed] [Google Scholar]
- 52.Namimoto T, Nakagawa M, Kizaki Y, Itatani R, Kidoh M, Utsunomiya D, Oda S, Yamashita Y. Characterization of liver tumors by diffusion-weighted imaging: comparison of diagnostic performance using the mean and minimum apparent diffusion coefficient. J Comput Assist Tomogr. 2015;39:453–461. doi: 10.1097/RCT.0000000000000228. [DOI] [PubMed] [Google Scholar]
- 53.Nishie A, Tajima T, Asayama Y, Ishigami K, Kakihara D, Nakayama T, Takayama Y, Okamoto D, Fujita N, Taketomi A, Yoshimitsu K, Honda H. Diagnostic performance of apparent diffusion coefficient for predicting histological grade of hepatocellular carcinoma. Eur J Radiol. 2011;80:e29–e33. doi: 10.1016/j.ejrad.2010.06.019. [DOI] [PubMed] [Google Scholar]
- 54.Moriya T, Saito K, Tajima Y, Harada TL, Araki Y, Sugimoto K, Tokuuye K. 3D analysis of apparent diffusion coefficient histograms in hepatocellular carcinoma: correlation with histological grade. Cancer Imaging. 2017;17:1. doi: 10.1186/s40644-016-0103-3. [DOI] [PMC free article] [PubMed] [Google Scholar]
- 55.Hammer MM, Mellnick VM, Raptis CA, Schmidt R, Fowler KJ. Peripheral restricted diffusion: a common appearance of hepatic abscesses. J Comput Assist Tomogr. 2015;39:890–5. doi: 10.1097/RCT.0000000000000309. [DOI] [PubMed] [Google Scholar]
- 56.Taouli B, Chouli M, Martin AJ, Qayyum A, Coakley FV, Vilgrain V. Chronic hepatitis: role of diffusion-weighted imaging and diffusion tensor imaging for the diagnosis of liver fibrosis and inflammation. J Magn Reson Imaging. 2008;28:89–95. doi: 10.1002/jmri.21227. [DOI] [PubMed] [Google Scholar]
- 57.Kocakoc E, Bakan AA, Poyrazoglu OK, Dagli AF, Gul Y, Cicekci M, Bahcecioglu IH. Assessment of liver fibrosis with diffusion-weighted magnetic resonance imaging using different b-values in chronic viral hepatitis. Med Princ Pract. 2015;24:522–6. doi: 10.1159/000434682. [DOI] [PMC free article] [PubMed] [Google Scholar]
- 58.Do RK, Chandarana H, Felker E, Hajdu CH, Babb JS, Kim D, Taouli B. Diagnosis of liver fibrosis and cirrhosis with diffusion-weighted imaging: value of normalized apparent diffusion coefficient using the spleen as reference organ. AJR Am J Roentgenol. 2010;195:671–676. doi: 10.2214/AJR.09.3448. [DOI] [PubMed] [Google Scholar]
- 59.Petitclerc L, Sebastiani G, Gilbert G, Cloutier G, Tang A. Liver fibrosis: review of current imaging and MRI quantification techniques. J Magn Reson Imaging. 2017;45:1276–95. doi: 10.1002/jmri.25550. [DOI] [PubMed] [Google Scholar]
- 60.Sandrasegaran K, Ramaswamy R, Ghosh S, Tahir B, Akisik FM, Saxena R, Kwo P. Diffusion-weighted MRI of the transplanted liver. Clin Radiol. 2011;66:820–5. doi: 10.1016/j.crad.2010.12.020. [DOI] [PubMed] [Google Scholar]
- 61.Koh DM, Collins DJ, Orton MR. Intravoxel incoherent motion in body diffusion-weighted MRI: reality and challenges. AJR Am J Roentgenol. 2011;196:1351–1361. doi: 10.2214/AJR.10.5515. [DOI] [PubMed] [Google Scholar]
- 62.Sakuma H, Tamagawa Y, Kimura H, Hayashi N, Nakatsugawa S, Odori T, Ishii Y. Intravoxel incoherent motion (IVIM) imaging using an experimental MR unit with small bore. Nippon Igaku Hoshasen Gakkai Zasshi. 1989;49:941–943. [PubMed] [Google Scholar]
- 63.Sun X, Wang H, Chen F, De Keyzer F, Yu J, Jiang Y, Feng Y, Li J, Marchal G, Ni Y. Diffusion-weighted MRI of hepatic tumor in rats: comparison between in vivo and postmortem imaging acquisitions. J Magn Reson Imaging. 2009;29:621–628. doi: 10.1002/jmri.21675. [DOI] [PubMed] [Google Scholar]
- 64.Lemke A, Laun FB, Simon D, Stieltjes B, Schad LR. An in vivo verification of the intravoxel incoherent motion effect in diffusion-weighted imaging of the abdomen. Magn Reson Med. 2010;64:1580–1585. doi: 10.1002/mrm.22565. [DOI] [PubMed] [Google Scholar]
- 65.Federau C. Intravoxel incoherent motion MRI as a means to measure in vivo perfusion: A review of the evidence. NMR in Biomedicine. 2017;30:e3780. doi: 10.1002/nbm.3780. [DOI] [PubMed] [Google Scholar]
- 66.Jensen JH, Helpern JA. MRI quantification of non-Gaussian water diffusion by kurtosis analysis. NMR Biomed. 2010;23:698–710. doi: 10.1002/nbm.1518. [DOI] [PMC free article] [PubMed] [Google Scholar]
- 67.Chevallier O, Zhou N, Cercueil JP, He J, Loffroy R, Wang YX. Comparison of tri-exponential decay versus biexponential decay and full fitting versus segmented fitting for modeling liver intravoxel incoherent motion diffusion MRI. NMR Biomed. 2019;32:e4155. doi: 10.1002/nbm.4155. [DOI] [PubMed] [Google Scholar]
- 68.Park HJ, Sung YS, Lee SS, Lee Y, Cheong H, Kim YJ, Lee MG. Intravoxel incoherent motion diffusion-weighted MRI of the abdomen: the effect of fitting algorithms on the accuracy and reliability of the parameters. J Magn Reson Imaging. 2017;45:1637–47. doi: 10.1002/jmri.25535. [DOI] [PubMed] [Google Scholar]
- 69.Huang H, Zheng CJ, Wang LF, Che-Nordin N, Wang YX. Age and gender dependence of liver diffusion parameters and the possibility that intravoxel incoherent motion modelling of perfusion component is constrained by diffusion component. NMR Biomed. 2021;34:e4449. doi: 10.1002/nbm.4449. [DOI] [PubMed] [Google Scholar]
- 70.Li YT, Cercueil JP, Yuan J, Chen W, Loffroy R, Wang YX. Liver intravoxel incoherent motion (IVIM) magnetic resonance imaging: a comprehensive review of published data on normal values and applications for fibrosis and tumor evaluation. Quant Imaging Med Surg. 2017;7:59–78. doi: 10.21037/qims.2017.02.03. [DOI] [PMC free article] [PubMed] [Google Scholar]
- 71.Chevallier O, Zhou N, He J, Loffroy R, Wang YX. Removal of evidential motion-contaminated and poorly fitted image data improves IVIM diffusion MRI parameter scan-rescan reproducibility. Acta Radiologica. 2018;59:1157–67. doi: 10.1177/0284185118756949. [DOI] [PubMed] [Google Scholar]
- 72.Wang YX, Li YT, Chevallier O, Huang H, Leung JC, Chen W, Lu PX. Dependence of intravoxel incoherent motion diffusion MR threshold b-value selection for separating perfusion and diffusion compartments and liver fibrosis diagnostic performance. Acta Radiologica. 2019;60:3–12. doi: 10.1177/0284185118774913. [DOI] [PubMed] [Google Scholar]
- 73.Riexinger AJ, Wetscherek A, Martin J, Kuder TA, Nagel A, Uder M, Hensel B, Müller L, Laun FB. On the magnetic field and echo time dependence of the pseudo-diffusion coefficient. In proceedings of ISMRM. 2018 Paris; Abstract 0258. [Google Scholar]
- 74.Riexinger A, Martin J, Wetscherek A, Kuder TA, Uder M, Hensel B, Laun FB. An optimized b-value distribution for triexponential intravoxel incoherent motion (IVIM) in the liver. Magn Reson Med. 2020;85:2095–2108. doi: 10.1002/mrm.28582. [DOI] [PubMed] [Google Scholar]
- 75.Feng Z, Min X, Wang L, Yan X, Li B, Ke Z, Zhang P, You H. Effects of echo time on IVIM quantification of the normal prostate. Sci Rep. 2018;8:2572. doi: 10.1038/s41598-018-19150-2. [DOI] [PMC free article] [PubMed] [Google Scholar]
- 76.Jerome NP, d’Arcy JA, Feiweier T, Koh DM, Leach MO, Collins DJ, Orton MR. Extended T2-IVIM model for correction of TE dependence of pseudo-diffusion volume fraction in clinical diffusion-weighted magnetic resonance imaging. Phys Med Biol. 2016;61:N667–N680. doi: 10.1088/1361-6560/61/24/N667. [DOI] [PMC free article] [PubMed] [Google Scholar]
- 77.Riexinger AJ, Martin J, Rauh S, Wetscherek A, Pistel M, Kuder TA, Nagel AM, Uder M, Hensel B, Müller L, Laun FB. On the field strength dependence of bi- and triexponential intravoxel incoherent motion (IVIM) parameters in the liver. J Magn Reson Imaging. 2019;50:1883–1892. doi: 10.1002/jmri.26730. [DOI] [PubMed] [Google Scholar]
- 78.Wang YX. Living tissue intravoxel incoherent motion (IVIM) diffusion MR analysis without b = 0 image: an example for liver fibrosis evaluation. Quant Imaging Med Surg. 2019;9:127–33. doi: 10.21037/qims.2019.01.07. [DOI] [PMC free article] [PubMed] [Google Scholar]
- 79.Xiao BH, Huang H, Wang LF, Qiu SW, Guo SW, Wang YX. Diffusion MRI derived per area vessel density as a surrogate biomarker for detecting viral hepatitis-b induced liver fibrosis: a proof of concept study. SLAS Technol. 2020;25:474–483. doi: 10.1177/2472630320915838. [DOI] [PubMed] [Google Scholar]
- 80.Li T, Che-Nordin N, Wáng YXJ, Rong PF, Qiu SW, Zhang SW, Zhang P, Jiang YF, Chevallier O, Zhao F, Xiao XY, Wang W. Intravoxel incoherent motion derived liver perfusion/diffusion readouts can be reliable biomarker for the detection of viral hepatitis B induced liver fibrosis. Quant Imaging Med Surg. 2019;9:371–85. doi: 10.21037/qims.2019.02.11. [DOI] [PMC free article] [PubMed] [Google Scholar]
- 81.ter Voert EE, Delso G, Porto M, Huellner M, VeitHaibach P. Intravoxel incoherent motion protocol evaluation and data quality in normal and malignant liver tissue and comparison to the literature. Invest Radiol. 2016;51:90–9. doi: 10.1097/RLI.0000000000000207. [DOI] [PubMed] [Google Scholar]
- 82.Wurnig MC, Donati OF, Ulbrich E, Filli L, Kenkel D, Thoeny HC, Boss A. Systematic analysis of the intravoxel incoherent motion threshold separating perfusion and diffusion effects: proposal of a standardized algorithm. Magn Reson Med. 2015;74:1414–22. doi: 10.1002/mrm.25506. [DOI] [PubMed] [Google Scholar]
- 83.Huang H, Che-Nordin N, Wang LF, Xiao BH, Chevallier O, Yun YX, Guo SW, Wang YX. High performance of intravoxel incoherent motion diffusion MRI in detecting viral hepatitis-b induced liver fibrosis. Ann Transl Med. 2019;7:39. doi: 10.21037/atm.2018.12.33. [DOI] [PMC free article] [PubMed] [Google Scholar]
- 84.Wang YX, Deng M, Li YT, Huang H, Leung JCS, Chen W, Lu PX. A combined use of intravoxel incoherent motion MRI parameters can differentiate early-stage hepatitis-b fibrotic livers from healthy livers. SLAS Technol. 2018;23:259–68. doi: 10.1177/2472630317717049. [DOI] [PubMed] [Google Scholar]
- 85.Neil JJ, Bretthorst GL. On the use of Bayesian probability theory for analysis of exponential decay data: an example taken from intravoxel incoherent motion experiments. Magn Reson Med. 1993;29:642–7. doi: 10.1002/mrm.1910290510. [DOI] [PubMed] [Google Scholar]
- 86.Barbieri S, Donati OF, Froehlich JM, Thoeny HC. Impact of the calculation algorithm on biexponential fitting of diffusion weighted MRI in upper abdominal organs. Magn Reson Med. 2016;75:2175–2184. doi: 10.1002/mrm.25765. [DOI] [PubMed] [Google Scholar]
- 87.Pekar J, Moonen CT, van Zijl PC. On the precision of diffusion/perfusion imaging by gradient sensitization. Magn Reson Med. 1992;23:122–9. doi: 10.1002/mrm.1910230113. [DOI] [PubMed] [Google Scholar]
- 88.Bertleff M, Domsch S, Weingärtner S, Zapp J, O’Brien K, Barth M, Schad LR. Diffusion parameter mapping with the combined intravoxel incoherent motion and kurtosis model using artificial neural networks at 3 T. NMR Biomed. 2017;30 doi: 10.1002/nbm.3833. [DOI] [PubMed] [Google Scholar]
- 89.Barbieri S, Gurney-Champion OJ, Klaassen R, Thoeny HC. Deep learning how to fit an intravoxel incoherent motion model to diffusion-weighted MRI. Magn Reson Med. 2020;83:312–321. doi: 10.1002/mrm.27910. [DOI] [PubMed] [Google Scholar]
- 90.Zeeh J, Platt D. The aging liver: structural and functional changes and their consequences for drug treatment in old age. Gerontology. 2002;48:121–127. doi: 10.1159/000052829. [DOI] [PubMed] [Google Scholar]
- 91.Wynne HA, Cope LH, Mutch E, Rawlins MD, Woodhouse KW, James OF. The effect of age upon liver volume and apparent liver blood flow in healthy man. Hepatology. 1989;9:297–301. doi: 10.1002/hep.1840090222. [DOI] [PubMed] [Google Scholar]
- 92.Fiel MI, Deniz K, FElmali F, Schiano TD. Increasing hepatic arteriole wall thickness and decreased luminal diameter occur with increasing age in normal livers. J Hepatol. 2011;55:582–586. doi: 10.1016/j.jhep.2010.12.018. [DOI] [PubMed] [Google Scholar]
- 93.Le Couteur DG, McLean AJ. The aging liver. Drug clearance and an oxygen diffusion barrier hypothesis. Clin Pharmacokinet. 1998;34:359–373. doi: 10.2165/00003088-199834050-00003. [DOI] [PubMed] [Google Scholar]
- 94.Wang YXJ. Observed paradoxical perfusion fraction elevation in steatotic liver: an example of intravoxel incoherent motion modeling of the perfusion component constrained by the diffusion component. NMR Biomed. 2021;34:e4488. doi: 10.1002/nbm.4488. [DOI] [PubMed] [Google Scholar]
- 95.Wang YX. Mutual constraining of slow component and fast component measures: some observations in liver IVIM imaging. Quant Imaging Med Surg. 2021;11:2879–2887. doi: 10.21037/qims-21-187. [DOI] [PMC free article] [PubMed] [Google Scholar]
- 96.Federau C, Sumer S, Becce F, Maeder P, O’Brien K, Meuli R, Wintermark M. Intravoxel incoherent motion perfusion imaging in acute stroke: initial clinical experience. Neuroradiology. 2014;56:629–35. doi: 10.1007/s00234-014-1370-y. [DOI] [PubMed] [Google Scholar]
- 97.Zhu G, Federau C, Wintermark M, Chen H, Marcellus DG, Martin BW, Heit JJ. Comparison of MRI IVIM and MR perfusion imaging in acute ischemic stroke due to large vessel occlusion. Int J Stroke. 2020;15:332–342. doi: 10.1177/1747493019873515. [DOI] [PubMed] [Google Scholar]
- 98.Lefebvre T, Hébert M, Bilodeau L, Sebastiani G, Cerny M, Olivié D, Gao ZH, Sylvestre MP, Cloutier G, Nguyen BN, Gilbert G, Tang A. Intravoxel incoherent motion diffusion-weighted MRI for the characterization of inflammation in chronic liver disease. Eur Radiol. 2021;31:1347–1358. doi: 10.1007/s00330-020-07203-y. [DOI] [PubMed] [Google Scholar]
- 99.Lee YA, Wallace MC, Friedman SL. Pathobiology of liver fibrosis: a translational success story. Gut. 2015;64:830–841. doi: 10.1136/gutjnl-2014-306842. [DOI] [PMC free article] [PubMed] [Google Scholar]
- 100.Shiha G, Zalata K. Chapter 10: Ishak versus METAVIR for liver fibrosis Terminology, Convertibility and Correlation with Laboratory Changes in Chronic Hepatitis C (page 155-170) In: Takahashi H, editor. Liver Biopsy. Rijeka (Croatia): InTech; 2011. pp. 55–70. [Google Scholar]
- 101.Tanwar S, Rhodes F, Srivastava A, Trembling PM, Rosenberg WM. Inflammation and fibrosis in chronic liver diseases including non-alcoholic fatty liver disease and hepatitis C. World J Gastroenterol. 2020;26:109–133. doi: 10.3748/wjg.v26.i2.109. [DOI] [PMC free article] [PubMed] [Google Scholar]
- 102.Boyer N, Marcellin P. Natural history of hepatitis C and the impact of anti-viral therapy. Forum (Genova) 2000;10:4–18. [PubMed] [Google Scholar]
- 103.Pagliaro L, Peri V, Linea C, Cammà C, Giunta M, Magrin S. Natural history of chronic hepatitis C. Ital J Gastroenterol Hepatol. 1999;31:28–44. [PubMed] [Google Scholar]
- 104.Guiu B, Petit JM, Capitan V, Aho S, Masson D, Lefevre PH, Favelier S, Loffroy R, Vergès B, Hillon P. Intravoxel incoherent motion diffusion-weighted imaging in nonalcoholic fatty liver disease: a 3.0-T MR study. Radiology. 2012;265:96–103. doi: 10.1148/radiol.12112478. [DOI] [PubMed] [Google Scholar]
- 105.Hamilton G, Yokoo T, Bydder M, Cruite I, Schroeder ME, Sirlin CB, Middleton MS. In vivo characterization of the liver fat (1)H MR spectrum. NMR Biomed. 2011;24:784–790. doi: 10.1002/nbm.1622. [DOI] [PMC free article] [PubMed] [Google Scholar]
- 106.Hansmann J, Hernando D, Reeder SB. Fat confounds the observed apparent diffusion coefficient in patients with hepatic steatosis. Magn Reson Med. 2013;69:545–552. doi: 10.1002/mrm.24535. [DOI] [PMC free article] [PubMed] [Google Scholar]
- 107.Manning P, Murphy P, Wang K, Hooker J, Wolfson T, Middleton MS, Newton KP, Behling C, Awai HI, Durelle J, Paiz MN, Angeles JE, De La Pena D, McCutchan JA, Schwimmer JB, Sirlin CB. Liver histology and diffusion-weighted MRI in children with nonalcoholic fatty liver disease: a MAGNET study. J Magn Reson Imaging. 2017;46:1149–1158. doi: 10.1002/jmri.25663. [DOI] [PMC free article] [PubMed] [Google Scholar]
- 108.Shin HJ, Yoon H, Kim M-J, Han SJ, Koh H, Kim S, Lee MJ. Liver intravoxel incoherent motion diffusion-weighted imaging for the assessment of hepatic steatosis and fibrosis in children. World J Gastroenterol. 2018;24:3013–20. doi: 10.3748/wjg.v24.i27.3013. [DOI] [PMC free article] [PubMed] [Google Scholar]
- 109.Parente DB, Paiva FF, Oliveira Neto JA, Machado-Silva L, Figueiredo FA, Lanzoni V, Campos CF, do Brasil PE, Gomes Mde B, Perez Rde M, Rodrigues RS. Intravoxel incoherent motion diffusion weighted MR imaging at 3.0 T: assessment of steatohepatitis and fibrosis compared with liver biopsy in type 2 diabetic patients. PLoS One. 2015;10:e0125653. doi: 10.1371/journal.pone.0125653. [DOI] [PMC free article] [PubMed] [Google Scholar]
- 110.Joo I, Lee JM, Yoon JH, Jang JJ, Han JK, Choi BI. Nonalcoholic fatty liver disease: intravoxel incoherent motion diffusion-weighted MR imaging-an experimental study in a rabbit model. Radiology. 2014;270:131–40. doi: 10.1148/radiol.13122506. [DOI] [PubMed] [Google Scholar]
- 111.Xie Y, Zhang H, Jin C, Wang X, Wang X, Chen J, Xu Y. Gd-EOB-DTPA-enhanced T1ρ imaging vs diffusion metrics for assessment liver inflammation and early stage fibrosis of nonalcoholic steatohepatitis in rabbits. Magn Reson Imaging. 2018;48:34–41. doi: 10.1016/j.mri.2017.12.017. [DOI] [PubMed] [Google Scholar]
- 112.Woo S, Lee JM, Yoon JH, Joo I, Han JK, Choi BI. Intravoxel incoherent motion diffusion-weighted MR imaging of hepatocellular carcinoma: correlation with enhancement degree and histologic grade. Radiology. 2014;270:758–67. doi: 10.1148/radiol.13130444. [DOI] [PubMed] [Google Scholar]
- 113.Sokmen BK, Sabet S, Oz A, Server S, Namal E, Dayangac M, Dogusoy GB, Tokat Y, Inan N. Value of intravoxel incoherent motion for hepatocellular carcinoma grading. Transplant Proc. 2019;51:1861–1866. doi: 10.1016/j.transproceed.2019.02.027. [DOI] [PubMed] [Google Scholar]
- 114.Granata V, Fusco R, Catalano O, Guarino B, Granata F, Tatangelo F, Avallone A, Piccirillo M, Palaia R, Izzo F. Intravoxel incoherent motion (IVIM) in diffusion-weighted imaging (DWI) for Hepatocellular carcinoma: correlation with histologic grade. Oncotarget. 2016;7:79357. doi: 10.18632/oncotarget.12689. [DOI] [PMC free article] [PubMed] [Google Scholar]
- 115.Wei Y, Huang Z, Tang H, Deng L, Yuan Y, Li J, Wu D, Wei X, Song B. IVIM improves preoperative assessment of microvascular invasion in HCC. Eur Radiol. 2019;29:5403–14. doi: 10.1007/s00330-019-06088-w. [DOI] [PubMed] [Google Scholar]
- 116.Choi IY, Lee SS, Sung YS, Cheong H, Lee H, Byun JH, Kim SY, Lee SJ, Shin YM, Lee MG. Intravoxel incoherent motion diffusion-weighted imaging for characterizing focal hepatic lesions: correlation with lesion enhancement. J Magn Reson Imaging. 2017;45:1589–98. doi: 10.1002/jmri.25492. [DOI] [PubMed] [Google Scholar]
- 117.Jerjir N, Bruyneel L, Haspeslagh M, Quenet S, Coenegrachts K. Intravoxel incoherent motion and dynamic contrast-enhanced MRI for differentiation between hepatocellular adenoma and focal nodular hyperplasia. Br J Radiol. 2017;90:20170007. doi: 10.1259/bjr.20170007. [DOI] [PMC free article] [PubMed] [Google Scholar]
- 118.Klauss M, Mayer P, Maier-Hein K, Laun FB, Mehrabi A, Kauczor HU, Stieltjes B. IVIM-diffusion-MRI for the differentiation of solid benign and malign hypervascular liver lesions-evaluation with two different MR scanners. Eur J Radiol. 2016;85:1289–94. doi: 10.1016/j.ejrad.2016.04.011. [DOI] [PubMed] [Google Scholar]
- 119.Mürtz P, Sprinkart A, Reick M, Pieper C, Schievelkamp AH, König R, Schild H, Willinek W, Kukuk G. Accurate IVIM model-based liver lesion characterisation can be achieved with only three b-value DWI. Eur Radiol. 2018;28:4418–28. doi: 10.1007/s00330-018-5401-7. [DOI] [PubMed] [Google Scholar]
- 120.Penner AH, Sprinkart A, Kukuk G, Gütgemann I, Gieseke J, Schild H, Willinek W, Mürtz P. Intravoxel incoherent motion model-based liver lesion characterisation from three b-value diffusion-weighted MRI. Eur Radiol. 2013;23:2773–83. doi: 10.1007/s00330-013-2869-z. [DOI] [PubMed] [Google Scholar]
- 121.Granata V, Fusco R, Catalano O, Filice S, Amato DM, Nasti G, Avallone A, Izzo F, Petrillo A. Early assessment of colorectal cancer patients with liver metastases treated with antiangiogenic drugs: the role of intravoxel incoherent motion in diffusion-weighted imaging. PLoS One. 2015;10:e0142876. doi: 10.1371/journal.pone.0142876. [DOI] [PMC free article] [PubMed] [Google Scholar]
- 122.Shirota N, Saito K, Sugimoto K, Takara K, Moriyasu F, Tokuuye K. Intravoxel incoherent motion MRI as a biomarker of sorafenib treatment for advanced hepatocellular carcinoma: a pilot study. Cancer Imaging. 2016;16:1. doi: 10.1186/s40644-016-0059-3. [DOI] [PMC free article] [PubMed] [Google Scholar]
- 123.Joo I, Lee JM, Han JK, Choi BI. Intravoxel incoherent motion diffusion-weighted MR imaging for monitoring the therapeutic efficacy of the vascular disrupting agent CKD-516 in rabbit VX2 liver tumors. Radiology. 2014;272:417–426. doi: 10.1148/radiol.14131165. [DOI] [PubMed] [Google Scholar]
- 124.Joo I, Lee JM, Grimm R, Han JK, Choi BI. Monitoring vascular disrupting therapy in a rabbit liver tumor model: relationship between tumor perfusion parameters at IVIM diffusion-weighted MR imaging and those at dynamic contrast-enhanced MR imaging. Radiology. 2016;278:104–113. doi: 10.1148/radiol.2015141974. [DOI] [PubMed] [Google Scholar]
- 125.Fan CQ, Crawford JM. Sinusoidal obstruction syndrome (hepatic venoocclusive disease) J Clin Exp Hepatol. 2014;4:332–346. doi: 10.1016/j.jceh.2014.10.002. [DOI] [PMC free article] [PubMed] [Google Scholar]
- 126.Zhou H, Wang YX, Lou HY, Xu XJ, Zhang MM. Hepatic sinusoidal obstruction syndrome caused by herbal medicine: CT and MRI features. Korean J Radiol. 2014;15:218–25. doi: 10.3348/kjr.2014.15.2.218. [DOI] [PMC free article] [PubMed] [Google Scholar]
- 127.Hong EK, Joo I, Park J, Lee K. Assessment of hepatic sinusoidal obstruction syndrome with intravoxel incoherent motion diffusion-weighted imaging: an experimental study in a rat model. J Magn Reson Imaging. 2020;51:81–89. doi: 10.1002/jmri.26790. [DOI] [PubMed] [Google Scholar]
- 128.Zhang Q, Wang YX, Ma HT, Yuan J. Cramér-Rao bound for Intravoxel Incoherent Motion Diffusion Weighted Imaging fitting. Annu Int Conf IEEE Eng Med Biol Soc. 2013;2013:511–4. doi: 10.1109/EMBC.2013.6609549. [DOI] [PubMed] [Google Scholar]
- 129.Regini F, Colagrande S, Mazzoni LN, Busoni S, Matteuzzi B, Santini P, Wyttenbach R. Assessment of liver perfusion by intravoxel incoherent motion (IVIM) magnetic resonance-diffusion-weighted imaging: correlation with phase-contrast portal venous flow measurements. J Comput Assist Tomogr. 2015;39:365–72. doi: 10.1097/RCT.0000000000000220. [DOI] [PubMed] [Google Scholar]


