

Abstract
Purpose: The purpose of this study was to evaluate the imaging characteristics of epithelioid hemangioendothelioma (EHE) on staging 18F-FDG PET/CT. Materials and methods: An IRB-approved retrospective review was conducted for patients with biopsy-proven EHE who underwent FDG PET/CT at our institution between 2005 and 2019. Patients with a history of surgery, chemotherapy, or radiotherapy prior to PET/CT were excluded. PET/CT exams were analyzed, noting metabolic activity, distribution of involvement, and CT morphologic features. PET/CT findings were correlated with comparative CT and MRI performed within three months. Results: There were 35 patients [21 females, 14 males; average age 55.1±16.9 years (range 15-82 years)]. 18/35 patients (52%) had more than one organ affected on PET/CT. The most common sites were liver [21/35 (60%)], lung [(19/35 (54%)], bone [5/35 (14%)], lymph nodes [4/35 (11%)], and vasculature [4/35 (11%)]. Most patients [30/35, (86%)] presented with multiple lesions. The average largest lesion dimension was 4.0±3.6 cm (range 0.6-15.0 cm). The average SUVmax of the most metabolically active lesion at any site was 5.3±3.3 (range 1.2-17.1), and for bone was 7.9±5.4 (range 3.5-17.1), liver was 5.1±2.1 (range 2.6-10.5), and lung was 3.0±1.9 (range 1.2-8.5). Of patients with pulmonary lesions, 9/19 (47%) showed calcification, and 4/19 (21%) had nodules that were either non FDG-avid or too small for accurate SUV assessment. Of patients with hepatic lesions, 11/21 (52%) demonstrated capsular retraction, and 12/21 (57%) were found to have additional hepatic lesions on contrast-enhanced CT or MRI that were occult on PET/CT. Conclusion: EHE demonstrates variable, but most commonly moderate FDG activity on PET/CT. The most common sites of disease are the liver, lungs, and bones, and most patients present with multiple lesions and more than one organ involved. Given the intrinsic metabolic activity and multi-organ involvement, FDG PET/CT represents an attractive modality for EHE evaluation. However, it may be best used in combination with CT or MRI given that EHE pulmonary or hepatic lesions may be missed by PET/CT.
Keywords: Epithelioid hemangioendothelioma, PET/CT, EHE, staging
Introduction
Epithelioid hemangioendothelioma (EHE) is a rare vascular malignancy with an epithelioid and histiocytoid appearance, originating from vascular endothelial or pre-endothelial cells. It was described for the first time in 1975 by Dail and Liebow as pulmonary EHE (P-EHE) [1]. Initially, it was believed to be an aggressive form of bronchoalveolar cell carcinoma, invading adjacent blood vessels and small airways. The term epithelioid hemangioendothelioma was introduced in 1982 by Weiss and Enzinger who evaluated 41 cases of solid tumors, which had a vascular origin with intermediate features between hemangioma and angiosarcoma [2,3]. In the 2013 World Health Organization classification of sarcomas, EHE was categorized as a malignant tumor distinct from other vascular tumors [4]. EHE shows low to intermediate grade malignant features, and its clinical behavior is more indolent than angiosarcoma.
EHE is rare, representing less than 1% of all the vascular tumors. Most commonly it affects the lungs, liver, or bones, although it can occur primarily in almost any site, including the scalp, nasal cavity, cervix, and even the tongue [5]. EHE is often incidentally diagnosed, and up to 50-76% of patients are asymptomatic. Among patients with symptomatic disease, pain is the most commonly reported symptom. Other presenting symptoms depend on disease site; for example, hepatic EHE may cause constitutional symptoms, nausea and jaundice, and pulmonary involvement may result in dyspnea, cough, and hemoptysis. Because of the variable presentation and rarity, EHE may be misdiagnosed, leading to delayed treatment. There are no specific laboratory tests for EHE [6]. Treatment options for EHE are individualized for each patient based on the number of lesions, tumor growth, involved organs and patient symptoms. For single lesions, surgical resection is the optimal treatment, and hepatic transplantation may be used for localized liver disease. Radiotherapy is suitable for patients with lesions involving the bones [7,8], while chemotherapy may have utility in patients with advanced disease or with lesions not amenable to surgery or radiation therapy [9,10]. Limited response rates have been demonstrated with targeted therapies, including anti-angiogenic agents [11-13]. In asymptomatic patients with diffuse lesions, watchful waiting is an acceptable option and spontaneous regression has been reported [14].
Imaging is important in EHE to determine lesion resectability, stage, assess response to therapy, and evaluate for local recurrence following primary treatment. To date, most imaging studies have focused on the CT and MRI appearances of hepatic EHE [15,16], and CT appearance of pulmonary EHE [17,18]. In comparison, there is relatively limited data regarding the 18F-fluorodeoxyglucose positron emission tomography/computed tomography (18F-FDG PET/CT) features of EHE, which consists primarily of case reports [19,20] and small series [21,22]. Therefore, the purpose of this study was to evaluate the imaging features of EHE on staging FDG PET/CT in a large cohort of pathologically proven EHE patients.
Materials and methods
This Health Insurance Portability and Accountability Act-compliant retrospective study was approved by our institutional review board. The requirement for informed consent was waived for this study. Pathology and imaging databases were searched for cases of pathologically-proven EHE from 01/01/2005 to 12/31/2019. Pathological diagnosis was established by biopsy and/or surgical resection. Only staging exams were included; patients with a history of surgery, chemotherapy or radiotherapy prior to PET/CT were excluded.
The electronic medical record was searched, and various data were collected and analyzed, including patient age, gender, biopsy results and treatment history. The imaging database was cross-referenced for any correlative CT and/or magnetic resonance imaging (MRI) performed within three months of PET/CT. All available follow-up chest CTs were analyzed to determine growth rate and evolution of pulmonary lesions.
PET/CTs (Discovery RX, 690 710, or MI; GE Healthcare, Waukesha, WI; USA) were performed according to the standard clinical protocol. PET/CT machines were regularly cross-calibrated against a dose-calibrated phantom standard to ensure consistency and reproducibility and activity recovery coefficients monitored for stability per institutional quality assurance protocol and American College of Radiology (ACR) accreditation guidelines. Parameters including height, weight and serum blood glucose were recorded for all patients. All patients had a blood glucose level of less than 200 mg/dl, and were administered 10-15 mCi of 18F-FDG, with an incubation period of 60-70 minutes. The amount of injected radioactivity was routinely measured by means of quantifying the radioactivity within the syringe before and after injection or with an automated injection system (Medrad® Intego PET infusion system, Bayer Healthcare, Whippany, NJ, USA). Patients were imaged covering at least from orbits to mid-thighs with 2D or 3D ordered subset expectation maximization, two iterations, Gaussian post-filter smoothing with a full width at half maximum of 7 mm, 128 × 128 matrix, 3-5 minutes per bed position depending on body mass index. Low-dose helical CT images were obtained for attenuation correction and anatomic localization.
MIM software (MIM Software Inc., Cleveland, Ohio; United States) was used for PET/CT analysis and Visage software (Pro Medicus, Richmond, Victoria; Australia) for CT and MRI analysis. PET/CT imaging characteristics analyzed included maximal standardized uptake value (SUVmax), distribution of involvement, number of affected organs, number of lesions in each organ, maximal dimension, and morphologic CT features such as the presence and characterization of calcification in pulmonary lesions and capsular retraction associated with hepatic lesions. Lesions were considered positive if metabolic activity exceeded that of the liver. Pulmonary nodules with follow-up images were analyzed and volume doubling time (VDT) was calculated using the following formula: VDT (days) = ln(2) × Δt/ln(V2/V1) where Δt is the time (days) between CT scans; V1 and V2 are the initial volume and following volume respectively. Volume was estimated by manually calculating the cube of the maximum dimension of the nodule and afterwards divided by 2 to avoid overestimation of the volume [23].
Statistical analysis was performed using JMP software on a Mac (JMP Pro, version 11.2.1, SAS Institute Inc.). Continuous variables are expressed as mean ± SD. Categorical variables are presented with absolute and relative frequencies. P-values for between-group comparisons of continuous data were calculated from Kruskal-Wallis one-way analysis of variance. Statistical significance was established for p values of less than 0.05.
Results
There were 35 patients (21 females, 14 males) with pathologically-proven EHE and staging PET/CT prior to treatment included. The average age at diagnosis was 55.1±16.9 years (range 15-82). 18/35 patients (52%) had more than one organ affected on PET/CT. The most common sites were liver [21/35 (60%)], lung [19/35 (54%)], bone [5/35 (14%)], lymph nodes [4/35 (11%)] and the supraclavicular vasculature [4/35 (11%)]. Less common locations included mediastinum [2/35 (6%)], retroperitoneum [1/35 (3%)], paracolic soft tissues [1/35 (3%)] and gluteal musculature [1/35 (3%)]. 3/35 (9%) had both lung and liver involvement and only 1/35 (3%) had isolated bone involvement. Most patients [30/35 (86%)] presented with multiple lesions, including multiple lesions in the same organ or involvement of more than one organ (Table 1).
Table 1.
Patient demographics and disease sites
| Age (years) | 55.1±16.9 |
| Sex | |
| Male | 14/35 (40%) |
| Female | 21/35 (60%) |
| Affected sites | |
| Liver | 21/35 (60%) |
| Lung | 19/35 (54%) |
| Bone | 5/35 (14%) |
| Lymph nodes | 4/35 (11%) |
| Supraclavicular region | 4/35 (11%) |
The average largest lesion dimension was 4.0±3.6 cm (range 0.6-15.0 cm). The average SUVmax of the most metabolically active lesion at any site was 5.3±3.3 (range 1.2-17.1). In bone lesions, the mean SUVmax was 7.9±5.4 (range 3.5-17.1), in liver lesions the mean SUVmax was 5.1±2.1 (range 2.6-10.5), and in lung lesions the mean SUVmax was 3.0±1.9 (range 1.2-8.5) (Table 2). There was no significant difference in the highest SUVmax at any site between patients with an isolated site of disease versus multiple organ involvement (5.5±4.1 vs. 5.0±2.4, P = 0.64) or between patients with liver involvement versus those without (5.2±2.3 vs. 5.3±4.5, P = 0.93). Patients with bone involvement did trend towards higher overall SUVmax than those without (7.8±5.5 vs. 4.8±2.7, P = 0.055), and patients without pulmonary involvement had higher SUVmax at any site than those with lung lesions (6.7±3.9 vs. 4.0±1.2, P = 0.012).
Table 2.
Metabolic characteristics of EHE lesions
| Lesion site | Number of patients | SUVmax ± SD | Range |
|---|---|---|---|
| Liver | 21 | 5.1±2.1 | 2.6-10.5 |
| Lung | 19 | 3.0±1.9 | 1.2-8.5 |
| Bone | 5 | 7.9±5.4 | 3.5-17.1 |
| Most Metabolically Active Site | 35 | 5.3±3.3 | 1.2-17.1 |
SD = standard deviation.
Of patients with pulmonary lesions, 9/19 (47%) showed calcification. Of these patients, 7/9 (78%) had nodules with a benign calcification pattern, including 4/9 (44%) with central calcification and 3/9 (33%) with popcorn-like calcification [24]. Only 2/9 (22%) of these patients had nodules with punctate calcifications. Of the patients with pulmonary lesions, 4/19 (21%) had nodules that were either non FDG-avid or < 10 mm and therefore too small for accurate SUV assessment [25-28].
53% (10/19) of patients with pulmonary nodules had imaging follow-up greater than 12 months (range 18 months - 11 years, average 5.2±3.6 years). 70% (7/10) of the patients demonstrated very slow growth of pulmonary lesions, with average volume doubling time of 1154±772 days (range 460-2236 days) and 30% (3/10) had no growth on follow-up images (average time 4.8±5.3 years, range 1.5 to 11 years).
Of patients with hepatic lesions, 19/21 (90%) had at least one FDG avid lesion, 11/21 (52%) demonstrated capsular retraction, and 12/21 (57%) were found to have additional hepatic lesions on contrast-enhanced CT or MRI that were occult on PET/CT (lesions were too small, had FDG activity equal to background hepatic parenchymal activity, and/or were occult on low-dose non-contrast CT images). Of the patients with bone lesions, 3/5 (60%) were purely lytic and 2/5 (40%) exhibited mixed lytic and sclerotic features.
Discussion
To our knowledge, this is the largest study examining the FDG PET/CT imaging features of EHE and we found that EHE demonstrates variable, but most commonly moderate FDG activity on PET/CT. In addition, our study confirmed common morphologic features reported by earlier studies, including presence of benign-appearing calcifications in pulmonary lesions and frequent capsular retraction in hepatic lesions.
Although EHE may present in almost any location, it usually affects the soft tissues and visceral organs. As seen in our study, the liver, lung, and bone are the most frequently involved sites. EHE is commonly multifocal with involvement of multiple organs and our results reflected this. 86% (30/35) of our patients presented with multiple lesions, either multiple lesions in the same organ or involvement of more than one organ. While the majority of the patients had pulmonary, hepatic or bone involvement, several patients had less common sites of involvement, including vasculature, mediastinum, retroperitoneum, paracolic soft tissues and gluteal musculature. We also noticed a predilection for vascular involvement in the supraclavicular fossa (Figure 1), which was seen in four of our patients. A few prior reports have also described intravascular EHEs arising from large vessels such as the internal jugular vein [29], inferior vena cava [30], superior vena cava [31], and azygos vein [32].
Figure 1.

69-year-old female with supraclavicular EHE involving the superior vena cava. FDG PET MIP (A), axial fused PET/CT (B) and axial T2-weighted MRI (C) images demonstrate an intravascular mass with moderate FDG activity (arrows, A, B) and increased T2 signal intensity (arrow, C).
The pre-existing literature regarding FDG PET/CT in EHE is limited to case reports or small series, and some studies have shown high FDG uptake by EHE [33-35]. For example, Rao reported a patient with multiple EHE lesions involving the pelvic bones and right femur with SUVmax of 18.1 [36]. Our study demonstrated a broad range of FDG activity in EHE lesions, with average SUVmax of the most metabolically active lesion at any site of 5.3±3.3, and SUVmax range between 1.2 and 17.1. There was no significant difference in the highest SUVmax at any site between patients with an isolated site of disease versus multiple organ involvement. There was also no significant difference in maximal SUVmax between patients with liver disease versus those without. Interestingly, we noted that patients without pulmonary involvement had higher SUVmax than those with lung lesions (6.7±3.9 vs. 4.0±2.1, p = 0.012), and there was a slightly higher overall SUVmax in patients with bone lesions (Figure 2) compared to those without (7.8±5.5 vs. 4.8±2.7, P = 0.055).
Figure 2.

82-year-old male with biopsy-proven osseous EHE. Axial fused PET/CT (A and B), axial CT (C) and FDG PET MIP (D) images demonstrate multiple bone lesions involving the T9 and L3 vertebral bodies, sacrum and bilateral pubic bones with increased FDG activity (arrows A, B and D). The lesions are predominately lytic on CT images (arrowhead, C).
Typical CT and MRI features of hepatic EHE have been previously described and include subcapsular location and coalescence of nodules, capsular flattening or retraction, a target-like configuration, and peripheral and delayed central enhancement [21,22]. Dong and colleagues examined six patients with 60 total hepatic EHE lesions, and found that 40 lesions (67%) demonstrated increased uptake compared to surrounding liver parenchyma [21]. The mean SUVmax of all lesions was 3.6±1.1, and there was relative low variability among lesions, with SUVmax ranging from 1.7 to 6.6. Ganeshan and colleagues recently reviewed 67 patients with hepatic EHE, 13 of which were evaluated by FDG PET/CT. 8/13 patients had hepatic lesions with FDG uptake above background liver parenchyma. Capsular retraction was reported in 81% (54 of 67 cases) and tumor coalescence in 61% (41 of 67 cases) of the patients [22]. These previous studies examining hepatic EHE were similar to the results in our study. In the 21 patients with hepatic involvement in our cohort, mean SUVmax of the liver lesions was 5.1±2.1 (range 2.6-10.5) and 52% (11/21) of the patients with hepatic lesions demonstrated associated capsular retraction (Figure 3). 90% (19/21) of patients with hepatic disease had at least one FDG avid lesion. However, 52% (11/21) had additional lesions demonstrated on CT or MRI that were not visualized on PET/CT, either because of the small size, occult appearance on non-contrast CT, and/or FDG activity equal to background hepatic parenchymal activity (Figure 4). This is also similar to previous studies; in the work by Dong and colleagues, 20/60 lesions (33%) had FDG activity similar to background [21], and in the Geneshan cohort, 5/13 patients (38%) had lesions without uptake greater than background hepatic parenchyma. This underscores the importance of utilizing contrast-enhanced CT or MRI in these patients, as PET/CT may miss hepatic lesions.
Figure 3.

72-year-old female with hepatic EHE. Axial T1-weighted post contrast MRI (A), axial non-contrast CT (B), T2-weighted MRI (C) and fused FDG PET/CT images (D) demonstrate an FDG-avid, enhancing lesion in the right hepatic lobe with capsular retraction (arrows).
Figure 4.
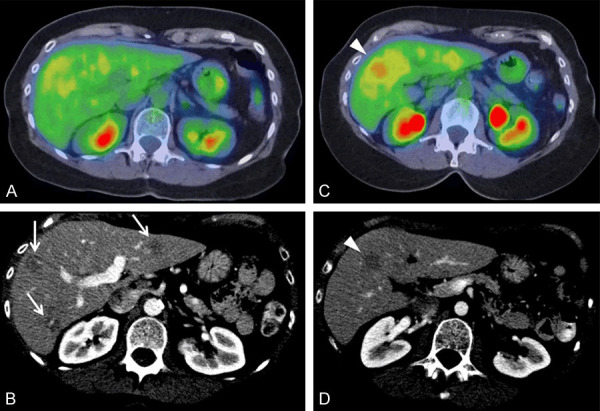
63-year-old female with hepatic EHE. Axial fused PET/CT images (A at portal vein bifurcation and C inferior segments) and axial contrast-enhanced CT (B at portal vein bifurcation and D inferior segments) demonstrate multiple hepatic lesions, some FDG-avid (arrowheads, C and D) and additional lesions seen only on CT (arrows, B).
Pulmonary EHE usually presents as bilateral pulmonary nodules of variable size ranging from 5 to 15 mm, but generally less than 20 mm, as demonstrated in a previous literature review of 93 cases [37]. The nodules can show little or no growth on serial radiographs and are usually found near small and medium sized vessels and bronchi [38]. Volume doubling time (VDT) is defined as the number of days in which a nodule doubles its volume. VDT is a key parameter in lung cancer screening and helps to differentiate between benign and malignant pulmonary nodules. Nodules that remain stable over a period of at least 2 years have a very low probability of malignancy, although 2-year stability does not guarantee a ‘benign’ nodule because some malignant nodules have a long VDT [39]. Low VDT indicates rapid growth, and a VDT of less than 400 days has recently been suggested as the best cut-off value to distinguish between ‘indolent’ and malignant lesions [40,41]. In our study, 53% (10/19) of patients with pulmonary nodules had imaging follow-up greater than one year (range 18 months - 11 years, average 5.2±3.6 years). 70% (7/10) of the patients demonstrated very slow growth of pulmonary lesions, with average volume doubling time of 1154±772 days (range 460-2236) and 30% had no growth on follow up images after at least 12 months (average 4.8±5.3 years, range 1.5 to 11 years).
In a patient without prior comparison images, the pulmonary nodules of EHE may be mistaken for pulmonary metastatic disease. In patients with serial images, stability or only minimal growth may be mistaken for granulomatous infection or attributed to differences in technique. EHE pulmonary nodules commonly exhibit a benign pattern of calcification, further mimicking sequelae of prior granulomatous diseases, such as histoplasmosis or tuberculosis, pneumoconiosis such as coal workers’ pneumoconiosis and silicosis, pulmonary hamartomas, and other benign processes [42]. Our study showed that 47% (9/19) of patients with pulmonary lesions had calcification, 7/9 (77%) of which had a benign pattern, including 4/9 (44%) with central calcification and 3/9 (33%) with popcorn-like calcification. In several cases these nodules mimicked the appearance of pulmonary granulomatous fungal infection (Figure 5).
Figure 5.

77-year-old female with metastatic EHE. Axial chest CT 2011 (A), axial chest CT 2017 (B and C), axial fused PET/CT (D) and FDG PET MIP (E) images demonstrate calcified bilateral pulmonary nodules (arrows, A-D and asterisks, A, B) with very slowly growth from 2011 to 2017. Note multiple sites of involvement including lung (arrow, E), liver (solid arrowheads, E) and muscle (open arrowheads, E).
PET/CT data from patients with thoracic EHE has demonstrated variable FDG uptake [43-45]. For example, Woo and colleagues reported PET/CT features of 15 patients with thoracic EHE involvement, and found that the main lesions showed higher uptake than the mediastinal blood pool in 11/15 (73%), and in patients with measurable SUV, a median SUVmax of 5.0, and range of 1.7-14.3. They further observed four different patterns of involvement, including multiple pulmonary nodules, parenchymal tumor with pleural invasion, reticulonodular opacities, and diffuse pleural thickening [46]. In our study, the average SUVmax of the most metabolically active lung lesion was 3.0±1.9 (range 1.2-8.5). However, 4/19 patients with lung lesions (21%) had pulmonary nodules that were either non FDG avid or < 10 mm in size, and thus prone to partial volume effects for SUV calculation. While pulmonary parenchymal involvement is the most common type of thoracic disease, involvement of the pleura and mediastinum also has been reported. In our study, we found 5/19 patients with pleural involvement (Figure 6) and 2/19 with mediastinal involvement. Given that pleural involvement portends a poor prognosis [47,48], as it may complicate or even prevent surgical resection, it is important to identify and report pleural involvement in EHE patients.
Figure 6.

59-year-old male with EHE involving the pleura and ribs. FDG PET MIP (A), axial PET (B), axial fused PET/CT (C), T2-weighted fat-suppressed MRI (D) and axial post-gadolinium T1-weighted fat-suppressed MRI (E) images demonstrate an FDG avid (arrows, A-C), T2 hyperintense (arrow, D), and enhancing (arrow, E) lesion involving the posterior left ribs and adjacent pleural space.
Because of its rarity, EHE has no standard treatment. Surgical resection with clear margins should be considered for localized disease and may be curative [5]. For hepatic EHE, liver transplant is a management option [33]. The role of adjuvant chemotherapy and radiation therapy is still uncertain, but radiotherapy has been shown to be effective for treatment of bone lesions [7,8] and several studies have reported therapeutic effect with several drugs, including pazopanib [11], sorafenib [12], and bevacizumab [13]. Suga [49] also demonstrated the utility of FDG PET/CT in assessing response to radiation therapy in the case of hepatic EHE. Given the intrinsic metabolic activity and multi-organ involvement shown in this cohort, PET/CT has clear potential to be useful in these patients, especially for assessing response to both localized and systemic therapies.
Limitations of this study included the small size and retrospective nature. There may have been selection bias in that patients referred for PET/CT may have had more extensive or aggressive disease compared to all EHE patients, many of whom had evaluation by conventional imaging only. In addition, not all patients with 18F-FDG PET/CT had CT or MRI correlation. Despite these limitations, this is the largest study of its kind and provides evidence that 18F-FDG PET/CT is a promising modality for EHE evaluation.
Conclusion
EHE demonstrates variable, but most commonly moderate FDG activity on PET/CT. The most common sites of disease are the liver, lungs, and bones, and most patients present with multiple lesions and more than one organ involved. Given the intrinsic metabolic activity and multi-organ involvement, FDG PET/CT represents an attractive modality for EHE evaluation. However, it may be best used in combination with CT or MRI given that EHE pulmonary or hepatic lesions may be missed by PET/CT.
Disclosure of conflict of interest
None.
References
- 1.Dail D, Liebow A. Intravascular bronchioloalveolar tumor. Am J Pathol. 1975;78:A6–A7. [Google Scholar]
- 2.Weiss SW, Enzinger FM. Epithelioid hemangioendothelioma: a vascular tumor often mistaken for a carcinoma. Cancer. 1982;50:970–981. doi: 10.1002/1097-0142(19820901)50:5<970::aid-cncr2820500527>3.0.co;2-z. [DOI] [PubMed] [Google Scholar]
- 3.Weiss SW, Ishak KG, Dail DH, Sweet DE, Enzinger FM. Epithelioid hemangioendothelioma and related lesions. Semin Diagn Pathol. 1986;3:259–287. [PubMed] [Google Scholar]
- 4.Doyle LA. Sarcoma classification: an update based on the 2013 world health organization classification of tumors of soft tissue and bone. Cancer. 2014;120:1763–1774. doi: 10.1002/cncr.28657. [DOI] [PubMed] [Google Scholar]
- 5.Sardaro A, Bardoscia L, Petruzzelli MF, Portaluri M. Epithelioid hemangioendothelioma: an overview and update on a rare vascular tumor. Oncol Rev. 2014;8:259. doi: 10.4081/oncol.2014.259. [DOI] [PMC free article] [PubMed] [Google Scholar]
- 6.Wu X, Li B, Zheng C, Hong T, He X. Clinical characteristics of epithelioid hemangioendothelioma: a single-center retrospective study. Eur J Med Res. 2019;24:16. doi: 10.1186/s40001-019-0375-8. [DOI] [PMC free article] [PubMed] [Google Scholar]
- 7.Angelini A, Mavrogenis AF, Gambarotti M, Merlino B, Picci P, Ruggieri P. Surgical treatment and results of 62 patients with epithelioid hemangioendothelioma of bone. J Surg Oncol. 2014;109:791–797. doi: 10.1002/jso.23587. [DOI] [PubMed] [Google Scholar]
- 8.Yu L, Gu T, Xiu Z, Shi E, Zhao X. Primary pleural epithelioid hemangioendothelioma compressing the myocardium. J Card Surg. 2013;28:266–268. doi: 10.1111/jocs.12094. [DOI] [PubMed] [Google Scholar]
- 9.Lazarus A, Fuhrer G, Malekiani C, McKay S, Thurber J. Primary pleural epithelioid hemangioendothelioma (EHE)--two cases and review of the literature. Clin Respir J. 2011;5:e1–5. doi: 10.1111/j.1752-699X.2010.00221.x. [DOI] [PubMed] [Google Scholar]
- 10.Kim EA, Lele SM, Lackner RP. Primary pleural epithelioid hemangioendothelioma. Ann Thorac Surg. 2011;91:301–302. doi: 10.1016/j.athoracsur.2010.05.070. [DOI] [PubMed] [Google Scholar]
- 11.Semenisty V, Naroditsky I, Keidar Z, Bar-Sela G. Pazopanib for metastatic pulmonary epithelioid hemangioendothelioma-a suitable treatment option: case report and review of anti-angiogenic treatment options. BMC Cancer. 2015;15:402. doi: 10.1186/s12885-015-1395-6. [DOI] [PMC free article] [PubMed] [Google Scholar]
- 12.Kobayashi N, Shimamura T, Tokuhisa M, Goto A, Ichikawa Y. Sorafenib monotherapy in a patient with unresectable hepatic epithelioid hemangioendothelioma. Case Rep Oncol. 2016;9:134–137. doi: 10.1159/000443986. [DOI] [PMC free article] [PubMed] [Google Scholar]
- 13.Agulnik M, Yarber JL, Okuno SH, von Mehren M, Jovanovic BD, Brockstein BE, Evens AM, Benjamin RS. An open-label, multicenter, phase II study of bevacizumab for the treatment of angiosarcoma and epithelioid hemangioendotheliomas. Ann Oncol. 2013;24:257–263. doi: 10.1093/annonc/mds237. [DOI] [PubMed] [Google Scholar]
- 14.Kitaichi M, Nagai S, Nishimura K, Itoh H, Asamoto H, Izumi T, Dail DH. Pulmonary epithelioid haemangioendothelioma in 21 patients, including three with partial spontaneous regression. Eur Respir J. 1998;12:89–96. doi: 10.1183/09031936.98.12010089. [DOI] [PubMed] [Google Scholar]
- 15.Zhou L, Cui MY, Xiong J, Dong Z, Luo Y, Xiao H, Xu L, Huang K, Li ZP, Feng ST. Spectrum of appearances on CT and MRI of hepatic epithelioid hemangioendothelioma. BMC Gastroenterol. 2015;15:69. doi: 10.1186/s12876-015-0299-x. [DOI] [PMC free article] [PubMed] [Google Scholar]
- 16.Gan LU, Chang R, Jin H, Yang LI. Typical CT and MRI signs of hepatic epithelioid hemangioendothelioma. Oncol Lett. 2016;11:1699–1706. doi: 10.3892/ol.2016.4149. [DOI] [PMC free article] [PubMed] [Google Scholar]
- 17.Mao X, Liang Z, Chibhabha F, Ou W, Li N, Xu P, Wang S. Clinico-radiological features and next generation sequencing of pulmonary epithelioid hemangioendothelioma: a case report and review of literature. Thorac Cancer. 2017;8:687–692. doi: 10.1111/1759-7714.12474. [DOI] [PMC free article] [PubMed] [Google Scholar]
- 18.Mesquita RD, Sousa M, Trinidad C, Pinto E, Badiola IA. New insights about pulmonary epithelioid hemangioendothelioma: review of the literature and two case reports. Case Rep Radiol. 2017;2017:5972940. doi: 10.1155/2017/5972940. [DOI] [PMC free article] [PubMed] [Google Scholar]
- 19.Makis W, Ciarallo A, Nahal A, Derbekyan V. Malignant epithelioid hemangioendothelioma of the lower extremity: staging with F-18 FDG PET/CT. Clin Nucl Med. 2011;36:590–592. doi: 10.1097/RLU.0b013e318217733b. [DOI] [PubMed] [Google Scholar]
- 20.Parihar AS, Vadi SK, Mittal BR, Singh H, Kumar R, Behera A. (18)F-fluorodeoxyglucose positron emission tomography/computed tomography in childhood metastatic epithelioid hemangioendothelioma of the liver: altering the management plan. World J Nucl Med. 2019;18:183–184. doi: 10.4103/wjnm.WJNM_86_18. [DOI] [PMC free article] [PubMed] [Google Scholar]
- 21.Dong A, Dong H, Wang Y, Gong J, Lu J, Zuo C. MRI and FDG PET/CT findings of hepatic epithelioid hemangioendothelioma. Clin Nucl Med. 2013;38:e66–73. doi: 10.1097/RLU.0b013e318266ceca. [DOI] [PubMed] [Google Scholar]
- 22.Ganeshan D, Pickhardt PJ, Morani AC, Javadi S, Lubner MG, Elmohr MM, Duran C, Elsayes KM. Hepatic hemangioendothelioma: CT, MR, and FDG-PET-CT in 67 patients-a bi-institutional comprehensive cancer center review. Eur Radiol. 2020;30:2435–2442. doi: 10.1007/s00330-019-06637-3. [DOI] [PubMed] [Google Scholar]
- 23.Ashraf H, Dirksen A, Loft A, Bertelsen AK, Bach KS, Hansen H, Pedersen JH, Mortensen J. Combined use of positron emission tomography and volume doubling time in lung cancer screening with low-dose CT scanning. Thorax. 2011;66:315–319. doi: 10.1136/thx.2010.136747. [DOI] [PubMed] [Google Scholar]
- 24.Erasmus JJ, Connolly JE, McAdams HP, Roggli VL. Solitary pulmonary nodules: part I. morphologic evaluation for differentiation of benign and malignant lesions. Radiographics. 2000;20:43–58. doi: 10.1148/radiographics.20.1.g00ja0343. [DOI] [PubMed] [Google Scholar]
- 25.Zhou Z, Zhan P, Jin J, Liu Y, Li Q, Ma C, Miao Y, Zhu Q, Tian P, Lv T, Song Y. The imaging of small pulmonary nodules. Transl Lung Cancer Res. 2017;6:62–67. doi: 10.21037/tlcr.2017.02.02. [DOI] [PMC free article] [PubMed] [Google Scholar]
- 26.Imdahl A, Jenkner S, Brink I, Nitzsche E, Stoelben E, Moser E, Hasse J. Validation of FDG positron emission tomography for differentiation of unknown pulmonary lesions. Eur J Cardiothorac Surg. 2001;20:324–329. doi: 10.1016/s1010-7940(01)00800-4. [DOI] [PubMed] [Google Scholar]
- 27.Yilmaz F, Tastekin G. Sensitivity of (18)F-FDG PET in evaluation of solitary pulmonary nodules. Int J Clin Exp Med. 2015;8:45–51. [PMC free article] [PubMed] [Google Scholar]
- 28.Khalaf M, Abdel-Nabi H, Baker J, Shao Y, Lamonica D, Gona J. Relation between nodule size and 18F-FDG-PET SUV for malignant and benign pulmonary nodules. J Hematol Oncol. 2008;1:13. doi: 10.1186/1756-8722-1-13. [DOI] [PMC free article] [PubMed] [Google Scholar]
- 29.Yun JS, Kang SK, Kim SH, Na KJ, Song SY. Epithelioid hemangioendothelioma arising from interanl jugular vein mimicking cervical metastatic lymphadenopathy. Korean J Thorac Cardiovasc Surg. 2015;48:294–297. doi: 10.5090/kjtcs.2015.48.4.294. [DOI] [PMC free article] [PubMed] [Google Scholar]
- 30.Scordi-Bello IA, Snyder A, Schwartz M, Fallon JT. Intravascular epithelioid hemangioendothelioma of the inferior vena cava: case report of an unusual and unpredictable vascular tumor. Cardiovasc Pathol. 2009;18:243–246. doi: 10.1016/j.carpath.2008.03.004. [DOI] [PubMed] [Google Scholar]
- 31.Ishibashi H, Takasaki C, Akashi T, Okubo K. Successful excision of epithelioid hemangioendothelioma of the superior vena cava. Ann Thorac Surg. 2020;109:e271–e273. doi: 10.1016/j.athoracsur.2019.07.027. [DOI] [PubMed] [Google Scholar]
- 32.De Palma A, Pagliarulo V, Ardo N, Loizzi D. Surgical treatment of a rare case of epithelioid hemangioendothelioma of the azygos vein. Interact Cardiovasc Thorac Surg. 2012;14:91–93. doi: 10.1093/icvts/ivr064. [DOI] [PMC free article] [PubMed] [Google Scholar]
- 33.Lee WW, So Y, Kang SY, So MK, Kim H, Chung HW, Kim WS, Kim SE. F-18 fluorodeoxyglucose positron emission tomography for differential diagnosis and prognosis prediction of vascular tumors. Oncol Lett. 2017;14:665–672. doi: 10.3892/ol.2017.6192. [DOI] [PMC free article] [PubMed] [Google Scholar]
- 34.Rest CC, Botton E, Robinet G, Conan-Charlet V, Bizais Y, Visvikis D. FDG PET in epithelioid hemangioendothelioma. Clin Nucl Med. 2004;29:789–792. doi: 10.1097/00003072-200412000-00003. [DOI] [PubMed] [Google Scholar]
- 35.Nguyen BD. Epithelioid hemangioendothelioma of the liver with F-18 FDG PET imaging. Clin Nucl Med. 2004;29:828–830. doi: 10.1097/00003072-200412000-00019. [DOI] [PubMed] [Google Scholar]
- 36.Rao M, Chen Y, Huang Z, Zhu Y, Xiao X. FDG PET/CT findings of multifocal epithelioid hemangioendotheliomas of the bones. Clin Nucl Med. 2015;40:821–822. doi: 10.1097/RLU.0000000000000810. [DOI] [PubMed] [Google Scholar]
- 37.Amin RM, Hiroshima K, Kokubo T, Nishikawa M, Narita M, Kuroki M, Nakatani Y. Risk factors and independent predictors of survival in patients with pulmonary epithelioid haemangioendothelioma. Review of the literature and a case report. Respirology. 2006;11:818–825. doi: 10.1111/j.1440-1843.2006.00923.x. [DOI] [PubMed] [Google Scholar]
- 38.Luburich P, Ayuso MC, Picado C, Serra-Batlles J, Ramirez JF, Sole M. CT of pulmonary epithelioid hemangioendothelioma. J Comput Assist Tomogr. 1994;18:562–565. doi: 10.1097/00004728-199407000-00010. [DOI] [PubMed] [Google Scholar]
- 39.Kanashiki M, Tomizawa T, Yamaguchi I, Kurishima K, Hizawa N, Ishikawa H, Kagohashi K, Satoh H. Volume doubling time of lung cancers detected in a chest radiograph mass screening program: comparison with CT screening. Oncol Lett. 2012;4:513–516. doi: 10.3892/ol.2012.780. [DOI] [PMC free article] [PubMed] [Google Scholar]
- 40.Xu DM, van der Zaag-Loonen HJ, Oudkerk M, Wang Y, Vliegenthart R, Scholten ET, Verschakelen J, Prokop M, de Koning HJ, van Klaveren RJ. Smooth or attached solid indeterminate nodules detected at baseline CT screening in the NELSON study: cancer risk during 1 year of follow-up. Radiology. 2009;250:264–272. doi: 10.1148/radiol.2493070847. [DOI] [PubMed] [Google Scholar]
- 41.Xu DM, Gietema H, de Koning H, Vernhout R, Nackaerts K, Prokop M, Weenink C, Lammers JW, Groen H, Oudkerk M, van Klaveren R. Nodule management protocol of the NELSON randomised lung cancer screening trial. Lung Cancer. 2006;54:177–184. doi: 10.1016/j.lungcan.2006.08.006. [DOI] [PubMed] [Google Scholar]
- 42.Lee CU, Zreik RT, Boland JM, White ML. Radiologic-pathologic correlation: metastatic pulmonary epithelioid hemangioendothelioma of bone primary. J Clin Imaging Sci. 2015;5:50. doi: 10.4103/2156-7514.163994. [DOI] [PMC free article] [PubMed] [Google Scholar]
- 43.Albano D, Bosio G, Tironi A, Bertagna F. (18)F-FDG PET/CT in pleural epithelioid hemangioendothelioma. Asia Ocean J Nucl Med Biol. 2017;5:70–74. doi: 10.22038/aojnmb.2016.7971. [DOI] [PMC free article] [PubMed] [Google Scholar]
- 44.Calabrese C, Gilli M, De Rosa N, Di Crescenzo V, Zeppa P, Vitale C, Vatrella A. Role of FDG-PET scan in staging of pulmonary epithelioid hemangioendothelioma. Open Med (Wars) 2016;11:158–162. doi: 10.1515/med-2016-0025. [DOI] [PMC free article] [PubMed] [Google Scholar]
- 45.Watanabe S, Yano F, Kita T, Soga S, Shinmoto H, Kosuda S, Ozeki Y, Aida S, Sakata I. 18F-FDG-PET/CT as an indicator for resection of pulmonary epithelioid hemangioendothelioma. Ann Nucl Med. 2008;22:521–524. doi: 10.1007/s12149-007-0159-z. [DOI] [PubMed] [Google Scholar]
- 46.Woo JH, Kim TJ, Lee KS, Kim TS, Kim BT. Epithelioid hemangioendothelioma in the thorax: clinicopathologic, CT, PET, and prognostic features. Medicine (Baltimore) 2016;95:e4348. doi: 10.1097/MD.0000000000004348. [DOI] [PMC free article] [PubMed] [Google Scholar]
- 47.Wethasinghe J, Sood J, Walmsley R, Milne D, Jafer A, Gordon-Glassford N. Primary pleural epithelioid hemangioendothelioma mimicking as a posterior mediastinal tumor. Respirol Case Rep. 2015;3:75–77. doi: 10.1002/rcr2.106. [DOI] [PMC free article] [PubMed] [Google Scholar]
- 48.Lee YJ, Chung MJ, Jeong KC, Hahn CH, Hong KP, Kim YJ, Kim YT. Pleural epithelioid hemangioendothelioma. Yonsei Med J. 2008;49:1036–1040. doi: 10.3349/ymj.2008.49.6.1036. [DOI] [PMC free article] [PubMed] [Google Scholar]
- 49.Suga K, Kawakami Y, Hiyama A, Hori K. F-18 FDG PET/CT monitoring of radiation therapeutic effect in hepatic epithelioid hemangioendothelioma. Clin Nucl Med. 2009;34:199–202. doi: 10.1097/RLU.0b013e3181966f45. [DOI] [PubMed] [Google Scholar]