

Abstract
The Hospital Readmissions Reduction Program (HRRP) has penalized hospitals with higher 30-day readmission rates more than $3 billion to date. Clinicians and policy experts have raised concerns that the 30-day readmission measure used in this program provides an incomplete picture of performance because it does not capture all hospital encounters that may occur after discharge. In contrast, the excess days in acute care (EDAC) measure, which currently is not used in the HRRP, captures the full spectrum of hospital encounters (emergency department, observation stay, inpatient readmission) and their associated lengths of stay within 30 days of discharge. This study of 3173 hospitals that participated in the HRRP in fiscal year 2019 compared performance on the readmission and EDAC measures and evaluated whether using the EDAC measure would change hospitals’ penalty status for 3 conditions targeted by the HRRP. Overall, only moderate agreement was found on hospital performance rankings by using the readmission and EDAC measures (weighted κ statistic: heart failure, 0.45 [95% CI, 0.42 to 0.47]; acute myocardial infarction [AMI], 0.37 [CI, 0.35 to 0.40]; and pneumonia, 0.50 [CI, 0.47 to 0.52]). Under the HRRP, the penalty status of 769 (27.0%) of 2845 hospitals for heart failure, 581 (28.3%) of 2055 for AMI, and 724 (24.9%) of 2911 for pneumonia would change if the EDAC measure were used instead of the readmission measure to evaluate performance. Fewer small and rural hospitals would receive penalties. The Centers for Medicare & Medicaid Services should consider using the EDAC measure, which provides a more comprehensive picture of postdischarge hospital use, rather than the 30-day readmission measure to evaluate health care system performance under federal quality, reporting, and value-based programs.
In the United States, the Centers for Medicare & Medicaid Services (CMS) has increasingly focused on reducing preventable hospital visits as a way to reduce health care expenditures. The Hospital Readmissions Reduction Program (HRRP), for example, was implemented nationwide in 2012 and uses 30-day readmission rates to evaluate hospital performance. The HRRP aims to incentivize hospitals to improve care transitions and postdischarge care by financially penalizing those with higher-than-expected 30-day readmission rates (1).
Concern is growing, however, that the HRRP’s sole focus on 30-day readmissions provides an incomplete picture of hospital performance (2–7). The readmission measure does not capture other types of hospital encounters that may occur within 30 days of discharge, such as emergency department (ED) or observation stays, nor does it account for multiple rehospitalizations or the length of those visits (8). This may lead to unfair comparisons of hospital performance under the HRRP, given the substantial variation in ED triage patterns and observation stays across hospitals. Recent evidence suggests that temporal declines in 30-day readmissions may reflect intensified efforts to treat patients who return to a hospital in non-inpatient settings, and that total hospital revisits are increasing, raising concern that some hospitals may be inappropriately triaging patients in response to the program (8–12). As a result, clinicians and policy experts have intensified calls to replace the readmission measure with a more comprehensive measure of hospital use (2, 4, 13–15).
The excess days in acute care (EDAC) measure, which CMS began publicly reporting in 2017, captures the full spectrum of hospital revisits that may occur after discharge (16). In contrast to the readmission measure, the EDAC measure includes all ED visits, observation stays, and unplanned readmissions and captures total days spent in these settings within 30 days of discharge. Little is known, however, about whether the more comprehensive EDAC measure would change assessments of hospital performance under the HRRP. Answering this question is critically important given the current prominence of 30-day readmissions and the increasing controversy over the use of this measure to evaluate health system performance under several other value-based programs (1, 17–22).
Therefore, in this study we aimed to answer 3 questions. First, among hospitals participating in the HRRP, does the EDAC measure reclassify performance rankings compared with the readmission measure? Second, does the EDAC measure change which hospitals receive financial penalties under the HRRP? Third, would the types of hospitals that tend to be penalized change if the EDAC measure were used instead?
Methods
The institutional review board of Beth Israel Deaconess Medical Center approved the study and waived the requirement for participant informed consent.
Data
The CMS Hospital Compare files were used to identify short-term acute care hospitals that participated in the HRRP in fiscal year 2019 and to obtain their performance on the 30-day readmission and EDAC measures, which are publicly reported by CMS, for heart failure, acute myocardial infarction (AMI), and pneumonia. The hospital performance period encompassed all discharges among Medicare fee-for-service beneficiaries aged 65 years and older that occurred between 1 July 2014 and 30 June 2017. Hospitals with fewer than 25 eligible cases were excluded.
30-Day Readmission Measure
The hospital-level 30-day readmission measure captures unplanned inpatient readmissions that occur within 30 days of discharge after an index hospitalization. If a patient has more than 1 readmission within 30 days, only the first is counted, and the measure does not account for patients who do not survive during the 30-day postdischarge period. Differences in case mix among hospitals are accounted for through risk standardization.
EDAC Measure
The EDAC measure captures the total number of days a patient spends in an ED, in observation status, or admitted as an unplanned readmission within 30 days of discharge after an index hospitalization. For each hospital, the EDAC measure describes the difference (“excess”) between the average number of days patients spend in acute care per 100 discharges and the expected number of days given the case mix of that hospital. Therefore, the EDAC value may be positive, negative, or zero.
To generate hospital-level EDAC measurements, each ED treat-and-discharge encounter is counted as 1 half-day, whereas observation stays are rounded up to the nearest half-day, and each readmission day counts as 1 day (16). If an ED visit results in a readmission on the same day, only the readmission is counted. Differences in case mix among hospitals are accounted for by the measure. In addition, the EDAC accounts for the number of days each patient is at risk for a hospital revisit by incorporating the number of days (up to 30) that a patient survives after discharge as part of the outcome.
Supplement Table 1 (available at Annals.org) further compares the readmission and EDAC measures. More details regarding these measures are available in the CMS methodology reports (16, 23).
Statistical Analysis
We used descriptive statistics to characterize the readmission and EDAC measures at the hospital level by condition. We then assessed reclassification of hospital performance rankings based on the EDAC compared with the readmission measure. First, hospitals were ranked into 5 quintile groups on the basis of their performance on the readmission and EDAC measures separately for each condition (group 1, best performance; group 5, worst performance). We then calculated the proportion of hospitals allocated to a performance group according to the readmission measure that would be reclassified into a different performance group if the EDAC measure were used. A weighted κ statistic was calculated to assess the agreement between hospital-level performance rankings on the readmission and EDAC measures (24).
Next, we examined the change in penalty status under the HRRP by using the EDAC measure. In fiscal year 2019, CMS began a new peer group-based assessment of hospital performance to determine penalties under the HRRP, such that a hospital’s 30-day readmission performance for each condition was evaluated relative to hospitals with similar poverty levels among their Medicare patient populations. All participating hospitals are stratified into 5 peer group quintiles based on the proportion of Medicare hospital stays for which patients were dually enrolled in Medicare and Medicaid. Within a peer group, each hospital’s condition-specific readmission performance is compared with the median performance for that group, and hospitals with readmission rates that are higher than the median receive financial penalties under the HRRP (25, 26). We replicated this approach by using the EDAC measure for each condition and determined penalty status by comparing each hospital’s EDAC performance with the corresponding peer group median. The proportion of hospitals whose penalty status would change if the EDAC measure were used instead of the readmission measure was then calculated. We also compared the proportion of penalized hospitals by key characteristics by using the readmission versus the EDAC measure.
Analyses were conducted with SAS, version 9.4, 64-bit (SAS Institute).
Results
A total of 3173 hospitals with publicly reported 30-day risk-standardized readmission and EDAC measures participated in the HRRP in fiscal year 2019 (Supplement Figure 1, available at Annals.org). Baseline characteristics of hospitals by condition are shown in Supplement Table 2 (available at Annals.org).
The median readmission rate was 21.6% (range, 15.9% to 29.8%) for heart failure, 16.0% (range, 12.0% to 20.7%) for AMI, and 16.7% (range, 12.5% to 23.3%) for pneumonia (Table 1). The median EDAC per 100 discharges was 5.1 days (range, −60.1 to 143.4 days) for heart failure, 4.8 days (range, −59.0 to 174.3 days) for AMI, and 6.3 days (range, −57.8 to 148.9 days) for pneumonia.
Table 1.
Hospital Performance on the Readmission and EDAC Measures
| Measure | Mean, % | Median, % | Range, % |
|---|---|---|---|
| 30-d readmission rate | |||
| Heart failure | 21.7 | 21.6 | 15.9 to 29.8 |
| AMI | 16.0 | 16.0 | 12.0 to 20.7 |
| Pneumonia | 16.8 | 16.7 | 12.5 to 23.3 |
| Excess Days per 100 Discharges |
|||
| Mean | Median | Range | |
| EDAC | |||
| Heart failure | 7.0 | 5.1 | −60.1 to 143.4 |
| AMI | 6.9 | 4.8 | −59.0 to 174.3 |
| Pneumonia | 8.8 | 6.3 | −57.8 to 148.9 |
AMI = acute myocardial infarction; EDAC = excess days in acute care.
Reclassification of Performance Rankings
Changes in performance rankings based on the re-admission versus EDAC measures are shown in Figure 1. Of the 564 hospitals ranked in the top group (group 1) of performance for heart failure with use of the read-mission measure, 280 (49.6%) were reclassified to a lower performance group (groups 2 to 5) by using the EDAC measure. In addition, 239 (41.9%) of the 571 hospitals in the worst performance group (group 5) were reclassified to a higher performance group (1 to 4) by using the EDAC measure. For AMI, of the 408 hospitals ranked in group 1 of readmission performance, 224 (54.9%) were reclassified to a lower performance group (2 to 5), whereas 226 (55.1%) of 410 hospitals in performance group 5 were reclassified to a higher group (1 to 4) by using the EDAC measure. These patterns were similar for pneumonia: 287 (48.8%) of the 588 hospitals allocated to group 1 on the basis of readmission performance were reclassified to a lower group (2 to 5) when the EDAC measure was used, whereas 218 (37.2%) of 586 hospitals in group 5 were reclassified to a higher group (1 to 4).
Figure 1.
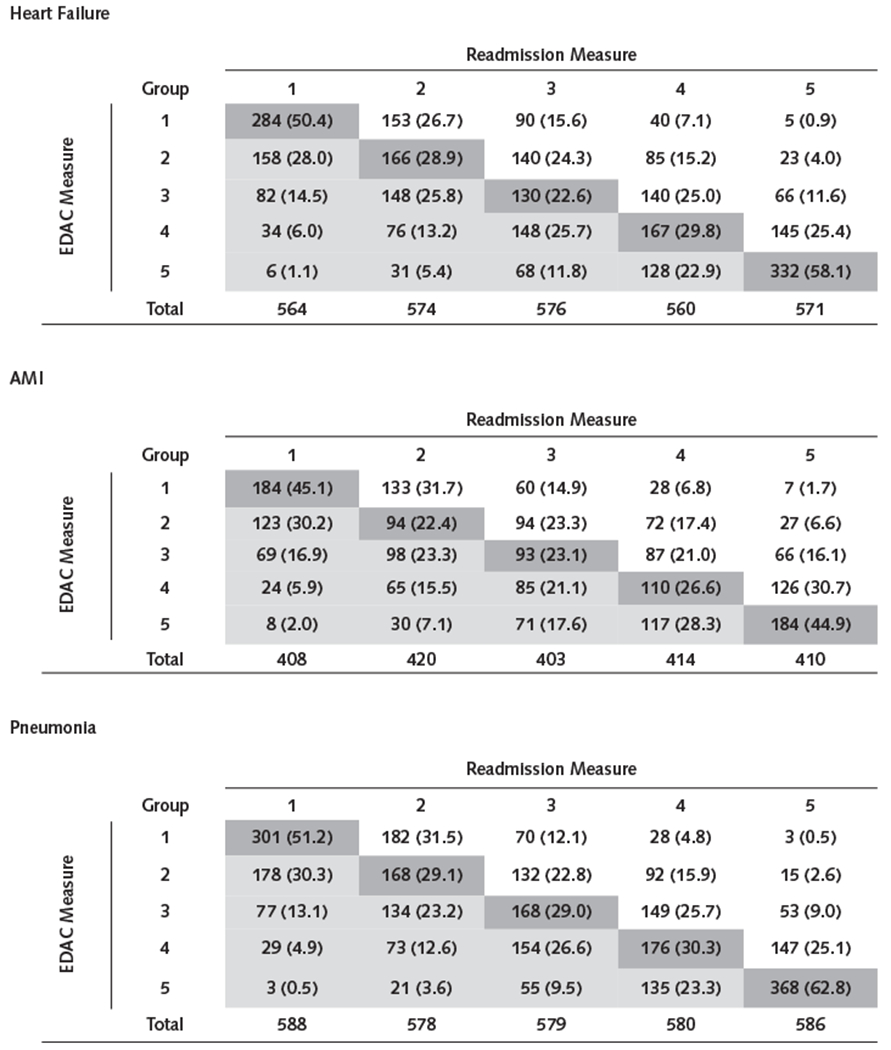
Reclassification of hospital performance rankings on the basis of the EDAC measure for heart failure (top), AMI (middle), and pneumonia (bottom).
Hospitals were ranked into performance quintiles, with group 1 representing “best-performing” and group 5 “worst-performing” hospitals. Each column shows hospitals falling within a specific group ranking on the basis of the readmission measure, and each row shows the number (%) of those hospitals that would (or would not) be reclassified on the basis of the EDAC measure. The dark gray cells show the number (%) of hospitals within a readmission performance group that would have no change in performance ranking if the EDAC measure were used. The light gray cells show the number (%) of hospitals within a readmission performance group that would shift into a lower performance group on the basis of the EDAC measure. The unshaded cells show the number (%) of hospitals within a readmission performance group that would shift into a higher performance group if the EDAC measure were used. The number of hospitals in each performance quintile is unequal because some hospitals had identical readmission rates. AMI = acute myocardial infarction; EDAC = excess days in acute care.
The weighted κ statistic, which examines agreement between the hospital-level readmission and EDAC measures, was 0.45 (95% CI, 0.42 to 0.47) for heart failure, 0.37 (CI, 0.35 to 0.40) for AMI, and 0.50 (CI, 0.47 to 0.52) for pneumonia.
Reclassification of HRRP Penalty Status
Under the HRRP, the penalty status of 769 (27.0%) of 2845 hospitals for heart failure, 581 (28.3%) of 2055 for AMI, and 724 (24.9%) of 2911 for pneumonia would change if the EDAC measure were used instead of the readmission measure to evaluate hospital performance for each condition (Supplement Figure 2, available at Annals.org).
Of 2845 hospitals ranked for heart failure, 387 of 1422 (27.2%) that received penalties under the HRRP based on the readmission measure would be down-classified to no penalty by using the EDAC measure, whereas 382 of 1423 (26.8%) that received no penalty would be up-classified to a penalty (Figure 2). Likewise, of the 2055 hospitals assessed for AMI, 292 of 1026 (28.5%) that received penalties with use of the readmission measure would be down-classified to no penalty with the EDAC measure, whereas 289 of 1029 (28.1%) would be up-classified to a penalty. Of the 2911 hospitals ranked for pneumonia, 362 of 1454 (24.9%) would be down-classified from penalty to no penalty, and 362 of 1457 (24.9%) would be up-classified from no penalty to a penalty.
Figure 2.
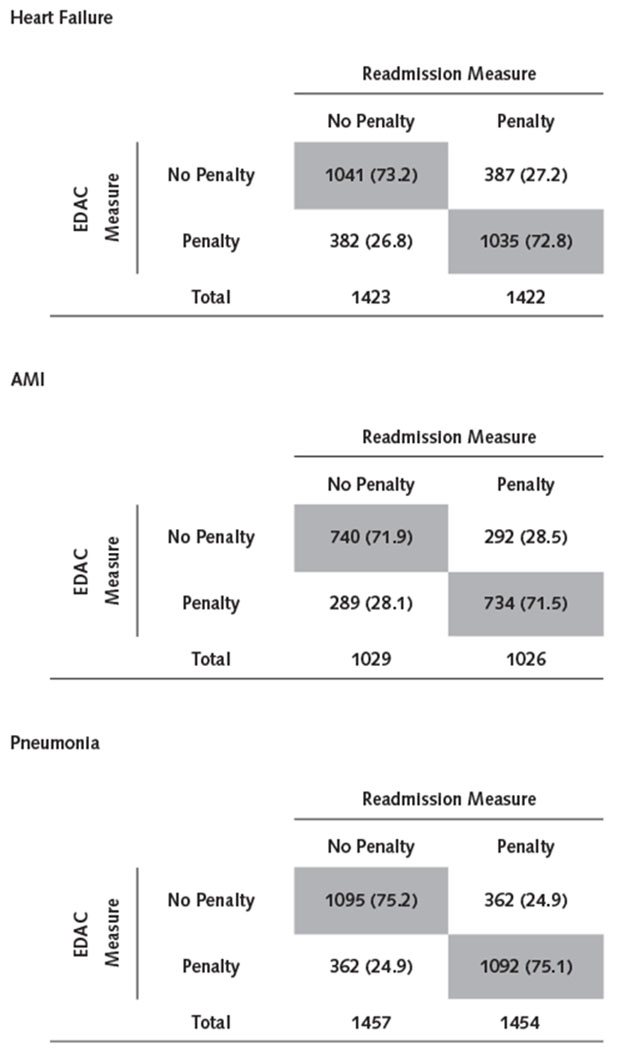
Reclassification of hospital penalty status on the basis of the EDAC measure for heart failure (top), AMI (middle), and pneumonia (bottom).
The gray cells show the number (%) of hospitals penalized (or not) under the HRRP readmission measure that would have no change in penalty status with the EDAC measure. The unshaded cells show the number (%) of hospitals that are penalized (or not) under the readmission measure that would have a change in penalty status with the EDAC measure. To assess changes in penalty status, we replicated the approach that the Centers for Medicare & Medicaid Services currently uses for the HRRP, which stratifies eligible hospitals into 5 peer group quintiles based on the proportion of Medicare hospital stays for which patients were dually enrolled in Medicare and Medicaid. Hospitals are evaluated relative to the median performance within their group, and financial penalties under the HRRP are levied on those with worse than median performance. AMI = acute myocardial infarction; EDAC = excess days in acute care; HRRP = Hospital Readmissions Reduction Program.
The distribution of penalties by hospital characteristics would change under the HRRP if the EDAC measure were used instead of the readmission measure (Supplement Tables 3 to 5, available at Annals.org). For heart failure, fewer small hospitals (<200 beds) would receive penalties on the basis of the EDAC compared with the readmission measure (40.5% vs. 49.5%; P < 0.001) (Table 2). These patterns would be similar for AMI (43.9% vs. 48.8%; P = 0.009) and pneumonia (38.5% vs. 45.0%; P < 0.001). In addition, fewer rural hospitals would be penalized with use of the EDAC measure for heart failure (36.8% vs. 46.9%; P < 0.001), AMI (38.1% vs. 45.3%; P = 0.02), and pneumonia (34.0% vs. 40.3%; P < 0.001).
Table 2.
Distribution of Penalties on the Basis of the Readmission Versus EDAC Measures, by Hospital Characteristics*
| Characteristic | Heart Failure |
AMI |
Pneumonia |
||||||
|---|---|---|---|---|---|---|---|---|---|
| Penalized Readmissions, n (%) | Penalized EDAC, n (%) | P Value | Penalized Readmissions, n (%) | Penalized EDAC, n (%) | P Value | Penalized Readmissions, n (%) | Penalized EDAC, n (%) | P Value | |
| Hospital size | |||||||||
| Large (≥400 beds) | 195 (45.1) | 295 (68.3) | <0.001 | 205 (48.7) | 250 (59.4) | <0.001 | 240 (55.7) | 325 (75.4) | <0.001 |
| Medium (200-399 beds) | 410 (53.5) | 454 (59.3) | <0.001 | 376 (51.6) | 371 (50.9) | 0.72 | 440 (57.4) | 466 (60.8) | 0.04 |
| Small (<200 beds) | 801 (49.5) | 655 (40.5) | <0.001 | 433 (48.8) | 390 (43.9) | 0.009 | 757 (45.0) | 648 (38.5) | <0.001 |
| Type of ownership | |||||||||
| Public | 192 (49.1) | 192 (49.1) | 1.00 | 95 (48.0) | 102 (51.5) | 0.35 | 186 (44.1) | 191 (45.3) | 0.63 |
| Private | |||||||||
| For profit | 377 (63.0) | 336 (56.2) | 0.001 | 259 (58.9) | 255 (58.0) | 0.72 | 350 (57.6) | 336 (55.3) | 0.24 |
| Not for profit | 837 (45.8) | 876 (47.9) | 0.08 | 660 (47.1) | 654 (46.7) | 0.76 | 901 (48.7) | 912 (49.3) | 0.61 |
| Teaching status | |||||||||
| Nonteaching | 703 (52.0) | 589 (43.5) | <0.001 | 384 (49.7) | 377 (48.8) | 0.64 | 656 (46.8) | 583 (41.6) | <0.001 |
| Teaching | 703 (48.0) | 815 (55.7) | <0.001 | 630 (49.8) | 634 (50.1) | 0.83 | 781 (52.9) | 856 (58.0) | <0.001 |
| Safety-net status | |||||||||
| Non-safety-net hospital | 1138 (50.0) | 1133 (49.8) | 0.84 | 857 (49.9) | 855 (49.8) | 0.93 | 1156 (50.0) | 1156 (50.0) | 1.00 |
| Safety-net hospital | 284 (50.0) | 284 (50.0) | 1.00 | 169 (49.9) | 168 (49.6) | 0.92 | 298 (49.9) | 298 (49.9) | 1.00 |
| Location | |||||||||
| Nonrural | 1070 (51.0) | 1140 (54.3) | 0.003 | 883 (50.5) | 901 (51.5) | 0.42 | 1133 (53.3) | 1183 (55.7) | 0.03 |
| Rural | 336 (46.9) | 264 (36.8) | <0.001 | 131 (45.3) | 110 (38.1) | 0.02 | 304 (40.3) | 256 (34.0) | <0.001 |
AMI = acute myocardial infarction; EDAC = excess days in acute care.
Hospital characteristics (except safety-net status) were not available for 28 hospitals for heart failure, 17 hospitals for AMI, and 32 hospitals for pneumonia. Safety-net hospitals were defined as those in the highest quintile of total Medicare hospital stays for which patients were dually enrolled in Medicare and Medicaid. Comparisons between the proportions were performed by using the McNemar test.
Discussion
Concern is growing that the 30-day readmission measure, which has been used increasingly by CMS to assess hospitals, provides an incomplete picture of performance. We found that the EDAC measure, which captures all hospital encounters that occur within 30 days of discharge, substantially changes hospital performance rankings compared with the readmission measure. Under the HRRP, the penalty status for more than a quarter of hospitals would change if the EDAC measure, rather than the readmission measure, were used to evaluate performance. Small and rural hospitals would see a marked reduction in the burden of financial penalties.
During the past decade, policymakers have increasingly used the 30-day readmission measure to evaluate health system performance. The HRRP has imposed more than $3 billion in financial penalties to date but has been criticized because it does not fully risk adjust readmission performance for important clinical characteristics (such as frailty) and social factors (such as housing instability), which are associated with a higher risk for hospitalization (27–32). As a result, the program has disproportionately penalized resource-constrained, safety-net hospitals that serve medically complex and socially high-risk patients (2, 30, 33). Controversy also has arisen about whether the readmission measure used in the program provides a fair picture of performance, because it does not capture the full spectrum of hospital revisits that may occur after discharge (2, 4). Our findings substantiate these concerns by demonstrating that the EDAC measure, which captures all postdischarge hospital visits, would substantially change the distribution of financial penalties under the HRRP.
A few potential reasons exist for the difference in hospital performance assessments between the EDAC and readmission measures. First, the EDAC measure provides a more comprehensive picture of total days spent in any hospital setting, whereas the readmission measure counts only the first inpatient revisit. Under the HRRP, some hospitals have increased efforts to manage patients who return after discharge in EDs and reclassify admissions as observation stays, making their readmission rates seem lower (8–10). The EDAC measure is less susceptible to this type of gaming, allowing for fairer comparisons of hospital performance. Second, hospitals with higher postdischarge death rates may perform better under the current HRRP, because a patient who dies shortly after discharge cannot be readmitted. The EDAC measure addresses this limitation of the readmission measure by accounting for survival time after discharge. Recent evidence suggests that doing so changes the penalty status of hospitals participating in the HRRP (34, 35).
We found that moving to the EDAC measure would reduce financial penalties imposed on small and rural hospitals. These hospitals may have higher readmission rates simply because they have less infrastructure and capacity to manage returning patients in EDs or as observation stays compared with larger, nonrural hospitals. The EDAC measure, which provides a more complete picture of hospital visits after discharge, could address concerns about the regressive nature of the HRRP and allow for more equitable comparisons of performance (2, 30, 33). Moreover, reducing financial penalties for rural hospitals is particularly important, because many of these health systems are facing financial instability and are closing at an alarming rate across the United States (36).
Although national declines in readmissions initially were attributed to improvements in care transitions, recent evidence suggests that much of these reductions may partly be a result of coding and statistical artifact (37–40), as well as increased efforts by hospitals to treat patients who return in EDs and observation stays (8, 10, 11). How such shifts in care settings have affected quality of care, patient experience and satisfaction, or out-of-pocket expenditures is unclear (41), and controversy exists about whether they have been appropriate. Some studies suggest that implementation of the HRRP may have been associated with increased mortality for heart failure (42–46), raising concern that intensified efforts to manage patients in non-inpatient settings may adversely affect patients at the margin who might benefit from inpatient care (3, 5–7, 12, 47). The EDAC measure could mitigate these concerns and encourage more considered decision making about the care needs of patients who return after discharge.
This study has limitations. First, although each hospital’s EDAC measure is a point estimate with an associated margin of error, only the point estimates were used to determine reclassification of penalty status. This approach is consistent with how CMS uses the re-admission measure to determine penalties. Second, we focused on conditions initially targeted by the HRRP. Third, although the EDAC measure provides a more comprehensive assessment of hospital use, it does not address other limitations, including inadequate risk adjustment for social risk and the upcoding of comorbid conditions (29, 30, 40).
In conclusion, the penalty status of more than a quarter of hospitals would change if the EDAC measure were used in the HRRP, and small and rural hospitals would be less likely to receive penalties. The CMS should consider using the EDAC measure, which provides a more comprehensive picture of hospital use within 30 days of discharge than the readmission measure, to evaluate health care system performance under federal quality, reporting, and value-based programs.
Supplementary Material
Footnotes
Disclosures: Disclosures can be viewed at www.acponline.org/authors/icmje/ConflictOfInterestForms.do?msNum=M20-3486.
References
- 1.Hospital Readmission Reduction Program, Patient Protection and Affordable Care Act. §3025 (2010). Codified at 42 CFR §412.150-412.154. [Google Scholar]
- 2.Wadhera RK, Yeh RW, Joynt Maddox KE. The Hospital Readmissions Reduction Program–time for a reboot. N Engl J Med. 2019; 380:2289–2291. doi: 10.1056/NEJMp1901225 [DOI] [PMC free article] [PubMed] [Google Scholar]
- 3.Fonarow GC. Unintended harm associated with the Hospital Readmissions Reduction Program [Editorial]. JAMA. 2018;320:2539–2541. doi: 10.1001/jama.2018.19325 [DOI] [PubMed] [Google Scholar]
- 4.Psotka MA, Fonarow GC, Allen LA, et al. The Hospital Readmissions Reduction Program: nationwide perspectives and recommendations: A JACC: heart failure position paper. JACC Heart Fail. 2020;8:1–11. doi: 10.1016/j.jchf.2019.07.012 [DOI] [PubMed] [Google Scholar]
- 5.Gupta A, Fonarow GC. The Hospital Readmissions Reduction Program–learning from failure of a healthcare policy. Eur J Heart Fail. 2018;20:1169–1174. doi: 10.1002/ejhf.1212 [DOI] [PMC free article] [PubMed] [Google Scholar]
- 6.Gupta A, Fonarow GC. The Hospital Readmissions Reduction Program: evidence for harm. JACC Heart Fail. 2018;6:607–609. doi: 10.1016/j.jchf.2018.02.012 [DOI] [PubMed] [Google Scholar]
- 7.Ziaeian B, Fonarow GC. When payment models distort perceptions and care delivery for patients with heart failure. J Card Fail. 2019;25:227–229. doi: 10.1016/j.cardfail.2019.02.017 [DOI] [PMC free article] [PubMed] [Google Scholar]
- 8.Wadhera RK, Joynt Maddox KE, Kazi DS, et al. Hospital revisits within 30 days after discharge for medical conditions targeted by the Hospital Readmissions Reduction Program in the United States: national retrospective analysis. BMJ. 2019;366:l4563. doi: 10.1136/bmj.l4563 [DOI] [PMC free article] [PubMed] [Google Scholar]
- 9.Noel-Miller C, Lind K. Is observation status substituting for hospital readmission? Health Affairs Blog. Accessed at www.healthaffairs.org/do/10.1377/hblog20151028.051459/full on 4 March 2020. [Google Scholar]
- 10.Sabbatini AK, Wright B. Excluding observation stays from readmission rates–what quality measures are missing. N Engl J Med. 2018;378:2062–2065. doi: 10.1056/NEJMp1800732 [DOI] [PubMed] [Google Scholar]
- 11.Medicare Payment Advisory Commission. Mandated report: the effects of the Hospital Readmissions Reduction Program. Accessed at www.medpac.gov/docs/default-source/reports/jun18_ch1_medpacreport_sec.pdf on 20 July 2020.
- 12.Hsuan C, Carr BG, Hsia RY, et al. Assessment of hospital readmissions from the emergency department after implementation of Medicare’s Hospital Readmissions Reduction Program. JAMA Netw Open. 2020;3:e203857. doi: 10.1001/jamanetworkopen.2020.3857 [DOI] [PMC free article] [PubMed] [Google Scholar]
- 13.Hernandez AF, DeVore AD. Evolving the Hospital Readmissions Reduction Program: a call for peace, happiness, and improved patient-centered outcomes [Editorial]. J Am Coll Cardiol. 2019;74:235–237. doi: 10.1016/j.jacc.2019.05.030 [DOI] [PubMed] [Google Scholar]
- 14.Jha AK. To fix the hospital readmissions program, prioritize what matters. JAMA. 2018;319:431–433. doi: 10.1001/jama.2017.21623 [DOI] [PubMed] [Google Scholar]
- 15.Joynt KE, Jha AK. A path forward on Medicare readmissions. N Engl J Med. 2013;368:1175–7. doi: 10.1056/NEJMp1300122 [DOI] [PubMed] [Google Scholar]
- 16.Centers for Medicare & Medicaid Services. Excess days in acute care (EDAC) measures methodology. Accessed at www.qualitynet.org/inpatient/measures/edac/methodology on 22 January 2020.
- 17.Centers for Medicare & Medicaid Services. MIPS overview: explore measures and activities. Accessed at https://qpp.cms.gov/mips/explore-measures/quality-measures?py=2019&search=readmissions on 1 February 2020.
- 18.Singh S, Goodwin JS, Zhou J, et al. Variation among primary care physicians in 30-day readmissions. Ann Intern Med. 2019;170:749–755. doi: 10.7326/M18-2526 [DOI] [PMC free article] [PubMed] [Google Scholar]
- 19.Medicare.gov. Hospital Compare. Overall hospital quality star rating. Accessed at www.medicare.gov/hospitalcompare/Data/Measure-groups.html on 10 February 2020. [Google Scholar]
- 20.Bilimoria KY, Barnard C. The new CMS hospital quality star ratings: the stars are not aligned. JAMA. 2016;316:1761–1762. doi: 10.1001/jama.2016.13679 [DOI] [PubMed] [Google Scholar]
- 21.Centers for Medicare & Medicaid Services. Bundled Payments for Care Improvement Advanced. Accessed at https://innovation.cms.gov/initiatives/bpci-advanced on 9 February 2020.
- 22.Centers for Medicare & Medicaid Services. Accountable Care Organizations (ACOs). Accessed at www.cms.gov/Medicare/Medicare-Fee-for-Service-Payment/ACO on 2 February 2020.
- 23.Centers for Medicare & Medicaid Services. Readmission measures methodology. Accessed at www.qualitynet.org/inpatient/measures/readmission/methodology on 2 January 2020.
- 24.Cicchetti DV, Allison T. A new procedure for assessing reliability of scoring EEG sleep recordings. American Journal of EEG Technology. 1971;11:101–10. [Google Scholar]
- 25.Joynt Maddox KE, Reidhead M, Qi AC, et al. Association of stratification by dual enrollment status with financial penalties in the Hospital Readmissions Reduction Program. JAMA Intern Med. 2019;179:769–776. doi: 10.1001/jamainternmed.2019.0117 [DOI] [PMC free article] [PubMed] [Google Scholar]
- 26.Centers for Medicare & Medicaid Services. New Stratified Methodology Hospital-Level Impact File User Guide–Hospital Readmissions Reduction Program. Accessed at www.cms.gov/Medicare/Medicare-Fee-for-Service-Payment/AcuteInpatientPPS/Downloads/HRRP_StratMethod_ImpctFile_UG.PDF on 8 February 2020.
- 27.Johnston KJ, Wen H, Schootman M, et al. Association of patient social, cognitive, and functional risk factors with preventable hospitalizations: implications for physician value-based payment. J Gen Intern Med. 2019;34:1645–1652. doi: 10.1007/s11606-019-05009-3 [DOI] [PMC free article] [PubMed] [Google Scholar]
- 28.Kundi H, Wadhera RK, Strom JB, et al. Association of frailty with 30-day outcomes for acute myocardial infarction, heart failure, and pneumonia among elderly adults. JAMA Cardiol. 2019;4:1084–1091. doi: 10.1001/jamacardio.2019.3511 [DOI] [PMC free article] [PubMed] [Google Scholar]
- 29.Joynt Maddox KE, Reidhead M, Hu J, et al. Adjusting for social risk factors impacts performance and penalties in the Hospital Readmissions Reduction Program. Health Serv Res. 2019;54:327–336. doi: 10.1111/1475-6773.13133 [DOI] [PMC free article] [PubMed] [Google Scholar]
- 30.Joynt Maddox KE. Financial incentives and vulnerable populations–will alternative payment models help or hurt? N Engl J Med. 2018;378:977–979. doi: 10.1056/NEJMp1715455 [DOI] [PubMed] [Google Scholar]
- 31.Roberts ET, Zaslavsky AM, Barnett ML, et al. Assessment of the effect of adjustment for patient characteristics on hospital readmission rates: implications for pay for performance. JAMA Intern Med. 2018;178:1498–1507. doi: 10.1001/jamainternmed.2018.4481 [DOI] [PMC free article] [PubMed] [Google Scholar]
- 32.Boccuti C, Casillas G. Aiming for fewer hospital U-turns: the Medicare Hospital Readmission Reduction Program. Kaiser Family Foundation. Accessed at www.kff.org/medicare/issue-brief/aiming-for-fewer-hospital-u-turns-the-medicare-hospital-readmission-reduction-program on 29 July 2020. [Google Scholar]
- 33.Joynt KE, Jha AK. Characteristics of hospitals receiving penalties under the Hospital Readmissions Reduction Program. JAMA. 2013;309:342–3. doi: 10.1001/jama.2012.94856 [DOI] [PubMed] [Google Scholar]
- 34.Papanicolas I, Orav EJ, Jha AK. Is mortality readmissions bias a concern for readmission rates under the Hospital Readmissions Reduction Program? Health Serv Res. 2020;55:249–258. doi: 10.1111/1475-6773.13268 [DOI] [PMC free article] [PubMed] [Google Scholar]
- 35.Abdul-Aziz AA, Hayward RA, Aaronson KD, et al. Association between Medicare hospital readmission penalties and 30-day combined excess readmission and mortality. JAMA Cardiol. 2017;2:200–203. doi: 10.1001/jamacardio.2016.3704 [DOI] [PMC free article] [PubMed] [Google Scholar]
- 36.U.S. Government Accountability Office. Rural Hospital Closures: Number and Characteristics of Affected Hospitals and Contributing Factors. Accessed at www.gao.gov/assets/700/694125. on 6 August 2020.
- 37.Joshi S, Nuckols T, Escarce J, et al. Regression to the mean in the Medicare Hospital Readmissions Reduction Program. JAMA Intern Med. 2019. doi: 10.1001/jamainternmed.2019.1004 [DOI] [PMC free article] [PubMed] [Google Scholar]
- 38.Ibrahim AM, Dimick JB, Sinha SS, et al. Association of coded severity with readmission reduction after the Hospital Readmissions Reduction Program. JAMA Intern Med. 2018;178:290–292. doi: 10.1001/jamainternmed.2017.6148 [DOI] [PMC free article] [PubMed] [Google Scholar]
- 39.Ody C, Msall L, Dafny LS, et al. Decreases in readmissions credited to Medicare’s program to reduce hospital readmissions have been overstated. Health Aff (Millwood). 2019;38:36–43. doi: 10.1377/hlthaff.2018.05178 [DOI] [PubMed] [Google Scholar]
- 40.Sukul D, Hoffman GJ, Nuliyalu U, et al. Association between Medicare policy reforms and changes in hospitalized Medicare beneficiaries’ severity of illness. JAMA Netw Open. 2019;2:e193290. doi: 10.1001/jamanetworkopen.2019.3290 [DOI] [PMC free article] [PubMed] [Google Scholar]
- 41.Kangovi S, Cafardi SG, Smith RA, et al. Patient financial responsibility for observation care. J Hosp Med. 2015;10:718–23. doi: 10.1002/jhm.2436 [DOI] [PubMed] [Google Scholar]
- 42.Wadhera RK, Joynt Maddox KE, Wasfy JH, et al. Association of the Hospital Readmissions Reduction Program with mortality among Medicare beneficiaries hospitalized for heart failure, acute myocardial infarction, and pneumonia. JAMA. 2018;320:2542–2552. doi: 10.1001/jama.2018.19232 [DOI] [PMC free article] [PubMed] [Google Scholar]
- 43.Huckfeldt P, Escarce J, Sood N, et al. Thirty-day postdischarge mortality among black and white patients 65 years and older in the Medicare Hospital Readmissions Reduction Program. JAMA Netw Open. 2019;2:e190634. doi: 10.1001/jamanetworkopen.2019.0634 [DOI] [PMC free article] [PubMed] [Google Scholar]
- 44.Huckfeldt P, Escarce J, Wilcock A, et al. HF mortality trends under Medicare readmissions reduction program at penalized and non-penalized hospitals [Letter]. J Am Coll Cardiol. 2018;72:2539–2540. doi: 10.1016/j.jacc.2018.08.2174 [DOI] [PMC free article] [PubMed] [Google Scholar]
- 45.Gupta A, Allen LA, Bhatt DL, et al. Association of the Hospital Readmissions Reduction Program implementation with readmission and mortality outcomes in heart failure. JAMA Cardiol. 2018;3:44–53. doi: 10.1001/jamacardio.2017.4265 [DOI] [PMC free article] [PubMed] [Google Scholar]
- 46.Wadhera RK, Bhatt DL. Toward precision policy–the case of cardiovascular care. N Engl J Med. 2018;379:2193–2195. doi: 10.1056/NEJMp1806260 [DOI] [PMC free article] [PubMed] [Google Scholar]
- 47.Fonarow GC, Konstam MA, Yancy CW. The Hospital Readmission Reduction Program is associated with fewer readmissions, more deaths: time to reconsider [Editorial]. J Am Coll Cardiol. 2017;70:1931–1934. doi: 10.1016/j.jacc.2017.08.046 [DOI] [PubMed] [Google Scholar]
Associated Data
This section collects any data citations, data availability statements, or supplementary materials included in this article.