

Abstract
Computed tomography perfusion (CTP) is crucial for acute ischemic stroke (AIS) patient diagnosis. To improve infarct prediction, enhanced image processing and automated parameter selection have been implemented in Vital Images’ new CTP+ software. We compared CTP+ with its previous version, commercially available software (RAPID and Sphere), and follow-up diffusion-weighted imaging (DWI). Data from 191 AIS patients between March 2019 and January 2020 was retrospectively collected and allocated into endovascular intervention (n = 81) and conservative treatment (n = 110) cohorts. Intervention patients were treated for large vessel occlusion, underwent mechanical thrombectomy, and achieved successful reperfusion of thrombolysis in cerebral infarction 2b/2c/3. Conservative treatment patients suffered large or small vessel occlusion and did not receive intravenous thrombolysis or mechanical thrombectomy. Infarct and penumbra were assessed using intervention and conservative treatment patients, respectively. Infarct and penumbra volumes were segmented from CTP+ and compared with 24-h DWI along with RAPID, Sphere, and Vitrea. Mean infarct differences (95% confidence intervals) and Spearman correlation coefficients (SCCs) between DWI and each CTP software product for intervention patients are: CTP+ = (5.8 ± 5.9 ml, 0.62), RAPID = (10.0 ± 5.2 ml, 0.73), Sphere = (3.0 ± 6.0 ml, 0.56), Vitrea = (7.2 ± 4.9 ml, 0.66). For conservative treatment patients, mean infarct differences and SCCs are: CTP+ = (–8.0 ± 5.4 ml, 0.64), RAPID = (–25.6 ± 11.5 ml, 0.60), Sphere = (–25.6 ± 8.0 ml, 0.66), Vitrea = (1.3 ± 4.0 ml, 0.72). CTP+ performed similarly to RAPID and Sphere in addition to its semi-automated predecessor, Vitrea, when assessing intervention patient infarct volumes. For conservative treatment patients, CTP+ outperformed RAPID and Sphere in assessing penumbra. Semi-automated Vitrea remains the most accurate in assessing penumbra, but CTP+ provides an improved workflow from its predecessor.
Keywords: Brain, CT perfusion, ischemic stroke
Introduction
Rapid reperfusion in acute ischemic stroke (AIS) patients is essential to reduce risk of disability and mortality.1 Computed tomography perfusion (CTP) is an imaging modality used to diagnose ischemic tissue in AIS patients and, in combination with patient demographics such as age, time since onset of stroke symptoms, National Institute of Health Stroke Scale (NIHSS) score, and cardiac output, assess a patient’s eligibility for endovascular reperfusion procedures.2–4 A penumbra-to-infarct ratio of 1.8 is preferred to deem a patient eligible for such procedures.5 Multiple studies have shown that patients whose baseline CTP imaging accurately predicted final infarct volumes (FIVs), when compared within follow-up diffusion-weighted magnetic resonance imaging (DWI) within 24 h, achieve successful reperfusion.6 Although CTP is relied upon to assess reperfusion eligibility, multiple CTP software products exist that utilize different perfusion parameters and thresholds for identifying infarct and penumbra tissue.7,8
The aforementioned perfusion parameters are calculated using arterial input function (AIF) and venous output function (VOF) curves. The AIF and VOF locations are automatically selected within the CTP volume as a feeding artery and a draining vein, respectively. Typically, the AIF intensity values will appear lower in intensity than they actually are due to partial volume effect from tissue. This occurs since the size of the feeding artery does not fully encompass the voxels used as the selection location. The VOF is therefore used to normalize the AIF since the draining vein is much larger, leading to the selected voxels likely being fully encompassed by the vein and because the amount of contrast that flows through the vein should equal that which flows through the artery.9 Following scaling of the AIF, perfusion parameters such as cerebral blood flow (CBF) and cerebral blood volume (CBV) can be calculated from the AIF using decomposition or Bayesian techniques.9,10
RAPID (iSchemaView, Menlo Park, CA, USA) and Sphere (Olea Medical, La Ciotat, France) CTP software are two commercially available software products that primarily rely on the CBF parameter, but utilize different contralateral hemisphere thresholds to identify infarct.8,11 Reliance on the CBF parameter can, however, lead to false positive identification of infarct in regions of leukoaraiosis. This decrease in CBF, allowing for the segmentation of infarct, is due to white matter naturally having lower amount of blood flow than gray matter, especially in regions of leukoaraiosis.12,13 Meanwhile, Vitrea and recently developed CTP+ (Vital Images, Minnetonka, MN, USA) software primarily rely on CBV to identify infarct.8 Although previous studies have been conducted assessing the reliability of infarct and penumbra segmentation using RAPID, Sphere, and Vitrea, similar studies need to be conducted on the recently developed CTP+ software.7,8,11,12,14
We aimed to assess the agreement of FIVs and penumbra between DWI and the newly developed CTP+ software. Additionally, infarct and penumbra volumes from CTP+ were compared with commercially available RAPID and Sphere, along with CTP+’s predecessor, Vitrea.
Methods
Patient inclusion
Institutional review board approval was obtained and informed consent was waived for this Health Insurance and Accountability retrospective study. This study included AIS patients who underwent initial non-contrast computed tomography (CT) to rule out hemorrhage, baseline CTP imaging upon comprehensive stroke center arrival, and DWI 24 h following CTP imaging. One hundred and ninety-one consecutive patients between March 2019 and January 2020 met the inclusion criteria and were allocated into endovascular intervention and conservative treatment cohorts. Intervention patients (n = 81) were included for the assessment of infarct, were required to have emergent large vessel occlusion, and have undergone successful reperfusion (thrombolysis in cerebral infarction (TICI) 2b/2c/3) through mechanical thrombectomy. Patients who achieve recanalization of TICI 1 or 2a were not included since it is unclear what combination of infarct and penumbra would correspond to infarct on follow-up DWI as it is expected that some penumbra would be salvaged. Therefore, an estimation would need to be made of how much penumbra converts to infarct for each of these recanalization scores. Additionally, TICI 0 patients were not included due to a small sample size and conservative treatment patients were used as an alternative. TICI scores were measured as a consensus by an attending physician and two endovascular fellows not involved in data collection. Conservative treatment patients (n = 110) were included for the assessment of penumbra, included large and small vessel occlusion patients, and did not receive mechanical thrombectomy or intravenous thrombolysis. Since reperfusion techniques were not utilized for conservative treatment patients, it was assumed all CTP imaging penumbra converted to infarct on follow-up DWI allowing for penumbra assessment.15
CTP analysis
CTP data were collected as a series of 19 volumes using the Neuro ONE protocol. Volumes containing 320 slices, with a slice thickness of 0.5 mm, and an in-plane resolution of 0.42 mm were obtained using 512 row by 512 column detector Aquilion ONE CT units (Canon Medical Systems Corporation, Otawara, Japan). During the scan, Omnipaque 350 was injected at a volume of 50 ml and a rate of 5 ml/s. Scan parameters (mean ± 95% confidence interval) included a tube voltage of 80 kV peak, tube current of 150 mA, CT dose index 34.3 ± 4.4 mGy, and dose length product 346.5 ± 103.6 mGy·cm. Scan acquisition started 7 s after contrast administration, duration time was 49.3 s, and reconstructed CTP volumes were available within 5 min from the start of scan for post-processing.
Automated analysis was conducted for segmentation of infarct and penumbra using RAPID, Sphere, and CTP+. Vitrea ischemic tissue segmentation was conducted using Vital Images’ recommended workflow of manually segmenting the top, middle, and bottom of the ischemic region and interpolating within the region of interest following automated segmentation. Manual segmentation was conducted by an operator with 2.5 years of experience of examining CTP scans. Recommended Vitrea workflow was compared with CTP+ to observe potential improvements in clinical workflow and tissue segmentation for Vital Images’ automated CTP+ software.
During CTP processing, RAPID, Sphere, Vitrea, and CTP+ resample the input CTP volumes to have slice thicknesses of 10 mm, 5 mm, 2 mm, and 2 mm, respectively, to reduce noise. Selection of the AIF and VOF were conducted automatically by each software. Raw contrast intensity data from the selected AIFs and VOFs were exported from both CTP+ and Vitrea for later comparison. iSchemaView conducted RAPID analysis offsite and segmented tissue with CBF < 30% relative to the contralateral hemisphere as infarct and tissue with time to reach maximum residue function (Tmax) >6 s as penumbra. Sphere (SP20-3.0) segmented tissue with CBF < 25% and time-to-peak (TTP) >5 s relative to the contralateral hemisphere as infarct and tissue with TTP>5 s compared with the contralateral side as penumbra. Vitrea (7.10) segmented infarct as tissue with either CBV < 38% and TTP >5.3 s or mean-transit-time (MTT) < 55% relative to the contralateral hemisphere and tissue with CBV >38% and either TTP >5.3 s or CBF < 58% relative to the contralateral hemisphere as penumbra. CTP+ segmented infarct as CBV < 40% and Tmax >2.2 s relative to the contralateral hemisphere and penumbra as Tmax >2.2 s compared with the contralateral side. CTP+ includes improvements from Vitrea by offering: a fully automated solution, improved AIF and VOF auto-selection, improved ventricle segmentation (Figure 1), improved summary map delineation, and use of the Tmax parameter instead of TTP to segment penumbra. Figure 2 compares infarct segmentation for a conservative treatment patient using all four tested CTP software products with DWI.
Figure 1.

The improved ventricle segmentation (purple) of computed tomography perfusion plus (CTP+) (right) compared with Vitrea (left). Notice in Vitrea, segmented ventricles would sometimes appear as infarct (red) and the entire ventricle would not be completely segmented as compared with CTP+.
Figure 2.

Diffusion-weighted imaging (DWI) and computed tomography perfusion (CTP) software images corresponding to a conservative treatment patient with a left middle cerebral artery occlusion. Hyper-intensified regions in the DWI correspond to infarct while pink and green regions correspond to infarct and penumbra, respectively, in the RAPID perfusion map. For CTP+, Sphere, and Vitrea, red and yellow regions correspond to infarct and penumbra, respectively. Note the strong agreement of ischemic tissue location between all CTP predictions and final DWI infarct.
DWI analysis
Collection of DWI data was conducted using IsoDWI protocol with a Vantage Titan 1.5 Tesla MRI unit (Canon Medical Systems Corporation, Otawara, Japan). IsoDWI protocol utilizes a repetition time of 8700 ms, an echo time of 100 ms, a diffusion b-value of 1000 s/mm2, a slice thickness of 5 mm, and an in-plane resolution of 0.81 mm. Infarct was segmented from DWIs as regions with a 162% increase in intensity compared with the contralateral hemisphere, similar to a previously conducted method.16
Statistical analysis
Frequency distributions for categorical variables and summary statistical for continuous variables were tabulated for analyzed data. Raw data from AIFs and VOFs were analyzed by determining the number of curves which were simply noise and the number that had the improper bell curve shape. A curve was considered to be noise if all or all but one of the intensity values were less than 33% of the mean of maximum values from all AIFs or VOFs in the study. AIFs and VOFs were considered to have the incorrect shape if there were multiple peak intensities above 50% of the maximum intensity of the curve. Area under the curve (AUC) values were additionally calculated for each AIF and VOF curve from Vitrea and CTP+ along with AIF scalars, which are the VOF AUC divided by the AIF AUC.
Mean differences between DWI FIVs and predicted CTP infarct volumes were calculated for each software product for intervention and conservative treatment patients. Predicted infarct for conservative treatment patients was determined as a summation of infarct and penumbra on baseline CTP imaging. Analysis of variance (ANOVA) and Student t-test analysis were conducted on mean infarct differences comparing tested CTP software. Distributions of infarct differences for each CTP software product were included as mountain plots. Median absolute deviations (MADs) were calculated between final and predicted infarct volumes for each software. The percentage of patients with infarct overestimation was calculated for each category. Subgroup analysis was conducted determining all of the aforementioned metrics based on reperfusion status in the intervention category. Spearman correlation coefficients (SCCs) were determined between DWI FIVs and predicted infarct volume and regression analysis was conducted along with Bland–Altman plot generation. Inter-reader variability was conducted across five Vitrea users to assess recommended Vitrea workflow infarct segmentation through mean infarct difference and MAD calculations. Processing times to determine ischemic tissue were determined for all software. RAPID processing time was defined as time from completion of CTP scan until RAPID perfusion maps were uploaded to the hospital’s picture achieving and communications system. Sphere and CTP+ processing times were defined as time from loading CTP volumes into each software until perfusion maps were generated. Vitrea processing time was defined as time from loading CTP volumes into Vitrea until recommended workflow segmentation was completed.
Results
FIVs, predicted infarct volumes, and patient demographics for all patients are represented in Table 1, along with the intervention and conservative treatment cohorts. Similar metrics are detailed in Table 2 based on intervention reperfusion status. A significant difference (p < 0.05) is seen between the two cohorts for the age, NIHSS, and time from onset of symptoms to perfusion imaging characteristics. Intravenous thrombolysis was administered at a median of 115.0 min (interquartile range, 85.0–180.0 min) following symptom onset to 33/81 (40.7%) intervention patients.
Table 1.
Characteristics and outcomes of ischemic stroke patients.
| Characteristic | AllN = 191 | Endovascular interventionn = 81 | Conservative treatmentn = 110 |
|---|---|---|---|
| Male sex, % | 46.6% (89/191) | 51.9% (42/81) | 42.7% (47/110) |
| Age, years, meanstandard deviation, [median] (IQR) | 68.514.5 [68.0] (60.0–79.0) | 66.016.2 [65.0] (57.0–79.0) | 70.412.8 [70.0] (63.3–80.0) |
| NIHSS score, meanstandard deviation, [median] (IQR) | 11.77.6 [10.0] (6.0–16.0) | 14.37.5 [13.0] (9.0–20.0) | 9.87.2 [7.0] (5.0–14.8) |
| Site of occlusion | |||
| Middle cerebral artery | 70.2% (134/191) | 74.1% (60/81) | 67.3% (74/110) |
| Anterior cerebral artery | 1.6% (3/191) | 0.0% (0/81) | 2.7% (3/110) |
| Posterior cerebral artery | 14.1% (27/191) | 4.9% (4/81) | 20.9% (23/110) |
| Internal carotid artery | 10.5% (20/191) | 14.8% (12/81) | 7.3% (8/110) |
| Basilar | 3.7% (7/191) | 6.2% (5/81) | 1.8% (2/110) |
| Time from onset of stroke to perfusion imaging, minutes, meanstandard deviation, [median] (IQR) | 968.8373.5 [318.0] (122.5–877.5) | 598.11235.6 [186.0] (85.0–552.0) | 1241.83261.9 [567.0] (172.3–1027.5) |
| Time from onset of stroke to reperfusion, minutes, meanstandard deviation, [median] (IQR) | – | 728.41276.3 [266.0] (161.0–717.0) | – |
| Time from perfusion imaging to recanalization, minutes, meanstandard deviation, [median] (IQR) | – | 130.3376.4 [64.0] (55.0–83.0) | – |
| CTP+ infarct volume, mL, meanstandard deviation, [median] (IQR) | 28.757.6 [7.3] (2.4–30.0) | 26.057.9 [7.6] (1.8–23.2) | 30.757.6 [6.7] (2.6–34.2) |
| RAPID infarct volume, mL, meanstandard deviation, [median] (IQR) | 37.072.5 [6.0] (0.0–39.5) | 21.841.6 [4.0] (0.0–30.0) | 48.387.1 [10.0] (0.0–54.3) |
| Sphere infarct volume, mL, meanstandard deviation, [median] (IQR) | 40.155.2 [22.7] (7.5–44.1) | 28.842.8 [14.9] (5.1–33.1) | 48.361.7 [23.8] (10.0–58.6) |
| Vitrea infarct volume, mL, meanstandard deviation, [median] (IQR) | 22.850.1 [5.2] (1.3–19.8) | 24.652.0 [7.1] (1.4–19.5) | 21.448.8 [4.5] (1.1–19.7) |
| Post-treatment reperfusion | |||
| TICI 2b | – | 37.0% (30/81) | – |
| TICI 2c | – | 27.2% (22/81) | – |
| TICI 3 | – | 35.8% (29/81) | – |
| Final DWI MRI infarct volume, mL, meanstandard deviation, [median] (IQR) | 26.652.1 [7.9] (1.6–27.0) | 31.852.8 [18.3] (4.5–41.2) | 22.751.5 [5.1] (0.7–16.5) |
Empty cells correspond to non-applicable data based on category or combination of categories.
IQR: interquartile range; NIHSS: National Institute of Health Stroke Scale; CTP+: computed tomography perfusion plus; TICI: thrombolysis in cerebral infarction, DWI: diffusion-weighted imaging; MRI: magnetic resonance imaging.
Table 2.
Characteristics and outcomes of ischemic stroke patients based on reperfusion status.
| Characteristic | TICI 2b n = 30 |
TICI 2c n = 22 |
TICI 3 n = 29 |
|---|---|---|---|
| Male sex, % | 60.0% (18/30) | 54.5% (12/22) | 41.4% (12/29) |
| Age, years, meanstandard deviation, [median] (IQR) | 66.315.0 [65.0] (58.3–76.3) |
70.114.0 [73.0] (61.0–80.5) |
62.518.6 [65.0] (52.0–73.0) |
| NIHSS score, meanstandard deviation, [median] (IQR) | 14.06.7 [14.0] (9.3–19.0) |
14.37.7 [12.0] (8.3–19.5) |
14.68.3 [14.0] (10.0–20.0) |
| Site of occlusion | |||
| Middle cerebral artery | 90.0% (27/30) | 77.3% (17/22) | 55.2% (16/29) |
| Posterior cerebral artery | 0.0% (0/30) | 0.0% (0/22) | 13.8% (4/29) |
| Internal carotid artery | 10.0% (3/30) | 22.7% (5/22) | 13.8% (4/29) |
| Basilar | 0.0% (0/30) | 0.0% (0/22) | 17.2% (5/29) |
| Time from onset of stroke to perfusion imaging, minutes, meanstandard deviation, [median] (IQR) | 344.5359.7 [183.0] (86.8–499.5) |
756.31871.8 [147.0] (80.0–462.0) |
740.41221.0 [278.0] (104.0–647.0) |
| Time from onset of stroke to reperfusion, minutes, meanstandard deviation, [median] (IQR) | 410.6361.7 [243.0] (150.5–559.8) |
858.01866.2 [248.5] (143.5–634.5) |
958.9.41315.4 [397.0] (232.0–975.0) |
| Time from perfusion imaging to recanalization, minutes, meanstandard deviation, [median] (IQR) | 66.024.9 [61.5] (53.5–71.8) |
101.7108.4 [63.5] (58.0–82.3) |
218.5618.2 [69.0] (48.0–99.0) |
| CTP+ infarct volume, mL, meanstandard deviation, [median] (IQR) | 32.881.2 [7.5] (2.7–25.3) |
24.830.1 [13.0] (6.7–34.4) |
19.916.4 [6.3] (1.0–17.7) |
| RAPID infarct volume, mL, meanstandard deviation, [median] (IQR) | 26.247.5.5 [12.0] (0.0–36.0) |
27.239.0 [6.5] (0.0–42.3) |
13.136.7 [0.0] (0.0–14.0) |
| Sphere infarct volume, mL, meanstandard deviation, [median] (IQR) | 32.250.5 [22.3] (6.8–40.7) |
32.438.0 [16.9] (5.3–34.8) |
22.638.1 [10.1] (4.4–29.9) |
| Vitrea infarct volume, mL, meanstandard deviation, [median] (IQR) | 31.869.3 [8.4] (3.1–29.8) |
23.436.3 [12.2] (3.2–21.9) |
18.140.8 [2.4] (1.3–16.9) |
| Final DWI MRI infarct volume, mL, meanstandard deviation, [median] (IQR) | 37.368.6 [25.5] (5.8–37.4) |
31.130.9 [24.3] (6.9–43.3) |
26.848.1 [14.2] (3.3–27.4) |
IQR: interquartile range; NIHSS: National Institute of Health Stroke Scale; CTP+: computed tomography perfusion plus; TICI: thrombolysis in cerebral infarction; DWI: diffusion-weighted imaging; MRI: magnetic resonance imaging.
AIF and VOF analysis
Table 3 compares the number of AIFs and VOFs from Vitrea and CTP+ that were determined to be noisy curves or have the improper bell curve shape. Additionally, Table 3 indicates the median AUC values for the AIFs and VOFs included in this study along with the median AIF scalars for CTP+ and Vitrea. Figure 3 indicates the AIF selection location for what was a noisy curve in Vitrea but has improved based on the selection location in CTP+. The AIF from Vitrea in Figure 3 is considered noisy because it has one high spike in contrast intensity and the rest of the intensities are background noise. Figure 4 indicates the VOF selection locations for what was a noisy curve in Vitrea and is now a smoother, bell shaped curve in CTP+. Figures 5 and 6 indicate the AIF and VOF selection locations, respectively, within CTP+ and Vitrea with CTP+ having more properly shaped curves without multiple contrast intensity peaks.
Table 3.
Comparison of AIFs and VOFs between CTP+ and Vitrea perfusion software.
| Vitrea | CTP+ | |
|---|---|---|
| AIF of noise, % | 3.14% (6/191) | 2.09% (4/191) |
| VOF of noise, % | 6.81% (13/191) | 2.09% (4/191) |
| Improper AIF shape, % | 4.19% (8/191) | 3.66% (7/191) |
| Improper VOF shape, % | 1.57% (3/191) | 0.52% (1/191) |
| AIF AUC, dHUs, median (IQR) |
8170 (6860–10300) | 8620 (7190–10400) |
| VOF AUC, dHUs, median (IQR) |
8240 (6430–9880) | 9680 (8000–11200) |
| AIF scalar, median (IQR) | 0.95 (0.85–1.08) | 1.12 (1.03–1.23) |
AIF: arterial input function; VOF: venous output function; CTP+: computed tomography perfusion plus; AUC: area under the curve; dHU: derived Hounsfield unit; IQR: interquartile range.
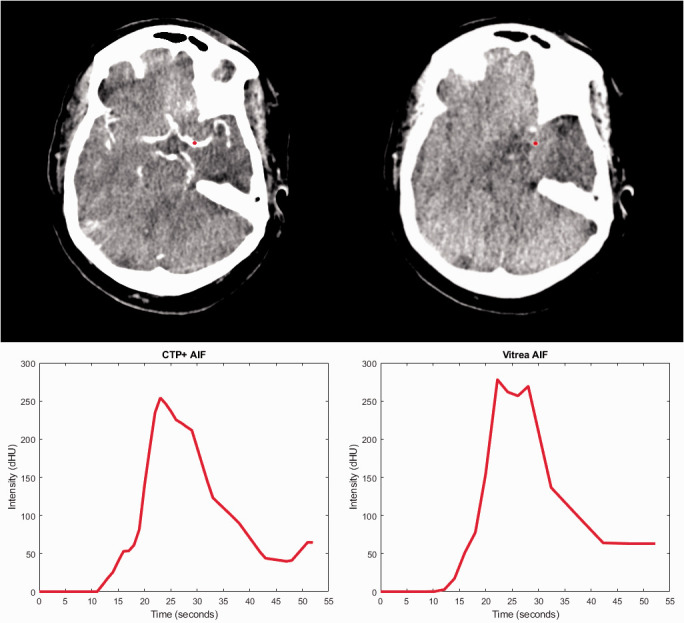
Figure 3.

A comparison of the arterial input function (AIF) selection locations (red dot) for computed tomography perfusion plus (CTP+) (upper left) and Vitrea (upper right) along with the corresponding AIF intensity curves for each software. Note that the selected location within CTP+ is on a main artery while the Vitrea location is in a significantly anterior location. This leads to the noisy generated AIF (bottom right) which contains one spike in contrast intensity.
Figure 4.

Venous output function (VOF) curves and selection locations (blue dot) for computed tomography perfusion plus (CTP+) (left) and Vitrea (right). Note the location of the VOF selection in CTP+ is along the sagittal sinus vein while selection in Vitrea is erroneously placed in a region containing no vein. This erroneous selection leads to the noisy curve indicated in the lower right.
Figure 5.
A comparison of the arterial input function (AIF) shapes when using the AIF selection (red dot) from computed tomography perfusion plus (CTP+) (top left) and Vitrea (top right). The CTP+ AIF location is slightly inferior, leading to it being located on top of a feeding artery. This location leads to the curve having a smoother shape (bottom left) instead of multiple contrast peaks as seen in the Vitrea AIF (bottom right).
Figure 6.

The venous output function (VOF) selection locations (blue dot) for computed tomography perfusion plus (CTP+) (top left) and Vitrea (top right) along with the corresponding VOF curve for each software. When using Vitrea, the intensity values of the VOF decrease, likely due to partial volume effect from surrounding tissue, and there are multiple intensity peaks compared with CTP+. Multiple peaks and a drop in intensity from partial volume effects will hinder the calculation of perfusion parameters using Vitrea.
Infarct volume analysis
Table 4 indicates mean differences, MADs, and SCCs between DWI FIVs and CTP predicted infarct for each software along with percentage of patients who had infarct overestimated for the intervention and conservative treatment category. Table 4 also includes penumbra-to-infarct ratios for each CTP software for the intervention cohort. Table 5 includes similar metrics for intervention cohort subgroup analysis based on reperfusion status. No significant difference (p > 0.05) was seen between mean infarct differences for the four CTP softwares in the intervention cohort based on ANOVA analysis. Student-t test analysis indicated no difference between the CTP+ and Vitrea mean infarct differences (p = 0.72). Within the conservative treatment category, significant difference was evident (p < 0.05) between all CTP software for mean infarct differences based on ANOVA analysis. A p = 0.007 indicates similar results between CTP+ and Vitrea infarct differences for the conservative treatment cohort. Ninety-five percent confidence intervals for each CTP software processing times are: CTP+ = 192.6 ± 3.4 s, RAPID = 831.0 ± 34.1 s, Sphere = 146.1 ± 1.1 s, and Vitrea = 242.5 ± 3.8 s. ANOVA (p < 0.05) indicates significant differences between the processing times of the software.
Table 4.
Mean differences (with 95% confidence intervals), MADs, SCCs, and percentage of patients with infarct overestimation for calculated infarct between each CTP software and DWI.
| Intervention patients | ||||||||
|---|---|---|---|---|---|---|---|---|
|
Mean difference, mL |
MAD, mL |
SCC |
Patients with infarct overestimation |
Penumbra-to-infarct ratio |
||||
| CTP+ | 5.8 ± 5.9 | 7.6 | 0.62 | 35.8% (29/81) | 13.1 ± 9.5 | |||
| RAPID | 10.0 ± 5.2 | 6.9 | 0.73 | 21.0% (17/81) | 45.8 ± 15.7 | |||
| Sphere | 3.0 ± 6.0 | 8.1 | 0.56 | 58.0% (47/81) | 10.3 ± 6.5 | |||
| Vitrea | 7.2 ± 4.9 | 7.0 | 0.66 | 29.6% (24/81) | 9.2 ± 7.1 | |||
|
Conservative treatment patients | ||||||||
|
Mean difference, mL |
MAD, mL |
SCC |
Patients with infarct overestimation |
|||||
| CTP+ | –8.0 ± 5.4 | 5.1 | 0.64 | 67.3% (74/110) | ||||
| RAPID | –25.6 ± 11.5 | 7.2 | 0.60 | 55.5% (61/110) | ||||
| Sphere | –25.6 ± 8.0 | 12.5 | 0.66 | 90.1% (100/110) | ||||
| Vitrea | 1.3 ± 4.0 | 3.3 | 0.72 | 51.8% (57/110) | ||||
MAD: median absolute deviation; SCC: Spearman correlation coefficient; CTP: computed tomography perfusion; DWI: diffusion-weighted imaging; CTP+: computed tomography perfusion plus.
Table 5.
Mean differences (with 95% confidence intervals), MADs, SCCs, and percentage of patients with infarct overestimation for calculated infarct between each CTP software and DWI based on reperfusion status.
| Mean difference, mL | MAD, mL | SCC | Patients with infarct overestimation | Penumbra-to-infarct ratio | |
|---|---|---|---|---|---|
| TICI 3 | |||||
| CTP+ | 6.9 ± 6.9 | 5.2 | 0.69 | 31.0% (9/29) | 25.6 ± 26.7 |
| RAPID | –8.4 ± 10.8 | 8.6 | 0.75 | 3.4% (1/29) | 47.1 ± 22.0 |
| Sphere | 10.5 ± 5.0 | 9.2 | 0.57 | 48.3% (14/29) | 5.3 ± 1.7 |
| Vitrea | 2.9 ± 10.7 | 5.6 | 0.76 | 27.6% (8/29) | 5.4 ± 4.4 |
| TICI 2c | |||||
| CTP+ | 6.3 ± 9.2 | 6.4 | 0.43 | 45.5% (10/22) | 5.5 ± 4.2 |
| RAPID | 3.9 ± 9.9 | 10.4 | 0.65 | 36.4% (8/22) | 66.6 ± 48.0 |
| Sphere | –1.3 ± 10.3 | 16.0 | 0.45 | 68.2% (15/22) | 7.5 ± 4.8 |
| Vitrea | 7.7 ± 9.1 | 11.3 | 0.46 | 40.9% (9/22) | 17.3 ± 25.3 |
| TICI 2b | |||||
| CTP+ | 4.5 ± 13.8 | 10.3 | 0.74 | 33.3% (10/30) | 6.5 ± 2.8 |
| RAPID | 11.1 ± 10.6 | 6.1 | 0.80 | 26.7% (8/30) | 29.3 ± 14.6 |
| Sphere | 5.1 ± 13.1 | 4.8 | 0.60 | 60.0% (18/30) | 17.1 ± 17.6 |
| Vitrea | 5.5 ± 10.5 | 7.2 | 0.74 | 23.3% (7/30) | 6.8 ± 6.6 |
MAD: median absolute deviation; SCC: Spearman correlation coefficient; CTP: computed tomography perfusion; DWI: diffusion-weighted imaging; TICI: thrombolysis in cerebral infarction; CTP+: computed tomography perfusion plus.
Figure 7 represents mountain plots showing the distribution of infarct differences for each CTP software with DWI for the intervention cohort. Dashed horizontal lines and vertical solid lines indicate 90th percentile of volume differences and ideal median volume difference of 0 ml, respectively. Figure 8 represents mountain plots for the conservative treatment cohort showing distributions of mean infarct differences between CTP software and DWI. Figure 9 shows scatter plots with regression analysis and SCCs for intervention patients comparing CTP software predicted infarct with DWI infarct. Figure 10 shows similar analysis for the conservative treatment cohort. Figures 11 and 12 represent Bland–Altman plots comparing DWI FIVs and CTP predicted infarct volumes for the intervention and conservative treatment cohorts respectively. Dashed lines represent limits of agreement and solid lines represent mean infarct differences.
Figure 7.

The distribution of mean infarct differences between diffusion-weighted imaging (DWI) with (a) computed tomography perfusion plus (CTP+), (b) RAPID, (c) Sphere, and (d) Vitrea for endovascular intervention patients. Mountain peaks indicate the median infarct difference. Dashed lines represent the 90th percentile of volume differences with more narrow distributions centered around 0 ml being ideal.
Figure 8.

The distribution of mean infarct differences for conservative treatment patients between final diffusion-weighted imaging (DWI) infarct with predicted (a) computed tomography perfusion plus (CTP+), (b) RAPID, (c) Sphere, and (d) Vitrea infarct. Dashed lines represent the 90th percentile of volume differences. Note the extended tail into the negative volume difference region for RAPID and Sphere, indicating overestimation of penumbra.
Figure 9.

The correlation between final diffusion-weighed imaging (DWI) infarct with predicted (a) computed tomography perfusion plus (CTP+), (b) RAPID, (c) Sphere, and (d) Vitrea infarct for endovascular intervention patients. Spearman correlation coefficients (SCCs) and linear regression equations are represented in each plot.
Figure 10.

The correlation for conservative treatment patients between final diffusion-weighted imaging (DWI) infarct with predicted infarct volumes for (a) computed tomography perfusion plus (CTP+), (b) RAPID, (c) Sphere, and (d) Vitrea software. Spearman correlation coefficients (SCCs) and linear regression equations are represented in each plot.
Figure 11.

Bland–Altman plots for intervention patients with the x-axes demonstrating the mean infarct volume between each computed tomography perfusion (CTP) predicted infarct and final diffusion-weighted imaging (DWI) infarct. The y-axes demonstrate differences between final DWI and predicted infarct for each CTP software. Solid lines represent the mean infarct difference and dashed lines represent limits of agreement (1.96·standard deviation).
Figure 12.

Bland–Altman plots for conservative treatment patients with the x-axes demonstrating mean infarct volume between final diffusion-weighted imaging (DWI) infarct and each computed tomography perfusion (CTP) predicted infarct. The y-axes demonstrate differences between final DWI and predicted infarct for each CTP software. Solid lines represent the mean infarct difference and dashed lines represent limits of agreement (1.96·standard deviation).
Inter-reader variability analysis
Inter-reader variability analysis of segmented infarct between five Vitrea users indicated a mean infarct difference of 3.6 ml and MAD of 2.7 ml. ANOVA analysis demonstrated no significant difference (p = 0.97) between user segmented infarct.
Discussion
This study provided an assessment of the newly developed CTP+ software in assessing infarct and penumbra segmentation compared with DWI FIVs. Additionally, CTP+ was compared with ischemic tissue segmentation from commercially available RAPID and Sphere software along with Vitrea software to investigate improvements made from CTP+’s predecessor. Precise segmentation of penumbra and infarct by these software products is essential in determining endovascular intervention eligibility. Although exact perfusion thresholds for determining ischemic tissue are patient specific, software that most closely predicts infarct volumes has resulted in the best clinical outcomes.17 This involves the ability to identify AIS patients least likely to sustain reperfusion injury and who will demonstrate clinical recovery. Since it is preferred that infarct be underestimated to prevent patients from being incorrectly excluded from reperfusion procedures, CTP+ must do the same for clinical consideration.
Previous studies have indicated that accurate AIF selection is essential in accurately quantifying CTP parameters such as CBF, CBV, and MTT. This indicates that infarct quantification can be drastically affected if the AIF is not placed properly, especially if it is place distal to the clot on the ipsilateral side.18 Furthermore, penumbral flow has also been known to be affected by the placement of the AIF.19 Within the CTP+ software, improved selection of the AIF occurs by placing the AIF in the internal carotid artery or M1 segment of the middle cerebral artery using hemodynamic constraints.18 The improved selection for CTP+ compared with Vitrea can be seen with slight improvements in the number of non-noisy AIFs and VOFs along with an increase in the number of properly shaped curves. Within Figure 4, it can be seen that within Vitrea there were instances in which the VOF section was nowhere near a draining vein, which leads to a VOF with no computational value. This erroneously selected VOF greatly hinders the calculation of perfusion parameters since the AIF can no longer be normalized properly. Instead of scaling the AIF up in intensity, a noisy VOF will lead to a downscaling of the AIF, which results in an AIF even further from the true intensity values.9
Furthermore, the AUC values for both the AIFs and VOFs are larger when using CTP+ compared with Vitrea. This likely indicates that a larger portion of the voxels selected for the input function contain a feeding artery or draining vein in CTP+ compared with Vitrea. Since a larger portion of the selection voxels contain this artery or vein, there is less partial volume effect from surrounding tissue, which would cause a decrease in the contrast intensity, further leading to a lower AUC value. The VOF selection location for Vitrea in Figure 6 reinforces that a lower AUC value is likely due to partial volume effect since the selection location is significantly higher in the draining vein compared with CTP+ and at this high a location, the vein will have significantly decreased in size. This partial volume effect in the VOF is of great importance as it results in a lower median AIF scaling factor for Vitrea than CTP+. In fact, a median AIF scaling factor of less than 1 for Vitrea indicates the AUC of the VOF is typically less than that of the AUC of the AIF. This is counterintuitive since the draining vein is typically larger in size than the feeding artery, leading to a higher degree of contrast flow, based on partial volume effects, which is why the VOF is used to normalize the AIF. An incorrect scaling of the AIF can further lead to incorrect parameter estimation, and in the event of downscaling of the AIF, overestimation of the CBF and CBV parameters.9
Intervention patient infarct volume analysis indicates CTP+ performs similarly with commercially available RAPID and Sphere software. Additionally, the fully automated CTP+ performed similarly to its semi-automated predecessor software, Vitrea, with CTP+ having a lower mean infarct difference with DWI FIVs. Although RAPID software provided the least number of patients with infarct overestimation, which is preferred so that patients are not incorrectly excluded from reperfusion procedures, CTP+ provided fewer overestimations than Sphere and a similar number to semi-automated Vitrea.11 The improved ventricle segmentation likely aided in similar overestimations of infarct between Vitrea and CTP+ since without segmentation, erroneous infarcts would appear in the ventricles, as seen in Figure 1. Subgroup analysis based on reperfusion status indicate a similar trend between CTP+ and the current available software along with consistency in the mean infarct difference between DWI and CTP+ for all reperfusion statuses. Furthermore, Figure 7 indicates CTP+ to have near identical infarct difference distribution compared with the other investigated software at the 90th percentile. This similar distribution, along with the peak of the mountain plot (50% percentile) residing near 0 ml, indicates that the results from CTP+ are just as accurate and reproducible as from RAPID, Sphere, and Vitrea.
Conservative treatment patient results show a consistent overestimation of FIVs for commercially available RAPID and Sphere, similar to previous studies.7,8,20 CTP+ additionally shows an overestimation of FIV for this patient group but by less than one-third of the magnitude seen by commercially available software. Figure 3 aids in indicating that overestimation of penumbra is the reason for FIVs being overestimated in conservative treatment patients. Since the mountain plots were fairly symmetrical for RAPID and Sphere in the intervention cohort, but there is an extended negative volume tail in these respective plots for conservative treatment patients, one can determine that infarct volume assessments are correct while penumbra assessments are inaccurate. Compared with RAPID and Sphere, CTP+ has much less penumbra overestimation, as indicated by the narrow mean difference distribution from DWI. Although the semi-automated Vitrea software still has the most accurate assessment of penumbra, CTP+ does provide a similar mean difference distribution and on a fully automated platform, which aids in diagnosis workflow. Processing times indicate that CTP+ can save clinicians approximately 1 min compared with manually segmenting the ischemic lesion in Vitrea. Additionally, CTP+ being available onsite allows for a more rapid assessment of the perfusion scans compared with RAPID, where transfer speeds to send the scans offsite can significantly hinder workflow.
Although the assumption that all penumbra converts to infarct allows for assessment of penumbra in conservative treatment patients, it should be noted that there is no independent way to accurately assess penumbra volumes. Alternative CTP software cannot be utilized as a penumbra validation method since it is based solely on contralateral hemisphere thresholds and not patient specific hemodynamics and characteristics. Since penumbra is incorrectly functioning neurological tissue, but is segmented on CTP using hemodynamics, patient tissue with naturally low flow velocities in one hemisphere can appear as penumbra even if the tissue is functioning correctly.10,21 Furthermore, DWI will not represent all penumbra as infarct in cases of spontaneous recanalization which occurs from vessel flow conditions dislodging the blood clot and restoring blood flow. Since the latter has only been shown to occur in 5% to 30% of cases, it was utilized in this study but still could have impacted the results.22–24 However, any impact from spontaneous recanalization would have occurred in all software since the same patients were used, eliminating any potential bias.
Further limitations of the study include the potential for DWI lesion reversal in the event of rapid reperfusion.25 This indicates that some of the DWI lesion may represent penumbra, which could lead to an overestimation of infarct for some of the intervention cases. Additionally, infarct growth will occur between initial image and either reperfusion or follow-up imaging, meaning predicted CTP volumes cannot perfectly represent DWI FIVs. Inclusion of only 21 patients with lesion volumes over 50 ml limits the study since the CTP+ software is not being extensively tested on a large infarct volume dataset. The comparison of CTP+ with only two commercially available software products along with its predecessor, Vitrea, is another limitation as there are other commercially available software products such as syngo.via (Siemens Healthcare, Erlangen, Germany and IntelliSpace Portal (Philips Corporation, Amsterdam, Noord Holland, Netherlands). Furthermore, AIFs and VOFs were compared only between CTP+ and Vitrea and not with Sphere or RAPID as raw data for their respective curves were not available. Additionally, spatial accuracy of infarct and penumbra was not assessed and should be considered for future studies. Last, validation cases from an outside institution were not included to assess CTP+ software.
Conclusions
Fully automated CTP+ software performed similarly to commercially available RAPID and Sphere CTP software in addition to its semi-automated predecessor software, Vitrea, when assessing infarct volumes for intervention patients. For conservative treatment patients, CTP+ outperformed both RAPID and Sphere in assessing penumbra volumes. Semi-automated Vitrea software remains the most accurate in assessing penumbra, but CTP+ provides an improved workflow from its predecessor.
Footnotes
Conflict of interest: The author(s) declared the following potential conflicts of interest with respect to the research, authorship, and/or publication of this article: Kenneth V Snyder is consulting for: Canon Medical Systems Corporation, Penumbra Inc., Medtronic, Jacobs Institute; and is a co-founder of Neurovascular Diagnostics, Inc. Max Mokin is a consultant for: Canon Medical Systems, Cerebrotech, Imperative care; and has NIH grant support (R21NS109575). Adnan H Siddiqui has financial interest/investor/stock options/ownership in: Amnis Therapeutics, Apama Medical, Blink TBI Inc., Buffalo Technology Partners Inc., Cardinal Consultants, Cerebrotech Medical Systems, Inc. Cognition Medical, Endostream Medical Ltd., Imperative Care, International Medical Distribution Partners, Neurovascular Diagnostics Inc., Q’Apel Medical Inc, Rebound Therapeutics Corp., Rist Neurovascular Inc., Serenity Medical Inc., Silk Road Medical, StimMed, Synchron, Three Rivers Medical Inc., Viseon Spine Inc.; is a consultant/advisory board for: Amnis Therapeutics, Boston Scientific, Canon Medical Systems USA Inc., Cerebrotech Medical Systems Inc., Cerenovus, Corindus Inc., Endostream Medical Ltd, Guidepoint Global Consulting, Imperative Care, Integra LifeSciences Corp., Medtronic, MicroVention, Northwest University–DSMB Chair for HEAT Trial, Penumbra, Q’Apel Medical Inc., Rapid Medical, Rebound Therapeutics Corp., Serenity Medical Inc., Silk Road Medical, StimMed, Stryker, Three Rivers Medical, Inc., VasSol, W.L. Gore & Associates; and is a principal investigator/steering comment of the following trials: Cerenovus NAPA and ARISE II; Medtronic SWIFT PRIME and SWIFT DIRECT; MicroVention FRED & CONFIDENCE; MUSC POSITIVE; Penumbra 3D Separator, COMPASS, INVEST. Yiemeng Hoi is an employee of Canon Medical Systems USA, Inc. Jason M. Davies has received research grants from the National Center for Advancing Translational Sciences of the National Institutes of Health under award number KL2TR001413 to the University at Buffalo and is a shareholder of RIST Neurovascular. Elad I Levy owns stock in: NeXtGen Biologics, RAPID Medical, Claret Medical, Cognition Medical, Imperative Care (formerly the Stroke Project), Rebound Therapeutics, StimMed, Three Rivers Medical; a national principal investigator/steering committees for: Medtronic (merged with Covidien Neurovascular) SWIFT Prime and SWIFT Direct Trials; a consultant for: Claret Medical, GLG Consulting, Guidepoint Global, Imperative Care, Medtronic, Rebound, StimMed; on the advisory board for: Stryker (AIS Clinical Advisory Board), NeXtGen Biologics, MEDX, Cognition Medical, Endostream Medical; and is a site principal investigator for: CONFIDENCE study (MicroVention), STRATIS Study—Sub I (Medtronic). Ciprian N Ionita has received an equipment grant from Canon Medical Systems and from the Cummings Foundation.
Ethical approval: All procedures performed in studies involving human participants were in accordance with the ethical standards of the institutional and/or national research committee (University at Buffalo Institutional Review Board, IRB ID: MOD00005807) and with the 1964 Helsinki declaration and its later amendments or comparable ethical standards.
Funding: The author(s) disclosed receipt of the following financial support for the research, authorship, and/or publication of this article: This study was partially funded by Canon Medical Systems USA, Inc.
Informed consent: Informed consent was waived through Institutional Review Board approval.
ORCID iDs: Ryan A Rava https://orcid.org/0000-0001-6456-8445
Ciprian N Ionita https://orcid.org/0000-0001-7049-0592
References
- 1.Albers GW, Thijs VN, Wechsler L, et al. Magnetic resonance imaging profiles predict clinical response to early reperfusion: The diffusion and perfusion imaging evaluation for understanding stroke evolution (DEFUSE) study. Ann Neurol 2006; 60: 508–517. [DOI] [PubMed] [Google Scholar]
- 2.Bivard A, Kleinig T, Miteff F, et al. Ischemic core thresholds change with time to reperfusion: A case control study. Ann Neurol 2017; 82: 995–1003. [DOI] [PMC free article] [PubMed] [Google Scholar]
- 3.Agarwal S, Scoffings DJ, Jones PS, et al. Interaction of age with the ischaemic penumbra, leptomeningeal collateral circulation and haemodynamic variables in acute stroke: A pilot study. J Neurol Neurosurg Psychiatry 2013; 84: 271–276. [DOI] [PubMed] [Google Scholar]
- 4.Garcia-Esperon C, Spratt NJ, Gangadharan S, et al. Computed tomography perfusion identifies patients with stroke with impaired cardiac function. Stroke 2020; 51: 498–503. [DOI] [PubMed]
- 5.Albers GW, Marks MP, Kemp S, et al. Thrombectomy for stroke at 6 to 16 hours with selection by perfusion imaging. N Engl J Med 2018; 378: 708–718. [DOI] [PMC free article] [PubMed] [Google Scholar]
- 6.Albers GW, Goyal M, Jahan R, et al. Ischemic core and hypoperfusion volumes predict infarct size in SWIFT PRIME. Ann Neurol 2016; 79: 76–89. [DOI] [PubMed] [Google Scholar]
- 7.Rava R, Snyder K, Mokin M, et al. Assessment of a Bayesian Vitrea CT perfusion analysis to predict final infarct and penumbra volumes in patients with acute ischemic stroke: A comparison with RAPID. Am J Neuroradiol 2020; 41: 206–212. [DOI] [PMC free article] [PubMed]
- 8.Rava R, Snyder KV, Mokin M, et al. Assessment of computed tomography perfusion software in predicting spatial location and volume of infarct in acute ischemic stroke patients: A comparison of Sphere, Vitrea, and RAPID. J Neurointerv Surg. Epub ahead of print on 26 May 2020, DOI: 10.1136/neurintsurg-2020-015966. [DOI] [PubMed]
- 9.Bammer R. MR and CT perfusion and pharmacokinetic imaging: Clinical applications and theoretical principles. Philadelphia, PA: Lippincott Williams & Wilkins, 2016. [Google Scholar]
- 10.Miles K, Eastwood JD, Konig M. Multidetector computed tomography in cerebrovascular disease: CT perfusion imaging. United Kingdom: CRC Press, 2007. [Google Scholar]
- 11.Mokin M, Levy EI, Saver JL, et al. Predictive value of RAPID assessed perfusion thresholds on final infarct volume in SWIFT PRIME (Solitaire With the Intention for Thrombectomy as Primary Endovascular Treatment). Stroke 2017; 48: 932–938. [DOI] [PubMed] [Google Scholar]
- 12.Hoving JW, Marquering HA, Majoie CB, et al. Volumetric and spatial accuracy of computed tomography perfusion estimated ischemic core volume in patients with acute ischemic stroke. Stroke 2018; 49: 2368–2375. [DOI] [PubMed] [Google Scholar]
- 13.Yushkevich PA, Piven J, Hazlett HC, et al. User-guided 3D active contour segmentation of anatomical structures: Significantly improved efficiency and reliability. Neuroimage 2006; 31: 1116–1128. [DOI] [PubMed] [Google Scholar]
- 14.Albers GW, Lansberg MG, Kemp S, et al. A multicenter randomized controlled trial of endovascular therapy following imaging evaluation for ischemic stroke (DEFUSE 3). Int J Stroke 2017; 12: 896–905. [DOI] [PMC free article] [PubMed] [Google Scholar]
- 15.Chavez JC, Hurko O, Barone FC, et al. Pharmacologic interventions for stroke: Looking beyond the thrombolysis time window into the penumbra with biomarkers, not a stopwatch. Stroke 2009; 40: 558–563. [DOI] [PubMed] [Google Scholar]
- 16.Madai VI, Galinovic I, Grittner U, et al. DWI intensity values predict FLAIR lesions in acute ischemic stroke. PLoS One 2014; 9: e92295. [DOI] [PMC free article] [PubMed] [Google Scholar]
- 17.Gasparotti R, Grassi M, Mardighian D, et al. Perfusion CT in patients with acute ischemic stroke treated with intra-arterial thrombolysis: Predictive value of infarct core size on clinical outcome. Am J Neuroradiol 2009; 30: 722–727. [DOI] [PMC free article] [PubMed] [Google Scholar]
- 18.Ferreira RM, Lev MH, Goldmakher GV, et al. Arterial input function placement for accurate CT perfusion map construction in acute stroke. Am J Roentgenol 2010; 194: 1330–1336. [DOI] [PMC free article] [PubMed] [Google Scholar]
- 19.Zaro-Weber O, Moeller-Hartmann W, Heiss W-D, et al. Influence of the arterial input function on absolute and relative perfusion-weighted imaging penumbral flow detection: A validation with 15O-water positron emission tomography. Stroke 2012; 43: 378–385. [DOI] [PubMed] [Google Scholar]
- 20.Rava R, Snyder K, Mokin M, et al. Effect of computed tomography perfusion post-processing algorithms on optimal threshold selection for final infarct volume prediction. Neuroradiol J 2020; 33: 273–285. [DOI] [PMC free article] [PubMed] [Google Scholar]
- 21.Leigh R, Knutsson L, Zhou J, et al. Imaging the physiological evolution of the ischemic penumbra in acute ischemic stroke. J Cereb Blood Flow Metab 2018; 38: 1500–1516. [DOI] [PMC free article] [PubMed] [Google Scholar]
- 22.Shah QA. Spontaneous recanalization after complete occlusion of the common carotid artery with subsequent embolic ischemic stroke. J Vasc Interv Neurol 2009; 2: 147. [PMC free article] [PubMed] [Google Scholar]
- 23.Paciaroni M, Caso V, Venti M, et al. Outcome in patients with stroke associated with internal carotid artery occlusion. Cerebrovasc Dis 2005; 20: 108–113. [DOI] [PubMed] [Google Scholar]
- 24.Meves S, Muhs A, Federlein J, et al. Recanalization of acute symptomatic occlusions of the internal carotid artery. J Neurol 2002; 249: 188–192. [DOI] [PubMed] [Google Scholar]
- 25.Inoue M, Mlynash M, Christensen S, et al. Early DWI reversal following endovascular reperfusion is typically transient in patients imaged 3–6 hours after onset. Stroke 2014; 45: 1024. [DOI] [PMC free article] [PubMed] [Google Scholar]