Abstract
Background
Obesity and sarcopenia are associated with mortality in chronic obstructive pulmonary disease (COPD). Routine chest CT examinations may allow assessment of obesity and sarcopenia by soft-tissue markers for predicting risks of mortality.
Purpose
To investigate associations between soft-tissue markers subcutaneous adipose tissue (SAT), intermuscular adipose tissue (IMAT), and pectoralis muscle (PM) index from chest CT with mortality in participants with COPD.
Materials and Methods
In this secondary analysis of a prospectively enrolled cohort from the Multi-Ethnic Study of Atherosclerosis, participants with available chest CT in 2010–2012 were included. CT examinations were analyzed to determine SAT, IMAT (within PM), and PM areas. The spirometry evaluations were used to establish COPD diagnosis. Mortality data were extracted from the National Death Index (April 2010 to December 2017). The correlations of the soft-tissue markers with fat mass index were studied. The associations of these markers and risks of mortality in participants with COPD were assessed by using Cox proportional-hazard models adjusted for confounders.
Results
Among 2994 participants who were included (mean age, 69 years ± 9 [standard deviation]; 1551 women), 265 had COPD (9%; mean age, 72 years ± 9; 162 men) and 49 participants with COPD (18%) died during follow-up. The SAT, IMAT, and PM areas had moderate-to-excellent reliabilities (intraclass correlation coefficient, 0.88–0.99). In the 2994 participants, the SAT (ρ = 0.80; 95% CI: 0.78, 0.81; P < .001) and IMAT indexes (ρ = 0.37; 95% CI: 0.34, 0.41; P < .001) were correlated with fat mass index. Those with COPD and higher SAT index had lower risks of mortality (hazard ratio, 0.2; 95% CI: 0.1, 0.4; P < .001, per doubling), whereas a higher IMAT index was associated with a higher risk of mortality (hazard ratio, 1.4; 95% CI: 1.0, 1.9; P = .04, per doubling).
Conclusion
Soft-tissue markers were reliably obtained by using chest CT performed for lung assessment. In participants with chronic obstructive pulmonary disease, a high intermuscular adipose tissue index was associated with a higher risk of mortality than was a high subcutaneous adipose tissue index.
© RSNA, 2021
Online supplemental material is available for this article.
See also the editorial by Sverzellati and Cademartiri in this issue.
Summary
Assessment of soft-tissue composition in participants with chronic obstructive pulmonary disease extended the predictive value of chest CT examinations beyond their primary clinical indications for pulmonary assessment.
Key Results
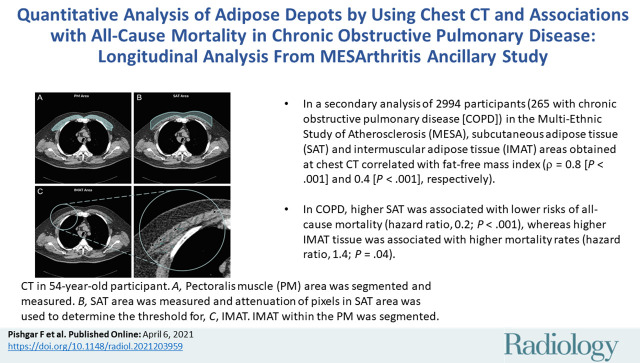
■ In a secondary analysis of 2994 participants (265 with chronic obstructive pulmonary disease [COPD]) in the Multi-Ethnic Study of Atherosclerosis, subcutaneous and intermuscular adipose tissue areas obtained at chest CT correlated with fat-free mass index (ρ = 0.8 [P < .001] and 0.4 [P < .001], respectively).
■ In COPD, higher subcutaneous adipose tissue was associated with lower risks of all-cause mortality (hazard ratio, 0.2; P < .001) whereas higher intermuscular adipose tissue was associated with higher mortality rates (hazard ratio, 1.4; P = .04).
Introduction
Excessive adipose depots and sarcopenia are associated with poor prognosis and mortality in several chronic conditions including chronic obstructive pulmonary disease (COPD) (1,2). Obesity is associated with lower mortality in patients with COPD, referred to as the obesity paradox (3). Sarcopenia is the clinical syndrome of diminished muscle mass and strength and has an estimated prevalence of 22% in patients with COPD (2,4). In contradistinction to obesity, sarcopenia is associated with higher risks of mortality in COPD and impaired functional status (4,5).
CT is the reference standard for the quantitative study of adipose depots (including the subcutaneous adipose tissue [SAT] and intermuscular adipose tissue [IMAT]). Moreover, the clinical diagnosis of sarcopenia requires fulfillment of two criteria: diminished muscle strength and declined muscle quantity (6). CT is the modality of choice in the assessment of muscle quantity (primarily for research purposes) (6). Studies have used available CT examinations performed for other purposes to explore the cross-sectional areas of adipose depots and muscles captured in the field of view as surrogate markers of excessive adipose depots and muscle mass (7,8). In clinical settings, routine chest CT is performed in patients with COPD to help characterize COPD phenotypes, screen for lung cancer, or plan for surgical options (9). The availability of these examinations may allow assessment of the distribution of adipose depots (ie, cross-sectional SAT and IMAT areas) and sarcopenia (ie, cross-sectional pectoralis muscle [PM] area) for predicting the clinical outcomes (7,8).
MESArthritis is an ancillary study to the Multi-Ethnic Study of Atherosclerosis (MESA) (10,11), to investigate the roles of imaging-derived soft-tissue and bone markers for predicting outcomes relevant to cardiopulmonary diseases. By using data of this ancillary study, our analysis is conducted to quantify soft-tissue markers from chest CT and to assess the associations between these imaging-derived markers with all-cause mortality in patients with COPD.
Materials and Methods
The prospective MESA is approved and recognized to be compliant with the Health Insurance Portability and Accountability Act by the institutional review boards of the six participating field centers (Columbia University, Johns Hopkins University, Northwestern University, University of California, University of Minnesota, and Wake Forest University) and the coordinating center (University of Washington) in the United States (registered at http://www.ClinicalTrials.gov; identifier, NCT00005487). All participants provided written informed consent.
MESArthritis Ancillary Study
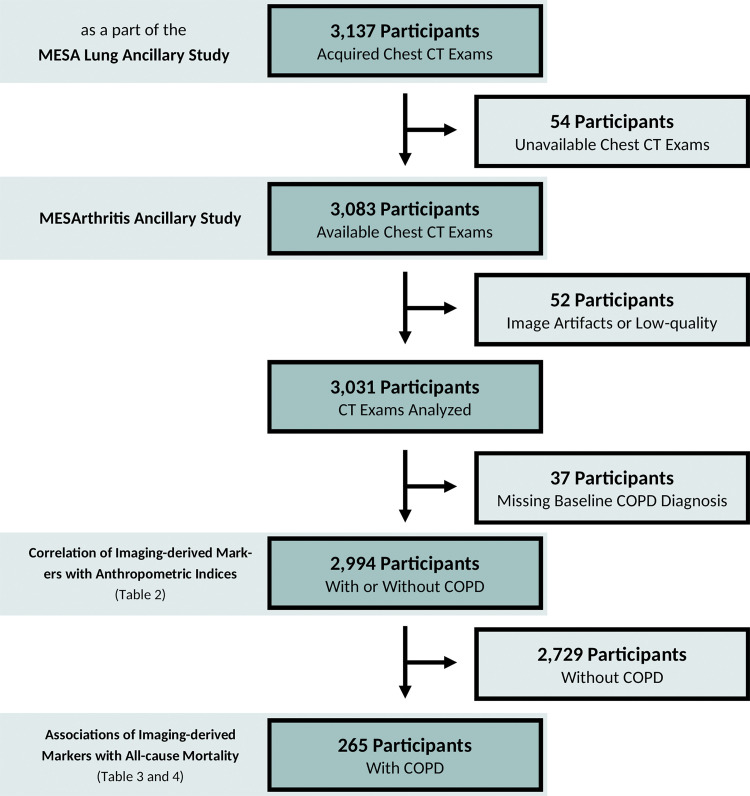
The MESA is an ongoing study of 6814 women and men without clinical cardiovascular diseases at the time of enrollment (https://www.mesa-nhlbi.org/) (10,11). In the fifth examination of the study (April 2010 and January 2012, the baseline of the MESArthritis ancillary study), 3137 participants consented to undergo noncontrast chest CT as a part of the MESA Lung ancillary study (Fig 1) (12). The MESArthritis ancillary study is a secondary analysis of the prospectively collected images and data of 3083 participants of this sample (with available chest CT examinations). Before this analysis, participants with low-quality CT, breast implants, or artificial cardiac pacemakers that interfere with further quantitative analyses of soft-tissue markers were excluded (Fig 2).
Figure 1:
Timeline of the MESArthritis ancillary study. MESA = Multi-Ethnic Study of Atherosclerosis, NDI = National Death Index.
Figure 2:
Flow diagram of the MESArthritis ancillary study. COPD = chronic obstructive pulmonary disease, MESA = Multi-Ethnic Study of Atherosclerosis.
Clinical Examinations, Spirometry, and All-Cause Mortality Data
Demographic, anthropometric, and clinical characteristics of participants were collected at baseline (Fig 1). Data regarding age, sex, race and/or ethnicity, body mass index, baseline pulse oximetry, smoking status, pack-years of cigarette smoking, and employment status of participants within the MESArthritis ancillary study were extracted from the MESA database.
In addition, fat mass index and fat-free mass index were calculated by using the height and weight at baseline as fat mass index = (fat mass in kilograms)/(height squared in meters squared) and fat-free mass index = (fat-free mass in kilograms)/(height squared in meters squared); whereas fat-free mass of men = 5.1 × height1.14 × weight0.41, fat-free mass of women = 5.34 × height1.47 × weight0.33, and fat mass = weight − fat-free mass (13).
Moreover, spirometry was also performed at baseline to assess the pulmonary function by using the American Thoracic Society and European Respiratory Society guidelines on a dry-rolling-sealed spirometer with automated quality checks (Occupational Marketing) (14). The COPD diagnosis was on the basis of the obstructive pattern in the spirometry results as a forced expiratory volume in 1 second–to–the forced vital capacity postbronchodilator ratio less than 0.70 (15). These data were supplemented with physician-diagnosed COPD from the review of hospital records by using the International Classification of Diseases codes, ninth revision (490., 491.0, 491.1, 491.20, 491.21, 491.22, 491.8, 491.9, 492.0, and 492.8) and 10th revision (J40., J41., J41.0, J41.1, J41.8, J42., J43., J43.0, J43.1, J43.2, J43.8, J43.9, J44., J44.0, J44.1, J44.9, P25., P25.0, P25.1, P25.2, P25.3, and P25.8). Moreover, the COPD Global Initiative for Chronic Obstructive Lung Disease criteria was used to determine the severity of airflow obstruction in patients with COPD as mild (forced expiratory volume in 1 second [percentage of predicted], ≥80%), moderate (79%–50%), severe (49%–30%), and very severe (<30%) COPD.
Participants (or their proxies) in the MESA were contacted by phone at intervals of 9–12 months to inquire about vital status. These data were supplemented by reviewing the National Death Index to assure a complete follow-up for mortality from baseline to December 31, 2017 (primary outcome in this analysis).
CT Protocol
Noncontrast chest CT examinations were performed at six study sites by using four models of the 64-section multi–detector row CT scanner (Somatom Sensation and Somatom Definition, Siemens Medical Solutions; and LightSpeed and Discovery; GE Healthcare). Examinations were performed by following the MESA Lung and Subpopulations and Intermediate Outcomes in COPD Study protocol (voltage, 120 kVp; pitch, 0.984; rotation time, 0.500 seconds; and the effective current setting on the basis of body mass index). Monthly lung phantom measures were used to confirm the scanner calibration. Examinations were reconstructed at 0.625 mm (12,16).
Image Analysis
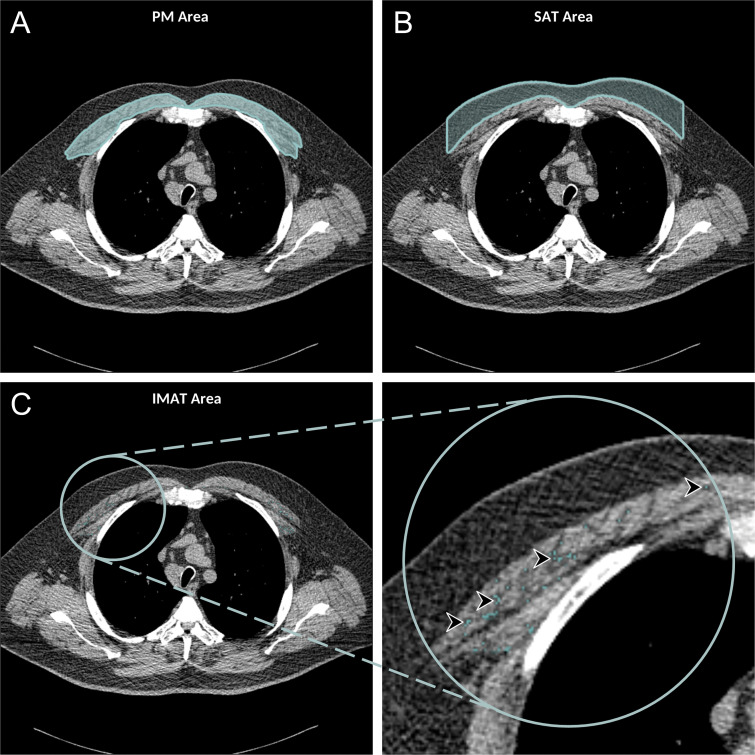
The framework for quantitative analysis of soft-tissue markers in the chest CT examinations, developed as a part of the MESArthritis ancillary study, included several steps to effectively analyze areas and attenuations of the SAT, IMAT, and PM (Figs E1, E2 [online]). Briefly, the axial chest CT examinations were loaded into the ImageJ2 software (version 1.52; National Institutes of Health) and analyzed by using an in-house written macro (17). Images were converted to the 8-bit format and the section above the aortic arch was selected manually by the reader (8). The selected section was binarized by using two predefined global thresholds, 115 and 155 on the 0–255 scale (corresponding to the attenuation range of –50 HU and 90 HU for PM) (8). The areas attributable to the left and right PM (major and minor) were selected manually, and several CT-derived markers (ie, area, mean, standard deviation, and the density of the selected areas) were measured (Fig 3). The SAT area was defined as the area between the PM and the skin surface on the same axial section used to measure PM area and attenuation. The macro automatically selected these areas and similar CT-derived markers were reported for the SAT (Fig 3).
Figure 3:
Axial chest CT examination in a 54-year-old participant. A, On the axial noncontrast chest CT image, the pectoralis muscle (PM) area was segmented and measured in the section above the aortic arch. B, The subcutaneous adipose tissue (SAT) area as the area between the PM and the skin surface on the same section was also measured and the attenuation of pixels in the SAT area was used to determine the individualized threshold for the intermuscular adipose tissue (IMAT). C, The IMAT within the PM was segmented as the areas with Hounsfield units below this threshold for the IMAT (arrowheads).
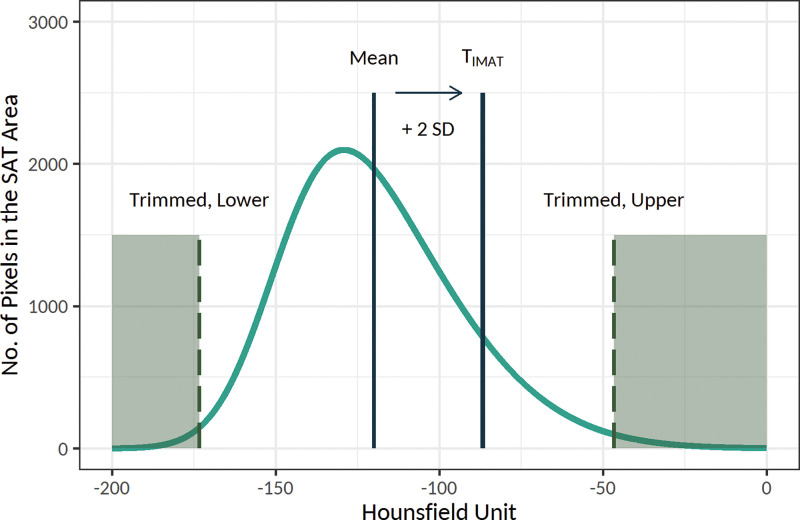
IMAT was defined as the extramyocellular lipids (18). The method suggested by Mühlberg et al (18) was used to estimate an individualized threshold for the IMAT within the PM by using the attenuation of the SAT (Fig 4). The IMAT was defined as the summated areas of pixels within the PM with attenuation below the threshold for the IMAT, and similar CT-derived markers were measured for this tissue. The SAT, IMAT, and PM areas were corrected to account for the anthropometric differences as follows: SAT index = SAT area in centimeters squared/height squared in meters squared, IMAT index = IMAT area in centimeters squared/PM area in centimeters squared, and PM index = PM area in centimeters squared/height squared in meters squared (19).
Figure 4:
Schematic presentation of the threshold for the intramuscular adipose tissue (IMAT), or TIMAT, calculation method. Histogram of the attenuation of the subcutaneous adipose tissue (SAT) area was used to determine the individualized threshold for the IMAT (the figure is schematic and not to scale). In this method, after trimming the lower and upper 30% of values, the threshold for the IMAT was calculated as mean + 2 × standard deviation (SD) of the attenuation of the remaining pixels. The IMAT within pectoralis muscle was defined as the summated areas of pixels with attenuation below the threshold for the IMAT.
Measurements were performed by a single trained reader blinded to the outcomes (F.P., a radiology research fellow with 2 years of experience). The reliability of these markers was evaluated after reassessing 50 randomly selected CT examinations twice by the same reader (after 2 weeks of washout period, intrareader) and a second reader (S.D., a musculoskeletal radiologist with 9 years of experience; interreader) (Table E1 [online]). Moreover, the validity of the markers was evaluated by comparing the measured markers of PM from the framework to the manual measurements of the trained musculoskeletal radiologist (S.D.; Table E2, Fig E3 [online]) with software (OsiriX Lite, version 11.0.3; Pixmeo SARL) for 50 randomly selected CT examinations (20).
Statistical Analysis
Quantitative variables are shown in mean or median, and qualitative variables are shown in number.
The intrareader and interreader reliabilities of soft-tissue markers were assessed by reporting the intraclass correlation coefficient and 95% CI (Table E1 [online]). The validity of markers was evaluated by studying the correlation of the measured area, mean, standard deviation, and the density of PM with the manual measurements, reporting ρ (Spearman correlation coefficient), 95% CI, and P value. Moreover, Bland-Altman analysis was conducted to evaluate the bias (mean difference) between markers and the manual measurements (Table E2, Fig E3 [online]).
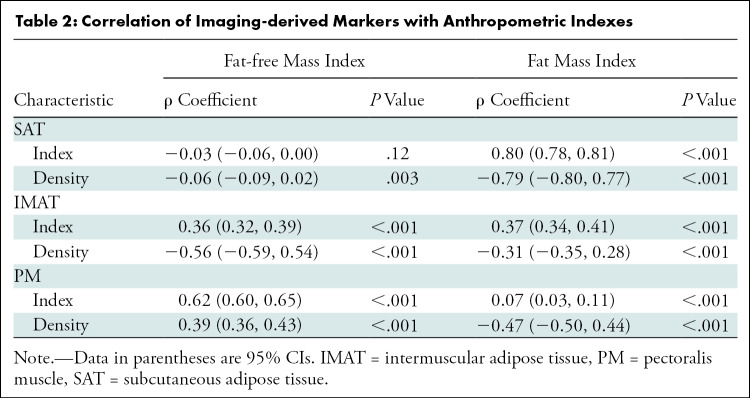
The correlations between SAT, IMAT, and PM indexes and the densities with fat mass and fat-free mass indexes (in participants with and without COPD; n = 2994) were assessed by using correlation studies and by reporting ρ (Spearman correlation coefficient), 95% CI, and P value.
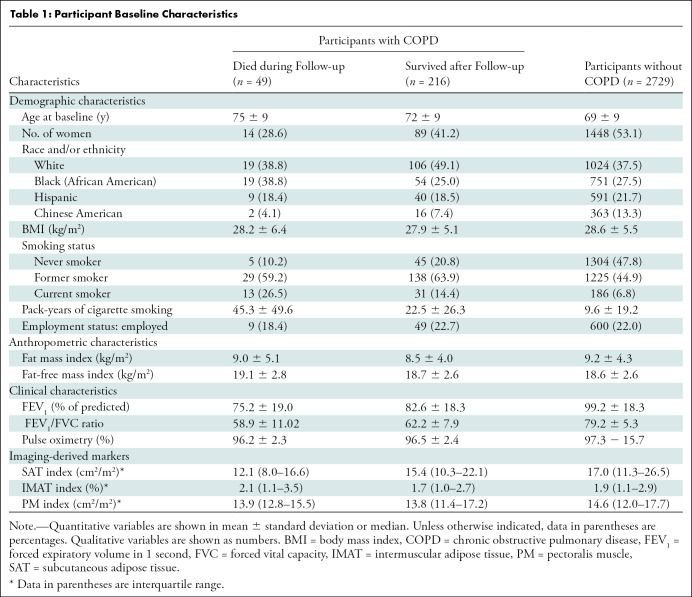
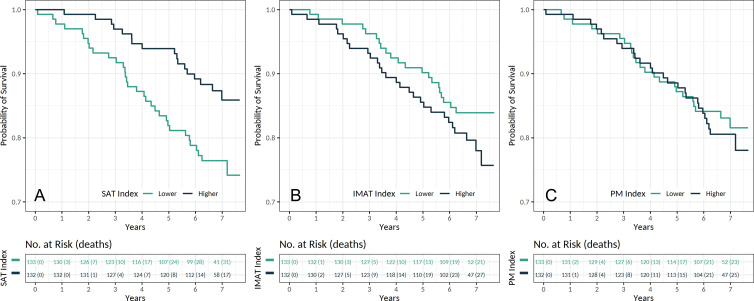
The Kaplan-Meier method was used to visually assess the associations between SAT, IMAT, and PM indexes (indexes were categorized by using medians) with all-cause mortality in participants with COPD (n = 265). Associations between SAT, IMAT, and PM areas and attenuations with all-cause mortality in participants with COPD were studied by using several Cox proportional hazard models (indexes were log2 transformed; Fig E2 [online]). Models were adjusted for potential confounders including age, sex, race and/or ethnicity, body mass index, baseline pulse oximetry, smoking status, pack-years of cigarette smoking, and employment status (Table 1). Moreover, models were separately tested for the proportional hazard assumption by assessing the dependence of the Schoenfeld residuals on time. Hazard ratio, 95% CI, and the P value for the exposure variables are reported. The predictive model fit and model discrimination after including the markers were assessed by calculating the log-likelihood ratio test statistic (log-likelihood ratio tests, 2 × [log-likelihood of the model with marker − log-likelihood of the model without marker]), P value for comparing the log-likelihood of two models by using one-way analysis of variance, and the Harrell C-index of concordance, respectively.
Table 1:
Participant Baseline Characteristics
P values less than .05 were assumed to indicate a statistically significant difference. All analyses were performed by using R (version 3.6.1; R Foundation for Statistical Computing).
Results
Participant Characteristics
Before this analysis, of the 3083 participants in the MESArthritis ancillary study, 52 participants with low-quality CT examinations (n = 26), breast implants (n = 19), or artificial cardiac pacemaker (n = 7) that interfere with further quantitative analyses of the SAT, IMAT, and PM were excluded and 2994 participants were included (Fig 2). The mean age of participants was 69 years ± 9 (standard deviation); 1551 participants (52%) were women, and 1622 participants (54%) were current or former smokers. Among the 2994 participants, 265 participants (9%) (mean age, 72 years ± 9; 162 men) were reported to have COPD at baseline (Fig 2) and between April 2010 to December 2017, 49 (18%) of these participants died (Fig 5). Table 1 shows the demographic and clinical characteristics at baseline.
Figure 5:
Kaplan-Meier estimates for survival in patients with chronic obstructive pulmonary disease according to the, A, subcutaneous adipose tissue (SAT), B, intermuscular adipose tissue (IMAT), and, C, pectoralis muscle (PM) indexes (n = 265). Indexes were categorized by using median values.
Reliability and Validity of the Measurements
The markers were shown to have moderate-to-excellent intrareader and interreader reliabilities (intraclass correlation coefficient, 0.88–0.99; Table E1 [online]). Moreover, the measured PM area (ρ = 0.97; 95% CI: 0.93, 0.99), mean, standard deviation, and density were correlated with manual measurements (Table E2 [online]). Figure E3 (online) shows the Bland-Altman analysis for the PM area, mean, standard deviation, and density.
Associations of SAT, IMAT, and PM Indexes with Anthropometric Indexes and Clinical Characteristics
In 2994 participants, median SAT and IMAT indexes were 16.7 (interquartile range, 11.1–26.1) and 1.9 (interquartile range, 1.1–2.9), respectively. The SAT (ρ = 0.80; 95% CI: 0.78, 0.81; P < .001) and IMAT (ρ = 0.37; 95% CI: 0.34, 0.41; P < .001) indexes correlated with fat mass index. The median PM index was 14.4 (interquartile range, 12.0–17.7) and the PM index (ρ = 0.62; 95% CI: 0.60, 0.65; P < .001) was correlated with fat-free mass index (Table 2).
Table 2:
Correlation of Imaging-derived Markers with Anthropometric Indexes
Distribution of SAT, IMAT, and PM indexes according to the severity of COPD Global Initiative for Chronic Obstructing Lunch Disease grades, forced expiratory volume in 1 second, and forced vital capacity are shown in Figures E4 and E5 (online).
Associations of SAT, IMAT, and PM Indexes with All-Cause Mortality in COPD
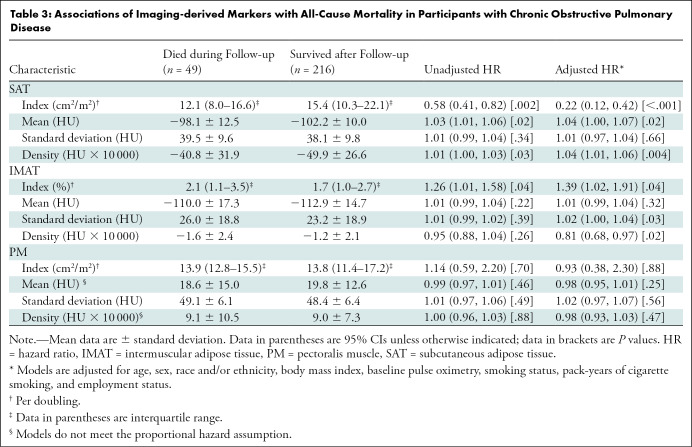
The median SAT index in participants who died during follow-up was 12.0 (interquartile range, 8.0–16.6) and in participants who survived after the follow-up was 15.4 (interquartile range, 10.3–22.1). Participants with higher SAT index had lower risks of mortality (hazard ratio, 0.22; 95% CI: 0.12, 0.42; P < .001, per doubling). The mean (hazard ratio, 1.04; 95% CI: 1.00, 1.07; P = .02) and density (hazard ratio, 1.04; 95% CI: 1.01, 1.06; P = .004) of the SAT were also associated with all-cause mortality in participants with COPD (Table 3).
Table 3:
Associations of Imaging-derived Markers with All-Cause Mortality in Participants with Chronic Obstructive Pulmonary Disease
The median IMAT index in participants who died over the follow-up was 2.1 (interquartile range, 1.1–3.5) and in participants who survived after the follow-up was 1.7 (interquartile range, 1.0–2.7). Our models showed that a higher IMAT index was associated with a higher risk of mortality (hazard ratio, 1.39; 95% CI: 1.02, 1.91; P = .04, per doubling). Standard deviation (hazard ratio, 1.02; 95% CI: 1.00, 1.04; P = .03) and density (hazard ratio, 0.81; 95% CI: 0.68, 0.97; P = .02) of the IMAT were also associated with all-cause mortality in participants with COPD (Table 3).
The PM index in participants who died during follow-up (median, 13.9; interquartile range, 12.8–15.5) was comparable to participants who survived after the follow-up (median, 13.8; interquartile range, 11.4–17.2). Our analysis did not yield any associations between PM index (hazard ratio, 0.93; 95% CI: 0.38, 2.30; P = .88), mean, standard deviation, or density with all-cause mortality in participants with COPD (Table 3).
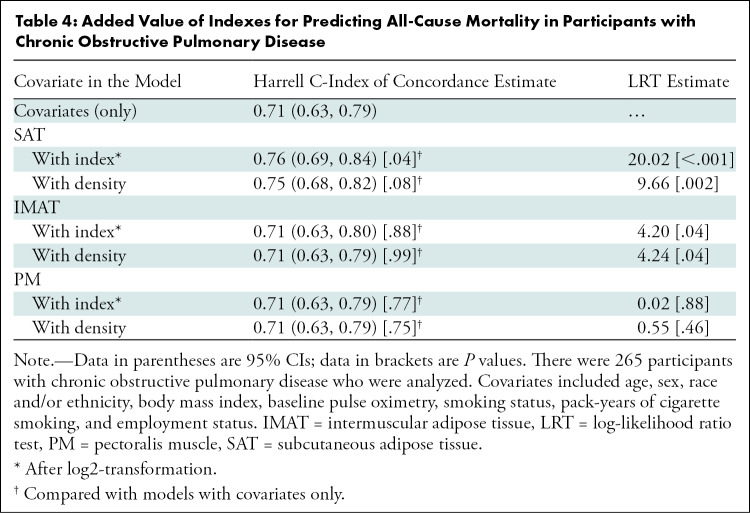
We also assessed the predictive performance of models with and without SAT, IMAT, and PM indexes in addition to known risk factors of mortality in COPD (Table 4). Inclusion of SAT (log-likelihood ratio test, 120.02; P < .001) and IMAT (log-likelihood ratio test, 14.20; P = .04) indexes but not PM (log-likelihood ratio test, 10.02; P = .88), improved the predictive performance of models. The estimated Harrell C-index of concordance for known risk factors of mortality in COPD (C-index, 0.71; 95% CI: 0.63, 0.79) improved after including the SAT index (C-index, 0.76; 95% CI: 0.69, 0.84; P = .04) but not the IMAT (C-index, 0.71; 95% CI: 0.63, 0.80; P = .88) or PM (C-index, 0.71; 95% CI: 0.63, 0.79; P = .77) indexes (Table 4).
Table 4:
Added Value of Indexes for Predicting All-Cause Mortality in Participants with Chronic Obstructive Pulmonary Disease
Discussion
Excessive adipose depots and obesity are associated with lower mortality in patients with chronic obstructive pulmonary disease (COPD), whereas sarcopenia is associated with higher risks of mortality (3–5). Chest CT examinations are routinely performed in patients with COPD (9) and the availability of these examinations may allow assessment of the distribution of adipose depots and sarcopenia for predicting risks of mortality (7,8). In our analysis, we used data from the MESArthritis ancillary study to quantify soft-tissue markers on the distribution of adipose depots and sarcopenia from chest CT examinations and to assess the associations between these markers with mortality in COPD. We showed divergent roles of the subcutaneous adipose tissue (SAT) and intermuscular adipose tissue (IMAT) indexes in predicting the mortality rates in participants with COPD; higher SAT indexes were associated with lower mortality rates (hazard ratio, 0.22; 95% CI: 0.12, 0.42; P < .001) versus the higher IMAT indexes, which were associated with greater risks of mortality (hazard ratio, 1.39; 95% CI: 1.02, 1.91; P = .04). However, the pectoralis muscle (PM) index was not associated with all-cause mortality in participants with COPD.
Obesity and excess adipose depots in the body are predictors of all-cause mortality risks in patients with COPD. Obesity is linked with longer survival rates in several diseases and conditions, known as the obesity paradox (21). However, reports suggest that this association is possibly confounded by other variables, including age, sex, smoking status, and distribution of the adipose depots in the body (3,22). Despite the reported longer survival rates, previous reports showed that the SAT and ectopic adipose depots (such as IMAT and visceral adipose tissues) may have divergent effects on the mortality rates (23–25). Results of our analysis confirmed these divergent roles as higher SAT indexes were associated with lower mortality rates, whereas higher IMAT indexes were associated with greater risks of mortality.
Compared with SAT quantification, IMAT may be a better marker for predicting all-cause mortality in patients with COPD. This hypothesis is strengthened by three observations. First, the accumulation of the IMAT within the muscles happens earlier than losing the muscle volume in the course of the disease and is independently associated with longitudinal lower muscle strengths (26–28). Second, compared with the SAT, the IMAT index is less affected by weight loss or weight gain in the clinical setting, making it a better imaging-derived marker for body composition in these conditions (28). Third, the IMAT index is an indicator of other underlying comorbidities (eg, diabetes and hypertension) (29,30) and may predict the all-cause mortality better.
Sarcopenia is characterized by diminished muscle strength and quantity, which is associated with higher mortality rates in patients with COPD (4,5). Despite the higher accuracy and precision of CT, clinical guidelines have suggested the use of other imaging techniques (eg, dual-energy x-ray absorptiometry and bioelectrical impedance analysis) or anthropometric assessments for evaluating sarcopenia because of the higher levels of radiation in CT (6). But patients with COPD undergo routine chest CT to assess the lung parenchyma (9). These available CT examinations provide an opportunity to quantify adipose tissue and muscles captured in the same field of view as lungs.
Previous reports studied changes in the PM quality in patients with COPD and showed that lower PM area is associated with severe features of the disease (8,31). In a study from the COPDGene, McDonald et al (32) showed that the PM index is an acceptable surrogate marker of the fat-free mass index, and lower PM indexes are associated with higher rates of overall mortality in patients with COPD. But our analysis did not show an association between PM index and mortality, which is probably because of the lower prevalence of sarcopenic muscle changes and the lower severity of COPD cases in our study compared with the COPDGene (forced expiratory volume in 1 second–to–forced vital capacity postbronchodilator ratio of 0.6 ± 0.1 vs 0.5 ± 0.2, respectively). The COPDGene enrolled only patients with a history of more than 10 pack-years of smoking (except the control arm), which led to a higher prevalence of severe COPD and possibly more exaggerated PM area changes compared with our study and the general population (33).
Our study had limitations. First, given the inclusion and exclusion criteria of the MESA and the MESArthritis ancillary study, the sample size and number of events for this analysis were relatively small and limited the power of our analysis. Second, the landmark used for the image analysis (the superior aspect of the aortic arch), as McDonald et al (8) described, was "easily identifiable and could be replicated across a large cohort of subjects" and is widely used in the literature (7,31). However, aortic arch structure changes with aging (ie, it elongates and its curvature widens) (34), and therefore the obtained markers may not be reliable in the oldest-old patients.
In conclusion, we showed the reliability and validity of soft-tissue markers, the subcutaneous adipose tissue, intermuscular adipose tissue, and pectoralis muscle indexes and densities obtained from chest CT examinations usually performed for other clinical indications. These chest CT–derived markers of body composition may have an added predictive value for adverse clinical outcomes such as all-cause mortality in patients with chronic obstructive pulmonary disease (COPD). Although we were able to show the associations between soft-tissue markers and mortality in COPD, future studies with larger sample sizes are required to confirm these findings.
Acknowledgments:
The authors thank Ali Mohammad Pazandeh, MSc, for his technical support and valuable feedback. The authors thank the other investigators, the staff, and the participants of the MESA study for their valuable contributions. A full list of participating MESA investigators and institutions can be found at https://www.MESA-NHLBI.org.
Study supported by the National Heart, Lung, and Blood Institute (75N92020D00001, HHSN268201500003I, N01-HC-95159, 75N92020D00005, N01-HC-95160, 75N92020D00002, N01-HC-95161, 75N92020D00003, N01-HC-95162, 75N92020D00006, N01-HC-95163, 75N92020D00004, N01-HC-95164, 75N92020D00007, N01-HC-95165, N01-HC-95166, N01-HC-95167, N01-HC-95168, N01-HC-95169, R01-HL-077612, and R01-HL-093081) and the National Center for Advancing Translational Sciences (UL1-TR-000040, UL1-TR-001079, and UL1-TR-001420). This publication was developed under a STAR research assistance agreement, no. RD831697 (MESA Air) and RD-83830001 (MESA Air Next Stage), awarded by the U.S. Environmental Protection Agency (EPA). It has not been formally reviewed by the EPA. The views expressed in this document are solely those of the authors and the EPA does not endorse any products or commercial services mentioned in this publication. The information contained herein was derived in part from data provided by the Bureau of Vital Statistics, New York City Department of Health and Mental Hygiene.
Disclosures of Conflicts of Interest: F.P. disclosed no relevant relationships. M.S. disclosed no relevant relationships. T.Q.A.C.S. disclosed no relevant relationships. D.A.B. disclosed no relevant relationships. M.B. disclosed no relevant relationships. R.G.B. Activities related to the present article: disclosed no relevant relationships. Activities not related to the present article: disclosed money to author's institution for grants from NIH and COPD Foundation. Other relationships: disclosed no relevant relationships. M.A.A. disclosed no relevant relationships. W.S.P. disclosed no relevant relationships. J.A.C.L. disclosed no relevant relationships. S.D. disclosed no relevant relationships.
Abbreviations:
- COPD
- chronic obstructive pulmonary disease
- IMAT
- intermuscular adipose tissue
- MESA
- Multi-Ethnic Study of Atherosclerosis
- PM
- pectoralis muscle
- SAT
- subcutaneous adipose tissue
References
- 1.Bradshaw PT, Cespedes Feliciano EM, Prado CM, et al. Adipose Tissue Distribution and Survival Among Women with Nonmetastatic Breast Cancer. Obesity (Silver Spring) 2019;27(6):997–1004. [DOI] [PMC free article] [PubMed] [Google Scholar]
- 2.Kim SH, Shin MJ, Shin YB, Kim KU. Sarcopenia Associated with Chronic Obstructive Pulmonary Disease. J Bone Metab 2019;26(2):65–74. [DOI] [PMC free article] [PubMed] [Google Scholar]
- 3.Wu TD, Ejike CO, Wise RA, McCormack MC, Brigham EP. Investigation of the Obesity Paradox in Chronic Obstructive Pulmonary Disease, According to Smoking Status, in the United States. Am J Epidemiol 2019;188(11):1977–1983. [DOI] [PMC free article] [PubMed] [Google Scholar]
- 4.Benz E, Trajanoska K, Lahousse L, et al. Sarcopenia in COPD: a systematic review and meta-analysis. Eur Respir Rev 2019;28(154):190049. [DOI] [PMC free article] [PubMed] [Google Scholar]
- 5.Jones SE, Maddocks M, Kon SS, et al. Sarcopenia in COPD: prevalence, clinical correlates and response to pulmonary rehabilitation. Thorax 2015;70(3):213–218. [DOI] [PubMed] [Google Scholar]
- 6.Cruz-Jentoft AJ, Baeyens JP, Bauer JM, et al. Sarcopenia: European consensus on definition and diagnosis: Report of the European Working Group on Sarcopenia in Older People. Age Ageing 2010;39(4):412–423. [DOI] [PMC free article] [PubMed] [Google Scholar]
- 7.Diaz AA, Martinez CH, Harmouche R, et al. Pectoralis muscle area and mortality in smokers without airflow obstruction. Respir Res 2018;19(1):62. [DOI] [PMC free article] [PubMed] [Google Scholar]
- 8.McDonald ML, Diaz AA, Ross JC, et al. Quantitative computed tomography measures of pectoralis muscle area and disease severity in chronic obstructive pulmonary disease. A cross-sectional study. Ann Am Thorac Soc 2014;11(3):326–334. [DOI] [PMC free article] [PubMed] [Google Scholar]
- 9.Labaki WW, Martinez CH, Martinez FJ, et al. The Role of Chest Computed Tomography in the Evaluation and Management of the Patient with Chronic Obstructive Pulmonary Disease. Am J Respir Crit Care Med 2017;196(11):1372–1379. [DOI] [PMC free article] [PubMed] [Google Scholar]
- 10.Bild DE, Bluemke DA, Burke GL, et al. Multi-Ethnic Study of Atherosclerosis: objectives and design. Am J Epidemiol 2002;156(9):871–881. [DOI] [PubMed] [Google Scholar]
- 11.Olson JL, Bild DE, Kronmal RA, Burke GL. Legacy of MESA. Glob Heart 2016;11(3):269–274. [DOI] [PMC free article] [PubMed] [Google Scholar]
- 12.Hoffman EA, Ahmed FS, Baumhauer H, et al. Variation in the percent of emphysema-like lung in a healthy, nonsmoking multiethnic sample. The MESA lung study. Ann Am Thorac Soc 2014;11(6):898–907. [DOI] [PMC free article] [PubMed] [Google Scholar]
- 13.Kuch B, Gneiting B, Döring A, et al. Indexation of left ventricular mass in adults with a novel approximation for fat-free mass. J Hypertens 2001;19(1):135–142. [DOI] [PubMed] [Google Scholar]
- 14.Miller MR, Hankinson J, Brusasco V, et al. Standardisation of spirometry. Eur Respir J 2005;26(2):319–338. [DOI] [PubMed] [Google Scholar]
- 15.Celli BR, MacNee W; ATS/ERS Task Force . Standards for the diagnosis and treatment of patients with COPD: a summary of the ATS/ERS position paper. Eur Respir J 2004;23(6):932–946 [Published correction appears in Eur Respir J 2006;27(1):242.]. [DOI] [PubMed] [Google Scholar]
- 16.Couper D, LaVange LM, Han M, et al. Design of the Subpopulations and Intermediate Outcomes in COPD Study (SPIROMICS). Thorax 2014;69(5):491–494. [DOI] [PMC free article] [PubMed] [Google Scholar]
- 17.Rueden CT, Schindelin J, Hiner MC, et al. ImageJ2: ImageJ for the next generation of scientific image data. BMC Bioinformatics 2017;18(1):529. [DOI] [PMC free article] [PubMed] [Google Scholar]
- 18.Mühlberg A, Museyko O, Bousson V, Pottecher P, Laredo JD, Engelke K. Three-dimensional Distribution of Muscle and Adipose Tissue of the Thigh at CT: Association with Acute Hip Fracture. Radiology 2019;290(2):426–434. [DOI] [PubMed] [Google Scholar]
- 19.Teigen LM, John R, Kuchnia AJ, et al. Preoperative Pectoralis Muscle Quantity and Attenuation by Computed Tomography Are Novel and Powerful Predictors of Mortality After Left Ventricular Assist Device Implantation. Circ Heart Fail 2017;10(9):e004069. [DOI] [PubMed] [Google Scholar]
- 20.Rosset A, Spadola L, Ratib O. OsiriX: an open-source software for navigating in multidimensional DICOM images. J Digit Imaging 2004;17(3):205–216. [DOI] [PMC free article] [PubMed] [Google Scholar]
- 21.Spartalis M, Tzatzaki E, Moris D, Athanasiou A, Spartalis E. Morbidity, mortality, and obesity paradox. Ann Transl Med 2017;5(21):440. [DOI] [PMC free article] [PubMed] [Google Scholar]
- 22.Galesanu RG, Bernard S, Marquis K, et al. Obesity in chronic obstructive pulmonary disease: is fatter really better?. Can Respir J 2014;21(5):297–301. [DOI] [PMC free article] [PubMed] [Google Scholar]
- 23.Koster A, Murphy RA, Eiriksdottir G, et al. Fat distribution and mortality: the AGES-Reykjavik Study. Obesity (Silver Spring) 2015;23(4):893–897. [DOI] [PMC free article] [PubMed] [Google Scholar]
- 24.Ponti F, Santoro A, Mercatelli D, et al. Aging and Imaging Assessment of Body Composition: From Fat to Facts. Front Endocrinol (Lausanne) 2020;10:861. [DOI] [PMC free article] [PubMed] [Google Scholar]
- 25.Reinders I, Murphy RA, Brouwer IA, et al. Muscle Quality and Myosteatosis: Novel Associations With Mortality Risk: The Age, Gene/Environment Susceptibility (AGES)-Reykjavik Study. Am J Epidemiol 2016;183(1):53–60. [DOI] [PMC free article] [PubMed] [Google Scholar]
- 26.Lim JP, Chong MS, Tay L, et al. Inter-muscular adipose tissue is associated with adipose tissue inflammation and poorer functional performance in central adiposity. Arch Gerontol Geriatr 2019;81(1):7. [DOI] [PubMed] [Google Scholar]
- 27.Maddocks M, Shrikrishna D, Vitoriano S, et al. Skeletal muscle adiposity is associated with physical activity, exercise capacity and fibre shift in COPD. Eur Respir J 2014;44(5):1188–1198. [DOI] [PMC free article] [PubMed] [Google Scholar]
- 28.Robles PG, Sussman MS, Naraghi A, et al. Intramuscular Fat Infiltration Contributes to Impaired Muscle Function in COPD. Med Sci Sports Exerc 2015;47(7):1334–1341. [DOI] [PubMed] [Google Scholar]
- 29.Sachs S, Zarini S, Kahn DE, et al. Intermuscular adipose tissue directly modulates skeletal muscle insulin sensitivity in humans. Am J Physiol Endocrinol Metab 2019;316(5):E866–E879. [DOI] [PMC free article] [PubMed] [Google Scholar]
- 30.Zhao Q, Zmuda JM, Kuipers AL, et al. Muscle Attenuation Is Associated With Newly Developed Hypertension in Men of African Ancestry. Hypertension 2017;69(5):957–963. [DOI] [PMC free article] [PubMed] [Google Scholar]
- 31.Bak SH, Kwon SO, Han SS, Kim WJ. Computed tomography-derived area and density of pectoralis muscle associated disease severity and longitudinal changes in chronic obstructive pulmonary disease: a case control study. Respir Res 2019;20(1):226. [DOI] [PMC free article] [PubMed] [Google Scholar]
- 32.McDonald MN, Diaz AA, Rutten E, et al. Chest computed tomography-derived low fat-free mass index and mortality in COPD. Eur Respir J 2017;50(6):1701134. [DOI] [PMC free article] [PubMed] [Google Scholar]
- 33.Regan EA, Hokanson JE, Murphy JR, et al. Genetic epidemiology of COPD (COPDGene) study design. COPD 2010;7(1):32–43. [DOI] [PMC free article] [PubMed] [Google Scholar]
- 34.Redheuil A, Yu WC, Mousseaux E, et al. Age-related changes in aortic arch geometry: relationship with proximal aortic function and left ventricular mass and remodeling. J Am Coll Cardiol 2011;58(12):1262–1270. [DOI] [PMC free article] [PubMed] [Google Scholar]


