Abstract
Over the past few decades, pulmonary imaging technologies have advanced from chest radiography and nuclear medicine methods to high-spatial-resolution or low-dose chest CT and MRI. It is currently possible to identify and measure pulmonary pathologic changes before these are obvious even to patients or depicted on conventional morphologic images. Here, key technological advances are described, including multiparametric CT image processing methods, inhaled hyperpolarized and fluorinated gas MRI, and four-dimensional free-breathing CT and MRI methods to measure regional ventilation, perfusion, gas exchange, and biomechanics. The basic anatomic and physiologic underpinnings of these pulmonary functional imaging techniques are explained. In addition, advances in image analysis and computational and artificial intelligence (machine learning) methods pertinent to functional lung imaging are discussed. The clinical applications of pulmonary functional imaging, including both the opportunities and challenges for clinical translation and deployment, will be discussed in part 2 of this review. Given the technical advances in these sophisticated imaging methods and the wealth of information they can provide, it is anticipated that pulmonary functional imaging will be increasingly used in the care of patients with lung disease.
© RSNA, 2021
Summary
This state-of-the-art review (part 1) examined the field of pulmonary functional imaging and focused on technical requirements and physiologic measurements.
Essentials
■ Understanding the relationship between pulmonary structure and function at the alveolar-capillary interface and secondary pulmonary lobule requires imaging tools to interrogate lung disease.
■ The techniques and the functional biomarkers representing pulmonary ventilation, perfusion, gas exchange, and biomechanics were reviewed.
■ Pulmonary imaging analysis tools including computational and artificial intelligence (machine learning) approaches were also highlighted.
Pulmonary physiology is the basis of the intelligent practice of pulmonary medicine. And it always will be.
—John B. West, MD, PhD
Introduction
This review highlights the current state of the art for pulmonary functional imaging and areas of potential future advancement for radiologists, pulmonologists, basic researchers, trainees, and industry personnel. In the preface of his book (1), Dr West pointed out that “respiratory physiology frequently enjoys a surge of activity in time of war” (1). Our review article was written during the coronavirus disease 2019 (COVID-19) pandemic. Some patients with COVID-19 pneumonia have severe dyspnea and hypoxemia early in the course of the disease. It is known that more than 50% of the alveoli in the lung are located in the outer (peripheral) 30% of the radius of the lung (2–4), which overlaps with the area of diffuse peripheral ground-glass opacities on typical CT scans in patients with COVID-19 pneumonia (Fig 1). We will learn more about the pathophysiologic structure of the lungs through this pandemic. Perhaps this is our generation's opportunity to further the science of pulmonary medicine by highlighting the role of functional imaging in the study of this disease.
Figure 1:
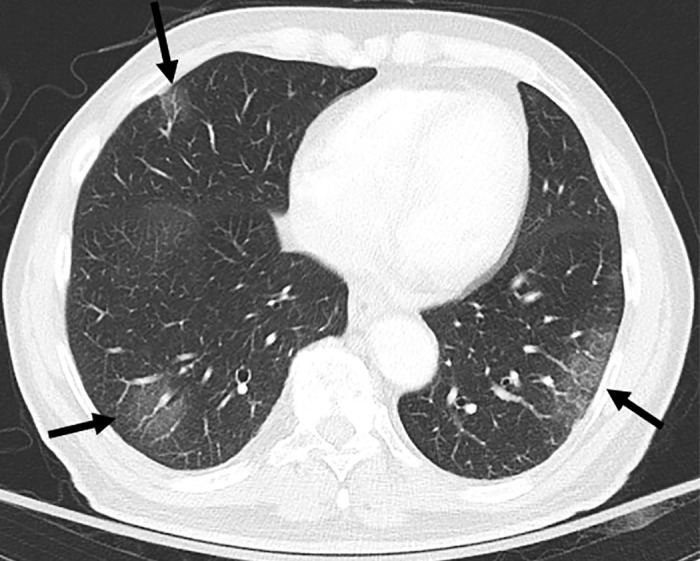
CT scan in lower lung areas in an 83-year-old male patient with coronavirus disease 2019 pneumonia and severe hypoxemia. Bilateral multifocal patchy ground-glass opacities with peripheral distribution are visible (arrows).
The lung is a complex and intriguing organ. The purpose of the lung is simple in concept: to exchange oxygen and carbon dioxide at the alveolar membrane (Fig 2). However, the number of design solutions by evolutionary biology to achieve gas exchange and transport in living organisms belies the unique challenges of maintaining efficiency in varied living environments. The human lung is one of four completely different designs evolutionally developed in vertebrates. These include fish gills, amphibian skin, avian lungs, and mammalian lungs (5). For example, the bird lung works with a cross-current system so that the network of blood capillaries surrounds the ventilatory airflow in the center, a design shared with jet engines. The mammalian lung has evolved during the course of our ancestors, gradually moving from the ocean onto the land.
Figure 2:
Schematic rendering of the functional anatomic unit of gas exchange. The respiratory bronchiole (RespBr) terminating in a group of alveolar sacs (orange) and their associated sac walls (ASW; yellow colored pencil) with pulmonary artery capillaries (red colored pencil) carrying deoxygenated blood to the alveolar walls. Within the alveolar sac plasma carbon dioxide (CO2; orange arrow) undergoes gas exchange and oxygen (O2) diffuses (yellow arrow) into the pulmonary capillary venules to be bound by hemoglobin in the red blood cells. The oxygenated blood then flows into the pulmonary veins (dark blue) back to the left atrium.
Since Dr Röntgen's (6) Nobel Prize–winning demonstration of medical radiographic imaging in 1895, multiple imaging technologies have been developed (eg, digital radiography, US, radioisotopes for use in nuclear medicine, CT, PET, and MRI) (Tables 1–3, E1[online]). The rapid evolution of software computational methods, the miniaturization of hardware onto silicon microprocessors, and random-access memory devices have paved the way for the commercialization of the complex imaging devices now available for the noninvasive multidimensional visualization of the living human body. Exogenous administration and inhalation of contrast materials, gases, isotopes, and pharmacologic imaging agents have further aided the understanding of healthy and diseased human lungs.
Table 1:
Uses of Pulmonary Functional Imaging for Study of Respiratory Diseases
Table 3:
Quantitative Imaging Methods for Lung Perfusion with first Report
In this review we will discuss the basic structural and physiologic underpinnings of pulmonary functional imaging; summarize the techniques and derived functional biomarkers for ventilation, perfusion, gas exchange, and biomechanics; and describe advances in image analysis, computational, and artificial intelligence (ie, machine learning) methods pertinent to functional lung imaging. The applications of pulmonary functional imaging including both the opportunities and challenges for clinical translation and deployment will be discussed in Part 2.
Structural and Physiologic Aspects of Pulmonary Functional Imaging
Alveolar-Capillary Interface and Gas Exchange
What is gas exchange?—Gas exchange in the lung is defined by the diffusion of molecular oxygen into the plasma and red blood cell and the exit of carbon dioxide from the plasma to the alveolar space. The body requires a nearly continuous intake of oxygen to maintain aerobic respiration in the mitochondria. Fortunately, oxygen is the second most common molecule in our atmosphere (21%), although oxygen is not easily soluble in water. For aerobic respiration to occur at atmospheric conditions, a dramatic design change evolved to improve the efficiency of oxygen exchange in the lung. The estimated surface area for gas diffusion of a healthy adult human lung is approximately 50–70 m2 (about the area of a tennis court) (2,3) and it takes approximately 0.25–0.35 seconds for the necessary amount of oxygen to diffuse from atmospheric air into the blood stream through alveolar surfactant, alveolar epithelial, basement membrane, and capillary wall. The volume of the pulmonary capillary bed is approximately 60–75 mL, which is equal to the normal right ventricular stroke volume (2,3). Consider that this volume of blood must spread evenly over an area the size of a tennis court for 0.8 seconds, the pulmonary capillary circulation time in human lungs, to allow sufficient time for gas diffusion before it transits back to the left atrium (2,3). During the capillary circulation time, oxygen diffuses into the plasma, and carbon dioxide diffuses back out into the alveolus, helping to maintain the pH of the blood by decreasing the amount of (soluble) bicarbonate. The theory of “symmorphosis” (7), as proposed by Dr Weibel (8), predicts that the size of a system's parts should match its functional demand, and that it will also have some reserve to prevent it from failing when stressed beyond normal use. How our lungs effortlessly perform this dynamic exchange every second by using a muscular assist from the chest wall and hemidiaphragms is a fundamental mystery of life.
How does gas exchange occur in human lung?—To breathe, the lung has evolved its miraculous three-dimensional alveolar structure (Fig 3). Dr Ochs' research group in Berlin, also inspired by the research of Dr Weibel, painstakingly performed serial two-dimensional scanning electron microscopy of the alveolus to help build models of its three-dimensional structure, now available for everyone to view as a movie (online) (9). On average, the tracheobronchial tree divides 23 times to create 300 million alveoli with average diameter of 200–300 mm and total surface area equivalent to the aforementioned tennis court. Minute ventilation at rest is approximately 6 L/min (3). The passive expansion and compression of the lungs are facilitated by the muscles of the diaphragm and thoracic cage, with neural control via phrenic nerves that are centrally controlled from our brainstem. During lung development, pulmonary arterial growth is driven by endothelial growth factor receptors under the influence of the tracheobronchial tree endoderm's invagination into the mesoderm of the lung. These pulmonary arteries divide along the airway to form the network of capillary vessels, which surround the alveolar walls to distribute blood along the alveolar surface. Cardiac output from the right ventricle is approximately 5 L/min, which coincides with the volume of minute ventilation of 6 L/min (3). The average thickness of the air-blood barrier, which is made up of the alveolar epithelium and its basal lamina, alveolar wall interstitium, basal lamina of the capillary endothelium, the capillary endothelium, plasma, and the membrane of the red blood cells, is only about 1.5 mm (10). The oxygenated blood is driven back to the left atrium by the negative pressure difference between the left atrium and the pulmonary veins. Consequently, any left heart diseases, leading to increases in left atrial (wedge) pressure, have a proportional increase in pulmonary venous and pulmonary arterial pressures to allow blood to continue to flow back to the left heart.
Figure 3a:
Anatomic basis for understanding pulmonary functional physiologic structure. (a) Magnified view of alveolar ducts and alveoli with orifices in a healthy patient. Alveoli are polygonal in shape and have orifices into alveolar ductal spaces. (b) Histologic sample of the healthy lung with hematoxylin-eosin stain. The divergence from terminal to respiratory bronchioles is shown. (c, d) A radiograph of 1-mm-thick specimen demonstrates the secondary lobules. The pulmonary arteries are located in the center, and pulmonary veins are located in the periphery of the secondary pulmonary lobule. The terminal and respiratory bronchioles are observed as tubular structures accompanying the pulmonary arteries. The primary lobules are indicated as yellow dashed circles in d. (Parts a–d adapted, with permission, from reference 10.) (e) Diagram shows anatomy and dimensions of secondary lobule and pulmonary acinus. Two secondary pulmonary lobules in the lung periphery are illustrated, with approximate dimensions of their components indicated. (Reprinted, with permission, from reference 12.)
Figure 3b:
Anatomic basis for understanding pulmonary functional physiologic structure. (a) Magnified view of alveolar ducts and alveoli with orifices in a healthy patient. Alveoli are polygonal in shape and have orifices into alveolar ductal spaces. (b) Histologic sample of the healthy lung with hematoxylin-eosin stain. The divergence from terminal to respiratory bronchioles is shown. (c, d) A radiograph of 1-mm-thick specimen demonstrates the secondary lobules. The pulmonary arteries are located in the center, and pulmonary veins are located in the periphery of the secondary pulmonary lobule. The terminal and respiratory bronchioles are observed as tubular structures accompanying the pulmonary arteries. The primary lobules are indicated as yellow dashed circles in d. (Parts a–d adapted, with permission, from reference 10.) (e) Diagram shows anatomy and dimensions of secondary lobule and pulmonary acinus. Two secondary pulmonary lobules in the lung periphery are illustrated, with approximate dimensions of their components indicated. (Reprinted, with permission, from reference 12.)
Figure 3c:
Anatomic basis for understanding pulmonary functional physiologic structure. (a) Magnified view of alveolar ducts and alveoli with orifices in a healthy patient. Alveoli are polygonal in shape and have orifices into alveolar ductal spaces. (b) Histologic sample of the healthy lung with hematoxylin-eosin stain. The divergence from terminal to respiratory bronchioles is shown. (c, d) A radiograph of 1-mm-thick specimen demonstrates the secondary lobules. The pulmonary arteries are located in the center, and pulmonary veins are located in the periphery of the secondary pulmonary lobule. The terminal and respiratory bronchioles are observed as tubular structures accompanying the pulmonary arteries. The primary lobules are indicated as yellow dashed circles in d. (Parts a–d adapted, with permission, from reference 10.) (e) Diagram shows anatomy and dimensions of secondary lobule and pulmonary acinus. Two secondary pulmonary lobules in the lung periphery are illustrated, with approximate dimensions of their components indicated. (Reprinted, with permission, from reference 12.)
Figure 3d:
Anatomic basis for understanding pulmonary functional physiologic structure. (a) Magnified view of alveolar ducts and alveoli with orifices in a healthy patient. Alveoli are polygonal in shape and have orifices into alveolar ductal spaces. (b) Histologic sample of the healthy lung with hematoxylin-eosin stain. The divergence from terminal to respiratory bronchioles is shown. (c, d) A radiograph of 1-mm-thick specimen demonstrates the secondary lobules. The pulmonary arteries are located in the center, and pulmonary veins are located in the periphery of the secondary pulmonary lobule. The terminal and respiratory bronchioles are observed as tubular structures accompanying the pulmonary arteries. The primary lobules are indicated as yellow dashed circles in d. (Parts a–d adapted, with permission, from reference 10.) (e) Diagram shows anatomy and dimensions of secondary lobule and pulmonary acinus. Two secondary pulmonary lobules in the lung periphery are illustrated, with approximate dimensions of their components indicated. (Reprinted, with permission, from reference 12.)
Figure 3e:
Anatomic basis for understanding pulmonary functional physiologic structure. (a) Magnified view of alveolar ducts and alveoli with orifices in a healthy patient. Alveoli are polygonal in shape and have orifices into alveolar ductal spaces. (b) Histologic sample of the healthy lung with hematoxylin-eosin stain. The divergence from terminal to respiratory bronchioles is shown. (c, d) A radiograph of 1-mm-thick specimen demonstrates the secondary lobules. The pulmonary arteries are located in the center, and pulmonary veins are located in the periphery of the secondary pulmonary lobule. The terminal and respiratory bronchioles are observed as tubular structures accompanying the pulmonary arteries. The primary lobules are indicated as yellow dashed circles in d. (Parts a–d adapted, with permission, from reference 10.) (e) Diagram shows anatomy and dimensions of secondary lobule and pulmonary acinus. Two secondary pulmonary lobules in the lung periphery are illustrated, with approximate dimensions of their components indicated. (Reprinted, with permission, from reference 12.)
Movie:
Still image capture from 4D flow MRI movie file showing the right ventricular outflow track (yellow arrow) and the left ventricular outflow track orange arrow) and the accompanying movie file. (Courtesy of Christopher François, MD, University of Wisconsin–Madison).
Secondary Pulmonary Lobule as a Functional Unit of the Lung
The anatomic structure, tissue morphologic structure, and geometry (of the airways, vessels, and parenchyma) and function of the lungs are necessarily related. Hence, a deep understanding of pulmonary anatomy and microstructure is key to interpretation of the measurements that stem from pulmonary functional imaging (11–13). The secondary pulmonary lobules, measuring 1–2.5 cm in diameter and composed of three to 20 acini or primary lobules (14), are polyhedral in shape and are bounded by the interlobular septa (Fig 3) (14,15). The secondary pulmonary lobule is supplied by a lobular bronchiole and a pulmonary arteriole in the center and drained via pulmonary veins located on the periphery. The pulmonary lymphatics distribute both centrally along the bronchovascular bundle and peripherally within the interlobular septa and subpleural pulmonary tissues, but not within the alveolar region.
It is important for radiologists to think of the secondary pulmonary lobule as the basic macroscopically visible functional unit of the lung when we interpret ventilation and perfusion abnormalities viewed by using various pulmonary imaging methods. It is also important to remember that there will be hypoxemia when there is a mismatch between ventilation and perfusion, and conversely a matched defect will not result in hypoxemia, which is part of the basic grand design of the human lung to maintain or expand gas exchange at stress or increased demand.
A curious feature of COVID-19 lung infection is silent hypoxia. In some of these patients it has been observed that carbon dioxide is driven off faster than normal whereas oxygenation is diminished. These patients are hypoxic but do not have a proportional increase in their respiratory rate. This observation suggests that there is a mismatch between ventilation and perfusion that may be causing intrapulmonary shunting of blood through pulmonary lobules that are compromised by this infection (ie, mismatch between ventilation and perfusion). The exact cause of this hypoxia without an increase in the respiratory rate remains to be more carefully studied.
Regional Distribution of Ventilation and Perfusion
The important role of the gravitational dependence of perfusion and ventilation was first published by West et al (1), who showed that in the upright position the lung bases are more perfused and less well ventilated, whereas the lung apex is less perfused and better ventilated. In the supine position the dorsal (posterior) lung is better perfused and less well ventilated, whereas the anterior lungs are less well perfused and better ventilated. An easy way to think about this is that water follows gravity to that region closest to the ground. Lung per-fusion is gravitationally dependent. We can use this principle to hypothesize that in zero gravity the astronauts of the space station will have an equal distribution of their ventilation and perfusion to all lung segments; the gravitational dependence of pulmonary ventilation and perfusion is “lost in space,” so to speak (16).
Summary of Pulmonary Functional Imaging Methods and Measurements
Pulmonary functional imaging encompasses an array of techniques to view and measure gas distribution, ventilation, perfusion, the exchange of gas across the alveolar gas-tissue barrier, and biomechanical characteristics of the lung (Table 1, Fig 4). As shown in Table E1 (online), in theory there are a number of advantages of pulmonary functional imaging compared with pulmonary function testing measurements that favor pulmonary functional imaging. Unfortunately, in part because of the relative costs and complexity of imaging and despite decades of technical research advances, data showing that pulmonary functional imaging measures improve patient treatments and outcomes have lagged. In this light, different approaches to pulmonary functional imaging are treated systematically in the following sections, with a focus on their quantitative capabilities, clinical potential, and research status.
Figure 4:
Summary schematic for the available pulmonary functional imaging methods. This schematic does not include molecular imaging and its major contributions to lung cancer imaging and treatment response. ADC = apparent diffusion coefficient, ASL = arterial spin labeling, DCE = dynamic contrast enhancement, DECT = dual-energy CT, Exp = expiratory, FD = Fourier decomposition imaging, FDG = fluorodeoxyglucose, HP = hyperpolarized, Insp = inspiratory, NM = nuclear medicine, RBC = red blood cell, VDP = ventilation defect percentage.
Ventilation Imaging
Pulmonary inhaled gas distribution and ventilation can be viewed by using nuclear medicine methods with gaseous radionuclides such as xenon 133 (133Xe), krypton 81 (81Kr), aerosolized technetium 99m (99Tc) diethylenetriamine penta-acetic acid, or 99Tc-labeled carbon nanoparticles (Technegas). The resultant γ emissions of the inhaled gases result in planar (two-dimensional) or three-dimensional tomographic images by using SPECT and PET (with gallium 68 [68Ga]-labeled carbon nanoparticles or Galligas). These may be used alone to measure ventilation or in combination with injected contrast agents to measure perfusion and then to estimate the ratio of ventilation to perfusion.
A number of CT inhaled gas methods may be exploited to provide functional or ventilation information. For example, free-breathing or four-dimensional (4D) CT has been used in lung cancer radiation treatment planning and can be manipulated to generate ventilation maps (17,18). Inhaled krypton (19,20) and Xe dual-energy CT (21–23) have also been pioneered and used as research tools (Fig 5). Another indirect measure of ventilation stems from co-registration of inspiratory and expiratory CT to generate parametric response maps (24). In images on which voxels have normal lung attenuation at inspiration but are abnormal at expiration, parametric response maps are believed to reflect gas trapping and functional small airway disease. In preliminary studies, parametric response maps in patients with chronic obstructive pulmonary disease showed some correlations with inhaled gas hyperpolarized MRI ventilation defects (25).
Figure 5:
Xenon (Xe) ventilation dual-energy CT in patients with, A, B, chronic obstructive pulmonary disease and mild emphysema and with, C, D, moderate to severe emphysema. A, Dual-energy CT image shows minimal centrilobular emphysema in right lower lobe on axial weighted average image and, B, homogeneous Xe enhancement on Xe ventilation map in both lungs. C, Axial weighted average image shows severe emphysema with bronchial wall thickening in both upper lobes. D, On Xe ventilation map, the inhomogeneously decreased Xe enhancement is identified in both upper lobes, whereas Xe ventilation is relatively preserved in the central areas of both upper lobes (arrows).
MRI also provides several free-breathing and static breath-hold methods that can be used to generate maps of gas distribution and ventilation. Early studies that used inhaled hyperpolarized gas MRI (26) showed relatively homogeneous gas signal across healthy tissue, whereas signal voids or ventilation defects were noted in patients with lung disease (27). In lung cancer, large, homogeneous ventilation defects were observed that directly related to tumor burden, whereas in patients with asthma or chronic obstructive pulmonary disease there were both large homogeneous and smaller patchy defects, including wedge-shaped defects that follow the segmental and subsegmental airways. Wedge-shaped defects in asthma (28) were observed to be either persistent or intermittent over time, but typically these remained in the same regional locations over long periods (29). Like 4D CT, free-breathing proton 4D MRI provides a way to generate maps of specific ventilation (30) and these maps correlate well with 3He MRI ventilation defect maps. Free-breathing proton MRI acquisitions can also be manipulated by using Fourier decomposition (31) and other phase-resolved methods (32) to generate ventilation and perfusion maps.
In a similar manner, oxygen-enhanced MRI exploits the paramagnetic properties of inhaled oxygen as a T1 contrast agent by using conventional proton-based MRI methods and receiver coils. In addition, oxygen transfer abnormalities may be quantified in patients with different pulmonary diseases (33–43) (Fig 6).
Figure 6:
Images in a 43-year-old male patient with pulmonary emphysema and bullae. A, Thin-section coronal image at lung window setting (left) and quantitatively assessed thin-section multiplanar reconstruction image with density-masked CT technique (right). Emphysematous lung in right upper lung (small arrow) and giant bulla in the left upper lung (large arrow) are clearly demonstrated. On quantitatively assessed thin-section multiplanar reconstruction image, healthy lung appears as green, and emphysematous lung or bullae appears as red with applying threshold value 2950 HU. B, Oxygen-enhanced MRI scan shown as a relative-enhancement map (gray scale, 0% [black] and 50% [white]). Emphysematous lung in right upper lung (small arrow) and giant bulla in the left upper lung (large arrow) are clearly demonstrated as black areas. In addition, the remainder of both lungs are heterogeneously enhanced because of emphysematous lung and airflow limitations.
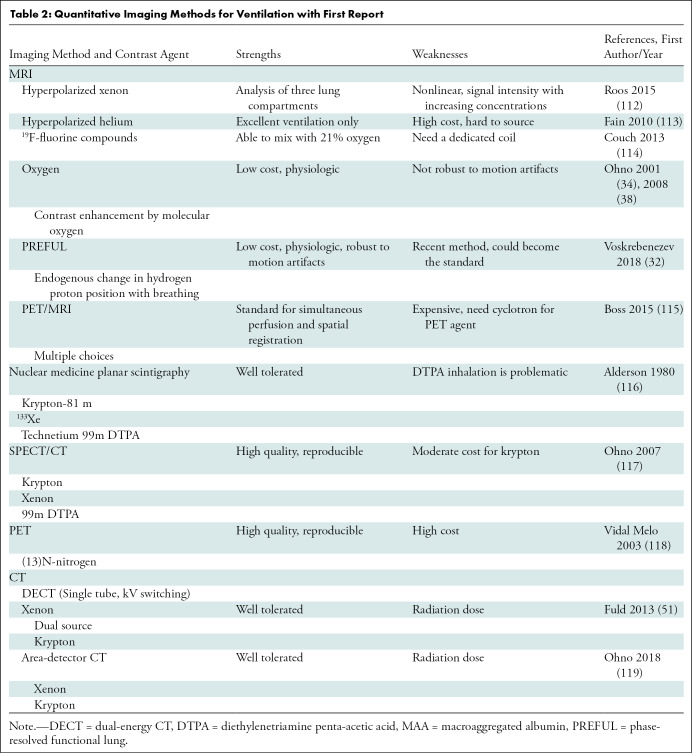
Fluorine 19 (19F) ventilation MRI has recently been pioneered to provide an alternative to hyperpolarized noble gas MRI (44–46). Inert fluorinated gases are nontoxic, abundant, relatively inexpensive, and may be undertaken without hyperpolarization equipment (44–46). The 19F gas MRI potentially provides functional information that is similar to images obtained from hyperpolarized noble gas MRI (44–46), although multiple breaths of gas are typically required to improve signal-to-noise ratios. In addition, the pattern of ventilation defects for the steady state of ventilation imaged with 19F MRI is not the same as what is found with hyperpolarized 3He or 129Xe methods (47). This is thought to be related to the fact that with steady-state imaging, collateral ventilation allows poorly ventilated areas to be ventilated by the imaging gas. This occurs with 19F ventilation MRI because there are multiple breaths used for the image acquisition, whereas hyperpolarized noble gas imaging relies on one single breath hold (inspiration, total lung capacity, and expiration) for all of its data. Various quantitative methods for ventilation imaging are summarized in Table 2.
Table 2:
Quantitative Imaging Methods for Ventilation with First Report
Perfusion Imaging
Pulmonary perfusion measurements are clinically important in obstructive airways disease and when ventilation and perfusion mismatch are suspected. The current methods for perfusion imaging use technetium 99m (99mTc) macroaggregated albumin, SPECT, and SPECT fused with CT (ie, SPECT/CT). These methods have been clinically used for years to image diseases of perfusion (eg, chronic thromboembolic pulmonary hypertension). However, the applicability of perfusion scanning, SPECT, and SPECT/CT with 99mTc macroaggregated albumin has remained problematic compared with the higher spatial resolution of CT and MRI. Compared with SPECT or SPECT/CT, 13N2-saline bolus injection method, intravenous administration of 15O-labeled water and albumin microspheres radiolabeled with 68Ga (ie, 68Ga-labeled microspheres) have been accepted as PET tracers for lung perfusion assessment (48,49). The current PET/MRI instruments are useful because the MRI can be performed simultaneously with PET. However, PET with these tracers is primarily used for research and is not covered by health insurance reimbursement. There is a concerted effort on the part of functional pulmonary imagers to move from ventilation and perfusion scanning to modalities that have better spatial and temporal resolution of the component ventilation and perfusion images.
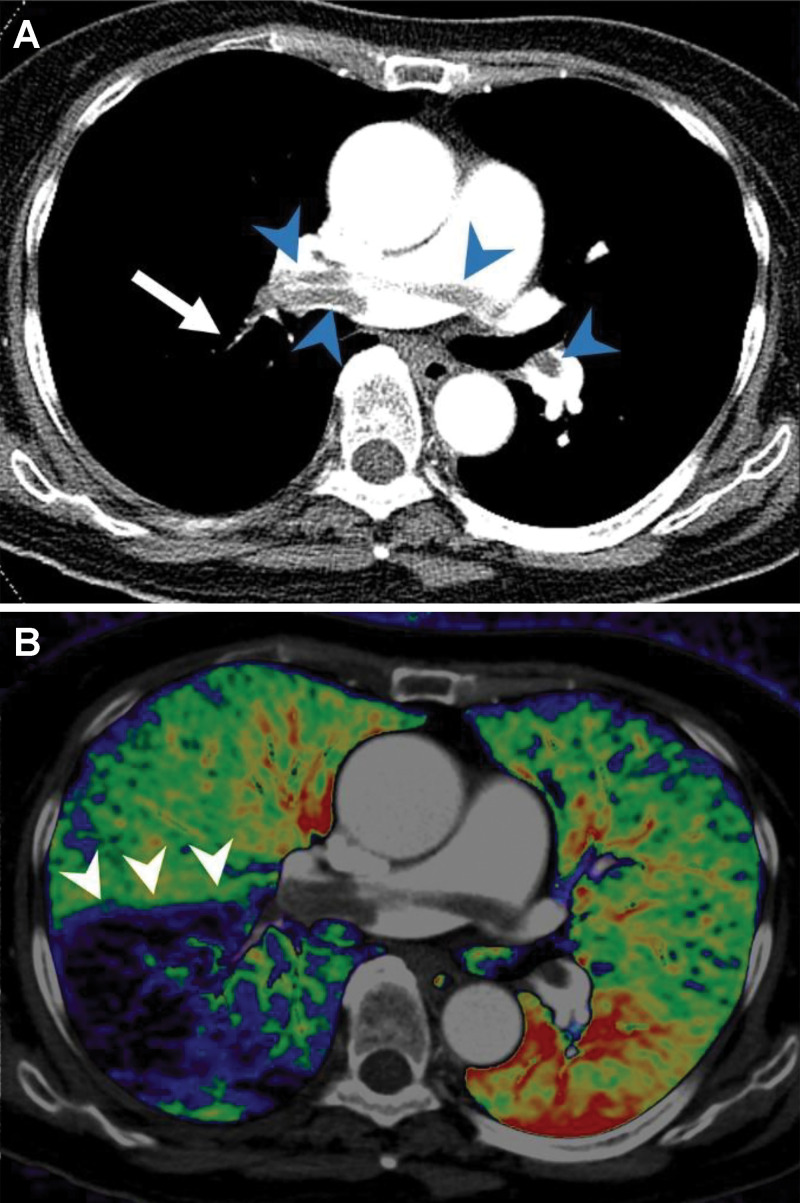
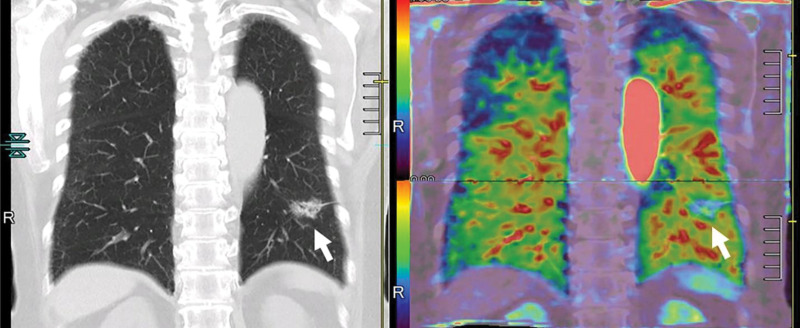
CT methods to evaluate perfusion include contrast-enhanced multienergy CT that shows iodine distribution maps in patients with pulmonary vascular diseases (Fig 7). Contrast-enhanced multienergy CT can be performed by using a number of different acquisition methods such as the dual-source and single-source CT systems with ultrafast tube voltage switching or the dual-layer detector system (50,51). Another approach uses quantitative dynamic first-pass contrast-enhanced perfusion CT by means of area-detector CT systems (52–60). The area-detector CT refers to a 320-detector-row CT system, initially developed for whole-heart coverage. This is designed with a large detector that is able to obtain isotropic volume data of the chest for analysis of the lung parenchyma, lung nodules, or masses in a single rotation (Fig 8). This hardware also enables dynamic first-pass contrast-enhanced perfusion by means of continuous dynamic scanning, allowing for qualitative and quantitative evaluation of lung perfusion (52–60). Although multienergy CT techniques offer advantages over conventional CT regarding the ease of obtaining qualitative assessment of pulmonary perfusion in the clinical setting, dynamic first-pass contrast-enhanced perfusion area-detector CT has the potential to become one of the most practicable pulmonary functional imaging methods and to provide morphologic and functional information with high spatial and temporal resolution. However, dose reduction by using iterative reconstruction needs to be carefully paired with maintenance of the accuracy of all perfusion parameter measurements (57). Therefore, radiation dose reduction may be one of the important factors in the clinical adoption of this technique.
Figure 7:
Example of dual-energy CT angiography in a patient with acute pulmonary embolism. A, Axial CT pulmonary arteriographic image shows saddle emboli in the main pulmonary artery and right and left pulmonary arteries (arrowheads) and small clots in a segmental pulmonary artery in the right lower lobe (arrow). B, Axial fusion image of pulmonary blood volume map of dual-energy CT shows large wedge-shaped perfusion defects in the right lower lobe (arrowheads).
Figure 8:
Images in a 73-year-old male patient with invasive adenocarcinoma (arrows) in the left lower lobe. Thin-section coronal multiplanar reconstruction image and quantitatively assessed whole-lung perfusion CT image (left) displayed as total perfusion map (right; combination of pulmonary arterial blood supply and systemic arterial blood supply from bronchial artery). Invasive adenocarcinoma (arrows) appears as part-solid nodule and decreased perfusion area compared with normal lungs. In addition, solid component shows relatively higher perfusion than ground-glass opacity. Whole-lung perfusion map was generated from two dynamic contrast-enhanced area-detector CT data sets by using our proprietary software.
Since the 1990s, noncontrast-enhanced and contrast-enhanced MR angiography and perfusion MRI have been suggested as having potential for viewing pulmonary vasculature and blood flow by using a variety of methods (61,62). In addition, contrast-enhanced MR angiography with parallel imaging techniques, known as time-resolved contrast-enhanced MR angiography or 4D contrast-enhanced MR angiography, has been used clinically in patients with pulmonary diseases over the last few decades (63–66). Moreover, dynamic first-pass contrast-enhanced perfusion MRI has been used for the semiquantitative and qualitative assessment of the pulmonary circulation in patients with various pulmonary diseases (60–62,67–72). Currently, all MRI scanners from any vendor with magnetic field strength equal to or greater than 1.5 T can support time-resolved contrast-enhanced MR angiography and dynamic first-pass contrast-enhanced perfusion MRI (Fig 9). Whereas the hardware and software for this has been available for more than 10 years, few centers have adopted MRI lung perfusion for clinical use. A better understanding of the strengths and weaknesses of MRI perfusion compared with other clinical modalities is needed (Table 3).
Figure 9:
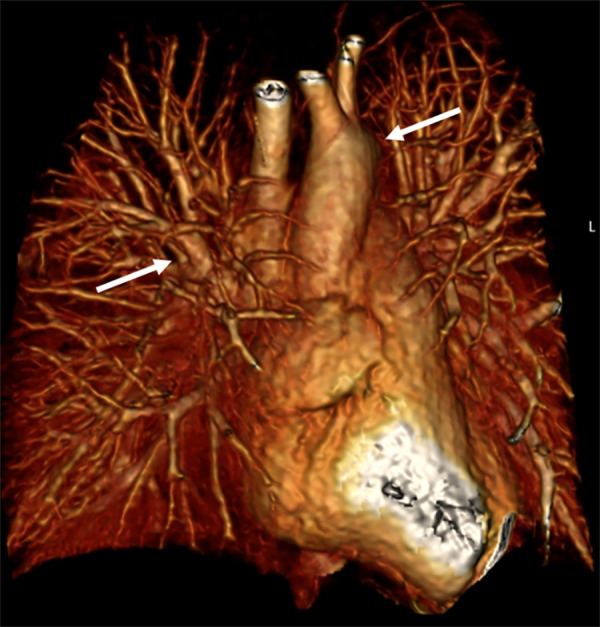
Raw perfusion coronal MRI scan from a movie by using the differential subsampling with Cartesian ordering technique (water images) after the bolus administration of contrast material (Multihance; Bracco) shows the dextrophase and levophase of cardiovascular, pulmonary, and great vessel contrast enhancement (arrows).
Imaging of Gas Exchange
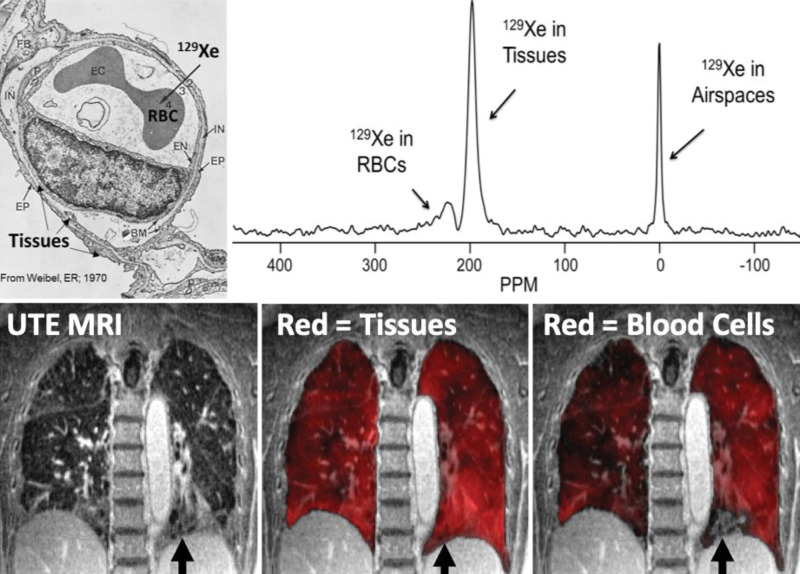
Opportunities for alveolar tissue and blood imaging are offered by 129Xe MRI because unlike 3He or 19F, Xe has modest tissue solubility, which allows for transmembrane alveolar tissue translocation and binding to red blood cell hemoglobin (73–75). Therefore, whole-lung studies (76,77) have demonstrated that inhaled 129Xe exhibits distinctly different resonance frequencies related to its presence in the gas, tissue, and red blood cell environments (73,76,78). By tuning the MRI scanner to these frequencies, spectral maps of alveolar tissue density and red blood cell distribution may be acquired in addition to the maps of gas distribution (Fig 10). By using such approaches, 129Xe MRI provides an opportunity to noninvasively estimate alveolar thickness, previously only accessible through invasive biopsy and histologic analysis. In this approach, the 129Xe signal can be manipulated by repeatedly saturating the tissue compartment and acquiring images at different delay times. Mathematical models of alveolar geometry can then be used to estimate alveolar thickness on the basis of the measured diffusion rate and amplitude of 129Xe gas diffusion into the tissue (79–82). Such calculations determined an idiopathic pulmonary fibrosis septal thickness that was 7.2 mm thicker (72%) than in healthy participants, and which can also be used to estimate alveolar surface-to-volume ratios, a crucial physiologic measure (82). Therefore, with the application of this phenomenon in academic practices, Xe polarization transfer contrast at hyperpolarized 129Xe MRI has been suggested as useful for gas transfer imaging in the last few decades (83–86).
Figure 10:
Demonstration of gas diffusion block in interstitial lung disease. Xenon 129 (129Xe) gas is soluble in the tissue and plasma and red blood cells (RBCs) from the alveolar airspace into the tissue-capillary interface. This results in measurable chemical shifts for the tissue and plasma and red blood cell compartments approximately 200 ppm downfield from the gas resonance (upper right). Spectroscopic imaging can be fused with anatomic ultrashort echo time (UTE) images (lower left) in fibrotic lung disease to demonstrate diffusion block in which the tissues and plasma take up the 129Xe homogeneously (lower middle), but red blood cell uptake is heterogeneous (lower right) or not present (lower row arrows) in a region of apparent honeycombing. (Upper left image used with permission from reference 111).
Pulmonary Biomechanics
Functional imaging measurements have been pioneered to estimate lung compliance by tracking voxel motion at full inspiration (total lung capacity) and at full expiration (residual volume). Lung compliance estimates derived from free-breathing and static volume 4D CT and 4D MRI can be obtained by using deformable image registration. Regional compliance can be computed by using the ratio of volumetric variation and the associated stress in each voxel, representing lung elasticity, and computed by using a finite element model. The mathematics involved in this transformation are nontrivial and the interested reader is encouraged to study other publications that deal with this issue in more detail (87). The method for MRI borrows from CT and uses ultrashort echo time images to track the change in position for each lung voxel between the total lung capacity and residual volume scans (88).
Multisystem Functional Imaging
All of the organs have some degree of interconnectivity with the lungs. This has been clearly demonstrated during the current COVID-19 pandemic. The musculoskeletal system, cognition (cortical function), brain stem function, cranial nerve function, cardiovascular system, hematologic system, immune system, hepatic function, renal function, types of particulates in the air, and the gaseous environment (molecular composition and concentration) the human is exposed to critically affects longevity. The multiple ways in which this occurs is beyond the scope of this article. It would be accurate to state that the rate-limiting step for mammalian life and aerobic metabolism is lung function.
For example, the metabolic syndrome can be used to help illustrate the interconnected nature of the lung with the rest of the body. With an excess of caloric consumption leading to the metabolic syndrome, there are a number of changes the body goes through (89). In the liver, nonalcoholic steatohepatitis may occur leading to hepatitis and cirrhosis. Hepatopulmo-nary syndrome and portopulmonary hypertension may occur in the advanced stages of cirrhosis. Insulin resistance with the development of type II diabetes can occur, increasing the risk of infections because of neutrophilic dysfunction in the setting of elevated glucose. Systemic hypertension may also occur, causing small arteriolar sclerosis in multiple organs. The function of the renal tubules decreases with systemic hypertension, activating the renin-angiotensin system to further increase the systolic pressure helping to worsen end-organ damage. The increased amount of intra-abdominal fat exerts pressure on the hemidiaphragms and makes them less efficient for the depth of inspiration. The subsequent development of obstructive sleep apnea adds insult to injury as pulmonary hypertension develops with the repeated bouts of nocturnal hypoxia that occurs in this over-weight population.
Advances in Dose Reduction, Image Analysis, Computational Methods, and Machine Learning
Radiation Dose Reduction
There has been extensive interest in reducing medical radiation from CT imaging. This has resulted in the use of multiple strategies to mitigate the radiation dose and the effective radiation dose: use of nationally vetted and standardized low-dose CT protocols optimized to age and body habitus; acceptance of more noise in diagnostic imaging for screening examinations; use of iterative reconstruction; combining deep learning and machine learning with iterative reconstruction methods; and, for younger individuals, simply using other imaging tests that do not involve x-rays or CT (eg, US and MRI) (90–93).
Imaging Analysis for Pulmonary Functional Imaging
To extract functional information in a quantitative way, images should be processed by dedicated software. Image processing methods vary according to imaging methods and the specific pathologic structure that must be evaluated. Nevertheless, it generally includes several typical processes: segmentation of lung, lobes, pulmonary vessels, and airways; registration of sequential images to match exact anatomically corresponding locations; normalization of images to minimize variation of measured signals between sequential images or cases; enhancement of signals or suppression of noise; and model fitting to extract quantitative functional measures from dynamic images.
Many image processing methods have been proposed and used for ventilation and perfusion and other functional assessment of lung physiologic structure (Fig 11). However, there are several fundamental issues to be overcome in applying these methods in routine clinical practice. First, variation of the measured signal and noise pattern originating from different imaging sequences and imaging machines prevent the evolution of functional measures to imaging biomarkers. Second, there is a lack of consensus for imaging processing methods. Different segmentation methods, registration methods, and model fitting are used in various software so that the results with these different methods cannot be compared. Last, most of the image processing methods are imperfect, particularly when they are applied to diseased lung images. They are often semiautomatic and require human interactions. This may result in significant measurement variations. Moreover, the requirement of human correction or confirmation for the processing seriously hampers the use of this technique in routine clinical workflow because it raises issues of seamless and timely implementation.
Figure 11:
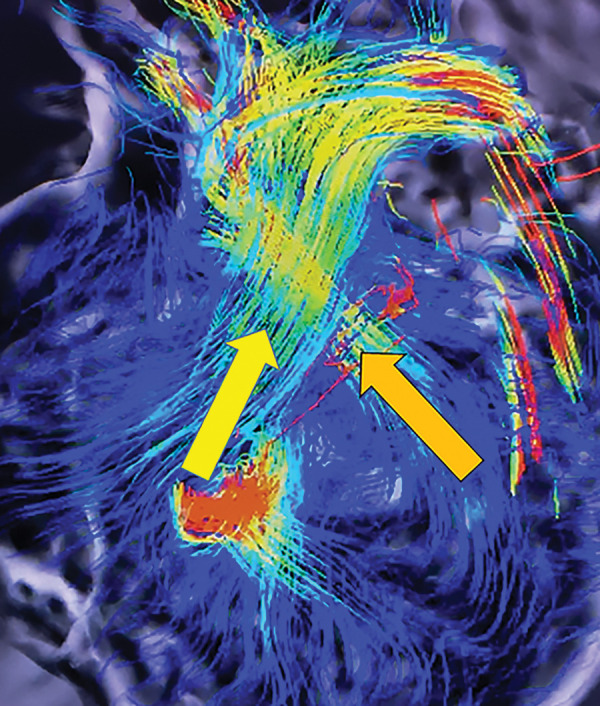
Still image capture from four-dimensional flow MRI movie file shows the right ventricular outflow track (yellow arrow) and the left ventricular outflow track (orange arrow).
Radiomics in Cardiopulmonary Imaging
Radiomics is a field of image postprocessing that aims to use computer algorithms to analyze image data in ways the human eye and brain are not able to process intuitively (94). There has been a great interest in developing imaging-based radiomic signatures that help to predict survival for non–small cell lung cancer (95–97). Some authors have used this method to help predict recurrence-free survival in stage 1 non–small cell lung cancer (98). The concept of radiomics, which is generation of high-throughput quantitative data from the image, is also applicable to other pulmonary functional imaging because most of pulmonary functional imaging produce multiple quantitative results and their integration by using a radiomics approach is necessary. Although interesting, the radiomics method is being rapidly overtaken by the use of artificial intelligence and deep learning methods that are able to automatically process large data bases for training and validation, and also use external test sets to demonstrate their accuracy in predicting outcomes in patients with lung cancer and other chronic diseases.
Artificial Intelligence for Pulmonary Functional Imaging
Artificial intelligence, particularly deep learning technology with convolutional neural networks, has recently been introduced for medical imaging (99,100). The usefulness of these methods in the detection and characterization of chest pathologic abnormalities by using imaging has been substantiated in many studies (101). Artificial intelligence will significantly accelerate the clinical use of pulmonary functional imaging. First of all, use of deep learning methods at image acquisition will significantly improve the quality of functional imaging. In most of pulmonary functional imaging, dynamic scanning of the lung to acquire multiple time series of the region of interest is essential. To obtain multiple CT series within acceptable radiation exposure, low-dose scanning of the region is essential, with resulting increased image noise and decreased signal-to-noise ratio and contrast-to-noise ratio. By using deep learning methods, the noise on the low-dose CT images can be significantly reduced, providing improved information for the functional assessment (99). For MRI, these deep learning approaches can be used to decrease acquisition time, thereby improving the temporal resolution. Deep learning is also useful to reduce artifacts related to patient motion and rapid acquisition (102).
The variation of signal intensity caused by using different imaging protocols, different imaging machines, and patient factors is one of the critical issues to be addressed in the routine clinical use of pulmonary functional imaging. Many researchers have tried to minimize this variation by standardizing imaging protocols and quality control for multicenter studies. However, this level of quality control is largely impractical in a busy clinical setting. Recent studies have shown that deep learning methods are also useful in minimizing the signal variation between images generated with different acquisition protocols and by using different machines. Several studies showed that this technology can decrease the measurement variation in emphysema and radiomic assessment (103,104).
Artificial intelligence will also be helpful in every step of image analysis in pulmonary functional imaging, which will serve to fully automate the analysis and totally integrate the output to current clinical picture archiving and communication systems. Defining the region of interest, whether it is the whole lung or a specific region (eg, the pulmonary artery for dynamic perfusion analysis), is the first step in the image analysis. However, this segmentation step is not always easy, particularly when the lung or target area has an atypical shape or location caused by disease or anatomic variation, which often requires correction from a human expert. Recently, studies have shown that deep learning methods significantly improve the performance of image segmentation (105–107). For dynamic assessment, aligning the anatomically corresponding locations in sequential images is the next critical step. However, exact registration is challenging, particularly when considering the complex motion of the lung caused by respiration and cardiac pulsation. Imperfect image registration is a critical problem for dynamic analysis by using multiple images because this often results in measurement errors. Another issue in image registration is that it often requires long image processing times, particularly for CT data. To address this limitation, deep learning methods are also useful in enhancing the accuracy and speed of imaging registration (108). In addition, deep learning methods are useful in normalizing signals and decreasing noise in dynamic series images.
In the near future, it is likely that all of these artificial intelligence methods will be used in pulmonary functional image analysis and will help to accelerate the clinical adoption of functional lung imaging. Moreover, pattern recognition and clustering of pooled imaging data will provide insights into our understanding of the pathophysiologic causes of lung diseases (Fig 12). Data mining by using machine learning technology will be helpful in building models of diseases which may further act to improve image acquisition times.
Figure 12:
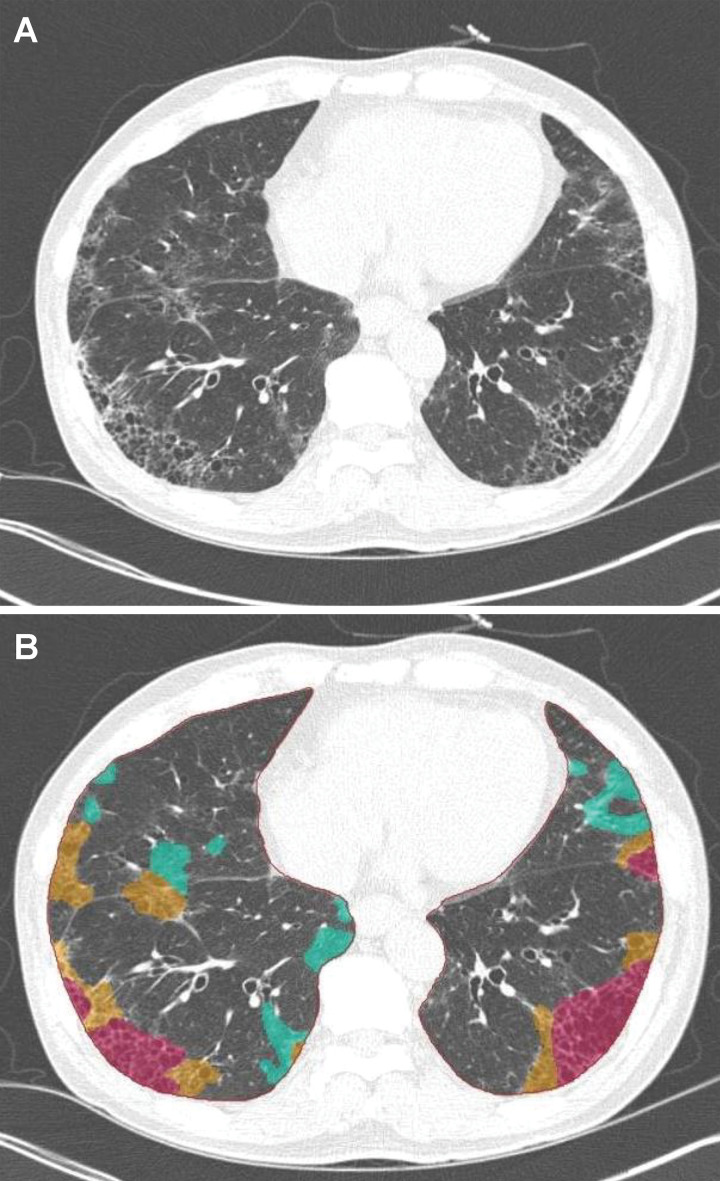
Artificial intelligence–based automatic quantification of regional disease pattern on CT images. A, The original image and, B, parametric map of thin-section CT of interstitial lung disease show that deep learning–based automatic quantification of local disease pattern is possible. Red on the parametric map represents the areas of honeycombing; yellow, reticulation; and green, ground-glass opacity.
Future Directions
A Fleischner Society position paper by Hatabu et al was published in the November 2020 issue of Radiology. This white paper discussed the recent advancements in functional MRI lung imaging, and three-category recommendations for the clinical use of pulmonary MRI were provided (Appendix E1 [online]) (109,110).
Conclusions
We reviewed the structural and physiologic foundations of pulmonary functional imaging. The various techniques and functional biomarkers for ventilation, perfusion, gas exchange, and biomechanics, and the relevant advances in image analysis, computational methods, machine learning, and artificial intelligence that have evolved over the past 3 decades were highlighted. Building on this summary of the basic underpinnings of pulmonary functional imaging and the broad array of physiologic biomarkers it can provide, part 2 of this state-of-the-art review will summarize current and emerging clinical applications, including both the opportunities and challenges for the clinical translation and adoption of functional lung imaging.
Acknowledgments:
We are grateful for the librarians Myung-Ah Shim, BS, and Jaero Park, MS, for their dedicated support of manuscript formatting. Both librarians are working at the Samsung Medical Information & Media Services of Samsung Medical Center located in Seoul, South Korea. All authors participated in the literature search. Y.O., J.B.S., G.P., K.S.L., W.B.G., S.B.F., M.L.S., and H.H. created the first draft of the review. All authors critically reviewed the manuscript and approved the final version, taking accountability for the work.
H.H. supported by the National Instutitues of Health (R01CA203636, 5U01CA209414-03, R01HL135142) and the National Heart, Lung, and Blood Institute (1R01HL130974, 2R01HL111024-06); M.L.S. supported by National Heart, Lung, and Blood Institute (1U01 HL102225-01, R01 HL091762, P01 HL07083); S.B.F. supported by Pulmonary Imaging Center, Office of the Vice Chancellor for Research and Graduate Education at the University of Wisconsin–Madison with funding from the Wisconsin Alumni Research Foundation (S10 OD016394, R01 EB021314, U01 HL146002, UG1 HL139118, R01 HL126771); G.P. supported by Canadian Institutes of Health Research (PJT 148624, HEV 440431), Natural Sciences and Engineering Research Council of Canada, Canada Research Chair Program.
Disclosures of Conflicts of Interest: Y.O. Activities related to the present article: disclosed money to author's institution for grant from Canon Medical Systems. Activities not related to the present article: disclosed money to author's institution for grants/grants pending from Bayer Pharma; disclosed grants-in-aid for scientific research from the Japanese Ministry of Education, Culture, Sports, Science and Technology; research grant from Smoking Research Foundation; research grant from Daiichi Sankyo. Other relationships: disclosed no relevant relationships. J.B.S. Activities related to the present article: disclosed no relevant relationships. Activities not related to the present article: disclosed money to author's institution for multiple issued patents in Korea; disclosed royaltiy for license of patents to Coreline Soft; disclosed stock/stock options from Coreline Soft and Premedius. Other relationships: disclosed that author is a licensee for Coreline Soft. G.P. disclosed no relevant relationships. K.S.L. disclosed no relevant relationships. W.B.G. Activities related to the present article: disclosed no relevant relationships. Activities not related to the present article: disclosed consultancy from Imbio; grants/grants pending from Siemens Medical Solutions. Other relationships: disclosed no relevant relationships. S.B.F. Activities related to the present article: disclosed no relevant relationships. Activities not related to the present article: disclosed consultancy for Sanofi/Regeneron, Polarean; disclosed grants from NIH, GE Healthcare; disclosed payment for lectures from Sanofi/Regeneron. Other relationships: disclosed no relevant relationships. M.L.S. disclosed no relevant relationships. H.H. Activities related to the present article: disclosed no relevant relationships. Activities not related to the present article: disclosed consultancy from Mitsubishi Chemical, Canon Medical Systems; grants/grants pending from Canon Medical Systems, Konica-Minolta. Other relationships: disclosed no relevant relationships.
Abbreviations:
- COVID-19
- coronavirus disease 2019
- 4D
- four-dimensional
References
- 1.West JB. Respiratory Physiology People and Ideas. New York, NY: Springer-Verlag, 1996. [Google Scholar]
- 2.Albertin K. Structural organization and quantitative morphology of the lung. In: Cutillo AG, ed. Application of Magnetic Resonance to the Study of Lung. Armonk, NY: Futura, 1996; 73–114. [Google Scholar]
- 3.Staub NC. Pulmonary edema. Physiol Rev 1974;54(3):678–811. [DOI] [PubMed] [Google Scholar]
- 4.Armstrong JD, Gluck EH, Crapo RO, Jones HA, Hughes JM. Lung tissue volume estimated by simultaneous radiographic and helium dilution methods. Thorax 1982;37(9):676–679. [DOI] [PMC free article] [PubMed] [Google Scholar]
- 5.Piiper J, Scheid P. Models for a comparative functional analysis of gas exchange organs in vertebrates. J Appl Physiol 1982;53(6):1321–1329. [DOI] [PubMed] [Google Scholar]
- 6.Röntgen W. Ueber eine neue Art von Strahlen. Vorläufige Mitteilung. In: Aus den Sitzungsberichten der Würzburger Physik.-medic. Würzburg, Germany: Gesellschaft, 1895; 137–147. [Google Scholar]
- 7.Weibel ER, Taylor CR, Hoppeler H. The concept of symmorphosis: a testable hypothesis of structure-function relationship. Proc Natl Acad Sci U S A 1991;88(22):10357–10361. [DOI] [PMC free article] [PubMed] [Google Scholar]
- 8.Weibel ER. Symmorphosis: On Form and Function in Shaping Life. Cambridge, Mass: Harvard University Press, 2000. [Google Scholar]
- 9.American Thoracic Society. Human Alveolar epithelial type I cells in 3D. https://www.youtube.com/watch?v=-iKowVFGKgY. Published January 25, 2019. Accessed June 15, 2020.
- 10.Weibel ER. Morphometry of the Human Lung. New York, NY: Academic Press, 1963. [Google Scholar]
- 11.Itoh H, Nishino M, Hatabu H. Architecture of the lung: morphology and function. J Thorac Imaging 2004;19(4):221–227. [DOI] [PubMed] [Google Scholar]
- 12.Itoh H, Nakatsu M, Yoxtheimer LM, Uematsu H, Ohno Y, Hatabu H. Structural basis for pulmonary functional imaging. Eur J Radiol 2001;37(3):143–154. [DOI] [PubMed] [Google Scholar]
- 13.Hatabu H, Uematsu H, Hasegawa I, Itoh H. MR-pathologic correlation of lung specimens. Eur J Radiol 2002;44(3):210–215. [DOI] [PubMed] [Google Scholar]
- 14.Webb WR. Thin-section CT of the secondary pulmonary lobule: anatomy and the image—the 2004 Fleischner lecture. Radiology 2006;239(2):322–338. [DOI] [PubMed] [Google Scholar]
- 15.Nishino M, Itoh H, Hatabu H. A practical approach to high-resolution CT of diffuse lung disease. Eur J Radiol 2014;83(1):6–19. [DOI] [PMC free article] [PubMed] [Google Scholar]
- 16.Levin DL, Schiebler ML, Hopkins SR. Physiology for the pulmonary functional imager. Eur J Radiol 2017;86:308–312. [DOI] [PMC free article] [PubMed] [Google Scholar]
- 17.Castillo E, Castillo R, Martinez J, Shenoy M, Guerrero T. Four-dimensional deformable image registration using trajectory modeling. Phys Med Biol 2010;55(1):305–327. [DOI] [PMC free article] [PubMed] [Google Scholar]
- 18.Castillo R, Castillo E, Martinez J, Guerrero T. Ventilation from four-dimensional computed tomography: density versus Jacobian methods. Phys Med Biol 2010;55(16):4661–4685. [DOI] [PubMed] [Google Scholar]
- 19.Hachulla AL, Pontana F, Wemeau-Stervinou L, et al. Krypton ventilation imaging using dual-energy CT in chronic obstructive pulmonary disease patients: initial experience. Radiology 2012;263(1):253–259. [DOI] [PubMed] [Google Scholar]
- 20.Remy-Jardin M, Faivre JB, Pontana F, Remy J. Dual energy CT for thoracic applications [in French]. Rev Mal Respir 2012;29(10):1268–1271. [DOI] [PubMed] [Google Scholar]
- 21.Ohno Y, Fujisawa Y, Takenaka D, et al. Comparison of Xenon-Enhanced Area-Detector CT and Krypton Ventilation SPECT/CT for Assessment of Pulmonary Functional Loss and Disease Severity in Smokers. AJR Am J Roentgenol 2018;210(2):W45–W53. [DOI] [PubMed] [Google Scholar]
- 22.Chae EJ, Song JW, Krauss B, et al. Dual-energy computed tomography characterization of solitary pulmonary nodules. J Thorac Imaging 2010;25(4):301–310. [DOI] [PubMed] [Google Scholar]
- 23.Chae EJ, Seo JB, Lee J, et al. Xenon ventilation imaging using dual-energy computed tomography in asthmatics: initial experience. Invest Radiol 2010;45(6):354–361. [DOI] [PubMed] [Google Scholar]
- 24.Galbán CJ, Han MK, Boes JL, et al. Computed tomography-based biomarker provides unique signature for diagnosis of COPD phenotypes and disease progression. Nat Med 2012;18(11):1711–1715. [DOI] [PMC free article] [PubMed] [Google Scholar]
- 25.Capaldi DP, Zha N, Guo F, et al. Pulmonary Imaging Biomarkers of Gas Trapping and Emphysema in COPD: (3)He MR Imaging and CT Parametric Response Maps. Radiology 2016;279(2):597–608. [DOI] [PubMed] [Google Scholar]
- 26.Bachert P, Schad LR, Bock M, et al. Nuclear magnetic resonance imaging of airways in humans with use of hyperpolarized 3He. Magn Reson Med 1996;36(2):192–196. [DOI] [PubMed] [Google Scholar]
- 27.Kauczor HU, Ebert M, Kreitner KF, et al. Imaging of the lungs using 3He MRI: preliminary clinical experience in 18 patients with and without lung disease. J Magn Reson Imaging 1997;7(3):538–543. [DOI] [PubMed] [Google Scholar]
- 28.Altes TA, Powers PL, Knight-Scott J, et al. Hyperpolarized 3He MR lung ventilation imaging in asthmatics: preliminary findings. J Magn Reson Imaging 2001;13(3):378–384. [DOI] [PubMed] [Google Scholar]
- 29.de Lange EE, Altes TA, Patrie JT, et al. The variability of regional airflow obstruction within the lungs of patients with asthma: assessment with hyperpolarized helium-3 magnetic resonance imaging. J Allergy Clin Immunol 2007;119(5):1072–1078. [DOI] [PubMed] [Google Scholar]
- 30.Capaldi DPI, Eddy RL, Svenningsen S, et al. Free-breathing Pulmonary MR Imaging to Quantify Regional Ventilation. Radiology 2018;287(2):693–704. [DOI] [PubMed] [Google Scholar]
- 31.Bauman G, Puderbach M, Deimling M, et al. Non-contrast-enhanced perfusion and ventilation assessment of the human lung by means of fourier decomposition in proton MRI. Magn Reson Med 2009;62(3):656–664. [DOI] [PubMed] [Google Scholar]
- 32.Voskrebenzev A, Gutberlet M, Klimeš F, et al. Feasibility of quantitative regional ventilation and perfusion mapping with phase-resolved functional lung (PREFUL) MRI in healthy volunteers and COPD, CTEPH, and CF patients. Magn Reson Med 2018;79(4):2306–2314. [DOI] [PubMed] [Google Scholar]
- 33.Edelman RR, Hatabu H, Tadamura E, Li W, Prasad PV. Noninvasive assessment of regional ventilation in the human lung using oxygen-enhanced magnetic resonance imaging. Nat Med 1996;2(11):1236–1239. [DOI] [PubMed] [Google Scholar]
- 34.Ohno Y, Hatabu H, Takenaka D, Adachi S, Van Cauteren M, Sugimura K. Oxygen-enhanced MR ventilation imaging of the lung: preliminary clinical experience in 25 subjects. AJR Am J Roentgenol 2001;177(1):185–194. [DOI] [PubMed] [Google Scholar]
- 35.Müller CJ, Schwaiblmair M, Scheidler J, et al. Pulmonary diffusing capacity: assessment with oxygen-enhanced lung MR imaging preliminary findings. Radiology 2002;222(2):499–506. [DOI] [PubMed] [Google Scholar]
- 36.Ohno Y, Hatabu H, Higashino T, et al. Oxygen-enhanced MR imaging: correlation with postsurgical lung function in patients with lung cancer. Radiology 2005;236(2):704–711. [DOI] [PubMed] [Google Scholar]
- 37.Ohno Y, Koyama H, Nogami M, et al. Dynamic oxygen-enhanced MRI versus quantitative CT: pulmonary functional loss assessment and clinical stage classification of smoking-related COPD. AJR Am J Roentgenol 2008;190(2):W93–W99. [DOI] [PubMed] [Google Scholar]
- 38.Ohno Y, Iwasawa T, Seo JB, et al. Oxygen-enhanced magnetic resonance imaging versus computed tomography: multicenter study for clinical stage classification of smoking-related chronic obstructive pulmonary disease. Am J Respir Crit Care Med 2008;177(10):1095–1102. [DOI] [PubMed] [Google Scholar]
- 39.Ohno Y, Nishio M, Koyama H, et al. Oxygen-enhanced MRI, thin-section MDCT, and perfusion SPECT/CT: comparison of clinical implications to patient care for lung volume reduction surgery. AJR Am J Roentgenol 2012;199(4):794–802. [DOI] [PubMed] [Google Scholar]
- 40.Ohno Y, Nishio M, Koyama H, et al. Asthma: comparison of dynamic oxygen-enhanced MR imaging and quantitative thin-section CT for evaluation of clinical treatment. Radiology 2014;273(3):907–916. [DOI] [PubMed] [Google Scholar]
- 41.Renne J, Hinrichs J, Schönfeld C, et al. Noninvasive quantification of airway inflammation following segmental allergen challenge with functional MR imaging: a proof of concept study. Radiology 2015;274(1):267–275. [DOI] [PubMed] [Google Scholar]
- 42.Renne J, Lauermann P, Hinrichs JB, et al. Chronic Lung Allograft Dysfunction: Oxygen-enhanced T1-Mapping MR Imaging of the Lung. Radiology 2015;276(1):266–273. [DOI] [PubMed] [Google Scholar]
- 43.Zha W, Nagle SK, Cadman RV, Schiebler ML, Fain SB. Three-dimensional Isotropic Functional Imaging of Cystic Fibrosis Using Oxygen-enhanced MRI: Comparison with Hyperpolarized 3He MRI. Radiology 2019;290(1):229–237. [DOI] [PMC free article] [PubMed] [Google Scholar]
- 44.Adolphi NL, Kuethe DO. Quantitative mapping of ventilation-perfusion ratios in lungs by 19F MR imaging of T1 of inert fluorinated gases. Magn Reson Med 2008;59(4):739–746. [DOI] [PubMed] [Google Scholar]
- 45.Kruger SJ, Nagle SK, Couch MJ, Ohno Y, Albert M, Fain SB. Functional imaging of the lungs with gas agents. J Magn Reson Imaging 2016;43(2):295–315. [DOI] [PMC free article] [PubMed] [Google Scholar]
- 46.Gutberlet M, Kaireit TF, Voskrebenzev A, et al. Free-breathing Dynamic 19F Gas MR Imaging for Mapping of Regional Lung Ventilation in Patients with COPD. Radiology 2018;286(3):1040–1051. [DOI] [PubMed] [Google Scholar]
- 47.McCallister A, Chung SH, Antonacci M, et al. Comparison of single breath hyperpolarized 129 Xe MRI with dynamic 19 F MRI in cystic fibrosis lung disease. Magn Reson Med 2021;85(2):1028–1038. [DOI] [PMC free article] [PubMed] [Google Scholar]
- 48.Musch G, Venegas JG. Positron emission tomography imaging of regional pulmonary perfusion and ventilation. Proc Am Thorac Soc 2005;2(6):522–527, 508–509. [DOI] [PMC free article] [PubMed] [Google Scholar]
- 49.Bailey DL, Eslick EM, Schembri GP, Roach PJ. (68)Ga PET Ventilation and Perfusion Lung Imaging-Current Status and Future Challenges. Semin Nucl Med 2016;46(5):428–435. [DOI] [PubMed] [Google Scholar]
- 50.Lu GM, Zhao Y, Zhang LJ, Schoepf UJ. Dual-energy CT of the lung. AJR Am J Roentgenol 2012;199(5 Suppl):S40–S53. [DOI] [PubMed] [Google Scholar]
- 51.Fuld MK, Halaweish AF, Haynes SE, Divekar AA, Guo J, Hoffman EA. Pulmonary perfused blood volume with dual-energy CT as surrogate for pulmonary perfusion assessed with dynamic multidetector CT. Radiology 2013;267(3):747–756. [DOI] [PMC free article] [PubMed] [Google Scholar]
- 52.Ohno Y, Koyama H, Matsumoto K, et al. Differentiation of malignant and benign pulmonary nodules with quantitative first-pass 320-detector row perfusion CT versus FDG PET/CT. Radiology 2011;258(2):599–609. [DOI] [PubMed] [Google Scholar]
- 53.Ohno Y, Nishio M, Koyama H, et al. Comparison of quantitatively analyzed dynamic area-detector CT using various mathematic methods with FDG PET/CT in management of solitary pulmonary nodules. AJR Am J Roentgenol 2013;200(6):W593–W602. [DOI] [PubMed] [Google Scholar]
- 54.Ohno Y, Nishio M, Koyama H, et al. Solitary pulmonary nodules: Comparison of dynamic first-pass contrast-enhanced perfusion area-detector CT, dynamic first-pass contrast-enhanced MR imaging, and FDG PET/CT. Radiology 2015;274(2):563–575. [DOI] [PubMed] [Google Scholar]
- 55.Ohno Y, Koyama H, Lee HY, Miura S, Yoshikawa T, Sugimura K. Contrast-enhanced CT- and MRI-based perfusion assessment for pulmonary diseases: basics and clinical applications. Diagn Interv Radiol 2016;22(5):407–421. [DOI] [PMC free article] [PubMed] [Google Scholar]
- 56.Ohno Y, Koyama H, Fujisawa Y, et al. Dynamic contrast-enhanced perfusion area detector CT for non-small cell lung cancer patients: Influence of mathematical models on early prediction capabilities for treatment response and recurrence after chemoradiotherapy. Eur J Radiol 2016;85(1):176–186. [DOI] [PubMed] [Google Scholar]
- 57.Ohno Y, Koyama H, Fujisawa Y, et al. Hybrid Type iterative reconstruction method vs. filter back projection method: Capability for radiation dose reduction and perfusion assessment on dynamic first-pass contrast-enhanced perfusion chest area-detector CT. Eur J Radiol 2016;85(1):164–175. [DOI] [PubMed] [Google Scholar]
- 58.Ohno Y, Fujisawa Y, Koyama H, et al. Dynamic contrast-enhanced perfusion area-detector CT assessed with various mathematical models: Its capability for therapeutic outcome prediction for non-small cell lung cancer patients with chemoradiotherapy as compared with that of FDG-PET/CT. Eur J Radiol 2017;86:83–91. [DOI] [PubMed] [Google Scholar]
- 59.Ohno Y, Fujisawa Y, Sugihara N, et al. Dynamic Contrast-Enhanced Perfusion Area-Detector CT: Preliminary Comparison of Diagnostic Performance for N Stage Assessment With FDG PET/CT in Non-Small Cell Lung Cancer. AJR Am J Roentgenol 2017;209(5):W253–W262. [DOI] [PubMed] [Google Scholar]
- 60.Ohno Y, Fujisawa Y, Yui M, et al. Solitary pulmonary nodule: Comparison of quantitative capability for differentiation and management among dynamic CE-perfusion MRI at 3 T system, dynamic CE-perfusion ADCT and FDGPET/CT. Eur J Radiol 2019;115:22–30. [DOI] [PubMed] [Google Scholar]
- 61.Hatabu H, Gaa J, Kim D, Li W, Prasad PV, Edelman RR. Pulmonary perfusion: qualitative assessment with dynamic contrast-enhanced MRI using ultrashort TE and inversion recovery turbo FLASH. Magn Reson Med 1996;36(4):503–508. [DOI] [PubMed] [Google Scholar]
- 62.Hatabu H, Tadamura E, Levin DL, et al. Quantitative assessment of pulmonary perfusion with dynamic contrast-enhanced MRI. Magn Reson Med 1999;42(6):1033–1038. [DOI] [PubMed] [Google Scholar]
- 63.Ohno Y, Kawamitsu H, Higashino T, et al. Time-resolved contrast-enhanced pulmonary MR angiography using sensitivity encoding (SENSE). J Magn Reson Imaging 2003;17(3):330–336. [DOI] [PubMed] [Google Scholar]
- 64.Ohno Y, Higashino T, Takenaka D, et al. MR angiography with sensitivity encoding (SENSE) for suspected pulmonary embolism: comparison with MDCT and ventilation-perfusion scintigraphy. AJR Am J Roentgenol 2004;183(1):91–98. [DOI] [PubMed] [Google Scholar]
- 65.Johns CS, Swift AJ, Hughes PJC, Ohno Y, Schiebler M, Wild JM. Pulmonary MR angiography and perfusion imaging-A review of methods and applications. Eur J Radiol 2017;86:361–370. [DOI] [PubMed] [Google Scholar]
- 66.Ohno Y, Yoshikawa T, Kishida Y, Seki S, Karabulut N. Unenhanced and Contrast-Enhanced MR Angiography and Perfusion Imaging for Suspected Pulmonary Thromboembolism. AJR Am J Roentgenol 2017;208(3):517–530. [DOI] [PubMed] [Google Scholar]
- 67.Levin DL, Chen Q, Zhang M, Edelman RR, Hatabu H. Evaluation of regional pulmonary perfusion using ultrafast magnetic resonance imaging. Magn Reson Med 2001;46(1):166–171. [DOI] [PubMed] [Google Scholar]
- 68.Ohno Y, Hatabu H, Murase K, et al. Quantitative assessment of regional pulmonary perfusion in the entire lung using three-dimensional ultrafast dynamic contrast-enhanced magnetic resonance imaging: Preliminary experience in 40 subjects. J Magn Reson Imaging 2004;20(3):353–365. [DOI] [PubMed] [Google Scholar]
- 69.Ohno Y, Hatabu H, Murase K, et al. Primary pulmonary hypertension: 3D dynamic perfusion MRI for quantitative analysis of regional pulmonary perfusion. AJR Am J Roentgenol 2007;188(1):48–56. [DOI] [PubMed] [Google Scholar]
- 70.Ohno Y, Koyama H, Nogami M, et al. Postoperative lung function in lung cancer patients: comparative analysis of predictive capability of MRI, CT, and SPECT. AJR Am J Roentgenol 2007;189(2):400–408. [DOI] [PubMed] [Google Scholar]
- 71.Ohno Y, Koyama H, Nogami M, et al. Dynamic perfusion MRI: capability for evaluation of disease severity and progression of pulmonary arterial hypertension in patients with connective tissue disease. J Magn Reson Imaging 2008;28(4):887–899. [DOI] [PubMed] [Google Scholar]
- 72.Ohno Y, Koyama H, Yoshikawa T, et al. Contrast-enhanced multidetector-row computed tomography vs. Time-resolved magnetic resonance angiography vs. contrast-enhanced perfusion MRI: assessment of treatment response by patients with inoperable chronic thromboembolic pulmonary hypertension. J Magn Reson Imaging 2012;36(3):612–623. [DOI] [PubMed] [Google Scholar]
- 73.Salerno M, Altes TA, Brookeman JR, de Lange EE, Mugler JP 3rd. Dynamic spiral MRI of pulmonary gas flow using hyperpolarized (3)He: preliminary studies in healthy and diseased lungs. Magn Reson Med 2001;46(4):667–677. [DOI] [PubMed] [Google Scholar]
- 74.Cleveland ZI, Cofer GP, Metz G, et al. Hyperpolarized Xe MR imaging of alveolar gas uptake in humans. PLoS One 2010;5(8):e12192. [DOI] [PMC free article] [PubMed] [Google Scholar]
- 75.Chen RY, Fan FC, Kim S, Jan KM, Usami S, Chien S. Tissue-blood partition coefficient for xenon: temperature and hematocrit dependence. J Appl Physiol 1980;49(2):178–183. [DOI] [PubMed] [Google Scholar]
- 76.Sakai K, Bilek AM, Oteiza E, et al. Temporal dynamics of hyperpolarized 129Xe resonances in living rats. J Magn Reson B 1996;111(3):300–304. [DOI] [PubMed] [Google Scholar]
- 77.Wagshul ME, Button TM, Li HF, et al. In vivo MR imaging and spectroscopy using hyperpolarized 129Xe. Magn Reson Med 1996;36(2):183–191. [DOI] [PubMed] [Google Scholar]
- 78.Tseng CH, Peled S, Nascimben L, Oteiza E, Walsworth RL, Jolesz FA. NMR of laser-polarized 129Xe in blood foam. J Magn Reson 1997;126(1):79–86. [DOI] [PubMed] [Google Scholar]
- 79.Månsson S, Wolber J, Driehuys B, Wollmer P, Golman K. Characterization of diffusing capacity and perfusion of the rat lung in a lipopolysaccaride disease model using hyperpolarized 129Xe. Magn Reson Med 2003;50(6):1170–1179. [DOI] [PubMed] [Google Scholar]
- 80.Chang YV. MOXE: a model of gas exchange for hyperpolarized 129Xe magnetic resonance of the lung. Magn Reson Med 2013;69(3):884–890. [DOI] [PubMed] [Google Scholar]
- 81.Stewart NJ, Leung G, Norquay G, et al. Experimental validation of the hyperpolarized 129 Xe chemical shift saturation recovery technique in healthy volunteers and subjects with interstitial lung disease. Magn Reson Med 2015;74(1):196–207. [DOI] [PubMed] [Google Scholar]
- 82.Stewart NJ, Horn FC, Norquay G, et al. Reproducibility of quantitative indices of lung function and microstructure from 129 Xe chemical shift saturation recovery (CSSR) MR spectroscopy. Magn Reson Med 2017;77(6):2107–2113. [DOI] [PMC free article] [PubMed] [Google Scholar]
- 83.Ruppert K, Brookeman JR, Hagspiel KD, Mugler JP 3rd. Probing lung physiology with xenon polarization transfer contrast (XTC). Magn Reson Med 2000;44(3):349–357. [DOI] [PubMed] [Google Scholar]
- 84.Ruppert K, Mata JF, Wang HT, et al. XTC MRI: sensitivity improvement through parameter optimization. Magn Reson Med 2007;57(6):1099–1109. [DOI] [PubMed] [Google Scholar]
- 85.Dregely I, Ruset IC, Mata JF, et al. Multiple-exchange-time xenon polarization transfer contrast (MXTC) MRI: initial results in animals and healthy volunteers. Magn Reson Med 2012;67(4):943–953. [DOI] [PMC free article] [PubMed] [Google Scholar]
- 86.Li H, Zhang Z, Zhao X, et al. Quantitative evaluation of pulmonary gas-exchange function using hyperpolarized 129 Xe CEST MRS and MRI. NMR Biomed 2018;31(9):e3961. [DOI] [PubMed] [Google Scholar]
- 87.Sharifi H, Brown S, McDonald GC, Chetty IJ, Zhong H. 4-Dimensional computed tomography-based ventilation and compliance images for quantification of radiation-induced changes in pulmonary function. J Med Imaging Radiat Oncol 2019;63(3):370–377. [DOI] [PubMed] [Google Scholar]
- 88.Guo J, Hardie WD, Cleveland ZI, et al. Longitudinal free-breathing MRI measurement of murine lung physiology in a progressive model of lung fibrosis. J Appl Physiol (1985) 2019;126(4):1138–1149. [DOI] [PMC free article] [PubMed] [Google Scholar]
- 89.Bizino MB, Sala ML, de Heer P, et al. MR of multi-organ involvement in the metabolic syndrome. Magn Reson Imaging Clin N Am 2015;23(1):41–58. [DOI] [PubMed] [Google Scholar]
- 90.Szczykutowicz TP, Malkus A, Ciano A, Pozniak M. Tracking Patterns of Nonadherence to Prescribed CT Protocol Parameters. J Am Coll Radiol 2017;14(2):224–230. [DOI] [PubMed] [Google Scholar]
- 91.Chiles C. Low dose CT screening for lung cancer: moving into the clinical arena. J Thorac Imaging 2015;30(2):77–78. [DOI] [PubMed] [Google Scholar]
- 92.Agostini A, Borgheresi A, Carotti M, et al. Third-generation iterative reconstruction on a dual-source, high-pitch, low-dose chest CT protocol with tin filter for spectral shaping at 100 kV: a study on a small series of COVID-19 patients. Radiol Med (Torino) 2020. 10.1007/s11547-020-01298-5. Published online October 12, 2020. [DOI] [PMC free article] [PubMed]
- 93.Singh R, Digumarthy SR, Muse VV, et al. Image Quality and Lesion Detection on Deep Learning Reconstruction and Iterative Reconstruction of Submillisievert Chest and Abdominal CT. AJR Am J Roentgenol 2020;214(3):566–573. [DOI] [PubMed] [Google Scholar]
- 94.Lee G, Lee HY, Park H, et al. Radiomics and its emerging role in lung cancer research, imaging biomarkers and clinical management: State of the art. Eur J Radiol 2017;86:297–307. [DOI] [PubMed] [Google Scholar]
- 95.Huang Y, Liu Z, He L, et al. Radiomics Signature: A Potential Biomarker for the Prediction of Disease-Free Survival in Early-Stage (I or II) Non-Small Cell Lung Cancer. Radiology 2016;281(3):947–957. [DOI] [PubMed] [Google Scholar]
- 96.Starkov P, Aguilera TA, Golden DI, et al. The use of texture-based radiomics CT analysis to predict outcomes in early-stage non-small cell lung cancer treated with stereotactic ablative radiotherapy. Br J Radiol 2019;92(1094): 20180228. [DOI] [PMC free article] [PubMed] [Google Scholar]
- 97.Fave X, Zhang L, Yang J, et al. Delta-radiomics features for the prediction of patient outcomes in non-small cell lung cancer. Sci Rep 2017;7(1):588. [DOI] [PMC free article] [PubMed] [Google Scholar]
- 98.Wang T, Deng J, She Y, et al. Radiomics Signature Predicts the Recurrence-Free Survival in Stage I Non-Small Cell Lung Cancer. Ann Thorac Surg 2020;109(6):1741–1749. [DOI] [PubMed] [Google Scholar]
- 99.Lee JG, Jun S, Cho YW, et al. Deep Learning in Medical Imaging: General Overview. Korean J Radiol 2017;18(4):570–584. [DOI] [PMC free article] [PubMed] [Google Scholar]
- 100.Chartrand G, Cheng PM, Vorontsov E, et al. Deep Learning: A Primer for Radiologists. RadioGraphics 2017;37(7):2113–2131. [DOI] [PubMed] [Google Scholar]
- 101.Lee SM, Seo JB, Yun J, et al. Deep Learning Applications in Chest Radiography and Computed Tomography: Current State of the Art. J Thorac Imaging 2019;34(2):75–85. [DOI] [PubMed] [Google Scholar]
- 102.Qin C, Schlemper J, Caballero J, Price AN, Hajnal JV, Rueckert D. Convolutional Recurrent Neural Networks for Dynamic MR Image Reconstruction. IEEE Trans Med Imaging 2019;38(1):280–290. [DOI] [PubMed] [Google Scholar]
- 103.Lee SM, Lee JG, Lee G, et al. CT Image Conversion among Different Reconstruction Kernels without a Sinogram by Using a Convolutional Neural Network. Korean J Radiol 2019;20(2):295–303. [DOI] [PMC free article] [PubMed] [Google Scholar]
- 104.Choe J, Lee SM, Do KH, et al. Deep Learning-based Image Conversion of CT Reconstruction Kernels Improves Radiomics Reproducibility for Pulmonary Nodules or Masses. Radiology 2019;292(2):365–373. [DOI] [PubMed] [Google Scholar]
- 105.Dong X, Lei Y, Wang T, et al. Automatic multiorgan segmentation in thorax CT images using U-net-GAN. Med Phys 2019;46(5):2157–2168. [DOI] [PMC free article] [PubMed] [Google Scholar]
- 106.Park J, Yun J, Kim N, et al. Fully Automated Lung Lobe Segmentation in Volumetric Chest CT with 3D U-Net: Validation with Intra- and Extra-Datasets. J Digit Imaging 2020;33(1):221–230. [DOI] [PMC free article] [PubMed] [Google Scholar]
- 107.Park B, Park H, Lee SM, Seo JB, Kim N. Lung Segmentation on HRCT and Volumetric CT for Diffuse Interstitial Lung Disease Using Deep Convolutional Neural Networks. J Digit Imaging 2019;32(6):1019–1026. [DOI] [PMC free article] [PubMed] [Google Scholar]
- 108.Tustison NJ, Avants BB, Gee JC. Learning image-based spatial transformations via convolutional neural networks: A review. Magn Reson Imaging 2019;64:142–153. [DOI] [PubMed] [Google Scholar]
- 109.Hatabu H, Ohno Y, Gefter WB, et al. Expanding Applications of Pulmonary MRI in the Clinical Evaluation of Lung Disorders: Fleischner Society Position Paper. Radiology 2020;297(2):286–301. [DOI] [PubMed] [Google Scholar]
- 110.Schiebler ML, Parraga G, Gefter WB, et al. Synopsis from Expanding Applications of Pulmonary MRI in the Clinical Evaluation of Lung Disorders: Fleischner Society Position Paper. Chest 2020. 10.1016/j.chest.2020.09.075. Published online September 14, 2020. [DOI] [PubMed]
- 111.Weibel ER. Morphometric estimation of pulmonary diffusion capacity. I. Model and method. Respir Physiol. 1970-1971;11(1):54–75. [DOI] [PubMed] [Google Scholar]
- 112.Roos JE, McAdams HP, Kaushik SS, Driehuys B. Hyperpolarized Gas MR Imaging: Technique and Applications. Magn Reson Imaging Clin N Am. 2015; 23(2): 217–229. [DOI] [PMC free article] [PubMed] [Google Scholar]
- 113.Fain S, Schiebler ML, McCormack DG, Parraga G. Imaging of lung function using hyperpolarized helium-3 magnetic resonance imaging: Review of current and emerging translational methods and applications. J Magn Reson Imaging. 2010; 32(6): 1398–1408. [DOI] [PMC free article] [PubMed] [Google Scholar]
- 114.Couch MJ, Ball IK, Li T, et al. Pulmonary ultrashort echo time 19F MR imaging with inhaled fluorinated gas mixtures in healthy volunteers: feasibility. Radiology. 2013; 269(3): 903–909. [DOI] [PubMed] [Google Scholar]
- 115.Boss A, Weiger M, Wiesinger F. Future image acquisition trends for PET/MRI. Semin Nucl Med. 2015; 45(3): 201–211. [DOI] [PubMed] [Google Scholar]
- 116.Alderson PO, Line BR. Scintigraphic evaluation of regional pulmonary ventilation. Semin Nucl Med. 1980; 10(3): 218–242. [DOI] [PubMed] [Google Scholar]
- 117.Ohno Y, Koyama H, Takenaka D, et al. Coregistered ventilation and perfusion SPECT using krypton-81m and Tc-99m-labeled macroaggregated albumin with multislice CT utility for prediction of postoperative lung function in non-small cell lung cancer patients. Acad Radiol. 2007; 14(7): 830–838. [DOI] [PubMed] [Google Scholar]
- 118.Vidal Melo MF, Layfield D, Harris RS, et al. Quantification of regional ventilation-perfusion ratios with PET. J Nucl Med. 2003; 44(12): 1982–1991. [PubMed] [Google Scholar]
- 119.Ohno Y, Fujisawa Y, Takenaka D, et al. Comparison of Xenon-Enhanced Area-Detector CT and Krypton Ventilation SPECT/CT for Assessment of Pulmonary Functional Loss and Disease Severity in Smokers. AJR Am J Roentgenol. 2018; 210(2): W45–W53. [DOI] [PubMed] [Google Scholar]
- 120.Lai LM, Cheng JY, Alley MT, Zhang T, Lustig M, Vasanawala SS. Feasibility of ferumoxytol-enhanced neonatal and young infant cardiac MRI without general anesthesia. J Magn Reson Imaging. 2017; 45(5): 1407–1418. [DOI] [PMC free article] [PubMed] [Google Scholar]
- 121.Mai VM, Chen Q, Bankier AA, Imaging pulmonary blood flow and perfusion using phase-sensitive selective inversion recovery. Magn Reson Med. 2000; 43(6): 793–795. [DOI] [PubMed] [Google Scholar]
- 122.Hatabu H, Tadamura E, Prasad PV, Chen Q, Buxton R, Edelman RR. Noninvasive pulmonary perfusion imaging by STAR-HASTE sequence. Magn Reson Med. 2000; 44(5): 808–812. [DOI] [PubMed] [Google Scholar]
- 123.Besson FL, Fernandez B, Faure S, et al. (18)F-FDG PET and DCE kinetic modeling and their correlations in primary NSCLC: first voxel-wise correlative analysis of human simultaneous [18F]FDG PET-MRI data. EJNMMI Res. 2020; 10(1): 88. [DOI] [PMC free article] [PubMed] [Google Scholar]
- 124.Fukuchi K, Hayashida K, Nakanishi N, et al. Quantitative analysis of lung perfusion in patients with primary pulmonary hypertension. J Nucl Med. 2002; 43(6): 757–761. [PubMed] [Google Scholar]
- 125.Takenaka D, Ohno Y, Koyama H, et al. Co-registered perfusion SPECT/CT: utility for prediction of improved postoperative outcome in lung volume reduction surgery candidates. Eur J Radiol. 2010; 74(3): 465–472. [DOI] [PubMed] [Google Scholar]
- 126.van der Veldt AA, Hendrikse NH, Harms HJ, et al. Quantitative parametric perfusion images using 15O-labeled water and a clinical PET/CT scanner: test-retest variability in lung cancer. J Nucl Med. 2010; 51(11): 1684–1690. [DOI] [PubMed] [Google Scholar]
- 127.Derlin T, Kelting C, Hueper K, et al. Quantitation of Perfused Lung Volume Using Hybrid SPECT/CT Allows Refining the Assessment of Lung Perfusion and Estimating Disease Extent in Chronic Thromboembolic Pulmonary Hypertension. Clin Nucl Med. 2018; 43(6): e170–e177. [DOI] [PubMed] [Google Scholar]
- 128.Le Roux PY, Hicks RJ, Siva S, Hofman MS. PET/CT Lung Ventilation and Perfusion Scanning using Galligas and Gallium-68-MAA. Semin Nucl Med. 2019; 49(1): 71–81. [DOI] [PubMed] [Google Scholar]
- 129.Kim BH, Seo JB, Chae EJ, Lee HJ, Hwang HJ, Lim C. Analysis of perfusion defects by causes other than acute pulmonary thromboembolism on contrast-enhanced dual-energy CT in consecutive 537 patients. Eur J Radiol. 2012; 81(4): e647–652. [DOI] [PubMed] [Google Scholar]
- 130.Masy M, Giordano J, Petyt G, et al. Dual-energy CT (DECT) lung perfusion in pulmonary hypertension: concordance rate with V/Q scintigraphy in diagnosing chronic thromboembolic pulmonary hypertension (CTEPH). Eur Radiol. 2018; 28(12): 5100–5110. [DOI] [PubMed] [Google Scholar]


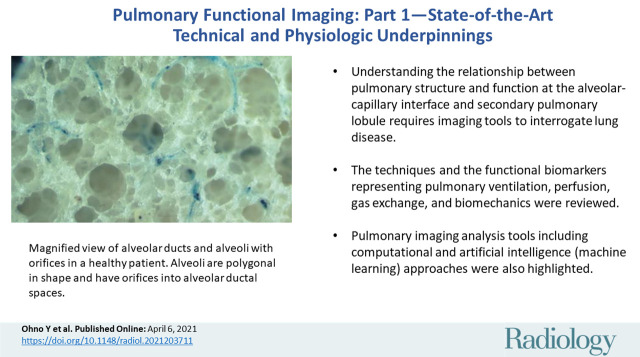
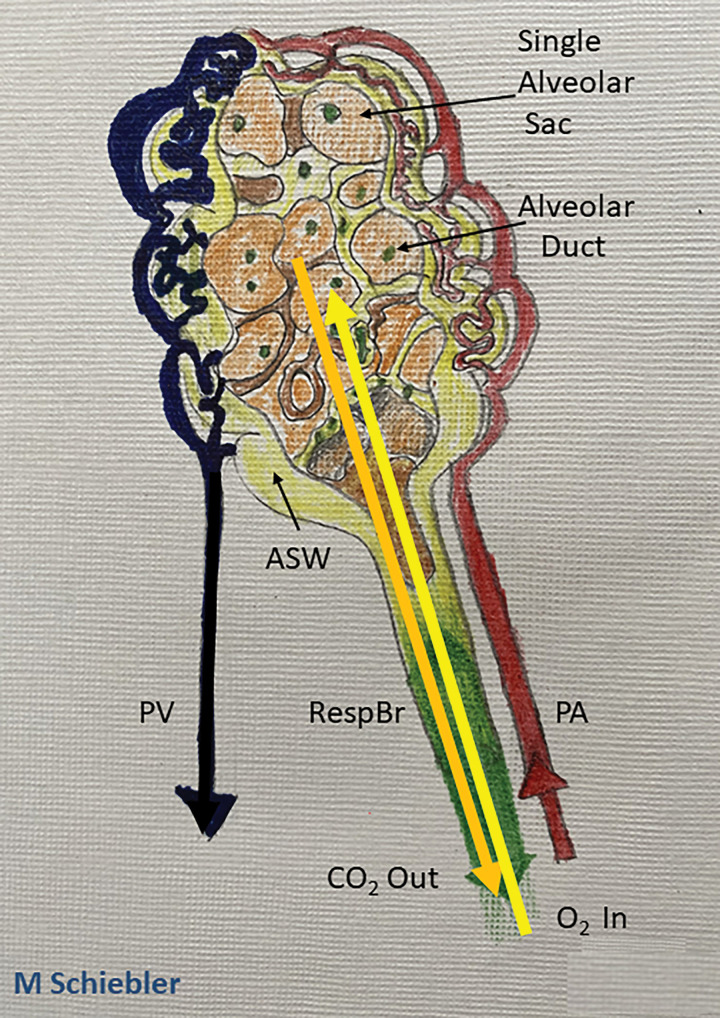
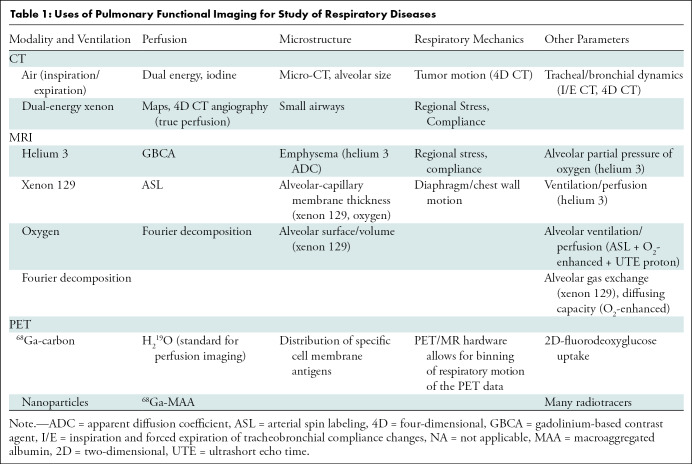
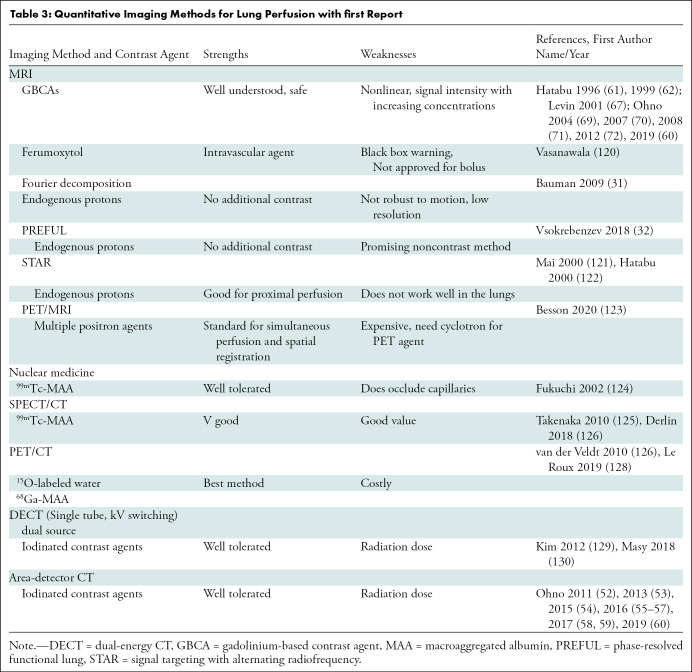
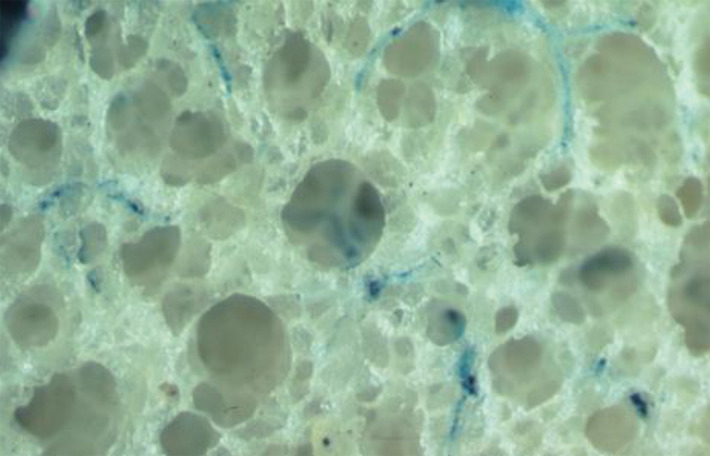
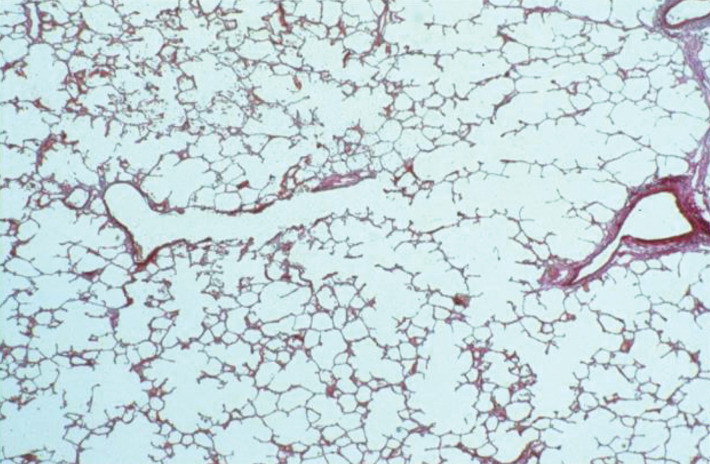
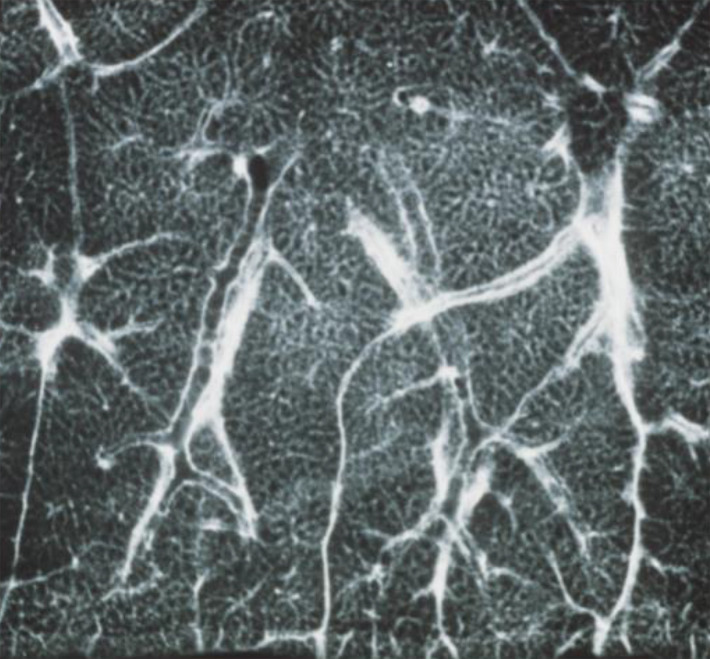
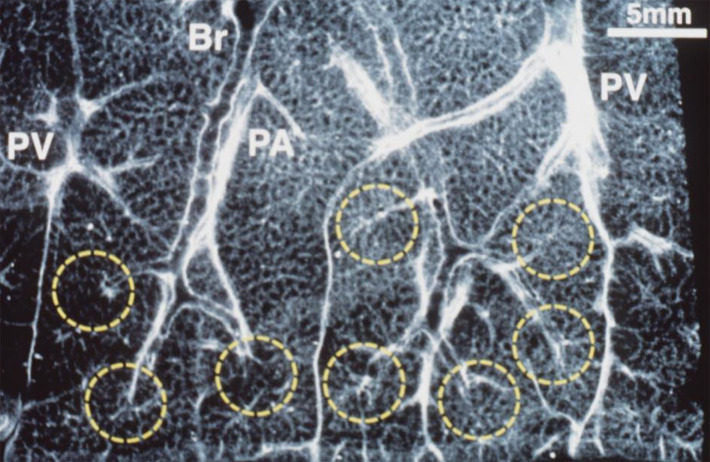
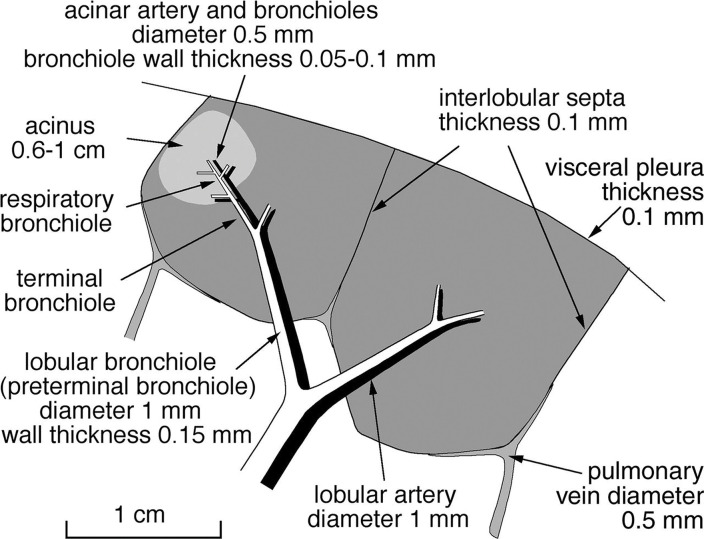
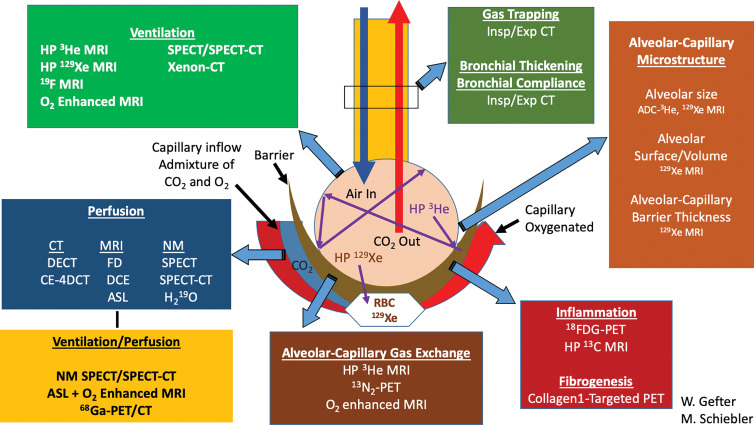
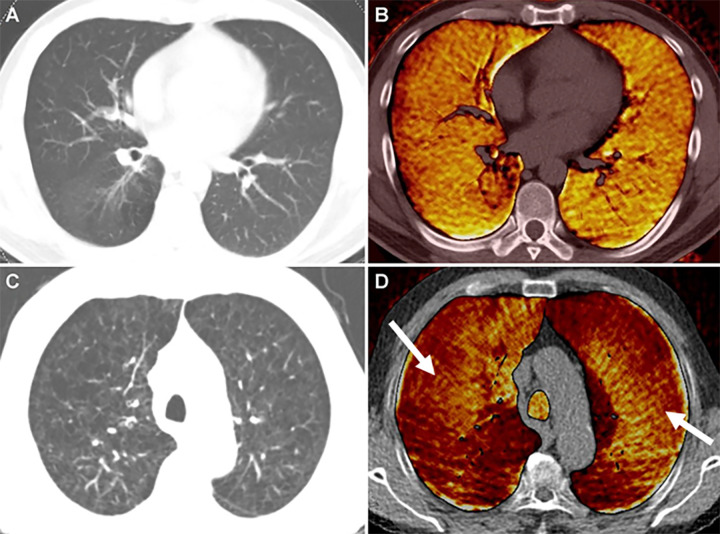
![Images in a 43-year-old male patient with pulmonary emphysema and bullae. A, Thin-section coronal image at lung window setting (left) and quantitatively assessed thin-section multiplanar reconstruction image with density-masked CT technique (right). Emphysematous lung in right upper lung (small arrow) and giant bulla in the left upper lung (large arrow) are clearly demonstrated. On quantitatively assessed thin-section multiplanar reconstruction image, healthy lung appears as green, and emphysematous lung or bullae appears as red with applying threshold value 2950 HU. B, Oxygen-enhanced MRI scan shown as a relative-enhancement map (gray scale, 0% [black] and 50% [white]). Emphysematous lung in right upper lung (small arrow) and giant bulla in the left upper lung (large arrow) are clearly demonstrated as black areas. In addition, the remainder of both lungs are heterogeneously enhanced because of emphysematous lung and airflow limitations.](https://cdn.ncbi.nlm.nih.gov/pmc/blobs/d597/8165947/cbfde9670f28/radiol.2021203711.fig6.jpg)
