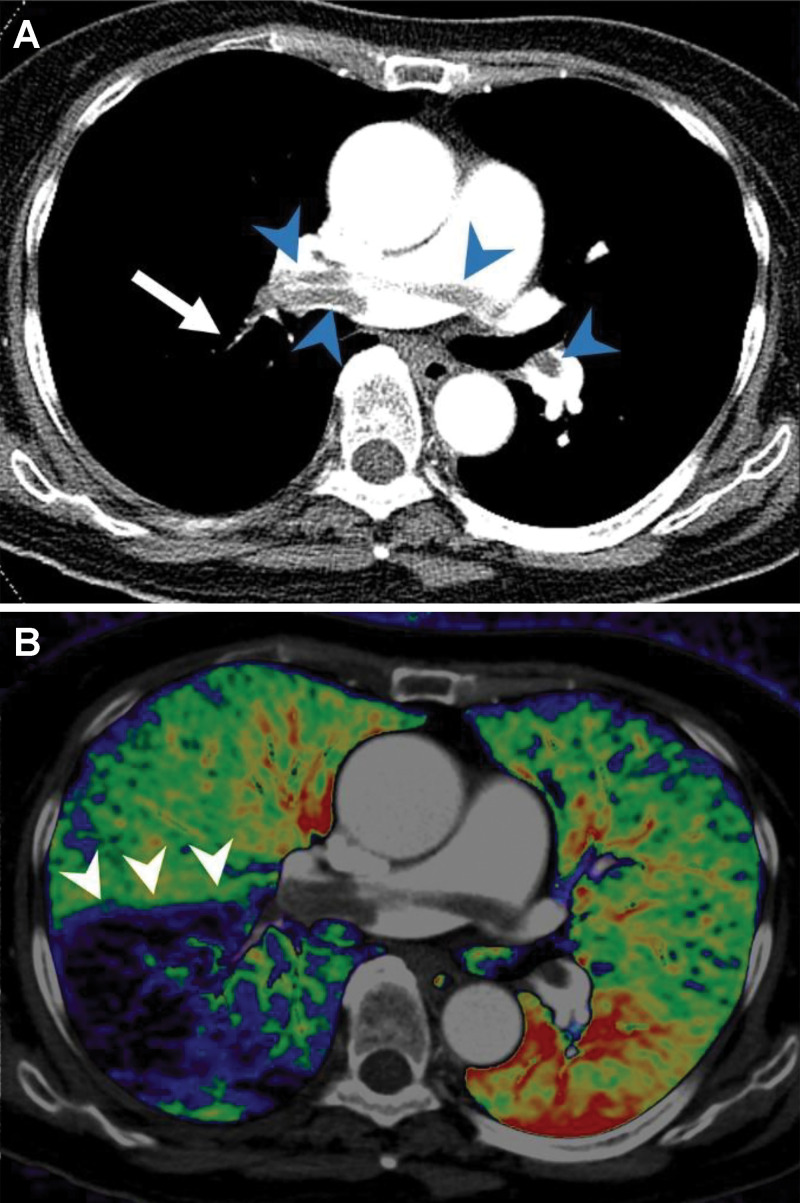
Figure 7:
Example of dual-energy CT angiography in a patient with acute pulmonary embolism. A, Axial CT pulmonary arteriographic image shows saddle emboli in the main pulmonary artery and right and left pulmonary arteries (arrowheads) and small clots in a segmental pulmonary artery in the right lower lobe (arrow). B, Axial fusion image of pulmonary blood volume map of dual-energy CT shows large wedge-shaped perfusion defects in the right lower lobe (arrowheads).

