

Abstract
Crown decline and mortality associated with collar lesions were observed on Carya cathayensis (Chinese hickory) trees in a plantation in Zhejiang province, China. Examination of active lesions resulted in the isolation of a homothallic, papillate Phytophthora sp. Detailed morphological and physiological studies and phylogenetic analysis, using ITS, beta-tubulin, cytochrome oxidase I, and heat shock protein 90 gene regions, revealed that all isolates belonged to an undescribed species residing in phylogenetic Clade 4, which is described here as Phytophthora cathayensis sp. nov. Inoculation trials were conducted under greenhouse conditions on C. cathayensis and C. illinoensis (pecan) plants to fulfill Koch postulates and hypothesize a possible pathway of the incursion. An existing report of a Phytophthora species with the same ITS sequence was reported on C. illinoensis from the USA in 2009. The difference in susceptibility of the two inoculated Carya species, and the report from the USA, suggest a possible introduction with plant material from the USA to China.
Citation: Morales-Rodríguez C, Wang Y, Martignoni D, Vannini A (2020). Phytophthora cathayensis sp. nov., a new species pathogenic to Chinese Hickory (Carya cathayensis) in southeast China. Fungal Systematics and Evolution 7: 99–111. doi: 10.3114/fuse.2021.07.05
Keywords: alien, invasive, global trade, new taxon, oomycetes, pecan, systematics
INTRODUCTION
Carya cathayensis (Chinese hickory) (Juglandaceae) is an economically important nut tree in China. Currently, more than 15 000 ha of C. cathayensis trees are cultivated in Zhejiang Province. Traditional cultivation methods, monoculture of single varieties, over-fertilization, and excessive application of herbicides, have led to the occurrence of serious phytosanitary problems. Recently, trunk canker caused by Botryosphaeria dothidea, has become the most devastating disease of C. cathayensis (Zhang & Xu 2012), and nearly 90 % of orchard trees in Zhejiang Province have been affected by this pathogen (Yang et al. 2009). On the other hand, Carya illinoensis (pecan) is economically the most valuable nut tree native to North America, and is commercially produced in New Mexico, Georgia, Louisiana, and Texas, as well as Mexico. Consumption of pecan nuts in China has boomed since 2008 due to a global walnut shortage and record pecan harvests. However, the supply of Chinese-grown pecan is low and unpredictable, hence, China is the world’s largest market for pecan, and imports 50 000 t of US grown pecan annually to satisfy local demand (Wessel 2011, Zhang & Xu 2012). Carya illinoensis trees were first introduced to China over 100 years ago. However, productive orchards developed rapidly starting in 2008, when the price of pecan nuts soared, and the nuts were more generally accepted by Chinese people. In 2014, there were about 8 500 ha of commercial pecan orchards in China, mainly distributed in Yunnan, Jiangsu, Zhejiang, and Anhui Provinces. Most of the orchards planted with the recommended cultivars ‘Pawnee’, ‘Wichita’, ‘Caddo’, and ‘Jinhua’ are starting to bear and showing potential high yields (Zhang et al. 2015).
China underwent several intentional introductions of C. illinoensis germplasm, seeds, and seedlings from the US since the beginning of 1900, resulting in the establishment of orchards in the same area as those of the native species, C. cathayensis. Furthermore, C. illinoensis, was also utilized in new plantations as rootstock for C. cathayensis scions because of its high resistance to the fungal pathogen Botryosphaeria dothidea. It has been observed that C. cathayensis grafted on C. illinoensis rootstocks are nearly immune to Botryosphaeria canker disease (Yang et al. 2009). Repeated introductions of new germplasm greatly increases the risk of host switches of potential threatening microorganisms between the two hosts. Global trade of plants for planting is, however, recognised as the main pathway for unintentional introductions of alien invasive forest and agricultural pests and pathogens worldwide (Brasier 2008, Scott et al. 2019).
The number of invasive alien pests and pathogens species impacting ecosystem functioning, human health, and economy has increased dramatically over the last decades (Early et al. 2016, Eschen et al. 2019). Globalization and international trade have largely facilitated the unintentional long-distance movement of alien plant pests and pathogens into regions outside their native distribution ranges (Seebens et al. 2017). In the last decades, the use of sentinel plant systems has been reported as a promising tool to improve the detection of pests and pathogens before their introduction (Vettraino et al. 2017a, Morales-Rodríguez et al. 2019a). Among forest pathogens, species from the genus Phytophthora showed a high invasion potential specifically because of their dominance in nurseries and nursery stocks and their high aggressiveness (Jung et al. 2018, Scott et al. 2019).
Phytophthora species are primary pathogens on thousands of trees, shrubs, and crop species worldwide. Depending on whether the lifecycle occurs mainly above- or below-ground, a distinction is made between soilborne Phytophthora species causing fine root losses, root and collar rots and bleeding bark cankers, and airborne Phytophthora species causing leaf necrosis, shoot blights, fruit rots, and also bleeding bark cankers (Erwin & Ribeiro 1996). The number of described Phytophthora species that are associated with woody plants has increased dramatically in the past decade (Hansen et al. 2012, Martin et al. 2012, Scott et al. 2019). New species have been detected either because they were invasive causing severe diseases on new non-coevolved host plants, or because of intensive sampling campaigns, particularly in forest soils and streams (Jung et al. 2013). In the case of Carya species, Phytophthora cactorum is the causal agent of Phytophthora shuck and kernel rot infection of pecan. The disease was first observed in Georgia (USA) in 1988, but the causal agent was only later identified (Reilly et al. 1998).
In August 2016, a severe decline and dieback of C. cathayensis trees was observed in several orchards in the Zhejiang province, China. Affected trees showed dieback of the crown and cankers at the stem base and along roots, with tongue-shaped, orange-brown lesions of the inner bark (Fig. 1). In 2017, during a survey, isolates of a Phytophthora sp. were consistently isolated from the necrotic lesions at the collar of diseased trees (Fig. 1F).
Fig. 1.

A–C. Severe dieback and mortality in Carya cathayensis orchard in Zhejiang province. D. Necrosis descending to the root. E. Edge of a collar rot lesion. F. Collar rot, tongue-shaped, brown-dark orange necrosis of the inner bark.
In the present study, a new Phytophthora species associated with the decline and mortality of C. cathayensis in Zhejiang province is described as Phytophthora cathayensis sp. nov. Furthermore, its pathogenicity to C. cathayensis and C. illinoensis is tested.
MATERIALS AND METHODS
Sampling and Phytophthora isolation
Bark samples including cambium and adjacent xylem tissue were taken from active lesions of eight symptomatic trees using a hatchet, a knife, and a scalpel. The samples were taken to the laboratory and rinsed with running cold tap-water overnight and blotted on filter paper (Jung et al. 1996). Small tissue pieces were cut from different parts and depths of the phloem and xylem samples and plated onto selective PARPNH amended with 10 μg/mL pimaricin, 200 μg/mL ampicillin, 10 μg/mL rifampicin, 25 μg/mL PCNB, 50 μg/mL nystatin and 50 μg/mL hymexazol (Erwin & Ribeiro 1996). The plates were incubated at 20 °C in the dark and examined daily under the dissecting microscope for phytophthora-like hyphae, which were transferred to V8A (16 g agar, 3 g CaCO3, 100 mL Campbell’s V8 juice, 900 mL distilled water) (Erwin & Ribeiro 1996).
At each sampled tree, four soil sub-samples were taken 1–1.5 m apart from the base of a tree in the four cardinal directions and to a soil depth of ca. 30 cm after removing the organic layer. Soils were baited in the laboratory as described by Jung et al. 1996. A mix of different baits including Rhododendron leaf discs, carnation, and rose petals was used. Upon observation of lesions, the baits were plated onto PARPNH selective media. Cultures were stored at 25 °C on V8A for species identification.
Colony morphology, growth rates, and cardinal temperatures
Morphology of hyphae and colony growth patterns were described from 7-d-old cultures grown at 20 °C in the dark on V8A, potato-dextrose-agar (PDA), malt extract agar (MEA), and selective media (PARPHN). Colony morphologies were described according to Erwin & Ribeiro (1996) and Jung & Burgess (2009). For temperature-growth relationships, four replicate V8A plates per isolate were incubated at 10, 15, 20, 25, 27, 30, 32, and 35 °C. All isolates were sub-cultured onto V8A plates and incubated for 24 h at 20 °C to initiate growth. Radial growth rate was recorded after 5–7 d along two lines intersecting the centre of the inoculum at right angles (Hall 1993). When no growth occurred after 5 d, plates were incubated at 25 °C for 5 additional days to determine if the temperature was lethal (Molina et al. 2010). The growth test was repeated twice.
Morphology of sporangia and gametangia
Sporangia were obtained by flooding 15 × 15 mm square agar discs taken from growing margins of 3–5-d-old colonies (Simamorra et al. 2015) with deionized water and with nonsterile soil extract (Erwin & Ribeiro 1996) in 90 mm Petri dishes and incubating them in the dark at 20–25 °C. After 24–36 h, dimensions and characteristic features of 50 mature sporangia per isolate chosen at random were determined at ×400 magnification (Axioskop microscope and AxioCam ERc5s; Carl Zeiss). For each isolate, dimensions and characteristic features of 50 mature oogonia, oospores, and antheridia chosen at random were measured at ×400 magnification at the surface of 15 × 15 mm square agar plug cut from the centre of 15–20-d-old V8A cultures grown in the dark at 20 °C (Simamorra et al. 2015). The oospore wall index was calculated as the ratio between the volume of the oospore wall and the volume of the entire oospore (Dick 1990).
DNA isolation, amplification, and sequencing
The Phytophthora isolates were grown on potato dextrose broth at 20 °C for 2 wk and the mycelium was harvested. Genomic DNA was extracted following the protocol recommended by the NucleoSpin Plant II Mini kit (Macherey Nagel, Germany) following the manufacturers’ instructions. DNA concentration was assessed by gel electrophoresis, and DNA was diluted 1:10 to perform PCR and finally stored at -20 °C (Morales-Rodríguez et al. 2019b). The region spanning the internal transcribed spacer (ITS) region of the ribosomal DNA was amplified using the primers ITS-6 and ITS-4 (White et al. 1990, Cooke et al. 2000). The PCR amplification mixture, PCR conditions, the clean-up of products, and sequencing were as described by Grünwald et al. (2011). The mitochondrial gene cox1 was amplified with primers Fm84 and Fm83 (Martin & Tooley 2003). The PCR amplification mixture was the same as for the ITS region, but the PCR conditions were as described previously (Martin & Tooley 2003). Moreover, beta-tubulin (Btub) and heat shock protein 90 (HSP90) were amplified as indicated in Blair et al. (2008) using the primers Btub-F1/Btub-R1 and HSP90-F1/HSP90-R2. All PCR products were evaluated for successful amplification using agarose gel electrophoresis. Amplicons were purified with NucleoSpin Gel and PCR Cleanup (Macherey Nagel, Germany). Sequencing reactions were performed by Eurofins Scientific (Luxemburg) and forward and reverse sequences assembled and edited using BioEdit v. 7.0.5.3 (Ibis Bioscience, CA, USA).
Phylogenetic analysis
Sequences of Clade 4 taxa were downloaded from GenBank BLAST hits, IDphy (http://idtools.org/id/phytophthora/index.php), and lists in relevant publications on Phytophtora phylogenetic and Clade 4 taxa (Simamora et al. 2015, Bose et al. 2017). Sequences of Phytophthora plurivora (Clade 2) and P. pseudosyringae (Clade 3) were used as outgroups. GenBank accession numbers for the sequences generated here and the source and accession numbers for sequences downloaded are listed in Supplementary Material Table S1 and S2. Sequences were aligned using ClustalW, included in MEGA v. 7, under default settings, all the alignments were inspected and adjusted manually if required (Alignments available at TreeBASE: ID 25838). A Bayesian phylogenetic analysis was done using MrBayes v. 3.2.7a (Ronquist et al. 2012). As reported by Morales-Rodríguez et al. 2019b, evolutionary history was inferred using the maximum-likelihood method based on the general time-reversible model (Nei & Kumar 2000) according to the result obtained using jModelTest v. 2.1.7 (Darriba et al. 2012;). Alignments and maximum likelihood analyses were conducted with MEGA v. 7 (Kumar et al. 2016).
Under-bark inoculation test
The methodology reported by Ginetti et al. 2014 was used for the under-bark inoculation test under greenhouse conditions. One-year-old C. illinoensis (stem diam ca. 8–10 mm) and 2-yr-old C. cathayensis plants (diam ca. 15–20 mm) were used for inoculation trials, 10 plants per Carya species and per isolate. At 5 cm above the collar, a 0.5 cm disc of bark was removed aseptically, an even-sized V8A disc cut from the margin of freshly growing cultures of Phytophthora cathayensis isolates was placed on the wound, covered with the removed bark piece and autoclaved wet gauze, and sealed with Parafilm®. Two isolates were tested. After 10 d, lesion length (mm) and area (mm2) were measured after removal of the outer bark. Re-isolations were made using PARPNH to fulfill Koch’s postulates. The experiment was repeated twice.
Statistical analysis
ANOVA was carried out to determine if morphometric and growth rate differences between isolates were statistically significant. Data normality and equal variances were tested by the Shapiro-Wilk and Bartlett test, respectively. Pathogenicity test data “area of the necrosis” had to be transformed using Ln(x) to get a normal distribution (Sokal & Rohlf 1995). A two-way ANOVA was done with isolate and Carya species as factors. Because of the significant interaction between factors the data were analysed with one-way ANOVA; mean separation was accomplished by Tukey’s honestly significant difference (HDS) test. Statistical analyses were carried out using GraphPad Prism v. 8 (GraphPad Software, San Diego, CA, USA).
RESULTS
Phytophthora isolation
A unique Phytophthora morphotype was isolated from the active lesions on the collar of all C. cathayensis symptomatic trees sampled. The same morphotype was never recovered from the baited soil samples. Three isolates were selected for the species description (CP29, CP30, and CP31).
Phylogenetic analysis
All the gene regions sequenced for P. cathayensis had a maximum of 96 % similarity with described Phytophthora species and, in the case of ITS, a 100 % identity with a non-described Phytophthtora isolate from C. illinoensis in the USA (isolate P168825, GU997621). GenBank accession numbers for all the gene regions sequenced for P. cathayensis are presented on Table S2. According to the result from jModelTest the evolutionary history was inferred by using the Maximum Likelihood method based on the General Time Reversible model (Nei & Kumar 2000). The tree with the highest log likelihood (-7025.85) is shown in Fig. 2. A discrete Gamma distribution was used to model evolutionary rate differences among sites [5 categories (+G, parameter = 0.2259)]. The analysis involved 26 nucleotide sequences. There were a total of 3 402 positions in the final dataset. The species most closely related were P. litchi and P. palmivora.
Fig. 2.

Bayesian tree for Clade 4 Phytophthora species produced from concatenated sequences of the ITS, beta-tubulin, cytochrome oxidase I and heat shock protein 90 gene regions using GTR + G model. Maximum likelihood was conducted on the same dataset with MEGA v. 7 and resulted in the same topology. Numbers above the branches reflect support obtained from the analysis of the same dataset (Bayesian posterior probabilities/Bootstrap values estimated by MEGA v. 7). Phytophthora plurivora (clade 2) and P. pseudosyringae (clade 3) were used as outgroup. The scale bar corresponds to substitutions per nucleotide site.
Taxonomy
Phytophthora cathayensis C. Morales-Rodríguez, Y. Wang & A. Vannini, sp. nov. MycoBank MB834619. Fig. 3.
Fig. 3.

A. Ovoid papillate, laterally inserted sporangia. B. Laterally inserted sporangium with short hyphal appendice. C. Conspicuous basal plugs on empty sporangium. D. Laterally inserted semipapillate sporangium with markedly curved apex and swelling before sporangial base. E. Sporangia produced on the tips of hyphae radiating from a hyphal swelling. F. Globose chlamydospore with thin walls. G. Limoniform sporangium. H. Elongated ovoid semipapillate sporangium. I. Hyphal swelling. J. Paragynous antheridium on an immature oogonium. K. Mature oogonia with thick-walled oospore and two pellucid bodies. L. Oospore germination. M. Mature aplerotic oogonia with think walled oospore and ooplast. N. Aborted oospore. O. Aplerotic and plerotic oospores. Scale bars = 5 μm.
Etymology: Name refers to Carya cathayensis, the host plant from which all isolates were obtained.
Typus: China, Zhejiang, Hangzhou, Lina, Tuankou, isolated from small pieces of cambium and adjacent xylem tissue from Carya cathayensis tree with collar canker, 2017, C. Morales-Rodríguez CP30 (holotype preserved as metabolically inactive culture, China General Microbial Culture Collection, CGMCC No. 19655; ex-type culture, CGMCC No. 19655).
Sporangia (Fig. 3): Papillate persistent sporangia were abundantly produced in distilled water and non-sterile soil extract 8–12 h on simple sporangiophores. Sporangia were rarely observed on solid agar. Semi-papillate sporangia were also occasionally observed. Although predominantly ovoid (90 %, Fig. 3A–C, E), various sporangial shapes were observed including ovoid, elongated ovoid, and limoniform (Fig. 3). Occasionally forming a conspicuous basal plug (Fig. 3C) that protruded into the empty sporangium. Sporangia were typically borne terminally, but some were laterally attached (Fig. 3D–E). Sporangia produced on the tips of radiating hyphae of a hyphal swelling (Fig. 3E) or with short hyphal appendices (Fig. 3B) were common. Sporangia of each isolate released zoospores between 15–20 h after flooding, zoospores were spherical and motile. Sporangia averaged 27.3 ± 4.0 μm in length and 18.6 ± 2.4 μm in breadth (full range), the average length to breadth ratio was 1.5 ± 0.1. The mean papilla dimensions were 5.3 ± 1.1 μm in length and 2.36 ± 0.6 μm in breadth, the average length to breadth ratio was 2.4 ± 0.6 μm. Chlamydospores rarely produced, on average 30.5 ± 3 μm (Fig. 3F). Oogonia, oospores, and antheridia (Fig. 3J–O): Phytophthora cathayensis is homothallic. Gametangia were readily produced in single culture by all isolates. Oogonia terminal at the main hyphae, globose to slightly subglobose with smooth walls. Mean oogonial diameter on V8A was 24.5 ± 1.6 μm (overall range 20.19–28.99 μm;). Oospores were globose with a mean diameter of 22.2 ± 1.3 μm (overall range 18.35–25.23 μm), an average oospore wall thickness of 1.6 ± 0.2 μm, and a mean oospore wall index of 0.2 ± 0.02 (overall range 0.15–0.26). The mean proportion of plerotic oopores was 80.66 %. The percentage of oogonial or oospore abortion was low (15 %). Antheridia mostly lateral and sessile with a short stalk, one per oogonium, attached near the stalk and rarely displaced, paragynous, cylindrical or club-shaped, averaging 11.4 ± 1.3 × 9.4 ± 1.2 μm. Isolates of P. cathayensis formed appressed to submerged colonies with a stellate growth pattern on MEA, stoloniferous felty colonies with submerged margins on PDA and uniform and slightly cottony on PARPNH (Fig. 4). On V8A colony morphology was more variable, ranging from stellate patterns to uniform pattern. Diameters of primary hyphae of P. cathayensis averaged 4.5 ± 0.7 μm and varied from 2.7 to 5.8 μm. All isolates tested had identical cardinal temperatures and similar radial growth rates at all temperatures (Fig. 5). The maximum growth temperature for P. cathayensis was 30 °C. All isolates were unable to grow at 32 °C and did not resume growth when plates previously incubated for 5 d at 32.5 °C were transferred to 25 °C. The optimum temperature for growth was 25 °C with growth rates of 10.2 ± 0.6 mm/d. At 20 °C P. cathayensis showed growth rates of 7.5 ± 0.6 mm/d on V8A, 4.6 ± 0.5 mm/d on PDA, and 5.5 ± 0.2 mm/d on MEA.
Fig. 4.
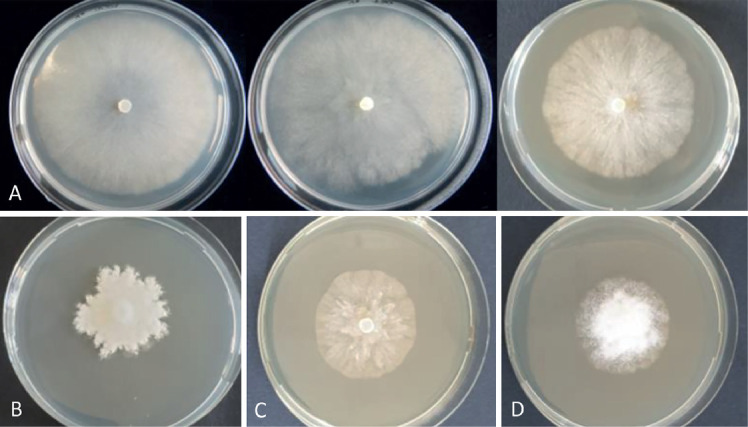
A–D. Colony morphologies of Phytophthora cathayensis sp. nov. Cultures were grown at 20 °C on A (upper line). V8A. B. PDA. C. MEA. D. PARPNH. Photographed 7 d after inoculation.
Fig. 5.

Radial growth rates (mean ± SE) of three isolates of Phytophthora cathayensis on V8 juice agar at different temperatures.
Notes: Phytophthora cathayensis is phylogenetically related to P. litchii and P. palmivora (Fig. 2) although, morphologically, it is easily distinguishable from both species as well as from P. megakarya by having non-caducous sporangia and a homothallic mating system (Table 1). Phytophthora cathayensis produces smaller sporangia with a higher l/b ratio compared to P. alticola, P. arenaria, P. boodjera, and P. quercetorum. Terminal chlamydospores can be produced by P. cathayensis and P. quecetorum but are absent in P. alticola, P. arenaria and P. boodjera (Table 1). The diameter of the oogonium is similar to P. arenaria and smaller than in P. alticola, P. boodjera, and P. quercetorum (Table 1).
Table 1.
Comparison of morphological characters and dimensions, and temperature-growth relations of Phytophthora cathayensis and Phytophthora species within Clade 4.
| Character | P. cathayensis (present study) | P. alticola (Bose et al. 2017) | P. arenaria (Rea et al. 2011) | P. boodjera (Simamora et al. 2015) | P. litchii (idtools.org) | P. megakarya (Erwin & Ribeiro 1996) | P. palmivora (Erwin & Ribeiro 1996) | P. quercetorum (Balci et al. 2008) |
|---|---|---|---|---|---|---|---|---|
| Sporangia (μm) | ||||||||
| LxB mean | 27.3 ± 4.0 × 18.6 ± 2.4 | 37.6 ± 3.2 × 28.8 ± 4.5 | 31.8 ± 4.6 × 23.7 ± 3.5 | 39.2 ± 4.4 × 29.7 ± 3.4 | n/a | 36 × 26 | 45.3 × 29.8 | 40.5 ± 5.7 × 29.7 ± 4 |
| Range of isolates means | 17.7–38 × 13.8–26.6 | 37.9 ± 4.1 × 27.2 ± 4.5 | 28.9–34.8 × 21.4–28.3 | 32.6–44.6 × 24.7–33.3 | 20–33 × 16–22 | 20–60 × 13–41 | 40–60 × 25–35 | 39.1–43.3 × 26.8–32.6 |
| L/B ratio | 1.5 ± 0.1 | 1.28 ± 0.05 | 1.40 ± 0.17 | 1.27 ± 0.16 | n/a | 1.2–1.6 | 1.5 | 1.4 |
| Sporangial characteristics | Papillate, rarely semipapillate | Papillate, frequently bipapillate, rarely bilobed. | Papillate, rarely bi/tripapillate or bilobed | Papillate, rarely bipapillate or bilobed | Papillate | Papillate | Prominently papillate | Papillate and occasionally bipapillate |
| Persistence | Persistent | Persistent | Persistent | Persistent | Caducous with short pedicel | Caducous pedicels of intermediate length (10 to 30 μm) | Caducous with short pedicel (5 μm | Persistent |
| Sporangiophores | Simple sympodia. Often produced on radiating hyphal swelling. Some case laterally attached | Simple or branched sympodia often with bulbous base, very often laterally attached | Simple or branched sympodia often with bulbous base | Simple or branched sympodia often with bulbous base, very often laterally attached | compound sympodial erected sporangiophores that resemble those produced in downy mildews | Loose sympodium | Sympodial sporangiophores | Unbranched and simple sympodial sporangiophores or intercalary in hyphae |
| Sporangia shape | Usually ovoid (90 %), also elongated ovoid and limoniform | Ovoid 87 %, obpyriform 9 %, distorted 4 % | Usually ovoid, also obpyriform or distorted | Ovoid 64 %, Limoniform 20 %, peanut-shaped 10 %, distorted 6 % | Globose, ovoid, ellipsoid | Limoniform, obpyriform or elipsoid | Variable in shape, mostly elliptical to ovoid | Ovoid-elongated, globose and peanut-like distorted shapes infrequently |
| Prolifferation | Absent | Absent | Absent | Absent | n/a | n/a | n/a | n/a |
| Breeding system | Homothallic | Homothallic | Homothallic | Homothallic | Sterile/homothallic | Heterothallic | Heterothallic | Heterothallic |
| Chlamydospores | Rare, terminal, on average 30.5 ± 3 μm | Absent | Absent | Absent | Absent | Present (average 30 μm) | Abundant, terminal or intercalary (32–42 μm) | Chlamydospores rarely produced, in average 30 ± 3 mm |
| Oogonia (μm) | ||||||||
| Mean diameter | 24.5 ± 1.6 | 27.6 ± 1.7 | 25.3 ± 2.2 | 29.4 ± 2.3 | n/a | 26.8 | n/a | 31.5 ± 3 |
| Diameter range | 20–28 | 22.4–30.3 | 19.6–34.3 | 24.3–33.9 | 25–33 x 22–28 | n/a | 22.3–34.8 | 17–40 |
| Oospore (μm) | ||||||||
| Mean diameter | 22.2 ± 1.3 | 24.7 ± 1.9 | 22.3 ± 1.8 | 25.5 ± 1.9 | n/a | na | 22.8 ± 0.1 | 25 ± 2.5 |
| Diameter range | 18–25 | 19.1–29.2 | 16.0–28.3 | 20.92–29.3 | 18–21 | 23–28 | n/a | 14.5–32.5 |
| Wall thickness | 1.6 ± 0.2 | 2.48 ± 0.14 | 2.30 ± 0.34 | 2.47 ± 0.33 | n/a | 1.6 to 3.1 | n/a | 1.9 ± 0.7 |
| Oogonial characteristic | Plerotic and aplerotic oospore. Oogonia terminal, globose to slightly subglobose with smooth walls | Aplerotic oospores, mature oogonia with a slightly wavy surface and golden-brown in colour | Aplerotic oospores, mature oogonia with a slightly wavy surface and golden-brown in colour | Aplerotic oospores, mature oogonia with a slightly wavy surface and golden-brown in colour | Oogonia smooth-walled, globose to ovoid | Plerotic and globose oospore. Oogonium pyriform, tapering at the base to a funnel shape | Aplerotic oospores. Oogonia spherical smooth-walled | Spherical and markedly aplerotic oospores. Oogonia frequently with comma-shaped tapered base |
| Antheridia (μm) | ||||||||
| Position | Paragynous, attached near the stalk and rarely displaced | Paragynous, often with finger-like projections | Paragynous, often with finger-like projections | Paragynous | Amphigynous | Amphigynous | Amphigynous, sometimes with spine or digitate projections | Antheridia paragynous, cylindrical or club-shaped |
| lxb mean | 11.4 ± 1.3 × 9.4 ± 1.2 | 10.2 ± 1.2 × 8.2 ± 1.7 | 11.2 ± 1.7 × 8.4 ± 1.3 | 10.4 ± 1.9 × 8.3 ± 1.5 | n/a | n/a | 12–21 × 13–17 | 11 ± 2.5 × 9 ±1.5 |
| Growth temperatures | ||||||||
| Opt temp (°C) | 25 | 25 | 25 | 30 | 27–28 | 24–26 | 27.5–30 | 22.5 |
| Max temp (°C) | 30 | 30 | 32.5 | 35 | 30 | 29–30 | 35 | 32.5 |
| Min temp (°C) | <10 | 11–14 | 11–14 | 11–14 | 12 | 10-11 | 11 | <10 |
| Lethal temp (°C) | 32 | 35 | n/a | >37.5 | n/a | n/a | n/a | >32.5 |
| Growth rate at optimum (mm/day) | 10.2 (V8A) | 3.50 (V8A) | 5.9–7.4 (V8A) | 9.18 (V8A) | n/a | n/a | n/a | 7.5 (V8A) |
Under-bark inoculation test
Both isolates of P. cathayensis were pathogenic to both C. illinoensis and C. cathayensis plants with C. cathayensis being much more susceptible (Figs 6, 7). The two-way ANOVA showed an interaction between factors (inoculated isolate and species of Carya) for both parameters measured, length of necrosis (interaction F = 9.49; P < 0.05), and area of necrosis (F = 30.85; P < 0.05). Consequently, a separate one-way ANOVA was performed for the individual data sets. Carya cathayensis was significantly more susceptible to P. cathayensis, showing longer necroses and larger necrotic areas than C. illinoensis (F = 87.65; P < 0.05 and F = 101.98; P < 0.05). Because of the low susceptibility of C. illinoensis no difference in the pathogenicity between isolates was found in the two parameters, lesion length (F = 5.70; P > 0.05) and area (F = 0.59; P > 0.05). In contrast, on C. cathayensis isolate CP30 showed greater aggressiveness with significantly higher values in the length of necrosis (F = 61.30; P < 0.05) and in the area of necrosis (F = 140.99; P < 0.05).
Fig. 6.

Necrotic lesions caused by Phytophthora cathayensis (isolate CP30) in the under-bark inoculation trial after 10 d 25 °C: on A. Carya illinoensis and B. Carya cathayensis. Scale bars = 1 cm.
Fig. 7.

Mean of length of necrosis (left) and area of the necrosis (right) caused by Phytophthora cathayensis isolates on Carya illinoensis and C. cathayensis 7 d post inoculation. Different letters indicate significant differences at P < 0.05, according to Tukey’s post-hoc test. Vertical bars indicate standard deviation.
DISCUSSION
Phytophthora cathayensis is described here based on physiological, morphological, and phylogenetic analyses. All these analyses strongly support the designation of the new species P. cathayensis within Phytophthora Clade 4.
With the same tree topology, the results presented here are consistent with previous phylogenetic studies obtained for the genus Phytophthora (Yang et al. 2017), and those specific to clade 4 (Balci et al. 2008, Simamora et al. 2015, Bose et al. 2017). It is possible to differentiate a consistent group formed by P. quercetorum, P. arenaria, P. boodjera, and P. alticola from which P. megakarya is separated. An additional group includes P. cathayensis, P. litchii, and P. palmivora. This group, although well-defined by the Bayesian posterior probabilities values, presents low bootstrap values in maximum likelihood. According to Russo & Selvatti (2018), the bootstrap test supports the repeatability of the data; that is, the probability of retrieving the same clade using an independent data set (other molecular markers, morphology, etc.). Looking at the results obtained from the analysis of the markers separately (Fig. S1), it is evident how the position of this “sub-clade” varies. A more phylogenetically in-depth study including a larger number of isolates is necessary to study the possible existence of different subclades within Clade 4.
Clade 4 represents species of Phytophthora with different hosts and diverse origins. Phytophthora boodjera has only been found in Western Australia (WA) and has mostly been isolated from dead and dying eucalypt seedlings in plant production nurseries in disturbed urban landscapes. It has been isolated from natural ecosystems on only three occasions (from Banksia media, B. grandis, and Corymbia calophylla) and currently it is considered to be an introduced species (Simamora et al. 2015). Phytophthora arenaria (Rea et al. 2011) has been recovered exclusively from natural Kwongan vegetation on the coastal sand plains of south-west Australia, and it has been suggested to be native to WA. Phytophthora alticola has been isolated as a pathogen of cold-tolerant Eucalyptus species and from Acacia mearnsii plantations, and it is probably native to South Africa (Bose et al. 2017). Phytophthora quercetorum has been reported from North America where it was isolated from the soil rhizosphere, and is associated with oak (Balci et al. 2008). Phytophthora megakarya is an oomycete plant pathogen that causes black pod disease in cocoa trees in west and central Africa (Opoku et al. 2000). Phytophthora palmivora is a cosmopolitan pathogen with a wide host range, including some very important economic crops such as cacao, papaya, black pepper, rubber, coconut, and citrus. The centre of origin is believed to be southeastern Asia (McHaw & Coffey 1994). Phytophthora litchi, formerly Peronophythora litchi, has been reported causing blossom blight on Litchi chinensis in Taiwan (Ann et al. 2012), China (Yu 1998), Vietnam (Vien et al. 2001) and Japan (Kobayashi 2007) and on Euphoria longana in Taiwan (Ann et al. 2012).
The inoculation trials fulfilled Koch’s postulates. Phytophthora cathayensis was slightly aggressive to C. illinoensis, but showed high aggressiveness to C. cathayensis. The internal transcribed spacer sequence of P. cathayensis shared 100 % identity with an undescribed Phytophthora sp. P16825 in the World Phytophthora Genetic Resource Collection (WPC), isolated from C. illinoensis in Georgia in 2009. It was isolated specifically from pecan shuck which surrounds the nut (https://chassintranet.ucr.edu/phyto/#/productDetails/5035). Carya illinoensis is cultivated for its seed in the southern USA, primarily in Georgia, and in Mexico, which produces nearly half of the world’s total production. Georgia is the largest pecan (from Carya illinoensis) producing state in the USA, accounting for approximately 30 % of national production (Wells 2014). Nowadays commercial C. illinoensis orchards in China are mainly distributed in Yunnan, Jiangsu, Zhejiang, and Anhui Provinces, areas that overlap with the traditional cultivation of C. cathayensis. Approximately 90 % of pecan processing in China is done in Lin’an, a city in Zhejiang Province, the origin of C. cathayensis (Yang et al. 2009) where P. cathayensis was isolated.
“Darwinian evolution predicts that being adapted to and co-evolved with their hosts, many of these pathogens are unlikely to do noticeable damage in their native ecosystems, and so are less likely to be detected” (Brasier 2008). Plant and microorganisms in the same natural environment have evolved together in association. These microorganisms often cause little noticeable damage to their host plants, having developed a natural balance through co-evolution. However, when a microorganism is introduced to another region of the world, important problems may arise where native plants have little resistance and the pathogen has eluded its natural enemies (Vettraino et al. 2017a). In the Chinese orchards of C. cathayensis sampled during this study, it is possible to observe a severe decline and high tree mortality due to P. cathayensis. Although Phytophthora are important forest pathogens, the present disease has not yet been described or reported in C. illinoensis orchards elsewhere in the world, not even in the USA where it seems probable that P. cathayensis was isolated for the first time. Furthermore, the pathogenicity analyses performed in this study showed that C. illinoensis is much less susceptible to P. cathayensis than C. cathayensis. Alien pathogens often enter into new countries on either non-hosts or unknown hosts, on infected but asymptomatic hosts, or associated commodities (Vettraino et al. 2017a). According to Darwinian theory, it can be that C. illinoensis is a natural host of P. cathayensis, and due to their co-evolution, the disease is not that noticeable. According to this assumption, it is likely that P. cathayensis was introduced unnoticed with exotic propagation material of C. illinoensis from the USA, with a subsequent host shift to C. cathayensis. However, more detailed studies are required to clarify the centre of origin of P. cathayensis based on genotypic and phenotypic variability between and within the populations at the putative center of origin and area of invasion (Vettraino et al. 2017b, Scott et al. 2019).
ACKNOWLEDGEMENTS
Travel expenses of CMR were supported by COST Action Global Warning (FP1401) with a short-term mission to Zhejiang Agriculture and Forestry University in Lin’an, China. Additional funding for this research was provided by a grant from the Zhejiang Key Research and Development Program of China (2019C0203002).
Footnotes
Conflict of interest: The authors declare that there is no conflict of interest.
Supplementary Material: http://fuse-journal.org/
Maximum likelihood phylogenies of individual genes A. ITS; B. heat shock protein 90; C. β-tubulin and D. cytochrome oxidase I for Clade 4 Phytophthora species. Numbers above the branches reflect support obtained from the analysis of the same dataset (Bayesian posterior probabilities/Bootstrap values estimated by MEGA v. 7).
GenBank accession numbers for sequences used in multi-locus analyses.
GenBank accession numbers for all the gene regions sequenced for Phytophthora cathayensis.
REFERENCES
- Ann PJ, Tsai JN, Yang HR. (2012). First report of leaf and stem downy blight of longan seedlings caused by Peronophythora litchii in Taiwan. Plant Disease 96: 1224. [DOI] [PubMed] [Google Scholar]
- Balci Y, Balci S, Blair JE, et al. (2008). Phytophthora quercetorum sp. nov., a novel species isolated from eastern and north-central USA oak forest soils. Mycological Research 112: 906–916. [DOI] [PubMed] [Google Scholar]
- Blair JE, Coffey MD, Park S-Y, et al. (2008). A multi-locus phylogeny for Phytophthora utilizing markers derived from complete genome sequences. Fungal Genetics and Biology 45: 266–277. [DOI] [PubMed] [Google Scholar]
- Bose T, Burgess TI, Roux J, et al. (2017). Phytophthora alticola; emended description based on new collections and a neotype. Sydowia 69: 161–170. [Google Scholar]
- Brasier C. (2008). The biosecurity threat to the UK and global environment from international trade in plants Plant Pathology 57: 792–808. [Google Scholar]
- Cooke D, Drenth A, Duncan J, et al. (2000). A molecular phylogeny of Phytophthora and related oomycetes Fungal Genetics and Biology 30: 17–32. [DOI] [PubMed] [Google Scholar]
- Darriba D, Taboada GL, Doallo R, et al. (2012). jModelTest 2: more models, new heuristics and parallel computing. Nature Methods 9: 772–772. [DOI] [PMC free article] [PubMed] [Google Scholar]
- Dick MW. (1990). Keys to Pythium. University of Reading Press, Reading, UK. [Google Scholar]
- Early R, Bradley BA, Dukes JS, et al. (2016). Global threats from invasive alien species in the twenty-first century and national response capacities. Nature Communications 7: 1–9. [DOI] [PMC free article] [PubMed] [Google Scholar]
- Erwin DC, Ribeiro OK. (1996). Phytophthora Diseases Worldwide. APS Press, St. Paul, Minnesota. [Google Scholar]
- Eschen R, De Groot M, Glavendekić M, et al. (2019). Spotting the pests of tomorrow – Sampling designs for detection of species associations with woody plants. Journal of Biogeography 46: 2159–2173. [Google Scholar]
- Ginetti B, Moricca S, Squires J, et al. (2014). Phytophthora acerina sp. nov., a new species causing bleeding cankers and dieback of Acer pseudoplatanus trees in planted forests in northern Italy. Plant Pathology 63: 858–876. [Google Scholar]
- Grünwald NJ, Martin FN, Larsen M, et al. (2011). Phytophthora-ID. org: a sequence-based Phytophthora identification tool. Plant Disease 95: 337–342. [DOI] [PubMed] [Google Scholar]
- Hall G. (1993). An integrated approach to the analysis of variation in Phytophthora nicotianae and a redescription of the species. Mycological Research 97: 559–574 [Google Scholar]
- Hansen EM, Reeser PW, Sutton W. (2012). Phytophthora beyond agriculture. Annual Review of Phytopathology 50: 359–378 [DOI] [PubMed] [Google Scholar]
- Jung T, Blaschke H, Neumann P. (1996). Isolation, identification and pathogenicity of Phytophthora species from declining oak stands. European Journal of Forest Pathology 26: 253–272. [Google Scholar]
- Jung T, Burgess T. (2009). Re-evaluation of Phytophthora citricola isolates from multiple woody hosts in Europe and North America reveals a new species, Phytophthora plurivora sp. nov. Persoonia 22: 95–110. [DOI] [PMC free article] [PubMed] [Google Scholar]
- Jung T, Pérez-Sierra A, Durán A, et al. (2018). Canker and decline diseases caused by soil- and airborne Phytophthora species in forests and woodlands. Persoonia 40: 182–220. [DOI] [PMC free article] [PubMed] [Google Scholar]
- Jung T, Vettraino AM, Cech T, et al. (2013). The impact of invasive Phytophthora species on European forests. In: Phytophthora: a global perspective (Lamour K. ed.) Vol 2. CABI; Wallingford, UK: 146–158. [Google Scholar]
- Kobayashi T. (2007). Index of fungi inhabiting woody plants in Japan. Host, Distribution and Literature. Zenkoku-Noson-Kyoiku Kyokai Publishing Co., Ltd. [Google Scholar]
- Kumar S, Stecher G, Tamura K. (2016). MEGA7: molecular evolutionary genetics analysis version 7.0 for bigger datasets. Molecular Biology and Evolution 33: 1870–1874. [DOI] [PMC free article] [PubMed] [Google Scholar]
- Martin FN, Abad ZG, Balci Y, et al. (2012). Identification and detection of Phytophthora: reviewing our progress, identifying our needs. Plant Disease 96: 1080–1103. [DOI] [PubMed] [Google Scholar]
- Martin FN, Tooley PW. (2003). Phylogenetic relationships among Phytophthora species inferred from sequence analysis of mitochondrially encoded cytochrome oxidase I and II genes. Mycologia 95: 269–284. [PubMed] [Google Scholar]
- McHaw GR, Coffey MD. (1994). Isozyme diversity in Phytophthora palmivora: evidence for a southeast Asian centre of origin. Mycological Research 98: 1035–1043. [Google Scholar]
- Molina MR, Rodríguez MM, Osorio CP, et al. (2010). Phytophthora nicotianae, the causal agent of root and crown rot (Tristeza disease) of red pepper in La Vera region (Cáceres, Spain). Spanish Journal of Agricultural Research 3: 770–774. [Google Scholar]
- Morales-Rodríguez C, Anslan S, Auger-Rozenberg MA, et al. (2019a). Forewarned is forearmed: Techniques and diagnostic approach for early detection of potentially invasive pests and pathogens in sentinel plantings. NeoBiota 47: 95–123. [Google Scholar]
- Morales-Rodríguez C, Dalla Valle M, Aleandri M, et al. (2019b). Pestalotiopsis biciliata, a new leaf pathogen of Eucalyptus spp. recorded in Italy. Forest Pathology 49: e12492. [Google Scholar]
- Nei M, Kumar S. (2000). Molecular evolution and phylogenetics. Oxford university press. [Google Scholar]
- Opoku IY, Appiah AA, Akrofi AY, et al. (2000). Phytophthora megakarya: a potential threat to the cocoa industry in Ghana. Ghana Journal of Agricultural Science 33: 237–248. [Google Scholar]
- Reilly C, Hotchkiss M, Hendrix FF. (1998). Phytophthora shuck and kernel rot, a new disease of pecan caused by Phytophthora cactorum. Plant Disease 82: 347–349. [DOI] [PubMed] [Google Scholar]
- Rea AJ, Burgess TI, Hardy GESJ, et al. (2011). Two novel and potentially endemic species of Phytophthora associated with episodic dieback of Kwongan vegetation in the south-west of Western Australia. Plant Pathology 60: 1055–1068. [Google Scholar]
- Ronquist F, Teslenko M, Van Der Mark P, et al. (2012). MrBayes 3.2: efficient Bayesian phylogenetic inference and model choice across a large model space. Systematic Biology 61: 539–542. [DOI] [PMC free article] [PubMed] [Google Scholar]
- Russo CADM, Selvatti AP. (2018). Bootstrap and rogue identification tests for phylogenetic analyses. Molecular Biology and Evolution 35: 2327–2333. [DOI] [PubMed] [Google Scholar]
- Seebens H, Blackburn TM, Dyer EE, et al. (2017). No saturation in the accumulation of alien species worldwide. Nature Communications 8: 1–9. [DOI] [PMC free article] [PubMed] [Google Scholar]
- Scott P, Bader M, Burgess TI, et al. (2019). Global biogeography and invasion risk of the plant destroyer genus Phytophthora. Environmental Science and Policy 101: 175–182. [Google Scholar]
- Simamora AV, Stukely MJ, Hardy GE, et al. (2015). Phytophthora boodjera sp. nov., a damping-off pathogen in production nurseries and from urban and natural landscapes, with an update on the status of P. alticola. IMA Fungus 6: 319–335. [DOI] [PMC free article] [PubMed] [Google Scholar]
- Sokal RR, Rohlf F. (1995). Biometry: The principles and practice of statistics in biological research. W. H. Freeman and Company, USA: NY. [Google Scholar]
- Wells L. (2014). Pecan Planting Trends in Georgia. HortTechnology 24: 475. [Google Scholar]
- Wessel D. (2011). Shell shock: Chinese demand reshapes US pecan business. Wall Street Journal: April 18, 2011. [Google Scholar]
- Vettraino AM, Li HM, Eschen R, et al. (2017). The sentinel tree nursery as an early warning system for pathway risk assessment: Fungal pathogens associated with Chinese woody plants commonly shipped to Europe. PloS One 12: 11. [DOI] [PMC free article] [PubMed] [Google Scholar]
- Vettraino AM, Brasier C, Webber JF, et al. (2017b). Contrasting microsatellite diversity in the evolutionary lineages of Phytophthora lateralis. Fungal Biology 121: 112–126. [DOI] [PubMed] [Google Scholar]
- Vien NV, Benyon L, Trung HM, et al. (2001). First record of Peronophythora litchii on litchi fruit in Vietnam. Australasian Plant Pathology 30: 287–288. [Google Scholar]
- White TJ, Bruns T, Lee S, et al. (1990). Amplification and direct sequencing of fungal ribosomal RNA genes for phylogenetics. In: PCR protocols: a guide to methods and applications. (Innis MA, Gelfand DH, Sninsky JJ, et al., eds.). San Diego, California: Academic Press: 315–332. [Google Scholar]
- Yang S, Ding L, Lou J, et al. (2009). Occurrence regularity of Carya cathayensis canker disease and its control. Journal of Zhejiang Forestry College 26: 228–232. [Google Scholar]
- Yang X, Tyler BM, Hong C. (2017). An expanded phylogeny for the genus Phytophthora. IMA Fungus 8: 355–384. [DOI] [PMC free article] [PubMed] [Google Scholar]
- Yu Y. Ed. (1998). Flora Fungorum Sinicorum. Vol. 6. Peronosporales. Science Press, Beijing. [Google Scholar]
- Zhang C, Xu B. (2012). First peport of canker on Chinese hickory (Carya cathayensis) caused by Botryosphaeria dothidea in China. Plant Disease 96: 152–152. [DOI] [PubMed] [Google Scholar]
- Zhang R, Peng F, Li Y. (2015). Pecan production in China. Scientia Horticulturae 197: 719–727. [Google Scholar]
Associated Data
This section collects any data citations, data availability statements, or supplementary materials included in this article.
Supplementary Materials
Maximum likelihood phylogenies of individual genes A. ITS; B. heat shock protein 90; C. β-tubulin and D. cytochrome oxidase I for Clade 4 Phytophthora species. Numbers above the branches reflect support obtained from the analysis of the same dataset (Bayesian posterior probabilities/Bootstrap values estimated by MEGA v. 7).
GenBank accession numbers for sequences used in multi-locus analyses.
GenBank accession numbers for all the gene regions sequenced for Phytophthora cathayensis.