Abstract
Purpose
To test the hypothesis that artificial intelligence (AI) techniques can aid in identifying and assessing lesion severity in the cartilage, bone marrow, meniscus, and anterior cruciate ligament (ACL) in the knee, improving overall MRI interreader agreement.
Materials and Methods
This retrospective study was conducted on 1435 knee MRI studies (n = 294 patients; mean age, 43 years ± 15 [standard deviation]; 153 women) collected within three previous studies (from 2011 to 2014). All MRI studies were acquired using high-spatial-resolution three-dimensional fast-spin-echo CUBE sequence. Three-dimensional convolutional neural networks were developed to detect the regions of interest within MRI studies and grade abnormalities of the cartilage, bone marrow, menisci, and ACL. Evaluation included sensitivity, specificity, and Cohen linear-weighted ĸ. The impact of AI-aided grading in intergrader agreement was assessed on an external dataset.
Results
Binary lesion sensitivity reported for all tissues was between 70% and 88%. Specificity ranged from 85% to 89%. The area under the receiver operating characteristic curve for all tissues ranged from 0.83 to 0.93. Deep learning–assisted intergrader Cohen ĸ agreement significantly improved in 10 of 16 comparisons among two attending physicians and two trainees for all tissues.
Conclusion
The three-dimensional convolutional neural network had high sensitivity, specificity, and accuracy for knee-lesion-severity scoring and also increased intergrader agreement when used on an external dataset.
Supplemental material is available for this article.
Keywords: Bone Marrow, Cartilage, Computer Aided Diagnosis (CAD), Computer Applications-3D, Computer Applications-Detection/Diagnosis, Knee, Ligaments, MR-Imaging, Neural Networks, Observer Performance, Segmentation, Statistics
© RSNA, 2021
See also the commentary by Li and Chang in this issue.
An earlier incorrect version of this article appeared online. This article was corrected on April 16, 2021.
Summary
Deep learning–driven severity staging achieved high sensitivity and specificity for binary and multiclass classification for multiple tissues of the knee, reduced interreader variability, and demonstrated the potential to aid in clinical workflows.
Key Points
■ Deep learning models achieved binary lesion sensitivity between 85% and 88% for all tissues (cartilage, bone marrow, meniscus, and anterior cruciate ligament) except bone marrow edema (BME) lesions (70%), with areas under the curve for all tissues that ranged from 0.83 to 0.93.
■ The hierarchic three-dimensional convolutional model enabled multiclass lesion assessment sensitivity per class that was between 71% and 97% for all tissues in abnormal classes except for BME (54% and 43% per-class sensitivity).
■ Use of model assistance improved ĸ agreement in a comparison between two trainees and two attending radiologists for the four tissue types.
Introduction
Knee abnormalities due to osteoarthritis or from injury have a major negative impact on health-related quality of life (1,2) and represent a substantial economic burden, mainly due to time lost from employment and leisure (3). MRI has improved our understanding of the morphologic and biochemical features contributing to the development of this disease. Semiquantitative MRI grading systems are widely used for quantifying the severity of knee abnormalities, including the MRI Osteoarthritis Knee Score (4) and the Whole-Organ MRI Score (WORMS) (5). Both of these scoring systems have also been used for longitudinal research studies such as the seminal Osteoarthritis Initiative (6,7). Derivatives of these grading systems (7) have also been adopted, but despite being widely used, semiquantitative grading systems are time-consuming, and reading accuracy varies depending on the clinician’s expertise. The need for reliable interrater agreement, along with faster analysis, calls for an assistive tool for knee grading.
The recent development of deep learning (DL) and DL methods has facilitated clinical decision support for reading echocardiograms (8), chest radiographs (9,10), and MR images (11). Similar methods have been used to infer the presence of lesions for the meniscus and articular cartilage (12–15). Although most previous artificial intelligence (AI)–based efforts focus on single-tissue and binary abnormality classification, knee grading involves multiple tissues and is complex. Very few studies take severity staging into account (12), which is important because patient treatment differs according to the severity of the encountered abnormalities. There is a paucity of research on methods for evaluating how AI models could be used in clinical practice or for quantifying the benefit of using such assistive tools in staging the severity of knee abnormalities. This study aims to bridge this gap by proposing a DL-based three-dimensional (3D) knee MRI processing pipeline able to thoroughly detect extent of bone, meniscus, chondral, and ligament structures and determine a WORMS-based inference about their respective pathologic conditions. The goal of this study was to develop models to identify the presence of lesions and assess lesion severity in the cartilage, meniscus, bone marrow, and ligaments. We then tested the hypotheses that automated AI model assessments can be used by radiologists as an aid system during grading and that such a system could reduce interreader variability.
Materials and Methods
This study was partially funded by GE Healthcare, the National Institutes of Health, and the National Institute of Arthritis and Musculoskeletal and Skin Diseases through contract grant numbers R61AR073552 (to S.M., V.P.), R00AR070902 (to V.P.), and P50AR060752 (to S.M.).
Patient Selection
The present retrospective study was based on a dataset composed of 1435 knee MRI studies from 294 patients with and without osteoarthritis and/or anterior cruciate ligament (ACL) injury. All patients signed written informed consent approved by the committee on human research of the home institution. The study was approved by the institutional review board. Distributions of patient demographics were as follows: mean age, 43 years ± 15; body mass index, 24.28 kg/m2 ± 3.22; and 52% (153 of 294) women. Three retrospective studies compose our dataset. In the first study, patients who were at least 35 years old were recruited, and exclusion criteria were as follows: concurrent use of an investigational drug, fracture or surgical intervention in the study knee, and any contraindications to MRI (n = 169). Additional patients were included from two other studies that followed patients after ACL injury and surgical reconstruction up to 3 years after surgery (n = 61 and n = 64). Such patients underwent anatomic single-bundle ACL reconstruction by board-certified, fellowship-trained orthopedic surgeons. Only soft-tissue grafts were used; for the hamstrings, allografts, autografts, or posterior tibialis allografts were used. Patients in the ACL cohort were recruited at three sites: the University of California, San Francisco (San Francisco, Calif), the Hospital for Special Surgery (New York City, NY), and the Mayo Clinic (Rochester, Minn).
Images composing these datasets were acquired under the National Institutes of Health–National Institute of Arthritis and Musculoskeletal and Skin Diseases grants P50AR060752 and R01AR046905. Publications connected to these grants used many different portions of each study, as these publications had distinct goals and scopes and considered diverse outcomes. Examples include evaluating relaxation time under different knee-loading conditions on patients with osteoarthritis and detecting cartilage change due to ligament injury. The same dataset was used within a similar scope by Pedoia et al (12), although their focus was on detecting patellar cartilage lesions and meniscus abnormalities, and by Namiri et al (16), who focused exclusively on the ACL. Neither study presented a comprehensive evaluation of the joint or applications to the clinical workflow, as we do here.
MRI Acquisition
All images were collected between 2011 and 2014 during three previous studies, and images were obtained using 3-T GE Discovery 750HD MRI scanners (GE Healthcare) with eight surface coils. All studies used a high-resolution 3D fast-spin-echo CUBE sequence with the following parameters: repetition time, 1500 msec; echo time, 26.69 msec; field of view, 14 cm; acquisition matrix, 384 × 384; section thickness, 0.5 mm; echo-train length, 32; bandwidth, 50.0 kHz; number of signals acquired, 0.5; and acquisition time, 10.5 minutes with no zero filling. The images were then resampled in the magnitude space to a 512 × 512 matrix.
Image Assessment
Five board-certified radiologists (T.M.L., M.B., with over 5 years of training each) graded nonoverlapping portions of the dataset between 2011 and 2014. Readers were trained by one senior radiologist (T.M.L. with >25 years of experience) who read at least 20 imaging studies with each of the other radiologists in two imaging sessions. For each anatomic structure, a corresponding simplified severity class was defined according to the WORMS grades assigned by radiologists. These three classes are similar to those used in radiologic reports (17,18) and were used as the ground truth during training and evaluation. We used 11 regions of interest (ROIs) consisting of six cartilage compartments (the medial and lateral femoral condyles, medial and lateral tibia, and patella and trochlea), four meniscus compartments (the medial and lateral compartments of the anterior and posterior horn menisci), and the ACL.
The impact of using AI models on intergrader agreement was evaluated over 50 3D clinical MRI cases from an external dataset we call the external clinical dataset (age 40 years ± 15; weight, 67.44 kg ± 15.92; 29 women). Selection of patients was exclusively based on the presence of a 3D, fast-spin-echo CUBE protocol in any clinical patient studies acquired at the University of California, San Francisco, in the last 10 years, and no restrictions on specific image parameters or resolution were applied. This search yielded 1786 patients, 50 of whom were randomly chosen for this evaluation.
Data Processing and DL Classification Pipeline
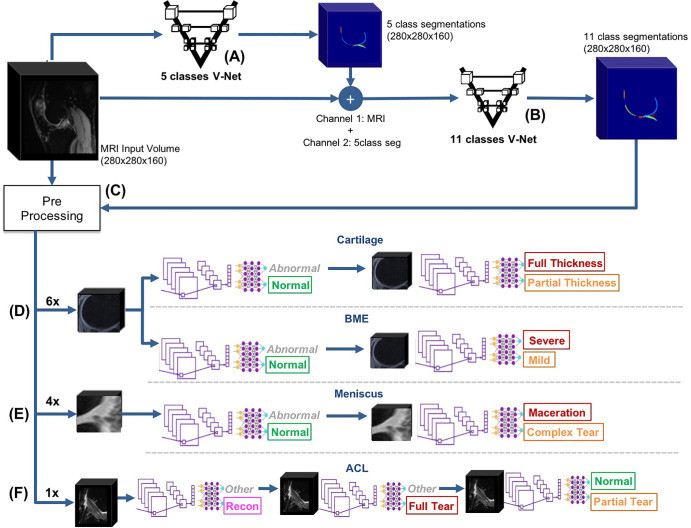
The automated, DL-based, full-knee-severity staging pipeline, depicted in Figure 1, consisted of three main stages: segmentation, detection, and classification. During the segmentation stage, automated DL-based segmentations of 11 distinct bone and cartilage, meniscus, and ligament ROIs were performed (Fig 1, A and B). Subsequently, the segmented ROIs within the MRI volumes were detected and cropped into smaller subvolumes (Fig 1, C). Cropping enabled focusing on the ROIs and diminished model size and memory requirements during training. Finally, 17 3D convolutional classifiers took the cropped subvolumes as input for automatic lesion-severity staging (Fig 1, D–F).
Figure 1:
Overview of the fully automated deep learning pipeline. A, An automatic, five-class cartilage-compartment segmentation was trained through a V-Net neural network architecture on manually segmented images and then applied to the entire dataset. B, The original image and its five class segmentations (5class seg) were used as input (first and second channels, respectively) into another V-Net responsible for labeling the segmentations according to 11 classes. C, Preprocessing pipeline where the data were split into training (70%), validation (15%), and holdout test (15%) datasets. Equal lesion-class distributions for each compartment were maintained across splits. Volumetric bounding boxes around all of the cartilage-compartment segmentations were created and then used to extract regions of interest. As a result of the preprocessing pipeline, volumes and Whole-Organ MRI Score grading of cartilage compartments were stored and ready to be used for training and/or inference. D–F, The resulting volumes and their respective grades were used as inputs and labels, respectively, to train 17 three-dimensional convolutional neural network deep learning classifiers, which assessed the presence and/or severity of, D, cartilage and bone marrow edema (BME) lesions, E, meniscus lesions, and, F, anterior cruciate ligament (ACL) lesions. In total, 52 probabilities were computed and output by the pipeline. Colors in the output of the models indicate the class. Green indicates the normal class, yellow indicates a mild or moderate lesion, red indicates a severe lesion, and pink indicates reconstruction (specific to the ACL).
Knee Segmentation into Bone, Cartilage, Meniscus, and Ligament Compartments
A 3D V-Net architecture (19) was trained to learn segmentations of the 11 ROIs using labels from 399 segmented volumes. To optimize the segmentation, two V-Net architectures were applied in two consecutive steps (Fig 1, A and B). The first V-Net output segmentations for five classes: namely, three cartilage regions (femur, tibia, and patella), one meniscus region, and one background region. Input for the second V-Net was the MRI input to the first V-Net (first channel) and the five-class segmentation output by the first V-Net (second channel). The second V-Net then assigned 11 labels to the compartments segmented by the first V-Net, resulting in six cartilage classes (the patella, trochlea, medial and lateral tibia, and medial and lateral femur), four menisci horns, and the background. Once the 11 class segmentations were inferred, each ROI was used to determine the bounding box around the segmented structures. Appendix E1 (supplement) details the V-Net hyperparameters, training strategy, MR image preprocessing, and detection for the cartilage, meniscus, and ACL.
Hierarchic 3D Convolutional Classification
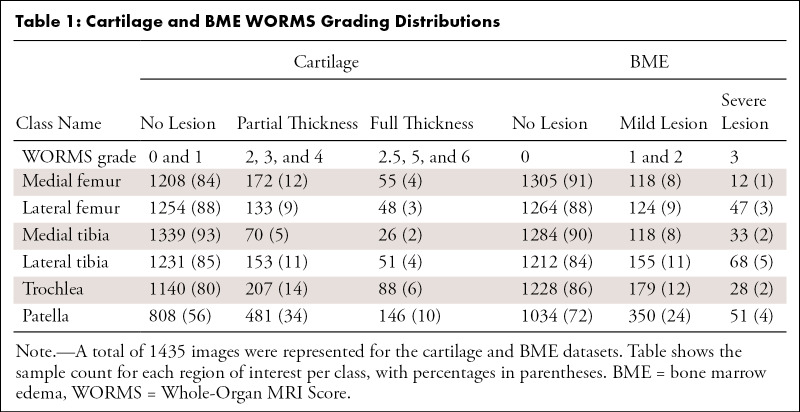
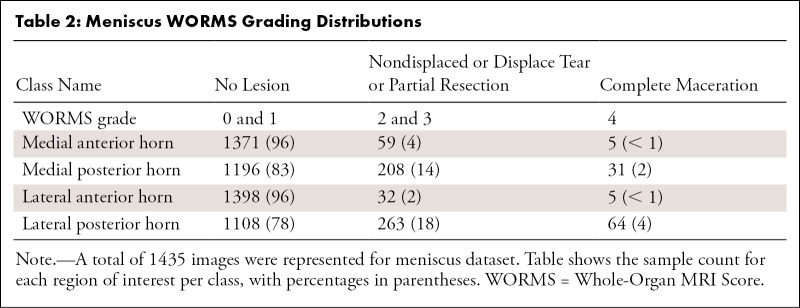
A WORMS-based class label was assigned to each ROI of the MR image according to Table 1 for cartilage and bone, Table 2 for the four meniscus horns, and Table 3 for the ACL. All ROIs were cropped as described in Appendix E1 (supplement). Our weakly supervised, hierarchic, multiclass classification structure is shown in Figure 1, D–F. A first DL hierarchic block was trained to classify the cartilage, meniscus, and bone as normal or abnormal. A second model was trained for the same groupings of tissue to classify samples into more granular lesion categories (two subclasses within the abnormal class) if these were classified as abnormal by the first model. The procedure for ACL classification differed, given that four classes existed for this compartment, as opposed to three for the other ROIs. The first ACL model was trained to distinguish reconstructed ligaments from other classes, as indicated in Figure 1, F. The second model further classified samples deemed as not reconstructed into full-tear lesions and other lesions. Finally, a third model distinguished between partially torn and healthy ligaments.
Table 1:
Cartilage and BME WORMS Grading Distributions
Table 2:
Meniscus WORMS Grading Distributions
Table 3:
ACL WORMS Grading Distributions
Figure 2 presents the DL architecture for each hierarchic block. The first layer consists of 24 convolutional 5 × 5 × 5 kernels, followed by a second layer of 24 × 3 × 3 × 3 kernels. The outputs of these two first layers are concatenated and input to a maximum pooling layer with a 4 × 4 × 4 pool size (2 × 2 × 2 stride). The resulting volume is fed to convolutional layers 3, 4, and 5, each composed of 96 × 3 × 3 × 3 kernels followed by maximum pooling layers (2 × 2 × 2). The resulting volume is flattened and input into a 16-unit, fully connected layer, followed by the two-unit fully connected output layer. The output layer is softmax activated, whereas all other convolutional and fully connected layers are followed by a batch-normalization layer and activated with a leaky rectified linear unit (20) function.
Figure 2:
The proposed deep learning convolutional (Conv) architecture for the hierarchic block. Red arrows indicate a three-dimensional (3D) convolutional layer with a 5 × 5 × 5 kernel size. Green arrows indicate a 3D convolutional layer with a 3 × 3 × 3 kernel size. Black arrows indicate skip connections. Yellow arrows indicate a 3D maximum pooling layer with a 4 × 4 × 4 pool size. Dark blue arrows indicate a 3D maximum pooling layer with a 2 × 2 × 2 pool size. A flattened layer is indicated by a purple arrow, and fully connected (FC) layers are indicated by light blue arrows. The red block marked ×3 indicates that the block is repeated three times.
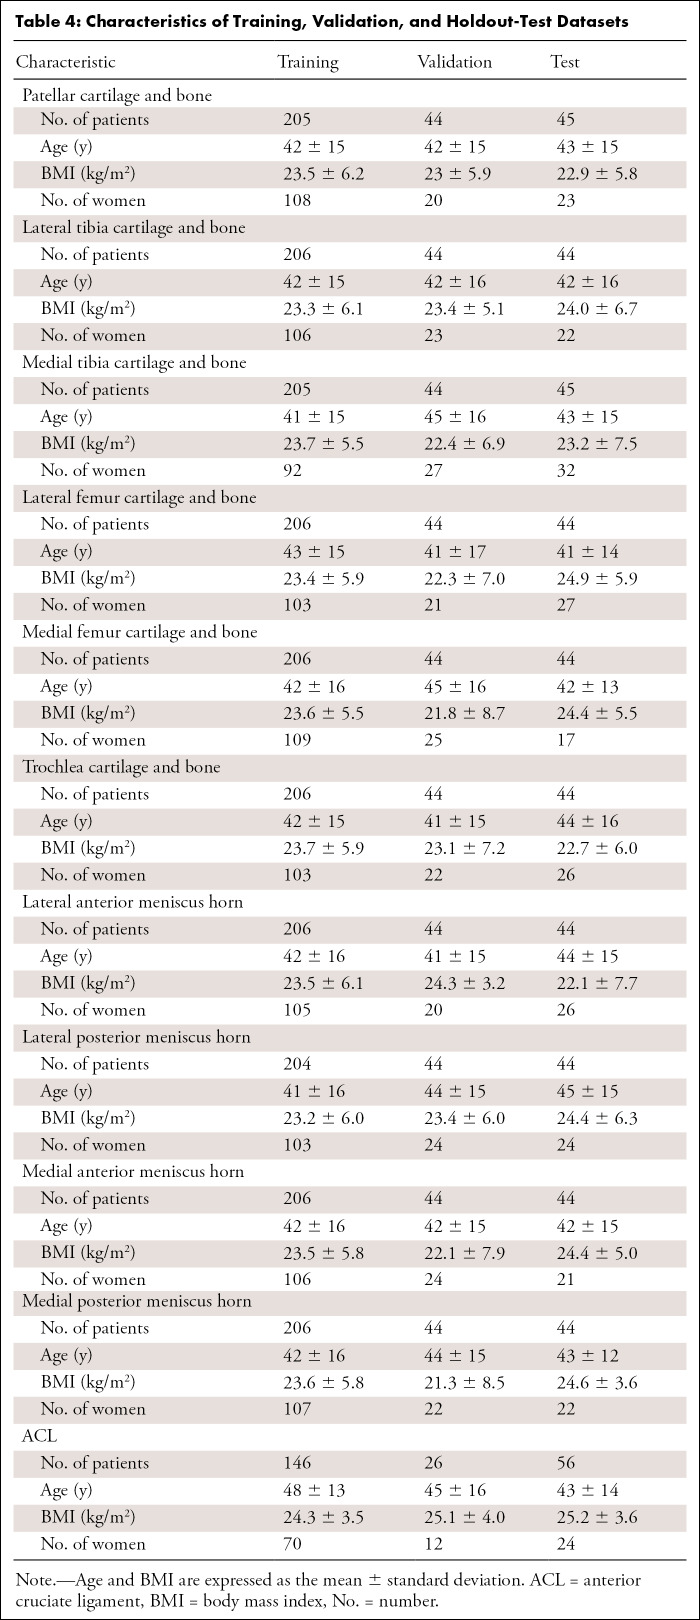
Tables 1–3 present our simplified class names, indexes, and corresponding WORMS grades; lesion distribution per compartment in terms of ground truth classes; and demographic statistics for the dataset splits. The total 1435 image studies were split patient-wise separately for each ROI into training (70%), validation (15%), and holdout-test (15%) datasets, which were stratified over the distributions of grades for each ROI in each tissue, guaranteeing that there was no patient or time-point overlap within the same ROI between splits. A set of 1252 images from 228 patients out of 1435 total images had grades for ACL and was split patient-wise into 70% training, 10% validation, and 20% testing datasets. Table 4 presents the characteristics of the splits per ROI. The training set was used in our weakly supervised approach to learn image features corresponding to specific compartment lesion classes. The validation set for each compartment was used for model hyperparameter tuning. All models were trained using data augmentation. Details on training parameters, the split strategy, and the augmentation strategy are described in Appendix E2 (supplement).
Table 4:
Characteristics of Training, Validation, and Holdout-Test Datasets
Interreader Variability and Comparison with the AI Model
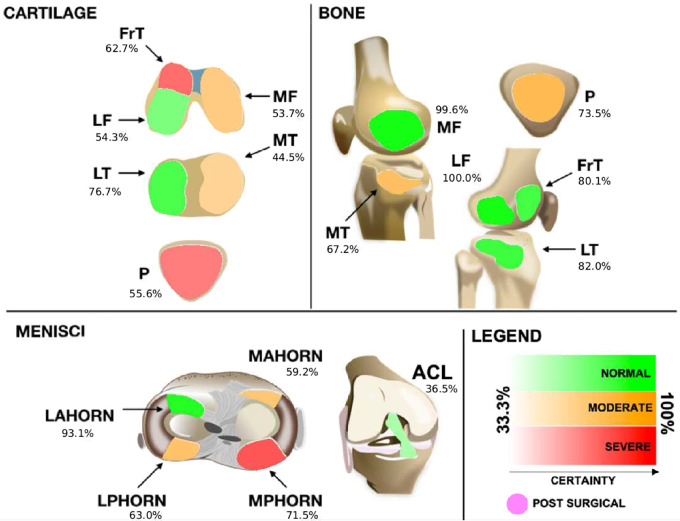
We proposed a method and interface for reporting the model findings to radiologists and used it on an interreader variability assessment. Such an interface needed to be simple so that it would not overwhelm graders with excessive information and needed to be effective by bringing only the most relevant information to their attention. The interface consisted of a schematic of all ROIs represented by a color scale that was defined by the confidence of the model in predicting certain abnormalities at each ROI, which was determined on the basis of the logits output by the hierarchic DL models.
Specifically, 50 3D clinical MRI cases from an external clinical dataset were graded by senior radiologists with musculoskeletal training (attending radiologist 1 [T.M.L., with more than 25 years of experience] and attending radiologist 2 [M.D.B., with more than 12 years of experience]) as well as postdoctoral trainees (trainee 1 [R.S., with 5 years of postdoctoral imaging experience] and trainee 2 [U.B., with more than 3 years of postdoctoral experience in orthopedic surgery, followed up by 1 year of postdoctoral radiologic training]). The radiologists independently graded all ROIs for the cases, without AI, using an external Digital Imaging and Communications in Medicine viewer. After a washout period of at least 15 days, all images in the external clinical dataset were inferred by the models, and the output probabilities were displayed on the visualization tool, as exemplified in Figure 3, to which the trainees had access during a second round of AI-aided grading. We then compared agreement between trainees and senior graders with and without AI guidance. Such agreement was reported using linear-weighted Cohen ĸ, and two-sample t tests were used to compute statistical significance.
Figure 3:
Proposed graphical interface used to inform the radiologists of the models' outputs. Colors indicate the lesion class: red indicates a severe lesion, orange indicates a moderate (or mild) lesion, and green indicates no lesion. Transparency indicates the probability output by the model for that class (ie, stronger colors indicate more confidence). Probabilities range from 33.3% (very uncertain) to up to 100% (most certain) for three classes of every tissue. The anterior cruciate ligament (ACL), when deemed reconstructed, is set to a differentiated color with no transparency level and is indicated as being postsurgical. FrT = trochlea, LAHORN = lateral anterior horn, LF = lateral femur, LPHORN = lateral posterior horn, LT = lateral tibia, MAHORN = medial anterior horn, MF = medial femur, MPHORN = medial posterior horn, MT = medial tibia, P = patella.
Statistical Analysis
MRI compartment detection on the holdout set was evaluated by computing the mean and standard deviation of the intersection over union of the 3D bounding boxes that were extracted from the automatic segmentations output by the V-Net and then comparing them with the manually segmented ground truth images from the segmentation holdout dataset. A value of 1 for the intersection over union indicates that the predicted bounding boxes match the ground truth perfectly, whereas a score of 0 indicates that there is no overlap between the two.
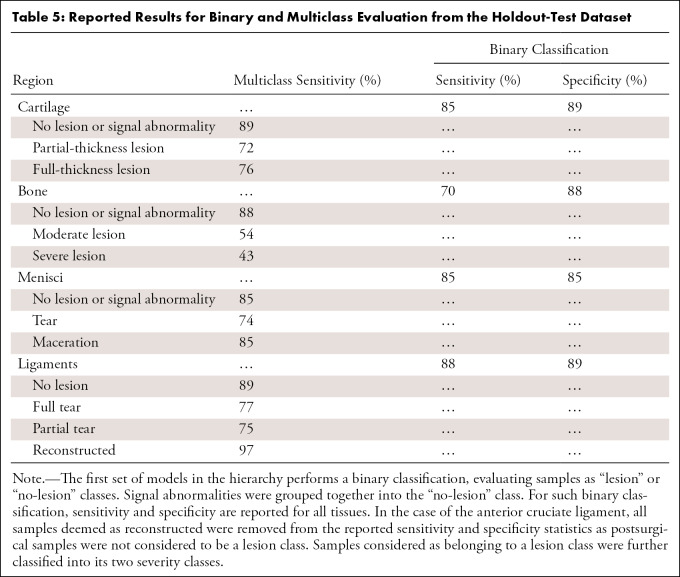
Accuracy was evaluated for both binary and multiclass classification. To evaluate model performance for binary classification for all compartment classifiers, the true-positive rate (sensitivity) was compared with the false-positive rate (1 − specificity) using receiver operating characteristic curves. The area under the receiver operating characteristic curve (AUC) was computed for each tissue in the holdout dataset. The AUC means and standard deviations were reported with corresponding 95% CIs and were bootstrapped 1000 times. Multiclass performance was evaluated using reported per-class sensitivity and corresponding confusion matrices for each model.
Interreader agreement was assessed by using linear-weighted Cohen ĸ, and two-sample t tests were used to compute statistical significance. A P value less than .05 was considered to indicate significance. ĸ values were used to assess changes in the level of agreement among radiologists. Such levels of agreement were determined by the ĸ-value ranges (21), with ranges of 0–0.20, 0.21–0.39, 0.40–0.59, 0.60–0.79, 0.80–0.90 considered to indicate no agreement, minimal agreement, weak agreement, moderate agreement, and strong agreement, respectively; ĸ values above 0.90 were considered to indicate almost perfect agreement.
Results
Segmentation and Detection of Bone, Cartilage, Meniscus, and Ligament Compartments
The mean ± standard deviation intersection over union values computed for the 3D bounding boxes per compartment were 0.83 ± 0.08 for the medial femoral condyle, 0.78 ± 0.17 for the lateral femoral condyles, 0.68 ± 0.14 for the medial tibia, 0.61 ± 0.12 for the lateral tibia, 0.69 ± 0.11 for the trochlea, 0.68 ± 0.12 for the patella, 0.49 ± 0.15 for the lateral anterior horn menisci, 0.56 ± 0.14 for the lateral posterior horn menisci, 0.52 ± 0.146 for the medial anterior horn menisci, 0.61 ± 0.15 for the medial posterior horn menisci, and 0.89 ± 0.06 for the ACL. The intersection over union values demonstrated detection metrics above 0.60 for the cartilage, bone, and ACL. For the menisci, however, we saw lower values between 0.49 and 0.61 for the intersection over the union, which were due to the fact that the bounding box for the meniscus is much smaller than that for other ROIs.
Hierarchic 3D Convolutional Classification
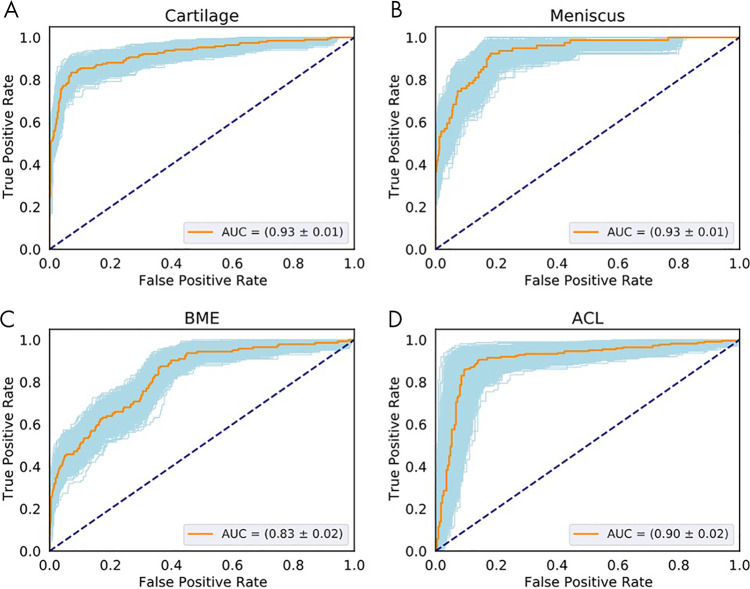
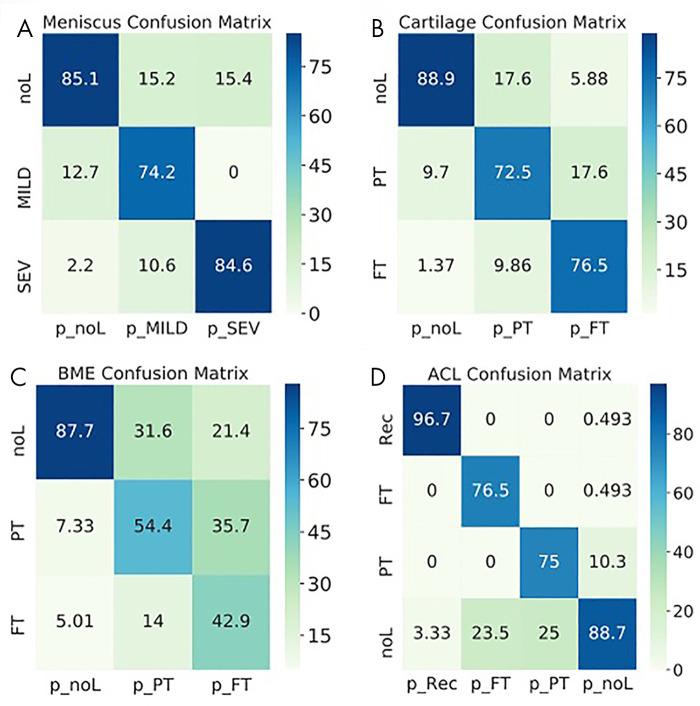
The following AUCs were determined for the detection of lesions within the tissues: cartilage, 0.93 ± 0.01 (95% CI: 0.90, 0.95; Fig 4, A); meniscal horns, 0.93 ± 0.02 (95% CI: 0.90, 0.96; Fig 4, B); bone marrow edema (BME), 0.83 ± 0.02 (95% CI: 0.79, 0.86; Fig 4, C); and ACL, 0.90 ± 0.02 (95% CI: 0.86, 0.95; Fig 4, D). Table 5 presents relatively balanced sensitivity and specificity values output by the DL classifiers for binary lesion detection. The sensitivity and specificity values reported for all tissues were above 85%, except for BME sensitivity (70% reported). Multiclass accuracy and sensitivity can be observed in Table 5 and Figure 5, which shows the confusion matrices for classifications in the holdout-test set.
Figure 4:
Receiver operating characteristic (ROC) curves show the diagnostic performance of cartilage, meniscus, and bone marrow edema (BME) lesion detection in the full-knee lesion-assessment proposal. Orange lines represent the average ROC curves. Blue shaded areas represent the ROC curves with areas under the ROC curve (AUCs) within 1 standard deviation of the mean after bootstrapping 1000 times. Dashed diagonal lines represent an AUC equal to 0.5. ROC curves and AUCs are shown for the detection of lesions within, A, cartilage, B, meniscus, C, BME and for D, anterior cruciate ligament (ACL).
Table 5:
Reported Results for Binary and Multiclass Evaluation from the Holdout-Test Dataset
Figure 5:
Normalized confusion matrices show the accuracy of the three-dimensional convolutional network predictions for, A, meniscus, B, cartilage, C, bone marrow edema (BME) and, D, anterior cruciate ligament (ACL). Each column shows the prediction (p_), and each row shows the ground truth. FT = full-thickness lesions, MILD = mild lesions, noL = no lesions, PT = partial-thickness lesions, Rec = reconstructed, SEV = severe lesions.
AI-aided Grading Agreement
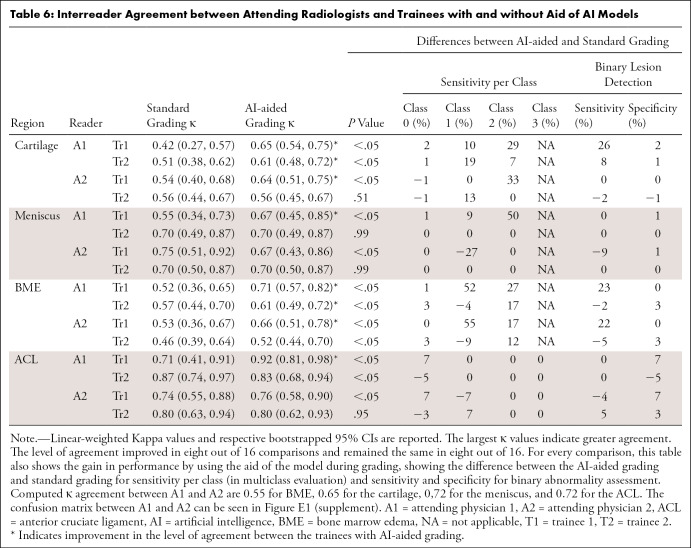
Intergrader-agreement evaluation showed that by using the aid of the DL models, the trainees significantly improved their agreement with the experienced attending radiologists most of the time. Table 6 presents the lowest ĸ agreement during standard grading among all tissues as 0.42 for cartilage, which was considered weak agreement (21). During AI-assisted grading, the lowest ĸ increased to 0.61, which is consistent with moderate agreement (21). The level of agreement improved in seven out of 16 comparisons. Changes in per-class sensitivity for multiclass and binary assessment can be also observed. Computed ĸ agreement between attending physicians 1 and 2 were 0.55 for BME, 0.65 for cartilage, 0.72 for the meniscus, and 0.72 for the ACL (confusion matrices between both attending physicians are shown in Figure E1 [supplement]). Intergrader-agreement confusion matrices among all trainees and attending physicians are shown and described within Appendix E3 [supplement]. Moreover, Figure 6 shows an example of the high sensitivity of the model for recognizing small defects that could have otherwise been missed by radiologists, depicting the sagittal view of patellar cartilage with a small partial-thickness defect (WORMS grade 2). This lesion was seen in only one section and was assessed as normal by two trainees, whereas it was graded as a partial-thickness lesion by the experienced attending physician in the first round of grading. During AI-assisted grading, the same lesion was recognized as a partial-thickness defect by all three of the other readers.
Table 6:
Interreader Agreement between Attending Radiologists and Trainees with and without Aid of AI Models
Figure 6:
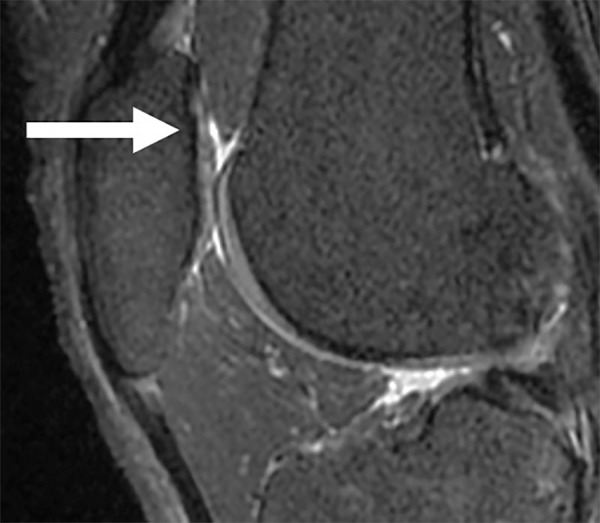
Sagittal sequence of the knee demonstrates a small partial-thickness defect (arrow) at the patellar cartilage (Whole-Organ MRI Score grade 2). The patellar cartilage defect was graded as normal by two trainees but was graded as a partial-thickness lesion by both the attending physicians in the first round of grading. In the second round of grading, the same lesion was recognized with the aid of the model and was graded as a partial-thickness lesion by all four readers.
Discussion
In this work, we present a full-knee 3D MRI processing pipeline for detection and classification of osteoarthritis-related and injury-related abnormalities, providing a fully automated composite model for complete knee assessment based on both multiple tissue compartments and multiclass classification. Our results show that the high sensitivity of the approach for lesion detection and multiclass staging is able to aid radiologist readings, reducing intergrader variability.
The present study is timely and relevant, as osteoarthritis is globally prevalent, with rates on the rise because of an aging population (22,23). Timely and accurate diagnosis is key for treating knee abnormalities and alleviating symptoms. Multiple efforts leveraging DL to aid radiologists in the endeavor of detecting and analyzing lesions in specific tissue compartments (the ACL, cartilage, etc) have been underway (13,15).
Previous work (12) on automated knee-lesion assessment has reported results for multiclass severity staging, with the majority of the literature reporting lesion detection using binary classifiers. Liu et al (14) proposed a two-dimensional DL pipeline for cartilage segmentation and lesion detection, reporting a sensitivity of 84.1%, a specificity of 87.9%, and an AUC of 0.917 (95% CI: 0.901, 0.932). Our 3D approach takes advantage of the structural correlation in the third dimension and reached 85% sensitivity and 89% specificity with an AUC of 0.93 (95% CI: 0.90, 0.95) when analyzing binary lesion detection. Moreover, we report cartilage multiclass sensitivities per class of 71%, 72%, and 89% for full-thickness lesion, partial-thickness lesion, and no-lesion classes, respectively. Bien et al (15) detected ACL and meniscus lesions using MRNet, a two-dimensional DL architecture for binary classification, that achieved AUCs for ACL-tear and meniscal-tear detection of 0.965 (95% CI: 0.938, 0.993) and 0.847 (95% CI: 0.780, 0.914), respectively. In our work, we reported an AUC of 0.90 (95% CI: 0.86, 0.95) for ACL abnormality detection; reconstructed ACLs and partial tears were combined with full tears in the abnormal category, whereas MRNet results refer to full-tear detection only. In the case of the meniscus, we report an AUC of 0.93 (95% CI: 0.90, 0.96) for lesion detection (ie, tear and maceration). Another ACL assessment approach was presented by Liu et al (13) for binary ACL-tear classification. This model achieved 96% for both sensitivity and specificity, and no significant difference between lesion detection by the automatic system and lesion detection by the radiologists was reported. Compared with these prior studies on ACL lesion classification, our pipeline classifies ACLs into two additional classes: partial tears and reconstructed ligaments.
Higher sensitivity in binary detection compared with sensitivity per class for multiclass assessment is due to the fact that features found on images where lesions are present and features found on images of healthy, lesion-free tissues are more distinctive. Differentiating between levels of lesion severity is a much harder problem, given the similarity of the lesion features in the two defined lesion classes. In addition, class imbalance (Table 1) for multiclass training and assessment also explains lower sensitivity for more severe classes.
It is worth noting that one of the limitations of a convolutional neural network is that it is still a black-box approach, which makes it difficult to interpret exactly which feature is addressed by the network. This is still an open point in DL research. Approaches such as Grad-Cam (gradient-weighted class activation mapping) (24) can extract gradient class activation maps, but they are limited to telling us which locations on an image have the most important weight for an output and cannot provide the specific features (eg, texture or intensity) that are taken into account (25). Extraction of features can be done on a case-by-case basis, but there is no method or metric to evaluate the whole dataset systematically.
Successful integration of AI-enabled solutions in clinical practice requires involving radiologists during the development process. The overwhelming workloads of radiologists and the potential for burnout has been well documented (26–28). The use of AI promises to mitigate some of these burdens, along with adding value to several aspects of the clinical workflow (29–31). Despite a great deal of work being done in developing AI models, there are still many opportunities for contributions in terms of presenting AI predictions and outputs to radiologists in an easily understandable format without causing information overload or significantly increasing scan reading time. Understanding radiologists' preferences for visualizing model output is key for eventual adoption of AI tools across the radiology community. Our work takes the first step in this direction by incorporating a visualization tool, which provides necessary lesion-scoring information based on DL models' output and allows for radiologists' discretion in interpreting and grading lesions. We show improvement in AI-aided grading with our comparison of grades assigned by two attending physicians and two postdoctoral trainees. Trainee 1 had consistently lower ĸ values than trainee 2 when standard grading was used, but the introduction of AI-aided grading flipped this relationship for nearly all categories. These scoring differences might be explained by the fact that trainee 2 had more than 3 years of postdoctoral experience in orthopedic surgery, which might have made trainee 2 less susceptible to being influenced by the AI model to change grading.
Despite the promising results, this study had some limitations that need to be acknowledged. Our AI system was trained using one sequence type acquired in a research setting from a single vendor. However, the intergrader variability results were driven by a dataset composed of clinical images, and the training set was acquired over different sites. Fine-tuning our models in an uncontrolled environment and using multiple sequences from a diverse set of vendors could confirm our findings and increase generalizability. Collateral ligaments are better appreciated in the coronal view, and the use of a single sagittal sequence prevented their inclusion. Assessment of medial and lateral ligaments is a direction for future studies. Moreover, each tissue was evaluated independently, and despite the high sensitivity, considering multitask approaches might better exploit relationships among different anomalies, which is the direction of our future work. The ground truth for the external dataset was determined by two attending radiologists, and further collecting data from other specialists to use consensus grading would lead to a stronger ground truth. Finally, given the absence of annotations for the meniscal body in our retrospective datasets, we evaluated only the meniscal horns.
In summary, this study uses a hierarchy of 3D convolutional neural networks for full-knee ROI detection and lesion classification, resulting in higher sensitivity and specificity than those of previous works and also providing multiclass lesion-severity staging in multiples tissues of the knee. Experiments on the external dataset confirm the hypothesis that model aid during the grading process can greatly increase interreader agreement. This study is an important step toward fine-grained multiclass, multitissue, and multitask severity staging and has the potential to drive AI methods in aiding medical image readings by radiologists.
This work was supported by GE Healthcare, National Institutes of Health (NIH), and National Institute of Arthritis and Musculoskeletal and Skin Diseases; Contract grant numbers: R61AR073552 (to S.M., V.P.), R00AR070902 (to V.P.), and P50AR060752 (to S.M.). Medical images considered in this study were collected as part of the NIH-funded grants P50AR060752 and R01AR046905 and the Anterior Cruciate Ligament Arthritis Foundation Study Trial grant 6157.
Disclosures of Conflicts of Interest: B.A. Activities related to the present article: institution received grant from GE Healthcare. Activities not related to the present article: institution received grant from GE Healthcare. Other relationships: disclosed no relevant relationships. I.F. Activities related to the present article: institution received grant from GE Healthcare. Activities not related to the present article: disclosed no relevant relationships. Other relationships: disclosed no relevant relationships. N.K.N. disclosed no relevant relationships. R.S. Activities related to the present article: institution received grant from GE Healthcare. Activities not related to the present article: disclosed no relevant relationships. Other relationships: disclosed no relevant relationships. U.B. Activities related to the present article: institution received grant from GE Healthcare. Activities not related to the present article: institution received grant from GE Healthcare. Other relationships: disclosed no relevant relationships. T.M.L. disclosed no relevant relationships. M.D.B. Activities related to the present article: institution received salary support from grant from Center for Digital Health Innovation at UCSF. Activities not related to the present article: disclosed no relevant relationships. Other relationships: disclosed no relevant relationships. V.P. Activities related to the present article: institution received grant from GE Healthcare. Activities not related to the present article: institution received grant from NIAMS-NIH. Other relationships: disclosed no relevant relationships. S.M. Activities related to the present article: institution received grant from GE Healthcare (covered research costs). Activities not related to the present article: institution has grant from Samumed Pharma (research grant to conduct imaging studies in 15 patients); institution receives royalties from University of California Office of the President for licensing technology. Other relationships: disclosed no relevant relationships.
- ACL
- anterior cruciate ligament
- AI
- artificial intelligence
- AUC
- area under the receiver operating characteristic curve
- BME
- bone marrow edema
- DL
- deep learning
- ROI
- region of interest
- 3D
- three-dimensional
- WORMS
- Whole-Organ MRI Score
References
- 1.Farr J II, Miller LE, Block JE. Quality of life in patients with knee osteoarthritis: a commentary on nonsurgical and surgical treatments. Open Orthop J 2013;7(1):619–623. [DOI] [PMC free article] [PubMed] [Google Scholar]
- 2.Kawano MM, Araújo ILA, Castro MC, Matos MA. Assessment of quality of life in patients with knee osteoarthritis. Acta Ortop Bras 2015;23(6):307–310. [DOI] [PMC free article] [PubMed] [Google Scholar]
- 3.Gupta S, Hawker GA, Laporte A, Croxford R, Coyte PC. The economic burden of disabling hip and knee osteoarthritis (OA) from the perspective of individuals living with this condition. Rheumatology (Oxford) 2005;44(12):1531–1537. [DOI] [PubMed] [Google Scholar]
- 4.Hunter DJ, Guermazi A, Lo GH, et al. Evolution of semi-quantitative whole joint assessment of knee OA: MOAKS (MRI Osteoarthritis Knee Score). Osteoarthritis Cartilage 2011;19(8):990–1002. [DOI] [PMC free article] [PubMed] [Google Scholar]
- 5.Peterfy CG, Guermazi A, Zaim S, et al. Whole-Organ Magnetic Resonance Imaging Score (WORMS) of the knee in osteoarthritis. Osteoarthritis Cartilage 2004;12(3):177–190. [DOI] [PubMed] [Google Scholar]
- 6.Alizai H, Virayavanich W, Joseph GB, et al. Cartilage lesion score: comparison of a quantitative assessment score with established semiquantitative MR scoring systems. Radiology 2014;271(2):479–487. [DOI] [PMC free article] [PubMed] [Google Scholar]
- 7.Gersing AS, Schwaiger BJ, Nevitt MC, et al. Is weight loss associated with less progression of changes in knee articular cartilage among obese and overweight patients as assessed with MR imaging over 48 months? Data from the Osteoarthritis Initiative. Radiology 2017;284(2):508–520. [DOI] [PMC free article] [PubMed] [Google Scholar]
- 8.Zhang J, Gajjala S, Agrawal P, et al. Fully automated echocardiogram interpretation in clinical practice. Circulation 2018;138(16):1623–1635. [DOI] [PMC free article] [PubMed] [Google Scholar]
- 9.Wang H, Jia H, Lu L, Xia Y. Thorax-Net: an attention regularized deep neural network for classification of thoracic diseases on chest radiography. IEEE J Biomed Health Inform 2020;24(2):475–485. [DOI] [PubMed] [Google Scholar]
- 10.Rajpurkar P, Irvin J, Zhu K, et al. CheXNet: radiologist-level pneumonia detection on chest x-rays with deep learning. ArXiv 1711.05225 [preprint] https://arxiv.org/abs/1711.05225. Posted November 14, 2017. Accessed March 31, 2021. [Google Scholar]
- 11.Lundervold AS, Lundervold A. An overview of deep learning in medical imaging focusing on MRI. Z Med Phys 2019;29(2):102–127. [DOI] [PubMed] [Google Scholar]
- 12.Pedoia V, Norman B, Mehany SN, Bucknor MD, Link TM, Majumdar S. 3D convolutional neural networks for detection and severity staging of meniscus and PFJ cartilage morphological degenerative changes in osteoarthritis and anterior cruciate ligament subjects. J Magn Reson Imaging 2019;49(2):400–410. [DOI] [PMC free article] [PubMed] [Google Scholar]
- 13.Liu F, Guan B, Zhou Z, et al. Fully automated diagnosis of anterior cruciate ligament tears on knee MR images by using deep learning. Radiol Artif Intell 2019;1(3):e180091. [DOI] [PMC free article] [PubMed] [Google Scholar]
- 14.Liu F, Zhou Z, Samsonov A, et al. Deep learning approach for evaluating knee MR images: achieving high diagnostic performance for cartilage lesion detection. Radiology 2018;289(1):160–169. [DOI] [PMC free article] [PubMed] [Google Scholar]
- 15.Bien N, Rajpurkar P, Ball RL, et al. Deep-learning-assisted diagnosis for knee magnetic resonance imaging: Development and retrospective validation of MRNet. PLoS Med 2018;15(11):e1002699. [DOI] [PMC free article] [PubMed] [Google Scholar]
- 16.Namiri NK, Flament I, Astuto B, et al. Deep learning for hierarchical severity staging of anterior cruciate ligament injuries from MRI. Radiol Artif Intell 2020;2(4):e190207. [DOI] [PMC free article] [PubMed] [Google Scholar]
- 17.Eberhardt SC, Heilbrun ME. Radiology report value equation. RadioGraphics 2018;38(6):1888–1896. [DOI] [PubMed] [Google Scholar]
- 18.Wallis A, McCoubrie P. The radiology report: are we getting the message across?. Clin Radiol 2011;66(11):1015–1022. [DOI] [PubMed] [Google Scholar]
- 19.Milletari F, Navab N, Ahmadi SA. V-Net: fully convolutional neural networks for volumetric medical image segmentation. In: Proceedings of the 2016 Fourth International Conference on 3D Vision (3DV).Piscataway, NJ:Institute of Electrical and Electronics Engineers,2016;565–571. [Google Scholar]
- 20.Wang SH, Phillips P, Sui Y, Liu B, Yang M, Cheng H. Classification of Alzheimer’s disease based on eight-layer convolutional neural network with leaky rectified linear unit and max pooling. J Med Syst 2018;42(5):85. [DOI] [PubMed] [Google Scholar]
- 21.McHugh ML. Interrater reliability: the kappa statistic. Biochem Med (Zagreb) 2012;22(3):276–282. [PMC free article] [PubMed] [Google Scholar]
- 22.O’Neill TW, McCabe PS, McBeth J. Update on the epidemiology, risk factors and disease outcomes of osteoarthritis. Best Pract Res Clin Rheumatol 2018;32(2):312–326. [DOI] [PubMed] [Google Scholar]
- 23.Vos T, Allen C, Arora M, et al. ; GBD 2015 Disease and Injury Incidence and Prevalence Collaborators. Global, regional, and national incidence, prevalence, and years lived with disability for 310 diseases and injuries, 1990-2015: a systematic analysis for the Global Burden of Disease Study 2015. Lancet 2016;388(10053):1545–1602. [DOI] [PMC free article] [PubMed] [Google Scholar]
- 24.Selvaraju RR, Cogswell M, Das A, Vedantam R, Parikh D, Batra D. Grad-CAM: visual explanations from deep networks via gradient-based localization. Int J Comput Vis 2020;128(2):336–359. [Google Scholar]
- 25.Arun N, Gaw N, Singh P, et al. Assessing the (un)trustworthiness of saliency maps for localizing abnormalities in medical imaging. MedRxiv 2020.07.28.20163899 [preprint]https://www.medrxiv.org/content/10.1101/2020.07.28.20163899v1. Posted July 30, 2020. Accessed March 31, 2021. [DOI] [PMC free article] [PubMed] [Google Scholar]
- 26.McDonald RJ, Schwartz KM, Eckel LJ, et al. The effects of changes in utilization and technological advancements of cross-sectional imaging on radiologist workload. Acad Radiol 2015;22(9):1191–1198. [DOI] [PubMed] [Google Scholar]
- 27.Simon AF, Holmes JH, Schwartz ES. Decreasing radiologist burnout through informatics-based solutions. Clin Imaging 2020;59(2):167–171. [DOI] [PubMed] [Google Scholar]
- 28.Jha S. Automation and radiology: part 1. Acad Radiol 2020;27(1):147–149. [DOI] [PubMed] [Google Scholar]
- 29.Choy G, Khalilzadeh O, Michalski M, et al. Current applications and future impact of machine learning in radiology. Radiology 2018;288(2):318–328. [DOI] [PMC free article] [PubMed] [Google Scholar]
- 30.Hosny A, Parmar C, Quackenbush J, Schwartz LH, Aerts HJWL. Artificial intelligence in radiology. Nat Rev Cancer 2018;18(8):500–510. [DOI] [PMC free article] [PubMed] [Google Scholar]
- 31.Liew C. The future of radiology augmented with artificial intelligence: a strategy for success. Eur J Radiol 2018;102:152–156. [DOI] [PubMed] [Google Scholar]


