Abstract
Flavor chemicals in electronic cigarette fluids (ECs), which may negatively impact human health, have been studied in a limited number of countries/locations. To gain an understanding of how the composition and concentrations of flavor chemicals in ECs are influenced by product sale location, we evaluated refill fluids manufactured by one company (Ritchy LTD) and purchased worldwide. Flavor chemicals were identified and quantified using gas chromatography-mass spectrometry (GC-MS). We then screened the fluids for their effects on cytotoxicity (MTT assay) and proliferation (live-cell imaging) and tested authentic standards of specific flavor chemicals to identify those that were cytotoxic at concentrations found in refill fluids. One hundred twenty-six flavor chemicals were detected in 103 bottles of refill fluid, and their number per/bottle ranged from 1 – 50 based on our target list. Two products had none of the flavor chemicals on our target list, nor did they have any non-targeted flavor chemicals. Twenty-eight flavor chemicals were present at concentrations ≥ 1 mg/mL in at least one product, and 6 of these were present at concentrations ≥ 10 mg/mL. The total flavor chemical concentration was ≥ 1 mg/mL in 70% of the refill fluids and ≥ 10 mg/mL in 26%. For sub-brand duplicate bottles purchased in different countries, flavor chemical concentrations were similar and induced similar responses in the in vitro assays (cytotoxicity and cell growth inhibition). The levels of furaneol, benzyl alcohol, ethyl maltol, ethyl vanillin, corylone, and vanillin were significantly correlated with cytotoxicity. The margin of exposure calculations showed that pulegone and estragole levels were high enough in some products to present a non-trivial calculated risk for cancer. Flavor chemical concentrations in refill fluids often exceeded concentrations permitted in other consumer products. These data support the regulation of flavor chemicals in EC products to reduce their potential for producing both cancer and non-cancer toxicological effects.
Keywords: LIQUA, electronic cigarette, e-liquids, flavor chemicals, flavors, cytotoxicity, carcinogenicity, GC/MS, MTT
Graphical Abstract
INTRODUCTION
Adverse health effects have been linked to electronic cigarette (EC) use in prior experimental studies on cells, animals, and humans,1,2 case reports,3 and Internet posts.4,5 The recent epidemic of “electronic cigarette or vaping product use associated lung injury” (EVALI) has further heightened concerns about the safety of ECs.6–9 The Centers for Disease Control and Prevention (CDC) suggested that poor quality counterfeit and black-market products are linked to some EVALI cases10 and further recommended that vaping products not be used until the causes of EVALI are determined.11 We have previously shown that some EC refill fluids contain very high concentrations of some flavor chemicals12,13 and that the presence of some flavor chemicals at high levels is significantly correlated with cytotoxicity.14 Although flavor chemicals have not been directly linked to EVALI, we did previously conclude that the high concentrations of flavor chemicals used in some EC refill fluids may cause adverse health effects.13,15 While many flavor chemicals in EC products are GRAS (generally regarded as safe) for ingestion; their safety has not been evaluated for inhalation.16 Some EC products have flavor chemical concentrations that far exceed those acceptable for ingestion, for example, we have found cinnamaldehyde in one product at 343 mg/mL.13
Most prior studies on EC flavor chemicals have been done using products purchased in one country, often the USA, and have generally focused on identification only. In this study, all products were manufactured by one company, and purchases were made in four different countries. We compared the flavor chemicals in each product to determine: (1) if there were variations in content and concentration with country, (2) if products were cytotoxic, (3) if specific flavor chemicals contributed to cytotoxicity, (4) if any flavor chemicals or co-constituents were present in high enough concentrations to be a risk factor for cancer and (5) how flavor chemicals in the current study compared to those we have examined previously.
MATERIALS AND METHODS
Product Selection and Collection
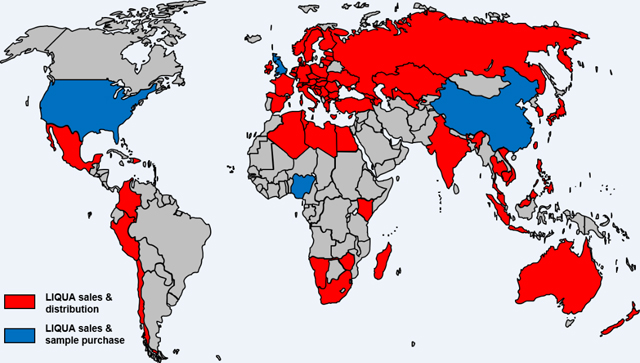
105 LIQUA brand EC refill fluids manufactured by Ritchy LTD (www.ritchy.com)17 were evaluated. Products were purchased in four countries (NG = Nigeria, US = the United States, UK = the United Kingdom, and CN = China) chosen to represent different geographical regions and to allow comparison between varying levels of quality control and regulation of consumer products. Within countries, states/provinces are designated as follows: KS = Kansas, USA; CA = California, USA; LG = Lagos, Nigeria; GB = Great Britain, UK; GD = Guangdong, China; and XE = Xiamen, China. Within states/provinces, duplicate bottles are indicated numerically, e.g., 1, 2. EC refill fluids were stored at 4 ° C in the dark until analyzed.
Evaluation and Quantification of Flavor Chemicals using GC/MS
For each refill fluid, 50 μl was dissolved in 0.95 ml of isopropyl alcohol (Fisher Scientific, Fair Lawn, NJ). Chemical analysis was performed with an Agilent 5975C GC/MS system (Santa Clara, CA) using internal standard-based calibration procedures and methods previously described in detail.18,19 The method analyzes 177 flavor chemicals plus nicotine.
Culturing of mNSC and BEAS-2B Cells
Mouse neural stem cells (mNSC) are sensitive to EC refill fluids,20 are amenable to high-throughput screening, and are an excellent model for neurological development. mNSC were cultured in Nunc T-25 tissue culture flasks (Fisher Scientific, Tustin CA) containing growth medium prepared using methods previously described.19 For the MTT experiments, cell concentrations were determined using a BioMate 3S Spectrophotometer (Thermo Fisher Scientific, Chino, California, USA)-based standard curve, and single cells were plated at 1500 cells/well in 96-well plates. For live-cell imaging in a BioStation CT (Nikon Instruments, Melville NY), mNSC were seeded at 5000 cells/well in 24-well uncoated culture plates and allowed to attach overnight before imaging. Seeding densities were adjusted to achieve ~80–85% confluency at the end of the experiments.
Human bronchial epithelial cells (BEAS-2B, ATCC, USA), which are often used in inhalation toxicology studies, were cultured in bronchial epithelial cell growth medium using protocols previously described.19 At 80% confluency, cells were harvested and plated at 3500 cells/well in pre-coated 96-well plates for the MTT assay.
MTT Cytotoxicity Assay
Direct effects of EC refill fluids or authentic standards of flavor chemicals on mitochondrial reductases were evaluated in concentration-response experiments that included untreated wells to control for vapor effects.21 After seeding and overnight attachment, cells were either treated with 0%, 0.001%, 0.1%, 0.03%, 0.1%, 0.3%, and 1% refill fluids solutions or 10 fold dilutions of the actual concentration of authentic standard solution made up in culture medium. All treatments were incubated for 48 hours at 37 °C. After treatment, 3-(4,5-dimethylthiazol-2-yl)-2,5-diphenyltetrazolium bromide (MTT) reagent (Sigma-Aldrich, St Louis, MO) was added to wells and incubated for 2 hours at 37°C. Solutions were removed from wells, and 100 μl of dimethyl sulfoxide (DMSO) were added to each well to solubilize formazan crystals. Absorbance readings were taken against a DMSO blank at 570 nm using an Epoch microplate reader (Biotek, Winooski, VT). The MTT assay quantifies the conversion of a yellow tetrazolium salt (MTT) to purple formazan. For each variable tested, three independent experiments were performed.
Live Cell Imaging of mNSC
For non-invasive analysis of cell morphology, motility, and survival, live-cell imaging was performed using a 10x phase contrast objective in a BioStation CT using automatic Z-focus. After attachment, mNSC were treated with refill fluid solutions at 0.1%, 0.3% and 1% made up in culture medium. Images were taken at 5 – 8 regions in each well once every 2 hours for 48 hours to collect time-lapse data for analysis. Evaluation of mNSC confluency, morphology, and survival was compared in control and treated groups using CL Quant software (DR Vision, Seattle, WA).
Data Analysis
For GC/MS analysis, each sample was analyzed twice, and the means were plotted using Prism software (GraphPad, San Diego). For the MTT assay, data were normalized to the negative control (100%), and treatment groups were expressed as percentages of the negative control. IC50s were computed using the log inhibitor vs. normalized response-variable slope in GraphPad Prism, and IC70s were evaluated visually. Statistical significance in the MTT assay was determined using a one-way analysis of variance (ANOVA), and when there was significance, treated groups were compared to the untreated control. In the live-cell imaging assay, significance was evaluated using a two-way ANOVA in which the variables were time and treatment.
RESULTS
Total Flavor Chemical Concentrations and Total Number of Flavor Chemicals
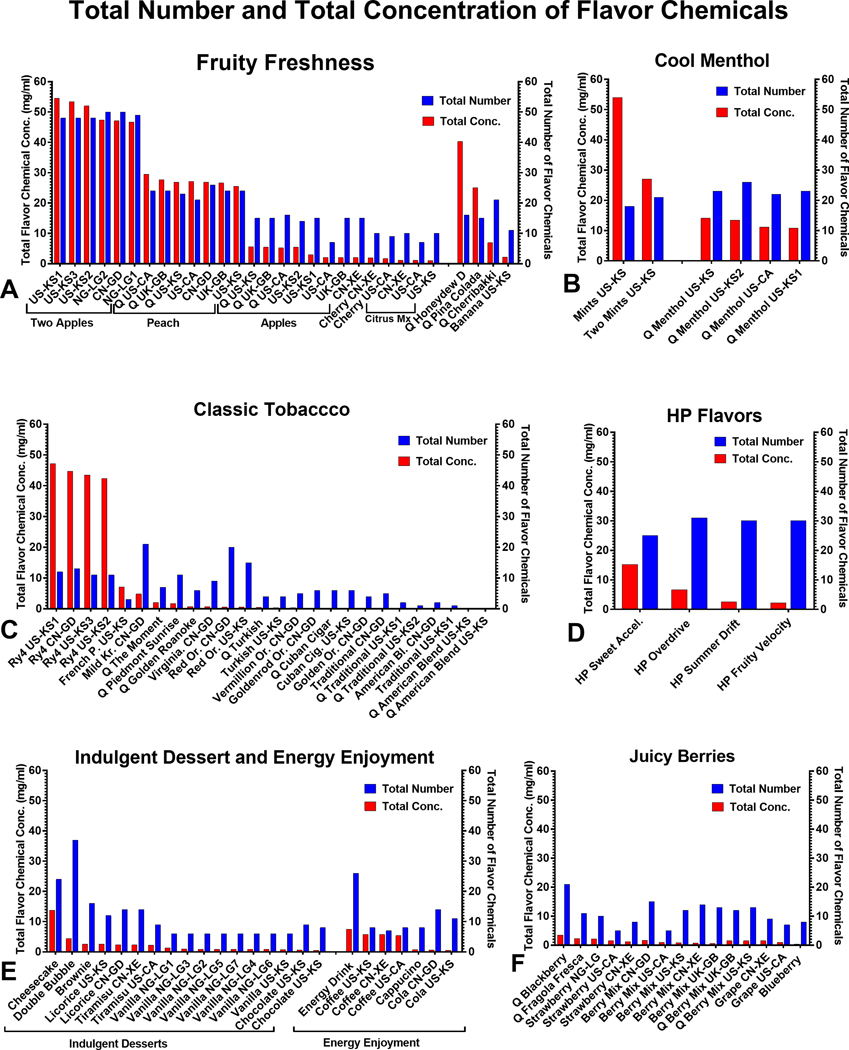
The number and concentrations of flavor chemicals in 105 refill fluids were evaluated (Figure 1). Each refill fluid was grouped into a product flavor category and compared for variability based on country of purchase. Refill fluid categorization was done according to flavors and types on the manufacturer’s website (Table 1). Products are sorted from left to right in Figure 1 in order of decreasing total concentrations of flavor chemicals. Based on our target analyte list, the total number (1–50) and concentration (0.0047 – 54.5 mg/mL) of flavor chemicals varied among products. Two “Q American Blend Tobacco” products did not have any chemicals on our target analyte list.
Figure 1.
Total number and total concentrations of flavor chemicals in 103 LIQUA refill fluids. Total flavor chemical concentrations ranged from 0.0047 – 54.5 mg/mL mg/ml, and the total number of flavor chemicals ranged from 1 – 50. (a) Fruity Freshness, (b) Cool Menthol, (c) Classic Tobacco, (d) LIQUA HP, (e) Indulgent Desserts, Energy Enjoyment, and (f) Juice berries. The x-axis of each graph shows the flavor name and purchase location of each refill fluid (also see Supplemental Table 2). The left y-axis shows the concentration of total flavor chemicals ordered according to decreasing concentration from left to right within each flavor category. In contrast, the right y-axis shows the total number of flavor chemicals in each product. Each bar is the mean of two independent measurements.
Table 1.
LIQUA EC Refill Fluids and Their Respective Flavor Categories
| Company | EC Fluid Categories | Flavors |
|---|---|---|
| LIQUA Original | Fruity Freshness | Two Apples, Peach, Apple, Banana, Cherry, Citrus Mix |
| Cool Menthol | Mints, Two Mints, | |
| Classic Tobacco | Ry4 Tob., French Pipe Tob., Mild Kretek Tob., Virginia Tob., Red Oriental Tob., Turkish Tob., Vermillion Tob., Cuban Cigar Tob., Goldenrod Tob., Golden Oriental Tob., Traditional Tob., American Blend Tob. | |
| Indulgent Desserts | Cheesecake, Licorice, Tiramisu, Brownie, Vanilla, Chocolate | |
| Energy Enjoyment | Energy drink, Coffee, Cappuccino, Cola | |
| Juice Berries | Strawberry, Berry Mix, Grape, Blueberry | |
| LIQUA Q | Peach, Apple, Menthol, Golden Roanoke Tob., Turkish Tob., Havana Libre, Traditional Tob., American Blend Tob., Berry Mix, Honeydew Drop, Pina Colada, Cherribakki, Double Bubble, Blueberry Jack, Fragola Fresca, The Moment. | |
| LIQUA HP | Sweet Accelerator, Overdrive, Summer Drift, Fruity Velocity | |
Total flavor chemical concentration and number in original LIQUA flavors were high in “Two Apple” and “Peach” (Figure 1a), “Mints,” and Two Mints” (Figure 1b), and “RY4 Tobacco” (Figure 1c), and “Sweet Accelerator” (Figure 1d), and Cheesecake (Figure 1e). Within the mint/menthol groups, the total concentration of flavor chemicals varied with “Mints” (54 mg/mL), having over twice the total concentration of the other products (range = 11 – 27 mg/mL). In all these products, total flavor chemical concentration was > 10 mg/mL, and the total number of flavor chemicals was > 10. In contrast, low total concentrations of flavor chemicals were found in various categories (e.g., Fruity Freshness, Indulgent Dessert, Energy Enjoyment, Juicy Berries, and Classic Tobacco) (Figure 1a, c, e–f). Based on the duplicate samples we processed, the total number of flavor chemicals and their concentrations were similar in most products with the same flavor name irrespective of country of origin (e.g., “Two Apples,” “Peach,” and “Ry4 Tobacco”). However, there were some exceptions, such as “Apple” (US-KS2 and US-CA), which was purchased in different cities within the USA and had different flavor chemical concentrations.
Individual Flavor Chemical Concentrations in LIQUA Refill Fluids
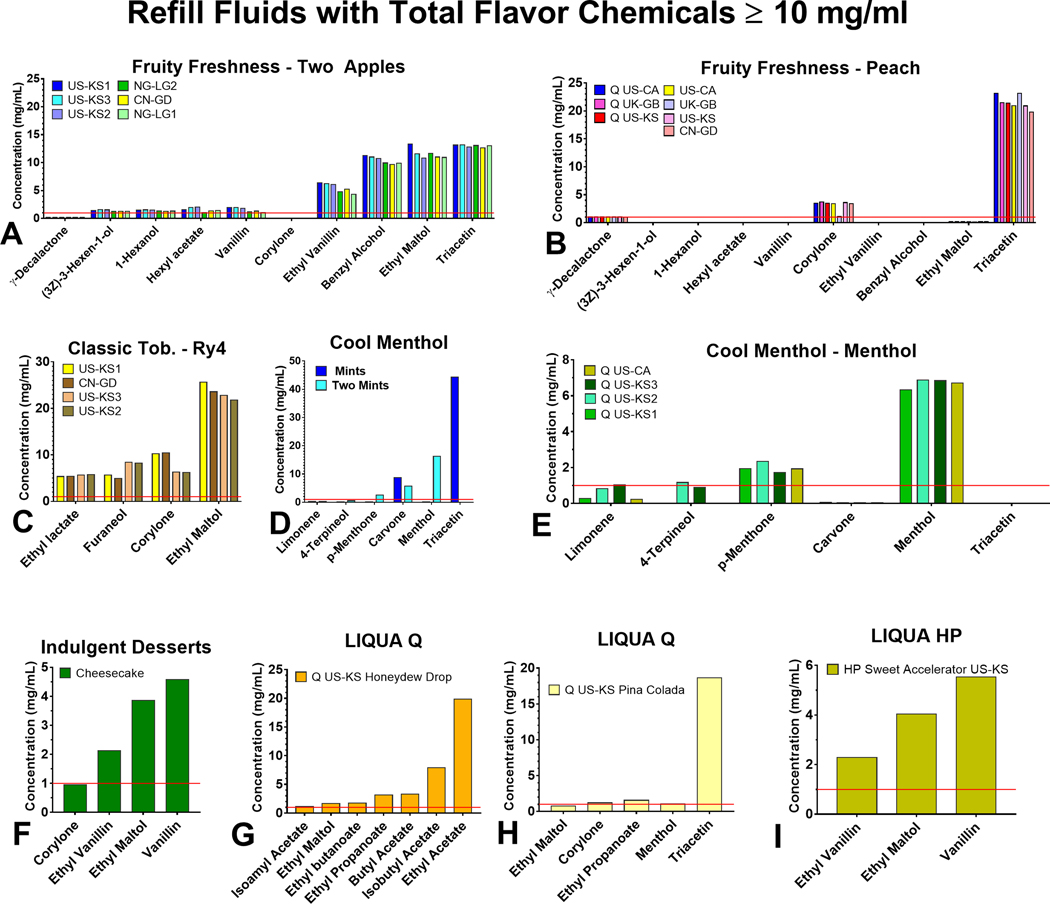
The concentrations of flavor chemicals across all products ranged from 0.001 – 44.3 mg/mL (Supplementary Figure 1, Supplementary Table 1 and 2). All products with ≥ 10 mg/mL in total flavor chemicals contained 3–9 dominant flavor chemicals (i.e., chemicals present at > 1 mg/mL), and the most frequently occurring were ethyl maltol, triacetin, corylone, ethyl vanillin, vanillin, and menthol (Figure 2). When comparing flavor chemical concentrations across duplicate products purchased in different countries, concentrations of specific chemicals were generally similar (e.g., triacetin, ethyl maltol, ethyl lactate, and menthol). However, we did find some differences. For example, the concentration of corylone was about five times lower in the “Peach” product purchased in the UK than in those from the two US sites and China. Moreover, for “Ry4 Tobacco”, the concentrations of corylone and furaneol varied with the location of purchase.
Figure 2.
Individual flavor chemicals in refill fluids with a total concentration of flavor chemicals ≥ 10 mg/mL (a) Two Apples, (b) Peach, (c) Ry4 Tobacco, (d) Mints and Two Mints, (e) Q Menthol (Authentic), (f) Cheesecake, (g) Q Honeydew Drop, (h) Q Pina Colada, (i) HP Sweet Accelerator. The x-axis shows flavor chemicals that were > 1 mg/mL, and the y-axis shows the concentration of individual flavor chemicals.
Frequency of Occurrence, Hazard Classification, and Chemical Class of Flavor Chemicals
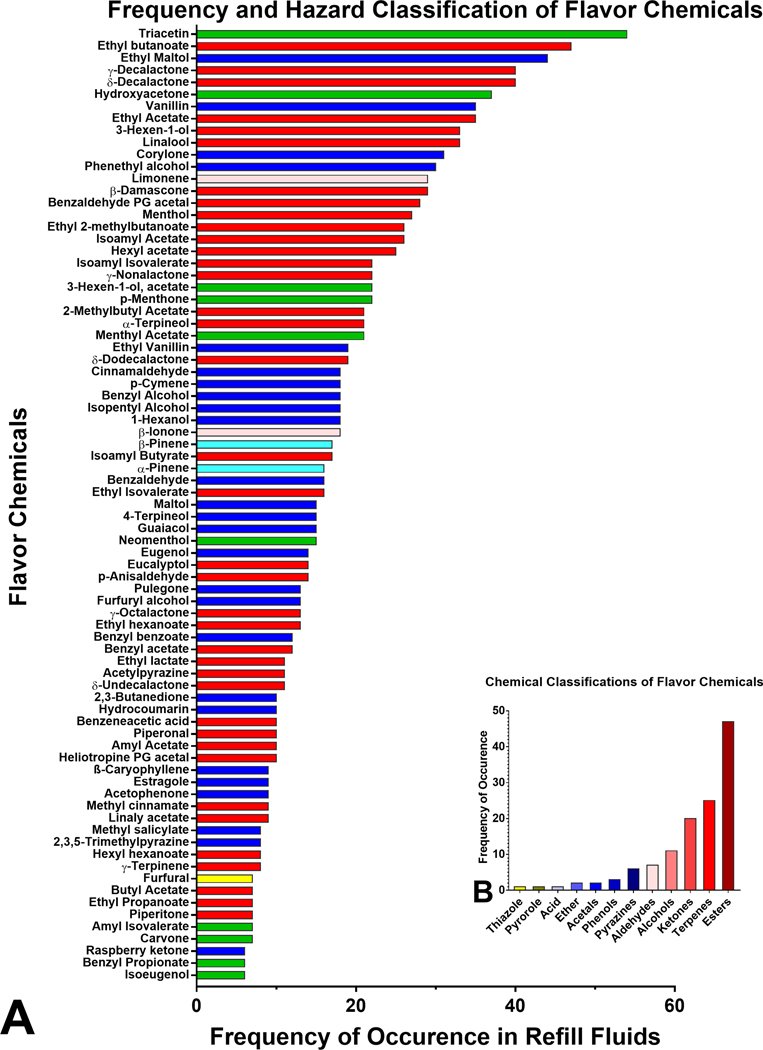
The frequency of occurrence of the 126 flavor chemicals is shown in Figure 3a and Supplemental Figure 2. In descending order of frequency, the most frequently used flavor chemicals, which appeared in at least 30 products, were triacetin (52%), ethyl butanoate (46%), ethyl maltol (43%), γ-decalactone and δ-decalactone (39%), hydroxyacetone (36%), vanillin and ethyl acetate (34%), 3-Hexen-1-ol (Z) and linalool (32%), corylone (30%), and phenethyl alcohol (29%) (Figure 3a). Less frequently used flavor chemicals that appeared in fewer than 6 products are shown in Supplementary Figure 2. Using publicly available safety information, (www.goodscents.com) 22 flavor chemicals were grouped according to their potential to cause harm (Figure 3a). Most of the flavor chemicals identified were either “irritants” (red bars) or “harmful” (blue bars). At the same time, two were “irritant and dangerous to the environment” (pink bars), 2 were “harmful and dangerous to the environment” (cyan bars), and one (furfural) was “toxic” (yellow) (Figure 3a). Additional information on flavor chemicals less frequently used is included in Supplementary Figure 2. Esters, terpenes, and ketones were the most abundant chemical classes (Figure 3b).
Figure 3.
Frequency of occurrence, hazard, and chemical classification of flavor chemicals. (a) The frequency with which individual flavor chemicals were found in at least 6 products. The x-axis is the number of refill fluids in which the chemicals were found, and the y-axis is sorted according to decreasing frequency of their occurrence, which ranged from 6 – 54 with the highest being triacetin. Chemicals appearing less frequently (≤ 5 times) are shown in Supplemental Figure 2. Colored bars represent hazard categories using the European Union safety guidelines; red = irritant, blue = harmful, yellow = toxic, green = not determined, pink = irritant and dangerous to the environment, cyan = harmful and dangerous to the environment. light yellow = toxic and dangerous to the environment. (b) The chemical classes of the flavor chemicals (x-axis) are plotted versus the frequency of occurrence of each class of flavor chemicals (y-axis).
Cytotoxicity using mNSC and BEAS-2B in the MTT assay
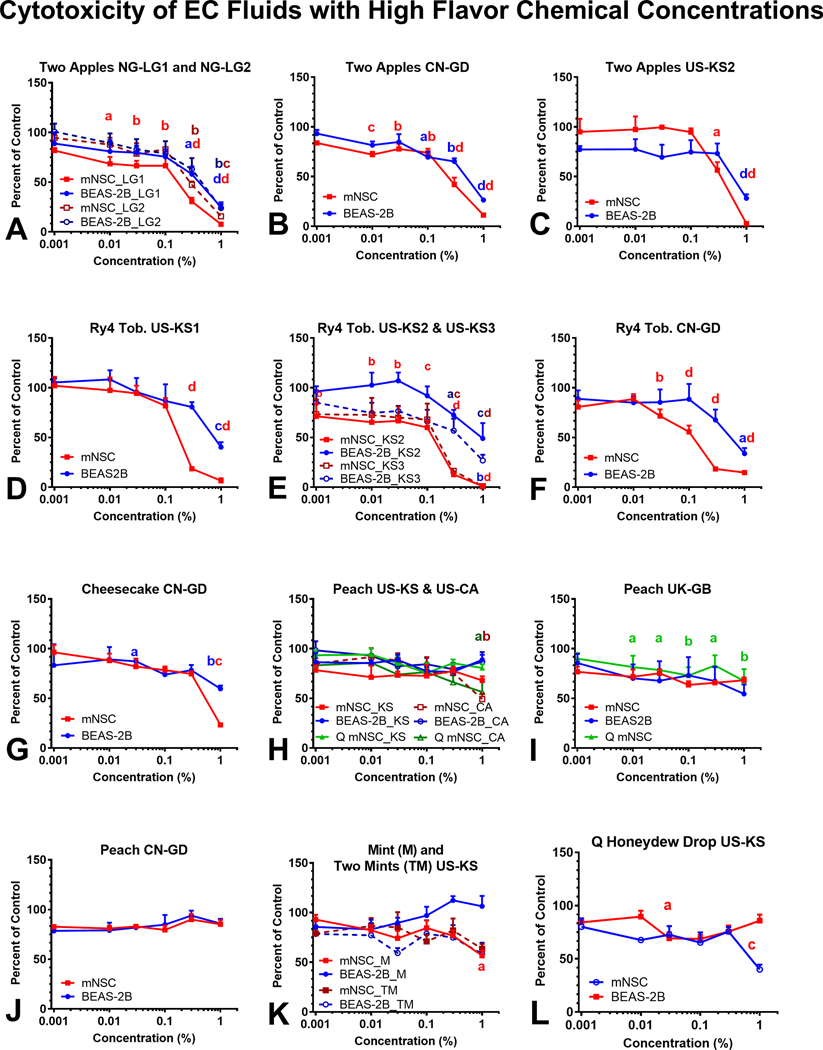
The cytotoxicity of 16 refill fluids that contained at least one flavor chemical ≥ 1 mg/mL and total flavor chemical concentrations ≥ 10 mg/mL is shown in Figure 4. The MTT assay, which evaluates the metabolic activity of mitochondria, was performed using mNSC and BEAS-2B cells after 48 hours of exposure to dilutions of refill fluids in submerged culture. Absorbances that are lower than the untreated controls indicate that the treatment decreased mitochondrial reductase activity. Cytotoxic refill fluids and their inhibitory concentrations at 70 % (IC70) and 50 % (IC50) are shown in Figure 4 and Table 2. “Two Apples” (Figure 4a–c) and “Ry4” (Figure 4d–f) were the most cytotoxic refill fluids and duplicates from multiple countries produced similar results in the MTT assay. When cytotoxicity was observed, the mNSCs were generally more sensitive to the effects of the refill fluids than the BEAS-2B cells. Even though “Cheesecake,” “Peach,” “Mints” and “Honeydew” contained relatively high concentrations of flavor chemicals, they produced little to no response in either cell type in the MTT assay.
Figure 4.
Refill fluid cytotoxicity using mNSC and BEAS-2B in the MTT assay. Concentration-response curves for (a-c) Two Apples, (d-f) Ry4 Tobacco, (g) Cheesecake, (h-j) Peach, Mints (k), and Q Honeydew Drop (l) tested with mNSC and BEAS-2B cells. The numbers after each cell type (e.g., 1 and 2 or 2 and 3) in Figures 4a and 4e indicate duplicate bottles from the same country. In Figure 4k, M = “Mint” and TM = “Two Mint”. Each point is the mean ± standard error of the mean of three independent experiments. Points with letters are significantly different from the untreated control, and points with different letters show degrees of statistical significance. a p < 0.05, b p < 0.01, c p < 0.001, d p < 0001.
Table 2.
IC70s and IC50s for Cytotoxic Refill Fluids
| Refill Fluids | Country Code1 | BEAS-2B (%)1 | mNSC (%)1 | Q mNSC (%)1 | |||
|---|---|---|---|---|---|---|---|
| IC70 | IC50 | IC70 | IC50 | IC70 | IC50 | ||
| “Two Apples” | NG-LG1 | 0.17 | 0.34 | 0.02 | 0.10 | ||
| CN-GD | 0.08 | 0.30 | 0.12 | 0.17 | |||
| NG-LG2 | 0.20 | 0.39 | 0.15 | 0.26 | |||
| US-KS2 | 0.33 | 0.68 | 0.23 | 0.33 | |||
| “Ry4 Tobacco” | US-KS2 | 0.36 | 0.89 | 0.00 | 0.05 | ||
| US-KS3 | 0.07 | 0.23 | 0.07 | 0.08 | |||
| CN-GD | 0.29 | 0.58 | 0.04 | 0.09 | |||
| US-KS1 | 0.44 | 0.77 | 0.12 | 0.17 | |||
| “Cheesecake” | CN-GD | 0.548 | >1 | 0.35 | 0.47 | ||
| “Peach” | US-CA | >1 | >1 | 0.39 | >1 | 0.22 | >1 |
| US-KS | >1 | >1 | 0.43 | >1 | - | >1 | |
| UK-GB | 0.20 | >1 | 0.05 | >1 | 0.88 | >1 | |
| CN-GD | >1 | >1 | >1 | >1 | |||
| “Mint | US-KS | - | - | 0.77 | >1 | ||
| “Two Mints” | US-KS | 0.99 | >1 | 0.02 | >1 | ||
| “Q Honeydew Drop” | US-KS | - | - | 0.01 | >1 | ||
Country Code: NG-LG = Lagos, Nigeria; CN-GD = Guangdong, China; US-KS = Kansas, USA; US-CA = California, USA; UK-GB = Great Britain, United Kingdom.
The highest concentration tested was 1% of the EC refill fluids.
Effect of Refill Fluids on Cell Growth Using Live-Cell Imaging
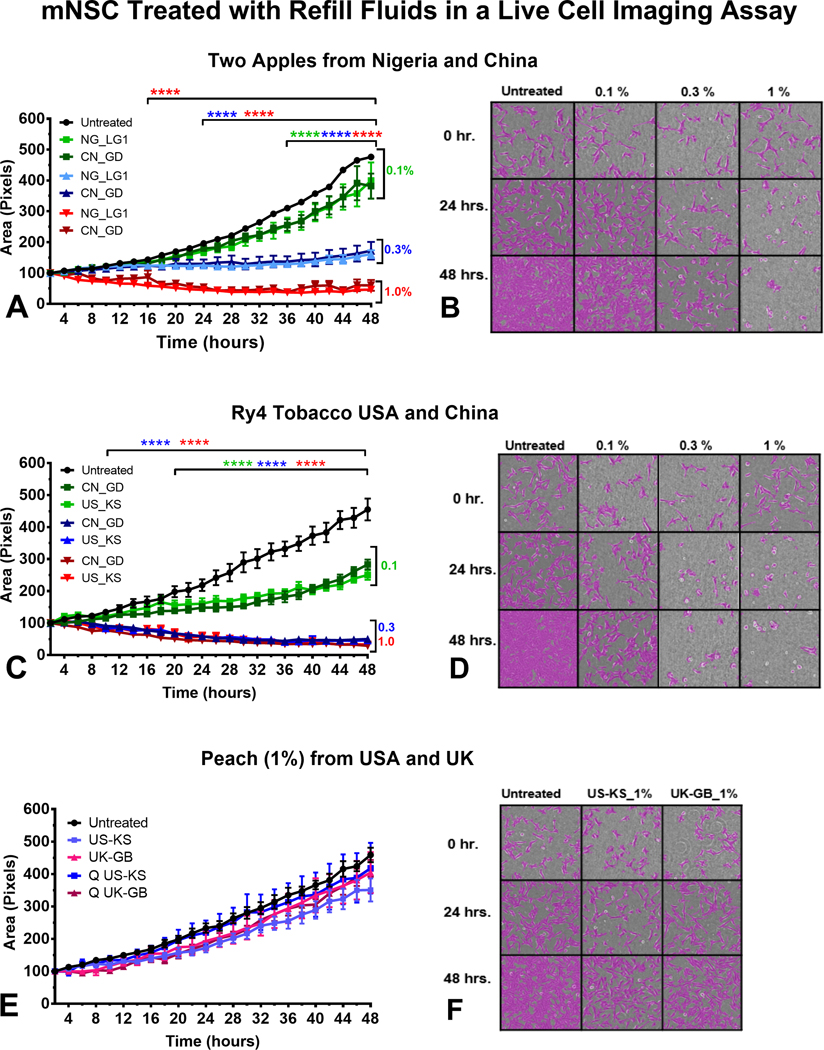
Non-invasive analysis of mNSC growth was performed using time-lapse images of cells taken over 48 hours. “Two Apples” from Nigeria and China, and “Ry4” from the USA and China inhibited cell growth in a concentration-dependent manner irrespective of country of origin (Figure 5a–d). In the treatment group with “Two Apples,” 2-way ANOVA revealed statistical significance as early as 12 hours and 20 hours for cells treated with EC refill fluid solutions at 1% (red lines) and 0.3% (blue lines). The effect observed when cells were treated with 0.1% solutions was statistically different from the control starting at 34 hours (Figure 5a). Micrographs show images taken at 0, 24, and 48 hours. Compared to the untreated group, 0.3 and 1 % concentrations inhibited cell growth early in the experiment (Figure 5b). The effects of “Ry4 Tobacco” on mNSC growth at 1% and 0.3% were similar with p values < 0.0001 starting at 10 hours (Figure 5c). 0.1% differed significantly from the control beginning at 20 hours (Figure 5c and 5d). Peach did not significantly alter growth in any treatment (Figure 5e and 5f).
Figure 5.
Effect of refill fluids on cellular growth using mNSC in the live-cell imaging assay. Time-lapse imaging was performed for mNSC cells treated with (a-b) Two apples, (c-d) Ry4 Tobacco, (e-f) Peach. The x-axis shows the duration of the experiment, and the y-axis shows the mean of the percent increase in cell area (growth) over 48 hours as determined using CL-Quant software.
Mixtures of Flavor Chemicals Sometimes Reduced Toxicity
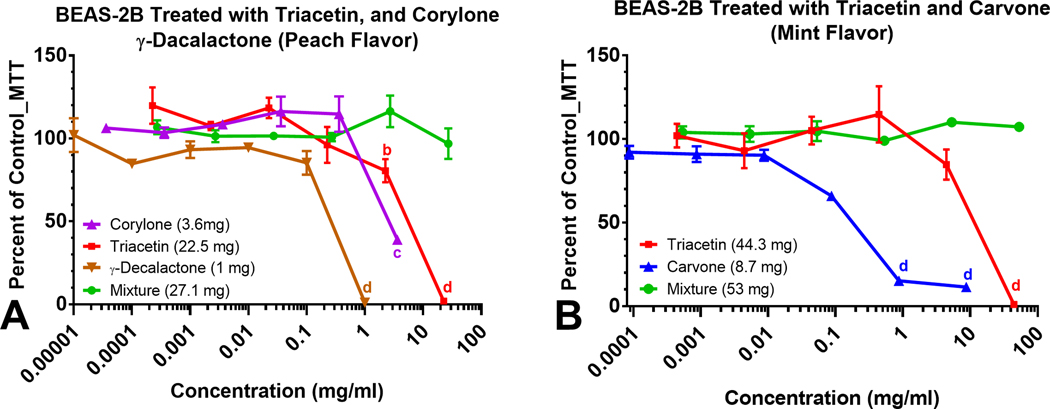
To evaluate the effects of authentic standards of flavor chemicals individually and as mixtures, BEAS-2B cells were treated with concentrations of specific flavor chemicals that were dominant in “Peach” (Figure 6a) and “Mint” (Figure 6b). Inhibitory concentrations at 70 % (IC70) and 50 % (IC50) which are indicators of cytotoxicity23 are shown in Table 3. Individually, triacetin (22 mg/mL), corylone (3.7 mg/mL), and γ-decalactone (1 mg/mL) at the concentrations found in “Peach” would be cytotoxic to BEAS-2B cells. However, when combined, there was no effect in the MTT assay (Figure 6a). Similarly, the concentrations of triacetin (44 mg/mL) and carvone (8.7 mg/mL) in “Mint” are high enough to induce significant cytotoxic effects individually, but when combined, the mixture was non-cytotoxic (Figure 6b).
Figure 6.
Concentration-response curves of dominant (> 1 mg/mL) flavor chemicals and mixtures in “Peach” and “Mint” and their cytotoxicity. Concentration-response curves of authentic standards of chemicals present in the highest concentrations in (a) Peach flavors and (b) Mint flavor. The curves show the dynamic response of BEAS-2B cells to authentic standards as individual flavor chemicals; corylone, triacetin and γ-decalactone (a), triacetin and carvone (b) and their mixtures (a and b). Each curve on the graph is the mean ± the standard error of the mean for at least three independent experiments. a p < 0.05, b p < 0.01, c p < 0.001, d p < 0001.
Table 3.
IC70s and IC50s for Authentic Standards (mg/mL)
| Flavor Chemical | In house fluid formulation1 | Concentration (mg/mL) | BEAS-2B | |
|---|---|---|---|---|
| IC70 | IC50 | |||
| Triacetin | 44.3 | 6.18 | 11.49 | |
| Carvone | 8.7 | 0.064 | 0.163 | |
| Triacetin + Carvone | “Mint” | 53 | N/A | N/A |
| Triacetin | 22.5 | 2.95 | 5.09 | |
| Corylone | 3.6 | 1.37 | 3.36 | |
| g-decalactone | 1 | 0.15 | 0.24 | |
| Triacetin + Corylone + g-decalactone | “Peach” | 27.1 | N/A | N/A |
In house fluid formulation is a combination of the dominant flavor chemicals in LIQUA “Mint” and “Peach” EC products.
Relationship between Cytotoxicity of LIQUA Products and Flavor Chemical Concentration
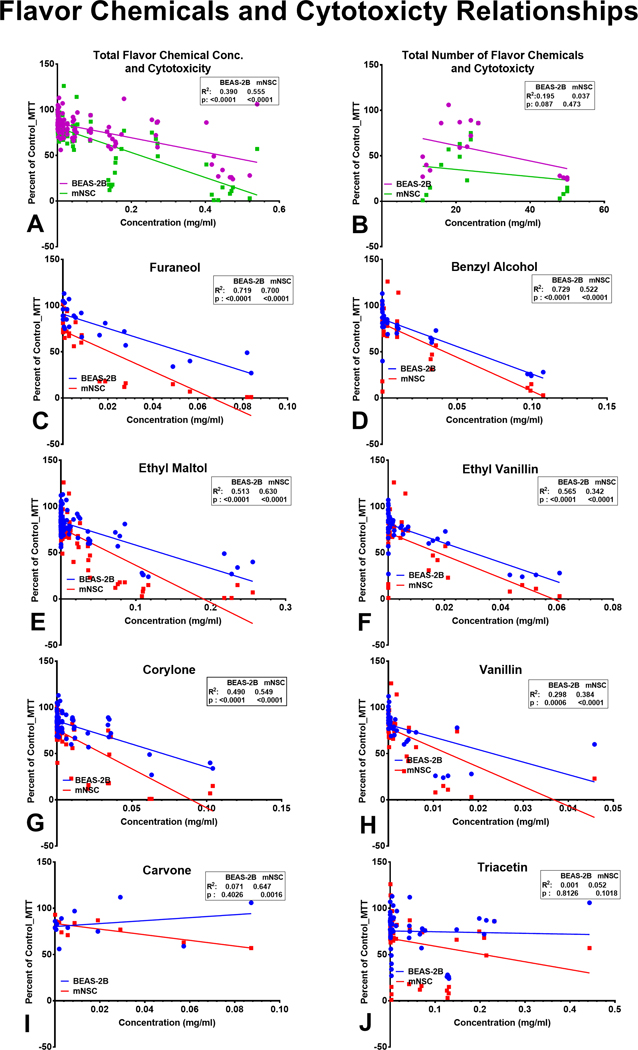
Regression analysis was performed to determine if cytotoxicity correlated with total flavor chemical concentrations (Figure 7a), the total number of flavor chemicals (Figure 7b), and the concentration of individual flavor chemicals (Figure 7c–j). The correlations were grouped into 3 categories: (1) high (R2 ≥ 0.5), (2) moderate (R2 0.11 – 0.5), and (3) low (R2 ≤ 0.1). Cytotoxicity was strongly correlated with total flavor chemical concentration (R2 = 0.56) for mNSC and moderately correlated for BEAS-2B cells (R2 = 0.39) (Figure 7a). The relationship between the total number of flavor chemicals and cytotoxicity was moderate for BEAS-2B (R2 = 0.19) and not correlated for mNSC (R2 = 0.04) (Figure 7b). The concentrations of six flavor chemicals (furaneol, benzyl alcohol, ethyl maltol, ethyl vanillin, corylone, and vanillin) were high to moderately correlated with cytotoxicity for both cell types (p values <0.0001) (Figure 7c–h). Although carvone was not very cytotoxic in the MTT assay, its concentration did correlate with cytotoxicity for mNSC cells, but not for BEAS-2B cells (Figure 7i). Triacetin concentrations, which were high in “Peach” flavored products, were not correlated with cytotoxicity for BEAS-2B cells (R2 = 0.001) or mNSC (R2 = 0.052) (Figure 7j).
Figure 7.
Linear regression analysis of refill fluid cytotoxicity and flavor chemical composition. Cytotoxicity at 1% refill fluid concentration is plotted as a function of (a) the total number of favor chemicals, (b) the total concentration of favor chemicals, (c) furaneol, (d) benzyl alcohol, (e) ethyl maltol, (f) ethyl vanillin, (g) corylone, (h) vanillin, (i) carvone, (j) triacetin. Correlation coefficients were high and statistically significant for furaneol, benzyl alcohol, ethyl maltol, and corylone with both cell lines. (c-f and h). The regression analysis revealed a statistically high and moderate correlation for ethyl vanillin with BEAS-2B and mNSC, respectively. While the correlation for vanillin was moderate and significant with both cell lines, for corylone, it was high for BEAS-2B and low for mNSC. (h-i). There was no relationship between triacetin concentration and cytotoxicity with the 1% refill fluid solution.
The Margin of Exposure Assessment of Potential Carcinogens in Refill Fluids
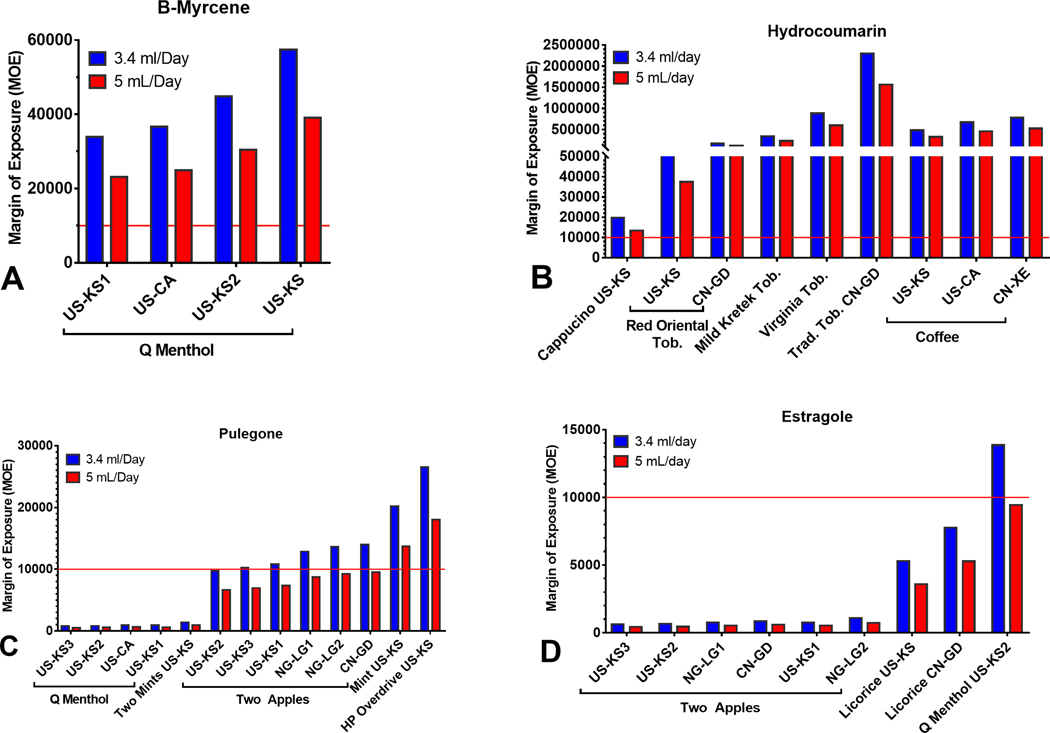
Some refill fluid chemicals are known or probable carcinogens. The Margin of Exposure (MOE) approach aids risk managers in prioritization and is used by the FDA and other expert groups to access the cancer risk of food additives.24–27 The MOE is the ratio of a reference point for an adverse effect to the estimated daily intake or exposure of a chemical in humans. Reference points obtained from experimental or epidemiological data based on dose-response curves include the BenchMark Dose (BMD), the No Observed Adverse Effect Level (NOAEL), or the Low Observed Adverse Effect Level (LOAEL). For MOEs below 10,000, cancer risk needs to be considered. We calculated MOEs for β-myrcene, hydrocoumarin, estragole, and pulegone based on an available BMD that caused a 10% increase in tumor incidence in animal models (BMDL10) and NOAELs and a user consumption of 3.4 or 5 mL of fluid/day for a body weight of 60 kg 15,24,28–30 (Table 4). The MOEs for β-myrcene and hydrocoumarin were >10,000 in all samples (Figure 8a and 8b), indicating a low cancer risk. In contrast, some products had pulegone and estragole concentrations that were well below 10,000, meaning there is a cancer risk associated with these products (Figure 8c and 8d). Q Menthol (pulegone) and Two Apple (estragole) had extremely low MOEs.
Table 4:
Summary of MOE for Potential Carcinogens/Food Additives in LIQUA Products1
| Daily Consumption | |||||
|---|---|---|---|---|---|
| Carcinogen/Food Additive | 3.4 mL | 5 mL | Reference Point | Study Ref. | |
| Q Menthol US-KS1 | B myrcene | 33916 | 23063 | 64 mg/kg bw/day (BMDL10)2 | FDA, 201824 |
| Q Menthol US-CA | 36669 | 24935 | |||
| Q Menthol US-KS2 | 44818 | 30476 | |||
| Q Menthol US-KS | 57476 | 39084 | |||
| Cappuccino US-KS | Hydrocoumarin | 19732 | 13418 | 150 mg/kg bw/day (NOAEL)3 | NTP, 199326 |
| Coffee US-KS | 483481 | 328767 | |||
| Coffee US-CA | 674410 | 458599 | |||
| Coffee CN-XE | 778547 | 529412 | |||
| Red Oriental CN-GD | 55118 | 37480 | |||
| Red Oriental CN-GD | 169412 | 115200 | |||
| Mild Kretek CN-GD | 344894 | 234528 | |||
| Virginia CN-GD | 882353 | 600000 | |||
| Traditional CN-GD | 2301790 | 1565217 | |||
| Q Menthol US-KS | Pulegone | 788 | 536 | 13.39 mg/kg bw/day (NOAEL)3 | FDA, 201824 |
| Q Menthol US-KS2 | 837 | 569 | |||
| Q Menthol US-KS1 | 918 | 624 | |||
| Q Menthol US-CA | 938 | 638 | |||
| Two Mints US-KS | 1413 | 961 | |||
| Mints US-KS | 20196 | 13733 | |||
| Two Apple US-KS2 | 9724 | 6612 | |||
| Two Apple US-KS3 | 10251 | 6971 | |||
| Two Apples US-KS1 | 10839 | 7371 | |||
| Two Apples NG-LG1 | 12877 | 8756 | |||
| Two Apples NG-LG2 | 13619 | 9261 | |||
| Two Apples CN-GD | 13982 | 9508 | |||
| HP Overdrive US-KS | 26550 | 18054 | |||
| Two Apple US-KS3 | Estragole | 637 | 433 | 3.3 mg/kg bw/day (BMDL10)2 | van den Berg, 201425 |
| Two Apple US-KS2 | 668 | 454 | |||
| Two Apples NG-LG1 | 764 | 520 | |||
| Two Apples CN-GD | 863 | 587 | |||
| Two Apples US-KS1 | 769 | 523 | |||
| Two Apples NG-LG2 | 1086 | 739 | |||
| Licorice US-KS | 5294 | 3600 | |||
| Licorice CN-GD | 7765 | 5280 | |||
| Q Menthol US-KS2 | 13866 | 9429 | |||
MOEs below the threshold of 10,000 indicates a high carcinogenic potential and concern for human health.
BMDL10 = Benchmark Dose Level with a lower confidence limit of 10%.
NOAEL = No Observed adverse Effect Level.
Figure 8.
The margin of exposure (MOE) for four potential carcinogens or food additives in LIQUA products. (a) β-Myrcene, (b) Hydrocoumarin, (c) Estragole, and (d) Pulegone. MOEs below the threshold of 10,000 indicates a high carcinogenic potential and concern for human health.
Comparison of the Dominant Flavor Chemicals in Three Refill Fluid Studies
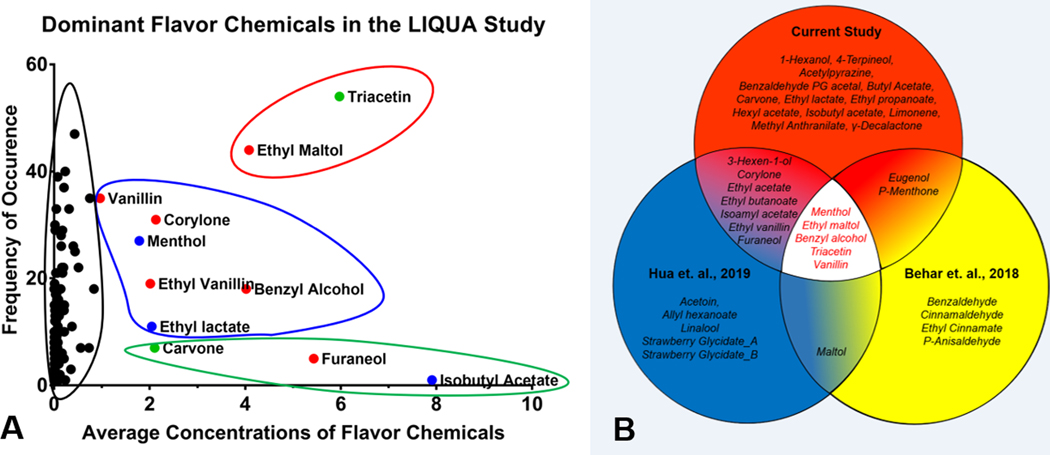
In the current study, concentrations of the flavor chemicals were averaged and plotted as a function of their frequency (Figure 9a). The dominant flavor chemicals separated into three groups. Ethyl maltol and triacetin were most frequently, followed by vanillin, corylone, menthol, ethyl vanillin, benzyl alcohol, and ethyl lactate, while carvone, furaneol, and isobutyl alcohol were infrequently used.
Figure 9.
Dominant flavor chemicals in three refill fluid studies. (a) average concentrations and the number of dominant flavor chemicals in the LIQUA study. The x-axis represents the average concentration of dominant flavor chemicals (> 1 mg/ml) found in the LIQUA EC library, and the y-axis is the frequency of occurrence of each dominant flavor chemicals. Outlines represent different groupings of average concentration and frequency of dominant flavor chemicals; red = high concentration and high frequency, blue = high concentration and mid-frequency, green = high concentration and low frequency, black = low concentration and varying frequency. Colored dots represent hazard classification according to European CLP safety criteria; red = harmful, blue = irritants, green = not determined. (b) Dominant flavor chemicals in three refill fluid libraries. Each chemical in the Venn diagram was present in at least one product in the library at > 1 mg/mL.
The individual dominant flavor chemicals (not averaged) were compared across our current and two previous studies (Supplemental Figure 4). Twenty-seven dominant flavor chemicals were identified in the present study bringing the total number across our three studies on refill fluids to 37 (Figure 9b).12,14 Of these, five flavor chemicals (benzyl alcohol, ethyl maltol, menthol, triacetin, and vanillin) were used in at least one product at > 1 mg/mL in all three studies (Figure 9b). Ten dominant chemicals (eugenol, p-menthone, maltol, (3Z)-3-Hexen-1-ol, corylone, ethyl acetate, ethyl butanoate, ethyl vanillin, furaneol, and isoamyl acetate) were in two of the three studies, and 13 (1-hexanol, 4-terpineol, acetylpyrazine, benzaldehyde PG acetal, butyl acetate, carvone, ethyl lactate, ethyl propanoate, hexyl acetate, isobutyl acetate, limonene, methyl anthranilate, γ-decalactone) were found only in the current study. Other chemicals present in only one study of our prior studies at > 1 mg/mL included acetoin, allyl hexanoate, linalool, strawberry glycidate_A and _B,14 and benzaldehyde, cinnamaldehyde, ethyl cinnamate, and p-anisaldehyde.12
DISCUSSION
This study is the first to identify and quantify the flavor chemicals in refill fluids manufactured under one brand and purchased worldwide. In general, the flavor chemicals and their concentrations were similar in duplicate bottles of refill fluids from each country. One bottle of “Apple” from Kansas, USA (US-KS2) was an exception in that it had twice the total concentration of flavor chemicals than “Apple” bottles purchased at other locations (Supplemental Table 3), These differences may be due to instability or reactivity of the flavor chemicals in these products, mislabeling, human error in compounding, or the use of different batches of ingredients during production at plants in Italy and China. While some of the “Ritchy” refill fluids that we previously purchased in Nigeria were counterfeits,17 all the products in the current study were manufactured by Ritchy LTD. Generally, the flavor chemicals and their concentrations were similar irrespective of the country of purchase.
One of our objectives was to determine which flavor chemicals are used frequently in refill fluids and to establish their concentration ranges by amalgamating data from our prior and current studies. We categorize flavor chemicals as “dominant” when they are 1 mg/ml or higher. Dominant chemicals are likely added intentionally to create the desired flavor profile. Chemicals at low concentrations (< 1 mg/ml) may be added intentionally or may be co-constituents of the dominant flavors. For example, pulegone, a potential carcinogen, 31 is often found at low concentrations in menthol-flavored products, but it is not likely added intentionally during manufacture. One hundred thirty-seven flavor chemicals were quantified in our prior12,14 and current studies (164 refill fluids total) (Supplementary Table 4). These refill fluids represent a convenience sample,12 the most popular flavors in southern California vape shops,14 and products manufactured by one company and sold worldwide (current study). Of the 137 flavor chemicals identified in the three studies, 37 were present at concentrations > 1 mg/ml and were distributed among the studies (Figure 9b). This number of flavor chemicals reinforces our earlier conclusions that a relatively small number of flavor chemicals are used in the manufacture of a broad range of EC refill fluid products.13,15 In contrast to our prior studies, triacetin was the most frequently used flavor chemical in the current LIQUA study, where it exceeded 44 mg/mL in one product. In all studies, esters were the most used chemical class with terpenes, ketones, alcohols, and aldehydes also identified. The five dominant flavor chemicals in our three studies (menthol, ethyl maltol, benzyl alcohol, triacetin, and vanillin) have also appeared in products analyzed in other labs,32–37 supporting the conclusion they are commonly used.
Most products have at least one flavor chemical that is > 1 mg/ml. Tobacco-flavored products are sometimes an exception, having few flavor chemicals at low concentrations.13,19 The LIQUA “Ry4 Tobacco” product was unusual in having four dominant flavor chemicals. Products that are a single flavor, such as menthol, peach, or cinnamon, often use one dominant flavor chemical to create the desired profile (e.g., LIQUA Peach has mainly triacetin). An exception would be LIQUA “Two Apple” which had four dominant flavor chemicals. Products with names that obscure the flavor profile, such as Dewberry Cream14 or Cheesecake (current study), often use multiple dominant flavor chemicals to create a more complex profile. Interestingly, LIQUA “Peach” and “Q Pina Colada” have very similar flavor chemicals with triacetin (~20 mg/ml) being the dominant flavor chemical in both. Presumably, some of the flavor chemicals with lower concentrations contribute to the taste and enable the users to distinguish between the two flavors. In general, the total concentration and the total number of flavor chemicals in LIQUA “Q” and “HP” products were lower than in the regular LIQUA products.
The concentrations of flavor chemicals in some LIQUA products were higher than those typically used or permitted in other consumer goods, such as fragrances and food.13 Triacetin, ethyl maltol, and corylone were used at concentrations averaging 6 mg/mL, 4 mg/mL, and 2 mg/mL, respectively (Figure 9a). While triacetin should not exceed 2% in cosmetics for external use,38 its concentration in LIQUA “Mint” was 4.4% (44 mg/mL). Ethyl maltol concentrations in edible products and cosmetics should not exceed 0.015%.39,40 However, LIQUA concentrations were 0.015% or higher in 60% (26 of 44) of the products containing ethyl maltol, with one product containing 2.6%. These concentrations exceed the MTT NOAEL (0.007 mg/mL) for ethyl maltol.14 Ethyl maltol has been linked to free radical formation,41 which could increase the cytotoxicity of these products. Likewise, the maximum average concentration of corylone in chewing gum for example, is 0.015 mg/mL,22 while in some LIQUA refill fluids, concentrations ranged between 0.03 to 10.2 mg/mL.
Flavor chemicals that were not dominant (i.e., < 1 mg/ml) may also have significant health effects, including the potential to cause cancer with chronic use. Hydrocoumarin (dihydrocoumarin or 3,4 -dihydrocoumarin), a derivative of coumarin which is prohibited in human food42 increased kidney and liver neoplasms in male rats and female mice, respectively.26 β-myrcene is a naturally occurring acyclic monoterpene which increased kidney and liver neoplasms in male rats and mice,43 resulting in its prohibition in food.24 Because the MOEs for hydrocoumarin and β-myrcene in LIQUA products were >10,000, they do not appear to present a cancer risk to EC users. In contrast, the MOEs for both pulegone and estragole were far below 10,000 in some LIQUA products, consistent with cancer risk. The “Q” version of refill fluids, which are Ritchy’s higher quality products, had the lowest MOEs, indicating that more expensive products are not necessarily safer. Pulegone levels in other EC products have likewise produced MOEs below the safe threshold.44 Pulegone, a naturally occurring oxygenated monoterpene, is a major constituent of pennyroyal plant oil extracts and several other mint plants45 and has been classified as a type 2B carcinogen by the International Agency for Research on Cancer. 45 Estragole a naturally occurring chemical found in spices, plants, and essential oils, 46–48 is a rodent hepatocarcinogen at high doses.47,49,50 While the Joint FAO/WHO Expert Committee on Food Additives concluded further research is needed to assess the risk of estragole to humans,51 the European Medicines Agency recommended keeping exposures to the lowest levels possible.48
Other flavor chemicals that are not carcinogens may cause health effects, even at low concentrations. Diacetyl (2,3, butanedione) and cinnamaldehyde were less frequently found in LIQUA products than in our other studies and ranged in concentration between 0.005 – 0.057 mg/mL and 0.003 – 0.112 mg/mL, respectively. While probably not added intentionally, diacetyl causes bronchiolitis obliterans in humans,52,53 and cinnamaldehyde is highly cytotoxic in vitro, having IC50s within the LIQUA range when tested in the MTT assay with human embryonic stem cells (0.0529 mg/mL) and human pulmonary fibroblasts (0.0489 mg/mL).54 Cinnamaldehyde also inhibits ciliary beating in bronchial epithelial cells and impairs innate immune function.55,56 Triacetin, the most frequently used flavor chemical in the LIQUA products, ranged in concentration from 0.005 to 44.333 mg/mL, a concentration significantly higher than triacetin in our other EC studies.12,14 Triacetin is a clear, colorless, oily GRAS human food and cosmetic additive that produces eye and skin irritation in humans but is non-toxic in animals when administered orally or dermally.57–59 While triacetin has relatively low cytotoxicity in vitro,14 upon heating, it produces acetic acid, which catalyzes the formation of acrolein, formaldehyde hemiacetals, and acetaldehyde from propylene glycol and glycerol.60 We are currently determining if triacetin increases the concentrations of reaction products in LIQUA aerosols. While our cytotoxicity data is based on refill fluids, other factors may affect results when heated aerosol are used. 61,62 For example, additional chemicals that can be toxic, such as 2, 3 butanedione, acetaldehyde, formaldehyde, and acrolein 63–68, may form upon heating and could alter cellular responses. In addition, 100% of the flavor chemicals may not transfer to aerosol so that users are exposed to lower concentration than those in the fluids. 19. These factors notwithstanding, in one study that compared refill fluids and aerosols, the cytotoxicity of the fluids accurately predicted that of the aerosols in 74% of the samples when one EC devise was tested. 69
The cytotoxicity of refill fluids generally correlates with the concentration of cytotoxic flavor chemicals,13,14,19 and this was observed in the current study for “Two Apples” and “Ry4 Tobacco” in the both the MTT and cell growth assays. These products contained high concentrations of ethyl maltol, benzyl alcohol, ethyl vanillin, and corylone, which were themselves directly correlated with cytotoxicity in the MTT assay. In contrast, “Peach,” with high levels of triacetin (~20 mg/ml), was not cytotoxic in the MTT or proliferation assays, even though a concentration of triacetin lower than 20 mg/ml was cytotoxic when tested individually as an authentic standard. This observation may be explained by the fact that three of the “Peach” chemicals that were cytotoxic individually (corylone, triacetin, decalactone) produced no effect when tested in a mixture (Figure 6). A similar neutralizing effect was observed when carvone and triacetin were combined (Figure 6). Both mixtures in Figure 6 contained high concentrations of triacetin, which may decrease cytotoxicity in mixtures or the presence of solvents. Previously, a similar unexpected decrease in cytotoxicity was observed when benzyl alcohol, which was cytotoxic by itself, was used in a refill fluid.14 This type of antagonism usually occurs when the chemicals in a mixture interact with each other to inhibit uptake or interaction with a target.70 Antagonism appears to be rare in EC refill fluid mixtures; however, it should be studied further as “Peach” aerosols may be cytotoxic due to reaction products formed during heating.
The MTT assay measures mitochondrial reductase activity and is widely used to evaluate mitochondrial function and cell health.71 The inhibition of cell growth by “Two Apples” and “RY4 Tobacco” may have occurred due to the reduction in ATP levels by poorly functioning mitochondria. Although not measured in this study, disruption of mitochondrial function can lead to increases in reactive oxygen species, inflammation, altered expression of genes in the electron transport chain, abnormal Ca2+ elevation, and glutathione depletion.72 These changes underlie diseases of the respiratory system including chronic obstructive pulmonary disease, asthma, and lung cancer.72,73
This study examined products sold worldwide from one manufacturer (Ritchy). The use of flavor chemicals and their concentrations may differ for refill fluids made by other companies. In addition, it is possible that LIQUA products had additional flavor chemicals that were not on our target list.
In summary, flavor chemicals in LIQUA products were generally similar in all countries of purchase. The flavor chemicals on our target list varied in total flavor chemical concentration (range = 0.0047 – 54.5 mg/mL) and the number of flavor chemicals per product (range 1 – 50) in 103 of the refill fluids we analyzed. No target and non-target flavor compound was detected in two tobacco flavored refill fluids (American Blend and Q American Blend from US-KS). Twenty-seven flavor chemicals were dominant (used in at least one product at ≥ 1 mg/mL), and triacetin was the most frequently used, often at high concentrations. Thirty-seven chemicals not identified in our prior work were present in LIQUA products. Toxicities of refill fluids correlated with total flavor chemical concentrations and with specific individual flavor chemicals (e.g., furaneol and ethyl maltol) and resulted in inhibition of mitochondrial reductases and cell proliferation. In two refill fluids, antagonism appeared to reduce the potency of individually cytotoxic flavor chemicals. In some products, flavor chemical concentrations exceeded those used in other consumer products. Pulegone and estragole, which were likely co-constituents of dominant flavor chemicals, had MOEs consistent with a risk for cancer. The regulation of flavor chemicals could improve the safety of these EC refill fluids.
Supplementary Material
Figure S1. Heat map of flavor chemicals identified and quantified in 103 LIQUA refill fluids.
Figure S2. Frequency of occurrence of flavor chemicals in 5 or fewer products (continuation of Figure 3).
Table S1. Flavor chemicals identified in the current LIQUA EC study
Table S2. Product information for 105 LIQUA EC refill fluids studied
Table S3. Concentrations of flavor chemicals in “Apple” flavored refill fluids
Table S4. Flavor chemicals identified and quantified in three independent EC studies
ACKNOWLEDGMENT
We would like to thank Paul Gerald Iyaji, Rosemary Omaiye, and Baba Lawrence Onotu, for helping with the acquisition, handling, and delivery of samples from Nigeria and Britain.
Funding Sources
The research reported in this publication was supported by grant R01ES029741 from the National Institute of Environmental Health Sciences and the Center for Tobacco Products (CTP). The content is solely the responsibility of the authors and does not necessarily represent the official views of the NIH or the Food and Drug Administration.
Footnotes
ASSOCIATED CONTENT
Supporting Information
The Supporting Information is available free of charge
REFERENCES
- 1.Pisinger C, and Døssing MA (2014). A Systematic review of health effects of electronic cigarettes. Prev. Med. 69, 248–260 [DOI] [PubMed] [Google Scholar]
- 2.Skotsimara G, Antonopoulos AS, Oikonomou E, Siasos G, Ioakeimidis N, Tsalamandris S, Charalambous G, Galiatsatos N, Vlachopoulous C, and Tousoulis D. (2019). Cardiovascular effects of electronic cigarettes: A systematic review and meta-analysis. Eur. J. Prev. Cardiol. 26(11), 1219–1228. [DOI] [PubMed] [Google Scholar]
- 3.Hua M, and Talbot P. (2016) Potential health effects of electronic cigarettes: A Systematic Review of Case Reports. Prev. Med. Rep. 4, 169–178. [DOI] [PMC free article] [PubMed] [Google Scholar]
- 4.Hua M, Alfi M, and Talbot P. (2013) Health-related effects reported by electronic cigarette users in online forums. J. Med. Internet Res. 15(4): e59. [DOI] [PMC free article] [PubMed] [Google Scholar]
- 5.Hua M, Sadah S, Hristidis V, and Talbot P. (2020) Health Effects Associated with Electronic Cigarette Use: Automated Mining of Online Forums. J. Med. Internet Res. 22(1): e15684. [DOI] [PMC free article] [PubMed] [Google Scholar]
- 6.Henry T, Kanne J, and Kligerman S. (2019). Imaging of Vaping-Associated Lung Disease. N. Engl. J. Med. 381(15), 1486–1487. [DOI] [PubMed] [Google Scholar]
- 7.Layden JE, Ghinai I, Pray I, Kimball A, Layer M, Tenforde M, Navon L, Hoots B, Salvatore P, Elderbrook M, Haupt T, Kanne J, Patel M, Saathoff-Huber L, King BA, Schier JG, Mikosz CA, and Meiman J. (2020). Pulmonary Illness Related to E-Cigarette Use in Illinois and Wisconsin — Final Report. N. Engl. J. Med. 382, 903–916 [DOI] [PubMed] [Google Scholar]
- 8.Christiani DC (2020). Vaping-Induced Lung Injury. N. Engl. J. Med. 382, 960–962. [DOI] [PubMed] [Google Scholar]
- 9.Butt YM, Smith ML, Tazelaar HD, Vaszar LT, Swanson KL, Cecchini MJ, Boland JM, Bois MC, Boyum JH, Froemming AT, Khoor A, Mira-Avendano I, Patel A, and Larsen BT, (2019). Pathology of Vaping-Associated Lung Injury. N. Engl. J. Med. 381(18), 1780–1781. [DOI] [PubMed] [Google Scholar]
- 10.Outbreak of Lung Injury Associated with the Use of E-Cigarette, or Vaping, Products. Centers for Disease Control and Prevention. 2020. https://www.cdc.gov/tobacco/basic_information/e-cigarettes/severe-lung-disease.html (Accessed 1 Jul 2020).
- 11.Furlow B. (2020). US CDC issues guidance on e-cigarette, or vaping, associated lung injury. Lancet Respir. Med. 8(1), 20. [DOI] [PubMed] [Google Scholar]
- 12.Behar RZ, Luo W, McWhirter KJ, Pankow JF, and Talbot P. (2018) Analytical and toxicological evaluation of flavor chemicals in electronic cigarette refill fluids. Sci. Rep. 8, 8288. [DOI] [PMC free article] [PubMed] [Google Scholar]
- 13.Omaiye E, McWhirter K, Luo W, Tierney P, Pankow J, and Talbot P. (2019). High concentrations of flavor chemicals are present in electronic cigarette refill fluids. Sci. Rep. 9(1). [DOI] [PMC free article] [PubMed] [Google Scholar]
- 14.Hua M, Omaiye EE, Luo W, McWhirter K, Pankow J, and Talbot P. (2019). Identification of Cytotoxic Flavor Chemicals in Top-Selling Electronic Cigarette Refill Fluids. Sci. Rep. 9(1). [DOI] [PMC free article] [PubMed] [Google Scholar]
- 15.Tierney PA, Karpinski CD, Brown JE, Luo W, and Pankow JF (2016). Flavour chemicals in electronic cigarette fluids. Tob Control. 25, e10–5 [DOI] [PMC free article] [PubMed] [Google Scholar]
- 16.Flavor Extract Manufacturers Association (FEMA). (2014). The Safety Assessment and Regulatory Authority to Use Flavors: Focus on E-Cigarettes. http://www.femaflavor.org/safety-assessment-and-regulatory-authority-use-flavors-focus-e-cigarettes (Accessed 1 Jul 2020).
- 17.Omaiye EE, Cordova L, Davis B. and Talbot P. (2017) Counterfeit Electronic Cigarette Products with Mislabeled Nicotine Concentrations. Tob. Reg. Sci. 3, 347–357. [DOI] [PMC free article] [PubMed] [Google Scholar]
- 18.Brown JE, Luo W, Isabelle LM and Pankow JF (2014). Candy flavorings in tobacco. N. Engl. J. Med. 23, 2250–2252 [DOI] [PubMed] [Google Scholar]
- 19.Omaiye E, McWhirter K, Luo W, Pankow J, and Talbot P. (2019). High-Nicotine Electronic Cigarette Products: Toxicity of JUUL Fluids and Aerosols Correlates Strongly with Nicotine and Some Flavor Chemical Concentrations. Chem. Res. Tox. 32(6), 1058–1069. [DOI] [PMC free article] [PubMed] [Google Scholar]
- 20.Bahl V, Lin S, Xu N, Davis B, Wang Y, and Talbot P. (2012) Comparison of electronic cigarette refill fluid cytotoxicity using embryonic and adult models. Reprod. Toxicol. 34, 529–537. [DOI] [PubMed] [Google Scholar]
- 21.Behar RZ, Bahl V, Wang Y, Lin S, Xu N, Davis B, and Talbot P. (2012) A method for rapid dose-response screening of environmental chemicals using human embryonic stem cells. J. Pharmacol. Toxicol. Methods. 66, 238–245 [DOI] [PubMed] [Google Scholar]
- 22.Flavor, Fragrance, Food, and Cosmetics Ingredients information. The Good Scents Company. http://www.thegoodscentscompany.com/ (Accessed 1 Jul 2020). [Google Scholar]
- 23.Biological Evaluation of Medical Devices - Part 5: Tests for in Vitro Cytotoxicity; ISO 10993–5:2009(E); ISO: Geneva, Switzerland, 2009 [Google Scholar]
- 24.United States Food and Drug Administration. (2018). Food Additive Regulations; Synthetic Flavoring Agents and Adjuvants. Federal Register 2018;83(195):50490–50503. https://www.federalregister.gov/documents/2018/10/09/2018-21807/food-additive-regulations-synthetic-flavoring-agents-and-adjuvants (Accessed 1 Jul 2020). [Google Scholar]
- 25.Scientific Opinion Of The Panel On Food Additives, Flavourings, Processing Aids And Materials In Contact With Food on a request from Commission on Flavoring Group Evaluation 78 (FGE.78). 2009. Consideration Of aliphatic and alicyclic and aromatic hydrocarbons evaluated By JECFA (63rd meeting) structurally related to aliphatic and aromatic hydrocarbons evaluated by EFSA in FGE.25. https://efsa.onlinelibrary.wiley.com/doi/epdf/10.2903/j.efsa.2009.931 (Accessed 9 September 2020). [Google Scholar]
- 26.Summary and conclusions of the sixty-fourth meeting of the Joint FAO/WHO Expert Committee on Food Additives (JECFA), Rome, 8-17 February 2005. Fao.Org, 2005, http://www.fao.org/3/a-at877e.pdf. (Accessed 9 Sept 2020). [Google Scholar]
- 27.Barlow S, Renwick A, Kleiner J, Bridges J, Busk L, Dybing E, Edler L, Eisenbrand G, Fink-Gremmels J, Knaap A, Kroes R, Liem D, Müller D, Page S, Rolland V, Schlatter J, Tritscher A, Tueting W. and Würtzen G, 2006. Risk assessment of substances that are both genotoxic and carcinogenic. Food Chem.Toxicol. 44(10), 1636–1650. [DOI] [PubMed] [Google Scholar]
- 28.van den Berg S, Alhusainy W, Restani P. and Rietjens I. (2014). Chemical analysis of estragole in fennel-based teas and associated safety assessment using the Margin of Exposure (MOE) approach. Food Chem. Toxicol. 65, 147–154. [DOI] [PubMed] [Google Scholar]
- 29.National Toxicology Program. Toxicology and carcinogenesis studies of 3,4-dihydrocoumarin (CAS No. 119–84-6) in F344/N rats and B6C3F1 mice (gavage studies). (1993). Natl. Toxicol. Program Tech. Rep. Ser. 423, 1–336 [PubMed] [Google Scholar]
- 30.Dawkins L, Turner J, Roberts A, and Soar K. (2013). ‘Vaping’ profiles and preferences: an online survey of electronic cigarette users. Addiction. 108(6), 1115–25. [DOI] [PubMed] [Google Scholar]
- 31.National Toxicology Program. Toxicology and carcinogenesis studies of pulegone (CAS No. 89–82-7) in F344/N rats and B6C3F1 mice (gavage studies). (2011). Natl. Toxicol. Program Tech. Rep. Ser. 563, 1–201 [PubMed] [Google Scholar]
- 32.Hutzler C, Paschke M, Kruschinski S, Henkler F, Hahn J, and Luch A. (2014).Chemical hazards present in liquids and vapors of electronic cigarettes. Arch. Toxicol. 88, 1295–1308 [DOI] [PubMed] [Google Scholar]
- 33.Gerloff J, Sundar IK, Freter R, Sekera ER, Friedman RR, Pagano T, and Rahman I. (2017). Inflammatory response and barrier dysfunction by different e-cigarette flavoring chemicals identified by gas chromatography-mass spectrometry in e-liquids and e-vapors on human lung epithelial cells and fibroblasts. Appl. In Vitro Toxicol. 3, 28–40. [DOI] [PMC free article] [PubMed] [Google Scholar]
- 34.Rowell TR, Reeber SL, Lee SL, Harris RA, Nethery RC, Herring AH, Glish GL, and Tarran R. (2017). Flavored e-cigarette liquids reduce proliferation and viability in the CALU3 airway epithelial cell line. Am. J. Physiol. Lung Cell. Mol. Physiol. 313(1), L52–L66. [DOI] [PMC free article] [PubMed] [Google Scholar]
- 35.Aszyk J, Kubica P, Wózniak MK, Namiésnik J, Wasik A, Kot-Wasik A. (2018). Evaluation of flavour profiles in e-cigarette refill solutions using gas chromatography-tandem mass spectrometry. J. Chromatogr. A. 1547, 86–98. [DOI] [PubMed] [Google Scholar]
- 36.Sassano MF et al. (2018). Evaluation of e-liquid toxicity using an open-source high-throughput screening assay. Plos Biol. 16(3), e2003904. [DOI] [PMC free article] [PubMed] [Google Scholar]
- 37.Czoli CD, Goniewicz ML, Palumbo M, Leigh N, White CM, and Hammond D. (2019). Identification of flavouring chemicals and potential toxicants in e-cigarette products in Ontario, Canada. Can. J. Public Health. 110, 542–550 [DOI] [PMC free article] [PubMed] [Google Scholar]
- 38.Opdyke DLJ (1978). Monographs of fragrance raw materials: Triacetin. Food Cosmet. Toxicol. 16, 879–882. [DOI] [PubMed] [Google Scholar]
- 39.Oser BL, and Ford RA (1977). Recent Progress in the Consideration of Flavoring Ingredients Under the Food Additives Amendment. [online] Femaflavor.org. Available at: https://www.femaflavor.org/sites/default/files/10.GRAS%20Substances%20(3477-3525).pdf (Accessed 1 Jul 2020). [Google Scholar]
- 40.Opdyke DLJ (1975). Monographs of fragrance raw materials: ethyl maltol. Food Cosmet Toxicol. 13, 805–806 [DOI] [PubMed] [Google Scholar]
- 41.Bitzer ZT, Goel R, Reilly SM, Elias RJ, Silakov A, Foulds J, Muscat J, Richie JP Jr. (2018). Effect of flavoring chemicals on free radical formation in electronic cigarette aerosols. Free Radic. Biol. Med. 120, 72–79. [DOI] [PMC free article] [PubMed] [Google Scholar]
- 42.U.S. Food and Drug Administration. (2018). “Substances Prohibited from Use in Human Food.” Code of Federal Regulations, title 21 C.F.R.§189.130. https://www.govinfo.gov/content/pkg/CFR-2018-title21-vol3/pdf/CFR-2018-title21-vol3-sec189-130.pdf (Accessed 26 Mar 2020). [Google Scholar]
- 43.National Toxicology Program. Toxicology and carcinogenesis studies of β--myrcene (CAS No. 123–35-3) in F344/N rats and B6C3F1 mice (gavage studies). (2010). Natl.Toxicol. Program Tech. Rep. Ser. 557, 1–169 [PubMed] [Google Scholar]
- 44.Jabba SV, Jordt S-E. Risk Analysis for the Carcinogen Pulegone in Mint- and Menthol-Flavored e-Cigarettes and Smokeless Tobacco Products. (2019). JAMA Intern. Med. 179, 1721–1723. [DOI] [PMC free article] [PubMed] [Google Scholar]
- 45.Grosse Y, Loomis D, Lauby-Secretan B, Ghissassi F, Bouvard V, Benbrahim-Tallaa L, Guha N, Baan R, Mattock H. and Straif K, 2013. Carcinogenicity of some drugs and herbal products. Lancet Oncol. 14(9), 807–808. [DOI] [PubMed] [Google Scholar]
- 46.Smith RL, Adams TB, Doull J, Feron VJ, Goodman JI, Marnett LJ, Portoghese PS, Waddell WJ, Wagner BM, Rogers AE, Caldwell J, and Sipes IG, (2002). Safety assessment of allylalkoxybenzene derivatives used as flavouring substances – methyl eugenol and estragole. Food Chem. Toxicol. 40 (7), 851–870. [DOI] [PubMed] [Google Scholar]
- 47.De Vincenzi M, Silano M, Maialetti F, and Scazzocchio B. (2000). Constituents of aromatic plants: II. Estragole. Fitoterapia. 71(6), 725–729. [DOI] [PubMed] [Google Scholar]
- 48.European Medicines Agency (EMA). (2014). Public Statement on The Use of Herbal Medicinal Products 5 Containing Estragole. https://www.ema.europa.eu/en/documents/public-statement/public-statement-use-herbal-medicinal-products-containing-estragole_en.pdf (Accessed 1 Jul 2020).
- 49.Miller JA, and Miller EC (1983). The metabolic activation and nucleic acid adducts of naturally-occurring carcinogens: recent results with ethyl carbamate and the spice flavors safrole and estragole. Br. J. Cancer 48, 1–15 [DOI] [PMC free article] [PubMed] [Google Scholar]
- 50.National Toxicology Program. NTP Technical Report on the 3-month toxicity studies of estragole (CAS No. 140–67-0) administered by gavage to F344/N rats and B6C3F1 mice. (2011). Natl. Toxicol. Program Tech. Rep. Ser. 82, 1–111 [Google Scholar]
- 51.Evaluation of certain food additives and contaminants. (Sixty-eighth report of the Joint FAO/WHO Expert Committee on Food Additives). (2007). WHO Technical Report Series, No. 947. https://apps.who.int/iris/bitstream/handle/10665/44062/WHO_TRS_952_eng.pdf;jsessionid=12F836165BFD51490AA446683A8A8FEE?sequence=1 (Accessed 1 Jul 2020). [Google Scholar]
- 52.National Institute for Occupational Safety and Health (NIOSH). (2011). Criteria for a recommended standard: occupational exposure to diacetyl and 2,3-Pentanedione. Available at https://www.cdc.gov/niosh/docket/archive/pdfs/NIOSH-245/0245-081211-draftdocument.pdf (Accessed 1 Jul 2020).
- 53.Centers for Disease Control and Prevention (CDC). (2007). Fixed obstructive lung disease among workers in the flavor-manufacturing industry--California, 2004–2007. Morb. Mortal Wkly. Rep. 56, 389–393 (2007). https://www.cdc.gov/mmwr/preview/mmwrhtml/mm5616a2.htm (Accessed 1 Jul 2020). [PubMed] [Google Scholar]
- 54.Behar RZ, Davis B, Wang Y, Bahl V, Lin S, and Talbot P. (2014). Identification of toxicants in cinnamon-flavored electronic cigarette refill fluids. Toxicol. In Vitro. 28, 198–208 [DOI] [PubMed] [Google Scholar]
- 55.Clapp PW, Pawlak EA, Lackey JT, Keating JE, Reeber SL, Glish GL, and Jaspers I. (2017). Flavored e-cigarette liquids and cinnamaldehyde impair respiratory innate immune cell function. Am. J. Physiol. Lung Cell. Mol. Physiol. 313(2), L278–L292. [DOI] [PMC free article] [PubMed] [Google Scholar]
- 56.Clapp PW, Lavrich KS, van Heusden CA, Lazarowski ER, Carson JL, and Jaspers I. (2019). Cinnamaldehyde in flavored e-cigarette liquids temporarily suppresses bronchial epithelial cell ciliary motility by dysregulation of mitochondrial function Am. J. Physiol. Lung Cell. Mol. Physiol. 316(3), L470–L486. [DOI] [PMC free article] [PubMed] [Google Scholar]
- 57.Fiume M. (2003). Final Report on the Safety Assessment of Triacetin. Int. J. Toxicol. 22(3), 1–10. [PubMed] [Google Scholar]
- 58.Li RC, Sah PPT, and Anderson HH (1941). Acute Toxicity of Monacetin, Diacetin and Triacetin. Exp. Biol. Med. 46, 26–28. [Google Scholar]
- 59.United States Environmental Protection Agency. (2017). Provisional Peer-Reviewed Toxicity Values for Triacetin. https://cfpub.epa.gov/ncea/risk/recordisplay.cfm?deid=339182 (Accessed 1 Jul 2020).
- 60.Vreeke S, Peyton DH, and Strongin RM. (2018) Triacetin Enhances Levels of Acrolein, Formaldehyde Hemiacetals, and Acetaldehyde in Electronic Cigarette Aerosols. ACS Omega. 3, 7165–7170. [DOI] [PMC free article] [PubMed] [Google Scholar]
- 61.Cirillo S, Vivarelli F, Turrini E, Fimognari C, Burattini S, Falcieri E, Rocchi M, Cardenia V, Rodriguez-Estrada M, Paolini M. and Canistro D, 2019. The Customizable E-cigarette Resistance Influences Toxicological Outcomes: Lung Degeneration, Inflammation, and Oxidative Stress-Induced in a Rat Model. Toxicol Sci. 172(1), 132–145. [DOI] [PubMed] [Google Scholar]
- 62.Kaur G, Pinkston R, Mclemore B, Dorsey W. and Batra S, 2018. Immunological and toxicological risk assessment of e-cigarettes. Eur Respir Rev. 27, 170119. [DOI] [PMC free article] [PubMed] [Google Scholar]
- 63.Behar R, Luo W, Lin S, Wang Y, Valle J, Pankow J. and Talbot P. (2016). Distribution, quantification and toxicity of cinnamaldehyde in electronic cigarette refill fluids and aerosols. Tob Control, 25(Suppl 2), pp.ii94–ii102. [DOI] [PMC free article] [PubMed] [Google Scholar]
- 64.Jensen R, Luo W, Pankow J, Strongin R. and Peyton D. (2015). Hidden Formaldehyde in E-Cigarette Aerosols. N Engl J Med. 372(4), 392–394. [DOI] [PubMed] [Google Scholar]
- 65.Uchiyama S, Senoo Y, Hayashida H, Inaba Y, Nakagome H. and Kunugita N. (2016). Determination of Chemical Compounds Generated from Second-generation E-cigarettes Using a Sorbent Cartridge Followed by a Two-step Elution Method. Anal Sci. 32(5), 549–555. [DOI] [PubMed] [Google Scholar]
- 66.Kosmider L, Sobczak A, Fik M, Knysak J, Zaciera M, Kurek J. and Goniewicz M, 2014. Carbonyl Compounds in Electronic Cigarette Vapors: Effects of Nicotine Solvent and Battery Output Voltage. Nicotine Tob Res. 16(10), 1319–1326. [DOI] [PMC free article] [PubMed] [Google Scholar]
- 67.Wang P, Chen W, Liao J, Matsuo T, Ito K, Fowles J, Shusterman D, Mendell M. and Kumagai K, 2017. A Device-Independent Evaluation of Carbonyl Emissions from Heated Electronic Cigarette Solvents. PLOS ONE, 12(1), p.e0169811. [DOI] [PMC free article] [PubMed] [Google Scholar]
- 68.Reilly S, Bitzer Z, Goel R, Trushin N. and Richie J, 2018. Free Radical, Carbonyl, and Nicotine Levels Produced by Juul Electronic Cigarettes. Nicotine Tob Res. 21(9), 1274–1278. [DOI] [PMC free article] [PubMed] [Google Scholar]
- 69.Behar R, Wang Y. and Talbot P, 2017. Comparing the cytotoxicity of electronic cigarette fluids, aerosols and solvents. Tob Control. 27(3), 325–333. [DOI] [PMC free article] [PubMed] [Google Scholar]
- 70.Heys KA, Shore RF, Pereira MG, Jones KC, and Martin FL (2016). Risk assessment of environmental mixture effects. RSC Adv. 6, 47844–47857. [Google Scholar]
- 71.Riss TL, Moravec RA, Niles AL, Duellman S, Benink HA, Worzella TJ, and Minor L. (2016) Cell Viability Assays. 2013 May 1 [Updated 2016 Jul 1]. In: Sittampalam GS, Grossman A, Brimacombe K, et al. , editors. Assay Guidance Manual [Internet]. Bethesda (MD): Eli Lilly & Company and the National Center for Advancing Translational Sciences. (2004). https://www.ncbi.nlm.nih.gov/books/NBK144065/ (Accessed: 26 Mar 2020). [Google Scholar]
- 72.Cloonan SM, and Choi AMK (2016). Mitochondria in lung disease. J. Clin. Invest. 126, 809–820 [DOI] [PMC free article] [PubMed] [Google Scholar]
- 73.Yue L, and Yao H. (2016). Mitochondrial dysfunction in inflammatory responses and cellular senescence: pathogenesis and pharmacological targets for chronic lung diseases. Br. J. Pharmacol. 173(15), 2305–2318. [DOI] [PMC free article] [PubMed] [Google Scholar]
Associated Data
This section collects any data citations, data availability statements, or supplementary materials included in this article.
Supplementary Materials
Figure S1. Heat map of flavor chemicals identified and quantified in 103 LIQUA refill fluids.
Figure S2. Frequency of occurrence of flavor chemicals in 5 or fewer products (continuation of Figure 3).
Table S1. Flavor chemicals identified in the current LIQUA EC study
Table S2. Product information for 105 LIQUA EC refill fluids studied
Table S3. Concentrations of flavor chemicals in “Apple” flavored refill fluids
Table S4. Flavor chemicals identified and quantified in three independent EC studies


