Abstract
Background:
MRI exams for patients with MR-conditional active implantable medical devices (AIMDs) are contraindicated unless specific conditions are met. This limits the maximum specific absorption rate (SAR, W/kg). Currently, there is no general framework to guide meeting a lower SAR limit.
Purpose:
To design and evaluate a workflow for modifying MRI protocols to whole-body SAR (WB-SAR ≤0.1 W/kg) and local-head SAR (LH-SAR ≤0.3 W/kg) limits while mitigating the impact on image quality and exam time.
Study Type:
Prospective.
Population:
Twenty healthy volunteers on head (n = 5), C-spine (n = 5), T-spine (n = 5), and L-spine (n = 5) with IRB consent.
Assessment:
Vendor-provided head, C-spine, T-spine, and L-spine protocols (SARRT) were modified to meet both low SAR targets (SARLOW) using the proposed workflow. in vitro SNR and CNR were evaluated with a T1-T2 phantom. in vivo image quality and clinical acceptability were scored using a 5-point Likert scale for two blinded readers.
Field Strength/Sequences:
1.5T/spin-echoes, gradient-echoes.
Statistical Analysis:
In vitro SNR and CNR values were evaluated with a repeated measures general linear model. in vivo image quality and clinical acceptability were evaluated using a generalized estimating equation analysis (GEE). The two reader’s level of agreement was analyzed using Cohen’s kappa statistical analysis.
Results:
Using the workflow, SAR limits were met. LH-SAR: 0.12 ± 0.02 W/kg, median (SD) values for LH-SAR were 0.12 (0.02) W/kg and WB-SAR: 0.09 (0.01) W/kg. Examination time did not increase ≤2x the initial time. SARRT SNR values were higher and significantly different than SARLOW (P < 0.05). However, no significant difference was observed between the CNR values (value = 0.21). Median (IQR) CNR values were 14.2 (25.0) vs. 15.1 (9.2) for head, 12.1 (16.9) vs. 25.3 (14.2) for C-spine, 81.6 (70.1) vs. 71.0 (26.6) for T-spine, and 51.4 (52.6) vs. 37.7 (27.3) for L-spine. Image quality scores were not significantly different between SARRT and SARLOW (median [SD] scores were 4.0 [0.01] vs. 4.3 [0.2], P > 0.05).
Data Conclusion:
The proposed workflow provides guidance for modifying routine MRI exams to achieve low SAR limits. This can benefit patients referred for an MRI exam with low SAR MR-conditional AIMDs.
Level of Evidence:
1
Technical Efficacy Stage:
5
MAGNETIC RESONANCE IMAGING (MRI) examinations of patients with active implantable medical devices (AIMDs), such as pacemakers and deep brain stimulators (DBS), pose several safety-related risks. The potential risks that arise from the interaction of the AIMD with the MRI’s magnetic fields can induce irreversible device or tissue damage. For instance, the static magnetic field (B0) can cause the device to move due to displacement forces and torques. The gradient and radiofrequency (RF) fields can induce currents that can cause device vibration and heating.1 RF-induced heating is one of the principal safety concerns, as it can damage both the AIMD and the surrounding tissue. Additionally, during an MRI examination, the AIMDs can malfunction, leading to an unintended deliver of the AIMD therapy. Technical guides such as ISO/TS 10974 and IEC 60601–2-33 are available to guide assessment of the level of interactions of the AIMD with the MRI magnetic fields.2,3
This testing provides insight to the expected risks during an MRI exam, which are needed to guide labeling of the device as: MR-safe, MR-conditional, or MR-unsafe. Currently, AIMDs are only available with MR-unsafe or MR-conditional labeling. Per US Food and Drug Administration (FDA)-approved device labeling, patients with MR-conditional AIMDs should not be scanned unless specific safety conditions are met.4,5 These device-specific limits may include: 1) B0 field strength [T]; 2) B0 field spatial gradient [T/m]; 3) the time-rate-of-change of the magnetic field [dB/dt]; 4) deactivation of the device therapy (MR-mode); 5) scanner reported specific absorption rate (SAR, W/kg); and 6) limits the total scan duration, the sequence duration, or the time between sequences.
To date, the rate of implantations of MR-conditional AIMDs is increasing.6 Therefore, it is important that MRI clinics have strategies to make MRI protocols that meet device labeling readily available. Currently, however, while the AIMD conditions are provided by the device manufacturer (eg, SAR <0.1 W/kg), there is limited available guidance to meet these conditions. Routine MRI exams of patients without AIMDs are often performed under normal operating mode, where whole-body SAR and local-head SAR are restricted to ≤2 W/kg and ≤3.2 W/kg.2 Thus, routine protocols are typically optimized to the highest achievable image quality under normal operating mode. On the other hand, to avoid RF-induced heating, MR-conditional AIMDs have specific SAR limits that are typically well below the normal operating mode SAR limit. For instance, some DBS devices are only approved for MRI with whole-body SAR (WB-SAR) ≤0.1 W/kg.7 Consequently, routine protocols need to be modified to meet the AIMD’s specific SAR condition.
To modify a protocol to meet a specific SAR limit several sequence parameters can be modified.8 The two simplest modifications to reduce SAR are to increase repetition time (TR) and to reduce flip angle (FA). Modifying these sequence parameters, however, can alter image contrast, extend scan time, and alter overall image quality. Furthermore, because SAR is patient-dependent,9 modifying protocols on-the-fly to meet a patient-specific SAR target can be time-consuming. To date, there exists limited guidance for modifying MRI protocols to meet low SAR targets while limiting the impact on image quality. Hence, MRI exams for patients with AIMDs who have low SAR conditions may be deferred owing, in part, to uncertainty about how to meet the SAR restriction.
Previous research has demonstrated the feasibility of creating a head-specific MRI protocol with WB-SAR limits of 0.1 W/kg while maintaining image quality.10–13 To date, however, a general workflow that can guide meeting a specific SAR limit while limiting the impact on image quality is not available. The purpose of this work to design and evaluate a workflow for modifying routine MRI protocols with a low WB-SAR (0.1 W/kg) and local-head (LH-SAR, 0.3 W/kg) targets while mitigating the impact on image quality or scan time. Independent of the type of AIMD (eg, pacemaker or neurostimulator), head and spine protocols are the most common clinical referral.14 Therefore, vendor-provided protocols for head, C-spine, T-spine, and L-spine were modified to meet WB-SAR ≤0.1W/kg and LH-SAR ≤0.3 W/kg.
Theory
SAR is defined as the average rate of energy deposited by the RF field and absorbed by the tissue. The whole-body SAR refers to the average over the whole mass, whereas local-SAR refers to the average over 10 grams. According to the IEC, under normal operating mode the temperature increase shall not increase >1°C during 6 minutes of RF application.2
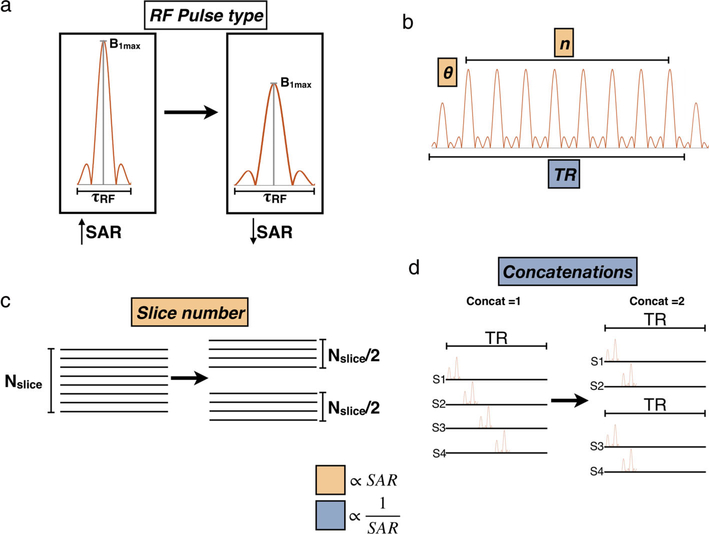
Reducing the power produced by the RF coil generally means that the SAR will be lower, but also impacts the MR signal. The MR signal depends on the tissue relaxation, the sequence type, and depends on a complex relationship between several sequence parameters. Therefore, while it is possible to reduce SAR without negatively affecting the MR signal, increases in scan time may be needed. According to Hecker et al,15 SAR depends on the RF pulse type and the rate of RF pulse repetition. In general, SAR increases with: an increasing flip angle (α), a decreasing TR, an increasing number of RF pulses per TR, increasing turbo factor, a higher number of slices per TR, or a decreasing number of concatenations (splitting of multislice volumes into smaller groups). A schematic of each parameter is shown in Fig. 1 and their limit modifications are stated in Table S1 in the Supplemental Material.
FIGURE 1:
Schematic that represents parameters that affect SAR.SAR can be reduced by reducing the amplitude and increasing the duration of the RF pulse (a), by reducing the flip angle and the number of RF pulses per TR (b), by reducing the number of slices per acquisition (c), and by increasing concatenations (d).
Methods
The majority of MR-conditional devices have labeling for 1.5T only. Therefore, the SAR reduction workflow was designed and image acquisition was performed using a clinical 1.5T scanner (Siemens, Erlangen, Germany, Avanto Fit). Vendor-provided head, C-spine, T-spine, and L-spine protocols were modified for each subject until the scanner reported WB-SAR ≤0.1 W/kg and LH-SAR ≤0.3 W/kg using the following workflow.
Workflow Design
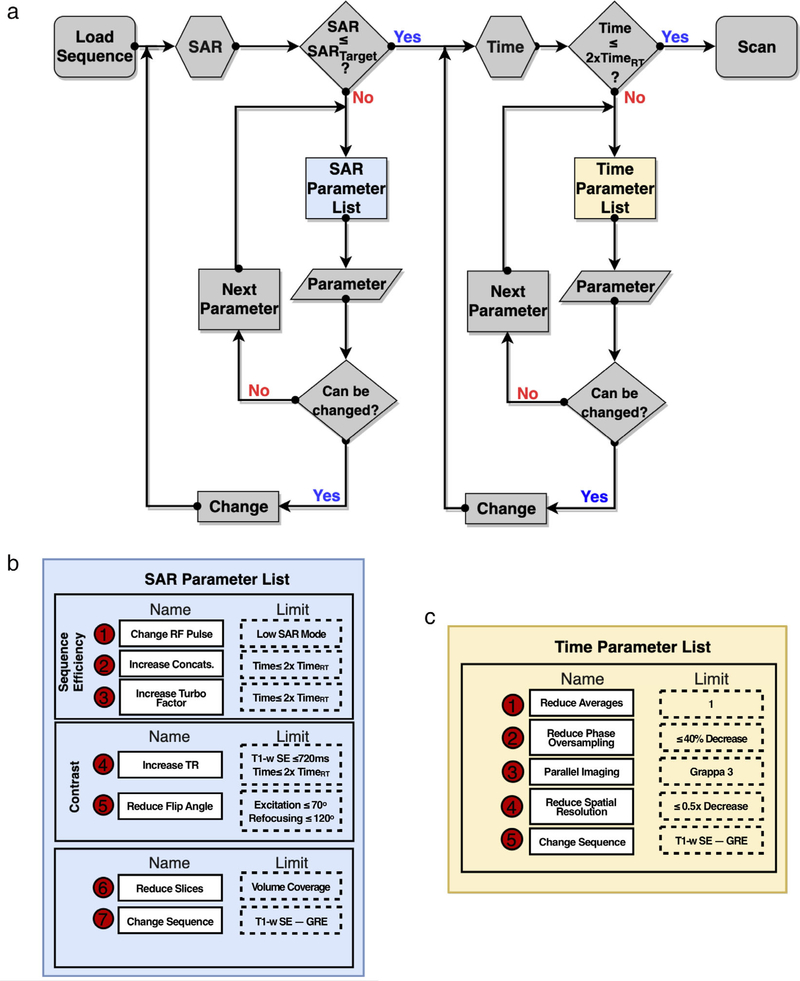
The workflow was designed to modify sequences from a vendor-provided MRI protocol with a routine SAR (SARRT) level to meet a specific SAR limit in an iterative manner subject to three principal and ordered restrictions: 1) minimize changes in image contrast; 2) limit each sequence’s increased duration to ≤2x; and 3) limit the decrease of in-plane spatial resolution to an increase in in-plane voxel dimensions ≤2x. The workflow consists of two iterations: the first one is focused on SAR reductions and the second iteration is dedicated to improving scan time. SAR depends on many sequence parameters. The ones considered for modification, with their respective limits, are summarized in Table S1 in the Supplemental Material. All of these parameters were modified sequentially and their modification followed this specific order.
The workflow starts by evaluating the patient-specific scanner-reported SAR value at the scanner’s console. If the SAR value exceeds the target, then a parameter from the SAR parameter list is selected and modified in a stepwise manner. If the SAR target is not reached and the parameter limit has been reached, then the subsequent parameter is selected until reaching the target SAR value. After SAR modification and given that the scan time may exceed >2x the initial time, a second iteration can be used to meet the imposed time criteria. Note, however, that some sequences cannot be modified to reach the SAR target using this workflow. In this case, a surrogate sequence is needed.
Protocol Modification
The vendor-provided routine protocols (SARRT) for the head, C-spine, T-spine, and L-spine (Table 1) were first modified to create baseline low-SAR protocols (SARLow) using a T1-T2 phantom (Model 130, QalibreMD, Boulder, CO). The phantom was placed in the scanner. Images were acquired for head and C-spine protocols using a 20-channel receive-only head coil. A 24-channel receive-only spine matrix coil was used for T-spine and L-spine protocols. All RF transmissions used the body coil. Height and weight registered in the console were set up to match male values (70 kg, 170 cm).16
TABLE 1.
Routine MRI Sequences Corresponding to Each Exam Region
| Head | C-Spine | T-Spine | L-Spine | |||
|---|---|---|---|---|---|---|
| SE | T1 | SAG | ✓ | ✓ | ✓ | ✓ |
| COR | ✓ | |||||
| AX | ✓ | ✓ | ||||
| T2 | SAG | ✓ | ✓ | ✓ | ||
| AX | ✓ | ✓ | ✓ | |||
| TSE DARK FLUID | T1 | SAG | ✓ | ✓ | ||
| T2 | AX | ✓ | ||||
| TSE STIR | T2 | SAG | ✓ | ✓ | ✓ | |
| TSE DIXON | T2 | SAG | ✓ | |||
| TSE MSMA* | T2 | AX | ✓ | |||
| SSFP-3D | T2 | AX | ✓ | ✓ | ||
| DIFFUSION | – | AX | ✓ | |||
| TOF | – | AX | ✓ |
Gray boxes indicate that the sequence was not part of the vendor’s routine exam.
MSMA = multislice multiangle.
In Vitro Image Quality Assessment
To evaluate changes in image quality due to protocol parameter differences between the SARRT and SARLOW protocols, signal-to-noise ratio (SNR) maps and contrast-to-noise ratio (CNR) values were measured using 10 repeated image acquisitions and a T1-T2 phantom.17 To calculate SNR and CNR values, two regions of interest (ROIs) were placed in a single central slice in regions where the contrast approximates gray-matter/white-matter (T1:980/710 msec,T2:80/74) for the head protocols, and CSF/spinal cord (T1:4273/780 msec, T2:1577/101) for the C-spine, T-spine, and L-spine protocols.18,19
In Vivo Image Acquisition
Twenty healthy volunteers (n = 20) provided signed statements of informed consent and were enrolled under an Institutional Review Board (IRB)-approved protocol (five volunteers per exam region, 10/10 male/female, mean [standard deviation, SD] height and weight were 176.3 [9.5] cm and 76.3[21.8] kg, respectively). Low-SAR protocols used the baseline phantom protocol as a starting point. The subject-specific in vivo protocol adjustments were made following the workflow and recorded. The subject-specific scanner reported WB-SAR and LH-SAR for both protocols and were recorded for each volunteer.
In Vivo Image Quality Assessment
Image quality was evaluated based on clinical acceptability scores provided by two expert radiologists. To compare clinical acceptability, the acquired images were stripped of identifying information and presented in a randomized order to each radiologist, who independently evaluated image quality on a 5-point Likert scale. The scoring scale (Table 2) accounted for both image quality and clinical acceptability using an index: 1 (extremely poor), 2 (poor), 3 (fair), 4 (good), and 5 (excellent).
TABLE 2.
Five-Point Likert Scoring Scale for Scoring Image Quality and Overall Clinical Acceptability
| Acceptability | Quality index | ||
|---|---|---|---|
| Clinical unacceptable | 1 | Extremely poor | Extremely noisy/inadequate image contrast. Not clinically useful. |
| 2 | Poor | Substantial image noise/insufficient image contrast. Clinical use is not advised. | |
| Clinical acceptable | 3 | Fair | Noisy images/poor image contrast. Clinical use somewhat impacted. |
| 4 | Good | Minor image noise/sufficient contrast. Clinical interpretation not adversely effected. | |
| 5 | Excellent | Very little image noise. Expected image contrast. Clinically acceptable. |
Statistical Analysis
A repeated measures general linear model was used to evaluate differences in SNR and CNR for the SARRT and SARLOW protocols. In addition, the level of agreement between the two radiologists was analyzed using Cohen’s kappa statistical analysis (Null hypothesis: Scoring agreement between the two reviewers occurred by chance. Hence, a significant P [P < 0.05] implies that the scoring agreement was not just by chance). Moreover, a generalized estimating equation analysis (GEE) was performed to evaluate differences on image quality and clinical acceptability for SARRT and SARLOW.
Results
Protocol Modification
The workflow designed to modify routine MRI protocols to reach a specific SAR target is shown in Fig. 2. The list of sequences evaluated for each anatomical region is outlined in Table 1 and detailed parameters changes to achieve the SARLOW protocols are shown in Tables S2–S5 in the Supplemental Material. Using the T1-T2 phantom, the SARRT protocol for head, C-spine, T-spine, and L-spine were successfully modified to reach the desired SAR limits (WB-SAR ≤0.1 W/Kg and LH-SAR ≤0.3 W/Kg). Only the T1-weighted spin echo (SE) sagittal sequence for the head did not reach the SAR target. Therefore, it was replaced with a gradient echo (GRE) sequence. After modification, sequences in the SARLOW protocol increased ≤2x in duration and spatial resolution decreased ≥0.5x. For the T1 SE coronal sequence of the head protocol and all of the T-spine sequences, with the exception of the T2 TSE sagittal sequence, the number of slices were reduced to half to reach the SAR limits. The total scan times for the SARRT and SARLOW protocols in the phantom were [min: sec]: Head –19:33 vs. 22:35; C-Spine – 23:40 vs. 26:54; T-Spine –20:58 vs. 25:36; and L-Spine – 20:06 vs. 25:35.
FIGURE 2:
(a) Workflow to reduce SAR to a target SAR value. The workflow consists of two iterations. The first iteration modifies SAR-dependent parameters following a specific order (b). To mitigate the impact on image quality, a limit is defined for each parameter. Once the SAR limit is reached, and if the sequence time exceeds <2x, the second iteration modifying time-dependent parameters (c) until a given limit. Note: For T1-weighted SE sequences, the TR limit was up 720 msec, which allowed for additional subject-specific protocol modifications to meet the subject-specific scanner reported SAR target.
In Vitro Image Quality Assessment
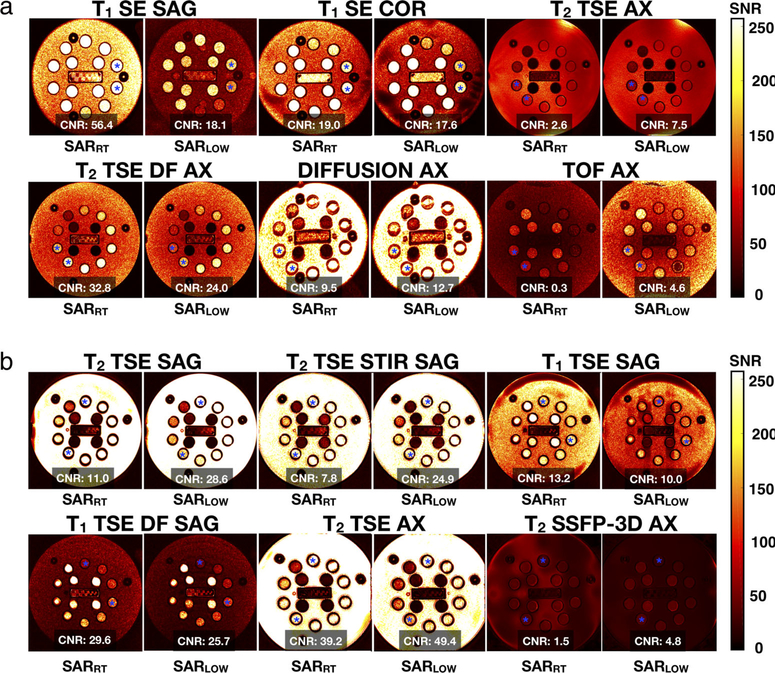
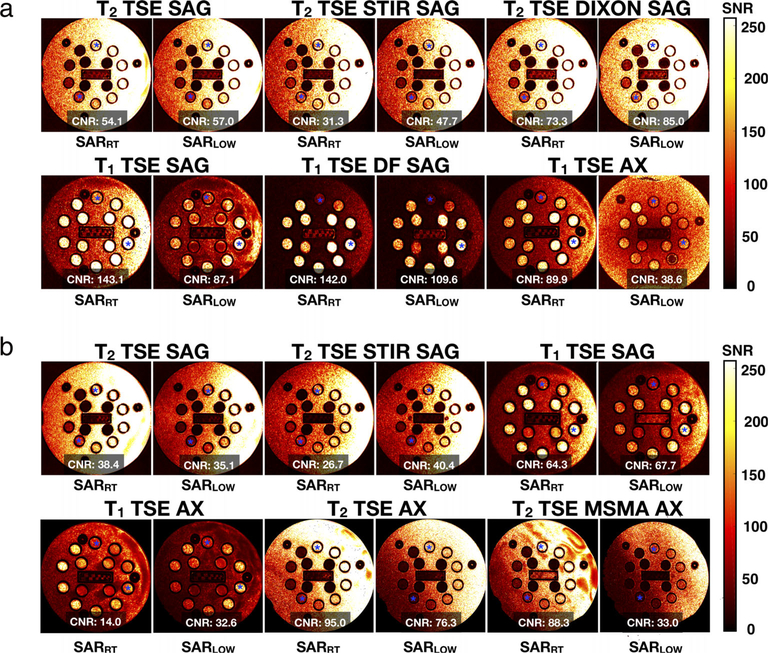
SNR maps and CNR values acquired with the T1-T2 phantom are shown in Figs. 3 and 4, and Table S6 in the Supplemental Material. In general, lower SNR was observed in SARLOW. Compared with SARRT, the SNR percentage of SARLOW (median [IQR]) decreased for head (−22.8 [9.3] %), C-spine (−28.4 [18.4] %), T-spine (−26.4 [14.4] %), and L-spine (−43.6 [45.6] %). For all regions, the SNR values within the SARRT ROIs were higher and significantly different from the SARLOW ROIs (P < 0.05).
FIGURE 3:
In vitro SNR maps and CNR values for standard (SARRT) and low-SAR (SARLOW) protocols for head (a) And C-spine (b) Anatomical regions. Note: Asterisk corresponds to the regions in which CNR calculations were performed.
FIGURE 4:
In vitro SNR maps and CNR values for standard (SARRT) and low-SAR (SARLOW) protocols for T-spine (a), and L-spine (b). Anatomical regions. Note: Asterisk corresponds to the regions in which CNR calculations were performed.
Protocol parameter modifications can increase or decrease CNR. As shown in Figs. 3 and 4, increasing TR increased CNR for the SARLOW T2-weighted sequences compared to SARRT; while (as expected) the opposite effect was observed on the T1-weigthed sequences. Compared to SARRT, the CNR percentage of SARLOW (median (IQR)) increased for the C-spine protocol (93.3 [207.8] %); whereas it decreased for the L-spine protocol (−1.74 [56.4] %), the head protocol (−7.4 [60.3] %) and the T-spine protocol (−8.7 [48.4] %). However, CNR values between all the sequences of both protocols were not significantly different (P = 0.21).
In Vivo Image Acquisition
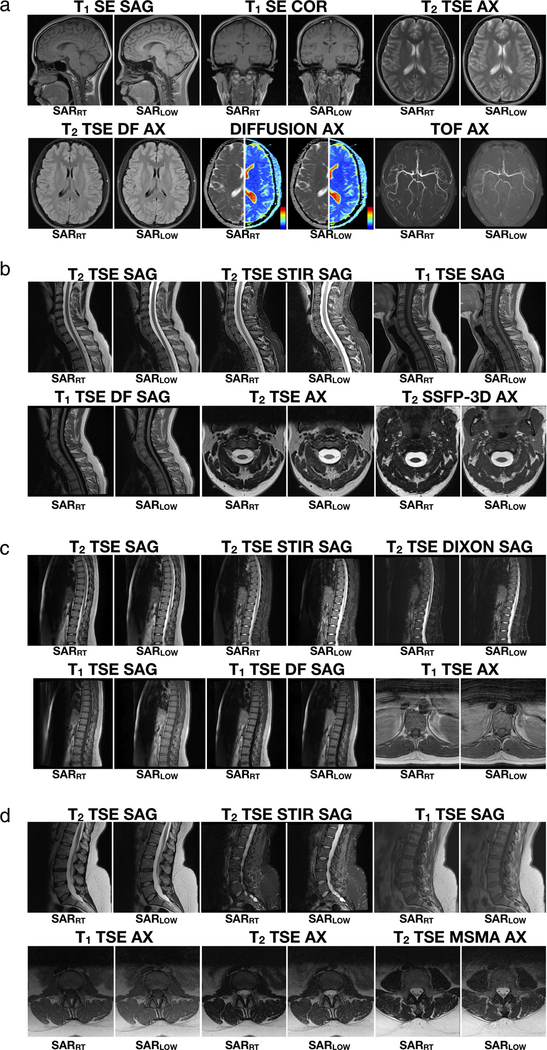
Protocol definitions started from the low SAR protocol refined in the phantom experiments, then patient-specific protocol parameter adjustments were performed using the defined workflow and recorded (Table S7 in the Supplemental Material). in vivo images were acquired with the SARRT and SARLOW protocols and are compared in Fig. 5. Parameters for the SARRT protocol were not modified for in vivo acquisition; hence, the scan time remained constant, whereas the parameters for SARLOW protocols were adjusted per volunteer. The recorded scan time for each protocol was [min: sec (SD)]: 24:09 (1:09) for head; 27:52 (0:42) for C-Spine; 29:16 (0:14) for T-Spine; and 27:48 (1:43) for L-Spine.
FIGURE 5:
Example images of one volunteer for a vendor-provided protocol and the low-SAR protocols defined using the framework for the head (a), C-spine (b), T-spine (c), and L-spine (d) anatomical regions. For the diffusion example of the head protocol, diffusion-weighted images (DWI) and apparent diffusion coefficient maps (ADC) are shown (color map range: blue = 0, red = 4 mm2/s).
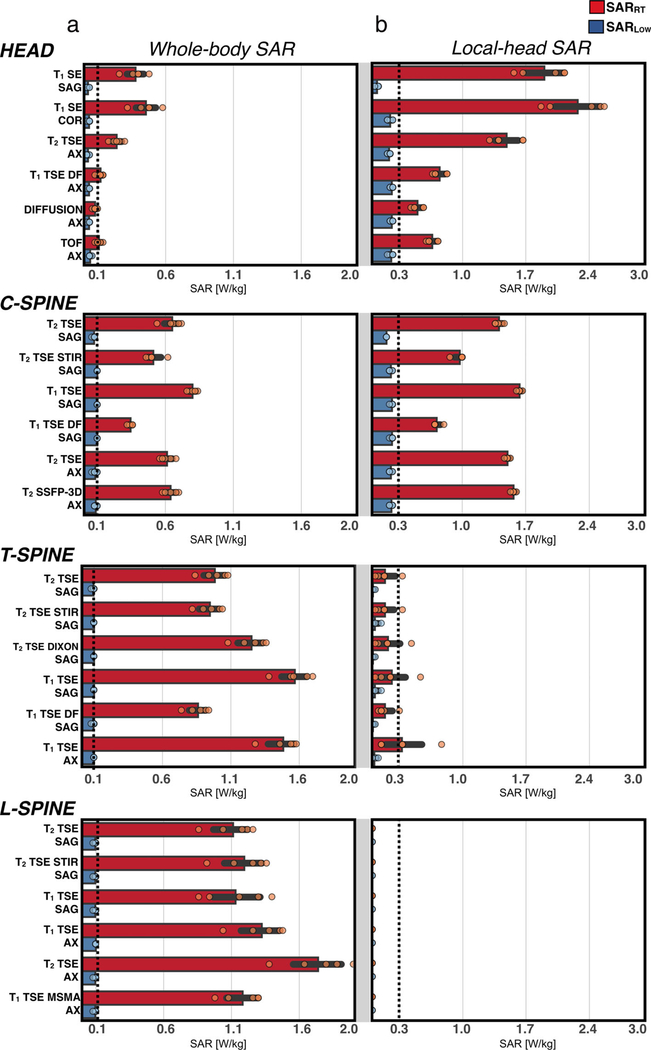
For the SARLOW protocol, only the T1-SE sagittal sequence for the head region was replaced by a GRE-based sequence. Nevertheless, the SAR limit was successfully reached for all volunteers for all sequences and all anatomical regions. As expected, the recorded SAR values were higher and significantly different for SARRT compared with SARLOW (P < 0.05). WB-SAR and LH-SAR values for the SARRT and SARLOW protocols are reported in Fig. 6. A general trend was observed for SARRT and SARLOW protocols: WB-SAR was less constraining for the head and C-spine protocol, whereas LH-SAR was less constraining for T-spine and L-spine protocols. Volunteer median [IQR] WB-SAR values were greater for SARRT vs. SARLOW protocols for head (0.21 [0.17] W/kg vs. 0.04 [0.02], P < 0.05), C-spine (0.45 [0.3] W/kg vs. 0.1 [0.01], P < 0.05), T-spine (1.12 [0.04] W/kg vs. 0.1[0.01] W/kg, P < 0.05), and L-spine 1.28 [0.05] W/kg vs. 0.1[0.01] W/kg, P < 0.05). Similarly, median [IQR] LH-SAR values were also greater for SARRT vs. SARLOW protocols for head (1.10 [0.78] W/kg vs. 0.24 [0.01] W/kg, P < 0.05), C-spine (0.98 [0.63] W/kg vs. 0.21 [0.03] W/kg, P < 0.05), T-spine (0.18 [0.2] vs. 0.02 [0.03] W/kg, P < 0.05), and L-spine (<0.001 W/kg vs. <0.001 W/kg, P < 0.05).
FIGURE 6:
(a) Scanner-reported whole-body SAR and (b) local head SAR. Values are shown for each volunteer for the vendor-provided protocol (red) and the defined low-SAR protocol (blue). Dashed lines indicate the low SAR target.
In Vivo Image Quality Assessment
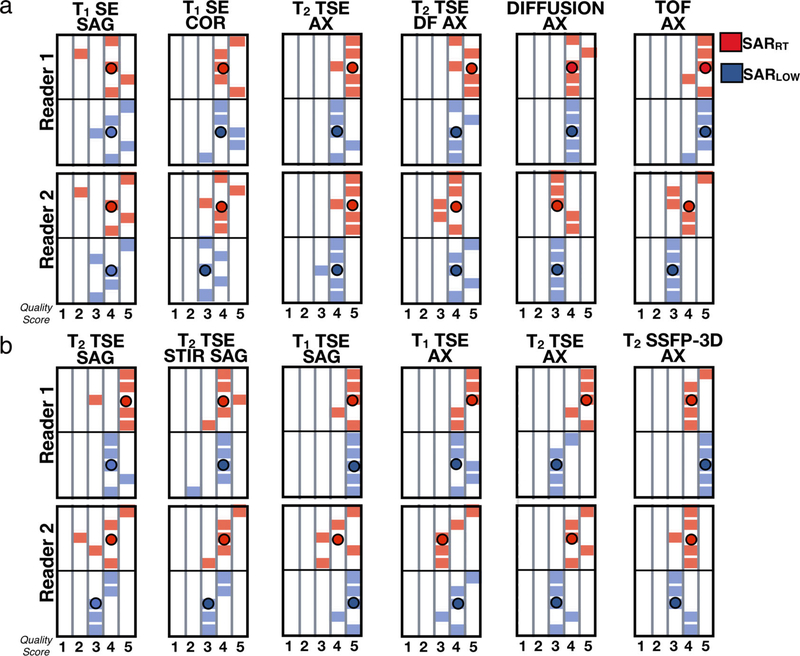
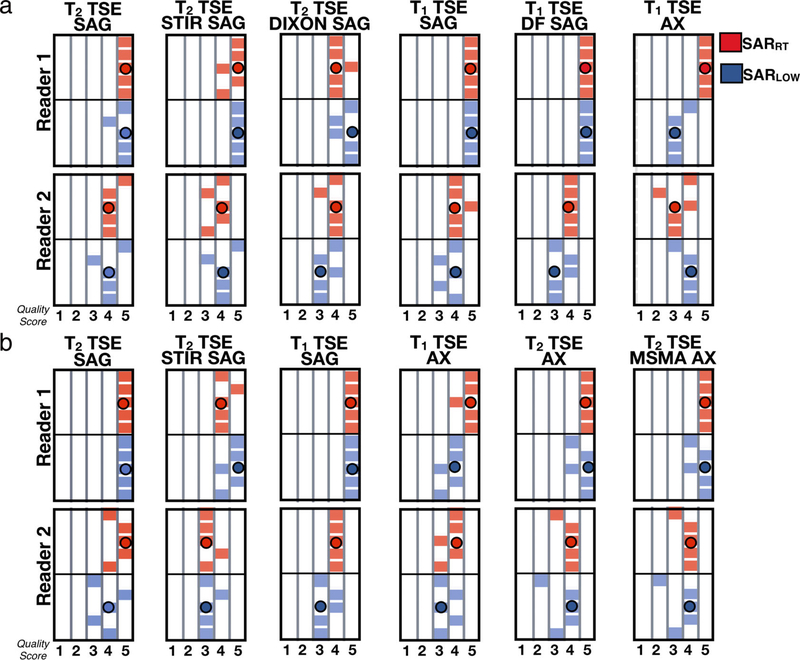
Image quality scores are shown in Figs. 7 and 8. The results show that both experts tended to score both SARRT and SARLOW images towards clinically acceptable scores (probability of acceptable scores: 95%) and a significant agreement regarding the quality of the images was found (level of agreement 69%, K = 0.11, P < 0.05). On average, SARRT images received higher scores than SARLOW images. Median [IQR] scoring values for SARRT vs. SARLOW were 4.0 [1.0] vs. 3.9 [0.5] for head; 4.5 [0.5] vs. 4.0 [0.5] for C-spine; 4.3 [0.5] vs. 4.0 [0.5] for T-spine, and 4.3 [0.5] vs. 4.0 [0.4] for L-spine. Image quality scores were not statistically significant between SARRT and SARLOW protocols (P > 0.05). The SARLOW protocols were scored as clinically acceptable when modifying MRI protocols with the proposed workflow to meet low SAR targets.
FIGURE 7:
Expert-reported image quality using a 5-point Likert scale for the vendor-provided (red) and low-SAR (blue) protocols for (a) head and (b) C-spine.
FIGURE 8:
Expert reported image quality using a 5-point Likert scale for the vendor-provided (red) and low-SAR (BLUE) protocols for (a) T-spine and (b) L-spine.
Discussion
A workflow to modify routine MRI protocols to meet SAR limits for patients with MR-conditional AIMDs was designed and evaluated. To reach a defined low SAR target, sequence parameters were iteratively and sequentially modified up to a specific parameter limit to avoid substantial changes in image quality and scan time increases of <2x. Images were acquired for 20 healthy volunteers at four different body regions (five volunteers per exam region) with routine (SARRT) and low SAR (SARLOW) protocols. SARRT and SARLOW protocols were also evaluated in a phantom experiment.
MRI exams for patients with AIMDs can be challenging. Unlike conventional examinations, interactions between the MRI scanner and AIMDs raise safety concerns.20 RF-induced heating of the device is a principal safety concern. Device heating leads to thermal energy deposition in the tissue surrounding the AIMD and can lead to tissue damage. To mitigate the amount of energy deposited, SAR is limited to a specific threshold for MR-conditional AIMDs.
In order to avoid compromising patient safety, MR-conditional AIMDs have manufacturer-specified conditions of use. Thus, when meeting the device’s specific conditions, no adverse effects for the patient are expected during an MRI exam. Since 2011,21,22 a rapidly growing number of MR-conditional AIMDs has been approved by the FDA. Therefore, it is increasingly important that MRI clinics have available MRI protocols that assure a risk-free examination.23–25 Within such protocols, the AIMD’s device characteristics are examined before and after an MRI exam, and SAR is controlled to within a target value throughout the MRI examination as indicated for each AIMD.
Currently, however, a wide range of SAR conditions exist and these conditions can have SAR limits as low as ≤0.1 W/kg. Routine examinations seldom reach such low SAR values by default. Hence, each protocol requires parameter modification until reaching the target SAR value. SAR depends on the patient’s body habitus, the anatomical region under examination, and the type of imaging sequence applied. Modification of the protocol while examining a patient is time-consuming and may contribute to a prolonged MRI exam with poorer clinical and patient acceptance. Consequently, when patients with MR-conditional AIMDs that have low SAR conditions are referred for an MRI scan, the examination may be deferred.
Low-SAR head examinations for patients with DBSs have been created in previous studies by modifying the RF pulse width10 or by reducing the flip angle and phase resolution13 without affecting image quality. However, they do not provide sufficient guidance for MRI clinics to refine their own low SAR MRI protocols for any anatomical region. The purpose of this work was to propose a general method to reduce SAR with a scan time duration that is routinely observed in the clinic. The workflow was evaluated on head and spine protocols because these regions correspond to among the most common clinical MRI exam referrals.14,22 In general, the low SAR modified protocols were systemically longer than the routine protocols, but fall within routine clinical MRI exams, often performed within 20–60 minutes.24 Each sequence duration within the protocol increased ≤2x relative to the initial sequence duration.
High-SAR protocols are typically observed, for example, for SE-based sequences with short TRs.15 In this work, only the T1-weighted SE sagittal sequence for the head protocol did not reach the low SAR target. Consequently, a GRE-based sequence was used as a surrogate. GRE sequences generally have lower SAR due to the lower intrinsic flip angle and therefore require less modification to reach a low SAR limit. Sequences common in cardiac examinations, like balanced steady-state free precession (bSSFP), with very short TR and high flip angle, however, would be hard to refine for low SAR due to their unique T1/T2 contrast and the lack of a suitable sequence surrogate. Hence, low SAR bSSFP protocols remain an open challenge despite some recent work in this area.26
In vivo images acquired for both protocols suggest that image quality is lower for the SARLOW protocol compared to the SARRT protocol, but clinical acceptability was not significantly compromised and was still considered acceptable. SNR and CNR values were not measured in vivo due to the difficulties of doing this well when using parallel imaging and to avoid subject-dependent differences for repeated scans. Routine clinical MRI exams are often performed within 20–60 minutes.24 The low SAR modified protocols are longer, but fall within this duration. Each sequence duration within the protocol increased <2x relative to the initial sequence duration.
LIMITATIONS.
The suggested workflow starts by modifying the RF-pulse type, but some MRI systems may not include low-SAR RF pulse types. Second, to reach the SAR limit, in some sequences the slice coverage was reduced. The corresponding sequence can be reacquired to cover the missing volume, but this extends scan time. Third, parameter modification is performed by modifying one parameter at a time until a given limit. The modification can be improved by computationally optimizing SAR-dependent sequence parameters to meet a specific SAR target. Implementation of this optimization, however, is beyond the scope of this work. Lastly, the study did not analyze the effect of AIMD-induced artifacts on image quality and the impact of the low SAR protocols on image artifacts. Further work is needed to evaluate AIMD-induced image artifacts. This work also examined an especially low SAR target. Hence, it can be expected that higher targets can be achieved with even less impact on image quality, but this was not investigated. Further work is also needed to provide guidance for other anatomical territories and to evaluate image quality in clinical patients.
Conclusion
A workflow to modify MRI protocols to reach a low SAR target for patients with AIMDs was defined and evaluated. The modified MRI protocols achieve WB-SAR ≤0.1 W/kg and LH-SAR ≤0.3 W/kg simultaneously. For the low-SAR modified protocols, image quality was considered clinically acceptable and the protocol duration increased less than 2x. The proposed workflow may benefit patients referred for an MRI exam that have AIMDs with low SAR conditional labeling.
Supplementary Material
Acknowledgments
Contract grant sponsor: This work was supported by Abbott Laboratories, NIH/NHLBI HL127433 and UC MEXUS-CONACYT Doctoral Fellowship. The content is solely the responsibility of the authors and does not necessarily represent the official views of the National Institutes of Health.
Footnotes
Additional supporting information may be found in the online version of this article
References
- 1.Woods TO. Standards for medical devices in MRI: Present and future. J Magn Reson Imaging 2007;26:1186–1189. [DOI] [PubMed] [Google Scholar]
- 2.IEC 60601–2-33:2010 | IEC Webstore. IEC 60601–2-33:2010+AMD1: 2013+AMD2:2015 CSV: Medical electrical equipment - particular requirements for the basic safety and essential performance of magnetic resonance equipment for medicaldiagnosis, Edition 3.2. Accessed December 15, 2019. Available from: https://webstore.iec.ch/publication/2647.
- 3.14:00–17:00 ISO/TS 10974:2018. In: ISO. Assessment of the safety of magnetic resonance imaging for patients with an active implantable medical device, Tech. Specif. ISOTS10974, vol. second edition, 2018. Accessed December 15, 2019. Available from: http://www.iso.org/cms/render/live/en/sites/isoorg/contents/data/standard/06/50/65055.html. [Google Scholar]
- 4.Food and Drug Administration (2014) Establishing Safety and Compatibility of Passive Implants in the Magnetic Resonance (MR) Environment. 10.
- 5.ASTM International (2013) ASTM F2503–13 Standard Practice for Marking Medical Devices and Other Items for Safety in the Magnetic Resonance Environment. Available from: 10.1520/F2503-13. [DOI] [PubMed]
- 6.Transparency Market Report (TMR). Active Implantable Medical Devices Market Size, Share & Trend | Industry Analysis Report, 2025. Accessed on July 25, 2019. Available from: https://www.transparencymarketresearch.com/active-implantable-medical-devices-market.html.
- 7.Krames E, Peckham PH, Rezai AR. Neuromodulation: Comprehensive textbook of principles, technologies, and therapies. New York: Academic Press; 2018. [Google Scholar]
- 8.Allison J, Yanasak N. What MRI sequences produce the highest specific absorption rate (SAR), and is there something we should be doing to reduce the SAR during standard examinations? Am J Roentgenol 2015; 205:W140–W140. [DOI] [PubMed] [Google Scholar]
- 9.Homann H, Börnert P, Eggers H, Nehrke K, Dössel O, Graesslin I. Toward individualized SAR models and in vivo validation. Magn Reson Med 2011;66:1767–1776. [DOI] [PubMed] [Google Scholar]
- 10.Sarkar SN, Alsop DC, Madhuranthakam AJ, et al. Brain MR imaging at ultra-low radiofrequency power. Radiology 2011;259:550–557. [DOI] [PubMed] [Google Scholar]
- 11.Kahan J, Papadaki A, White M, et al. The safety of using body-transmit MRI in patients with implanted deep brain stimulation devices. PLoS One 2015;10:e0129077. 10.1371/journal.pone.0129077. [DOI] [PMC free article] [PubMed] [Google Scholar]
- 12.Sarkar SN, Papavassiliou E, Hackney DB, et al. Three-dimensional brain MRI for DBS patients within ultra-low radiofrequency power limits. Mov Disord 2014;29:546–549. [DOI] [PubMed] [Google Scholar]
- 13.Franceschi AM, Wiggins GC, Mogilner AY, Shepherd T, Chung S, Lui YW. Optimized, minimal specific absorption rate MRI for high-resolution imaging in patients with implanted deep brain stimulation electrodes. AJNR Am J Neuroradiol 2016;37:1996–2000. [DOI] [PMC free article] [PubMed] [Google Scholar]
- 14.Hegenscheid K, Seipel R, Schmidt CO, et al. Potentially relevant incidental findings on research whole-body MRI in the general adult population: Frequencies and management. Eur Radiol 2013;23:816–826. [DOI] [PubMed] [Google Scholar]
- 15.Hecker Prost JE, Wehrli FW, et al. SAR reduced pulse sequences. Magn Reson Imaging 1988;6:125–130. [DOI] [PubMed] [Google Scholar]
- 16.Master AM, Lasser RP, Beckman G. Tables of average weight and height of Americans aged 65 to 94 years: Relationship of weight and height to survival. J Am Med Assoc 1960;172:658–662. [DOI] [PubMed] [Google Scholar]
- 17.Reeder SB, Wintersperger BJ, Dietrich O, et al. Practical approaches to the evaluation of signal-to-noise ratio performance with parallel imaging: Application with cardiac imaging and a 32-channel cardiac coil. Magn Reson Med 2005;54:748–754. [DOI] [PubMed] [Google Scholar]
- 18.Breger RK, Rimm AA, Fischer ME, Papke RA, Haughton VM. T1 and T2 measurements on a 1.5-T commercial MR imager. Radiology 1989;171: 273–276. 10.1148/radiology.171.1.2928538. [DOI] [PubMed] [Google Scholar]
- 19.Kim G, Khalid F, Oommen VV, et al. T1- vs. T2-based MRI measures of spinal cord volume in healthy subjects and patients with multiple sclerosis. BMC Neurol 2015;15(1):124. 10.1186/s12883-015-0387-0. [DOI] [PMC free article] [PubMed] [Google Scholar]
- 20.Panych LP, Madore B. The physics of MRI safety. J Magn Reson Imaging 2018;47:28–43. [DOI] [PubMed] [Google Scholar]
- 21.Ferreira AM, Costa F, Tralhão A, Marques H, Cardim N, Adragão P. MRI-conditional pacemakers: Current perspectives. Med Devices Auckl NZ 2014;7:115–124. [DOI] [PMC free article] [PubMed] [Google Scholar]
- 22.Sethi. Magnetic resonance imaging-conditional devices: Where have we reached today? Accessed on July 25, 2019. Available from: http://www.ijhronline.org/article.asp?issn=2352-4197;year=2018;volume=3;issue=1;spage=16;epage=24;aulast=Sethi.
- 23.Shinbane JS, Colletti PM, Shellock FG. MR imaging in patients with pacemakers and other devices. JACC Cardiovasc Imaging 2012;5: 332–333. [DOI] [PubMed] [Google Scholar]
- 24.Mulpuru SK, Madhavan M, McLeod CJ, Cha Y-M, Friedman PA. Cardiac pacemakers: Function, troubleshooting, and management: Part 1 of a 2-part series. J Am Coll Cardiol 2017;69:189–210. [DOI] [PubMed] [Google Scholar]
- 25.Zrinzo L, Yoshida F, Hariz MI, et al. Clinical safety of brain magnetic resonance imaging with implanted deep brain stimulation hardware: Large case series and review of the literature. World Neurosurg 2011; 76:164–172. [DOI] [PubMed] [Google Scholar]
- 26.Srinivasan S, Ennis DB. Variable flip angle balanced steady-state free precession for lower SAR or higher contrast cardiac cine imaging. Magn Reson Med 2014;71:1035–1043. [DOI] [PubMed] [Google Scholar]
Associated Data
This section collects any data citations, data availability statements, or supplementary materials included in this article.


