

Abstract
Background & Aims:
Studies are needed to determine the mechanisms of mucosal dysregulation in patients with inflammatory bowel diseases (IBD) and differences in inflammatory responses of patients with ulcerative colitis (UC) vs Crohn’s disease (CD). We used mass cytometry (CyTOF) to characterize and compare immune cell populations in the mucosa and blood from patients with IBD and without IBD (controls) at single-cell resolution.
Methods:
We performed CyTOF analysis of colonic mucosa samples (n=87) and peripheral blood mononuclear cells (PBMCs, n=85) from patients with active or inactive UC or CD and controls. We also performed single-cell RNA-sequencing, flow cytometry, and RNA in situ hybridization analyses to validate key findings. We used random forest modeling to identify differences in signatures across subject groups.
Results:
Compared with controls, colonic mucosa samples from patients with IBD had increased abundances of HLA-DR+CD38+ T cells, including T-regulatory cells that produce inflammatory cytokines; CXCR3+ plasmablasts; and IL1B+ macrophages and monocytes. Colonic mucosa samples from patients with UC were characterized by expansion of IL17A+ CD161+ effector memory T cells and IL17A+ T-regulatory cells; expansion of HLA-DR+CD56+ granulocytes; and reductions in type 3 innate lymphoid cells. Mucosal samples from patients with active CD were characterized by IL1B+HLA-DR+CD38+ T cells, IL1B+TNF+IFNG+ naïve B cells, IL1B+ dendritic cells (DCs), and IL1B+ plasmacytoid DCs. PBMCs from patients with active CD differed from those of active UC in that the PBMCs from patients with CD had increased IL1B+ T-regulatory cells, IL1B+ DCs and IL1B+ plasmacytoid DCs, IL1B+ monocytes, and fewer group 1 innate lymphoid cells. Random forest modeling differentiated active UC from active CD in colonic mucosa and blood samples; top discriminating features included many of the cellular populations identified above.
Conclusions:
We used single-cell technologies to identify immune cell populations specific to mucosa and blood samples from patients with active or inactive CD and UC and controls. This information might be used to develop therapies that target specific cell populations in patients with different types of IBD.
Keywords: Treg, MAIT cells, ILC3, scRNA-seq
Lay Summary:
The authors analyzed immune cells in colon tissues and blood samples from patients with IBD and found that samples from patients with CD vs UC contain different types of immune cells.
Graphical Abstract

Introduction
Inflammatory bowel disease (IBD) leads to chronic intestinal inflammation associated with significant morbidity. In the US alone, over 3 million people have been diagnosed with IBD1. IBD pathogenesis is multifactorial including contributions from genetic predisposition, breakdown of mucosal immune homeostasis, microbial dysbiosis and environmental factors2. Subtypes of IBD include ulcerative colitis (UC), which contiguously affects the colon, and Crohn’s disease (CD), which can present anywhere in the GI tract. Macroscopic patterns of inflammation can often differentiate UC from CD although the diagnosis can remain unclear. This becomes salient during critical management decisions, such as colectomy, which can be curative for patients with UC but not CD.
Although a number of therapies are successful in inducing and maintaining remission, including biologic agents targeting cytokine pathways and leukocyte trafficking3, many patients are refractory to or lose response to available treatments. Up to one-third of patients will have disease refractory to anti-TNFα antibodies, and a significant proportion will ultimately require intestinal resections or colectomy4,5. There is therefore an urgent need to expand the arsenal of therapies for IBD. Improved understanding of inflammatory landscapes in circulation and tissue may shed light on new therapeutic targets that can be tailored to disease type (e.g. CD vs. UC), subtype (e.g. fistulizing vs. stenotic disease) and even individual patients.
A number of studies have investigated IBD-associated patterns of inflammation in human tissue and in vitro. Prior to the development of multi-dimensional single-cell analytics using mass cytometry (CyTOF) or single-cell RNAseq (scRNA-seq), most analyses had been limited to the study of discrete cellular populations and signaling pathways. IBD tissue hallmarks, such as pro-inflammatory cytokine generation in vitro6, have been harnessed in the development of cytokine-specific biologic therapies (e.g. anti-TNFα) but deeper understanding of cellular specificity in human tissue is lacking. Application of single-cell analytics to IBD is broadening these avenues of investigation, enabling the capture of a much more comprehensive cellular landscape.
To this end, we have applied CyTOF for multidimensional immunophenotyping of colonic mucosa (n=87) and peripheral blood (PB, n=85) of UC, CD, and non-IBD subjects at single-cell resolution. We supplement our findings with scRNA-seq analysis of a subset of the same patients and validation cohorts using flow cytometry and RNA in-situ hybridization (ISH). Further, we utilize unbiased clustering to identify cellular populations as well as predictive modeling to accurately differentiate UC and CD in the mucosa and periphery.
Results
CyTOF was performed on colonic mucosa from 18 non-IBD, 32 UC (14 inactive, i, and 18 active, a) and 37 CD (i=25, a=12) subjects and peripheral blood from 24 non-IBD, 27 UC (i=5, a=22) and 34 CD (i=12, a=22) subjects (Table S1). Of these, 24 subjects had matched blood and biopsy samples. CyTOF markers included surface antigens and cytokines (Fig S1A, Table S2), with the intent to broadly immunophenotype innate and adaptive immune cells. Mucosal analyses were performed on cryopreserved samples with robust viability as we have described7 (Fig 1A, Table S3).
Figure 1. T Cell Analysis Demonstrates UC- and CD-Specific Cytokine Signatures.
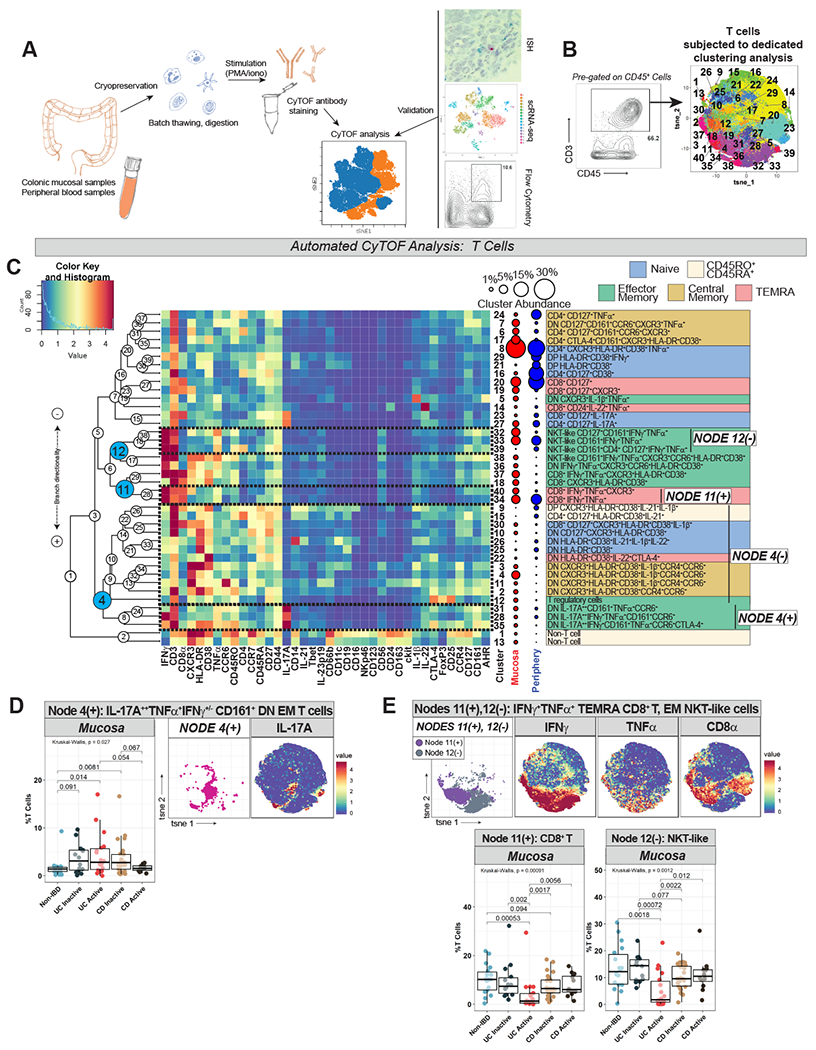
A. Schematic of sample analysis methodology. B. Gating strategy to define T cells (CD3+CD45+) which were exported and subjected to dimensionality reduction (t-SNE) and clustering (FlowSOM) as depicted in labeled t-SNE cluster plot (right). C. CyTOF marker heatmap (rows are clusters, columns are markers, tile colors represent mean metal intensity per Color Key and Histogram legend scaled across all tiles). On the right are manually-labeled cluster identities and a schematic of cluster abundance in mucosa vs. periphery. Hierarchical clustering dendrogram on left of heatmap, with nodes numbered and selected nodes highlighted. Selected node branches outlined on heatmap and labeled on right. T cell memory subsets were assigned and color-coded (naïve: CD45RA+CD45RO−CCR7+CD27+; central memory [CM]: CD45RA−CD45RO+CCR7+CD27+; effector memory [EM]: CD45RA−CD45RO+CCR7−CD27+/−; terminally differentiated effector memory cells re-expressing CD45RA [TEMRA]: CD45RA+CD45RO+/−CCR7−CD27+/−; and a subtype external to these established categories, CD45RO+CD45RA+). D. Node 4(+) labeled on t-SNE plot, with IL-17A heatmap for reference. Box-and-whisker plot of Node 4(+) abundance across subject groups on the left. E. Nodes 11(+), 12(−) t-SNE plot, abundance plots, and IFNγ/TNFα/CD8α heatmaps.
Immune cell subsets of interest were exported for dedicated automated analyses with unbiased clustering. Phenotypically similar clusters were organized into branches of hierarchical clustering dendrograms. On relevant figures, dendrogram nodes were labeled in circles while node branches are labeled as Node X(−) or Node X(+) depending on the direction of branch splitting. The abundances of cellular populations (individual clusters and/or node branches) were compared across subject groups. Finally, predictive modeling using random forest (RF) was applied to identify features that distinguish subject groups in the mucosa and periphery.
UCa mucosa is characterized by an increased B:T cell ratio
Prior to automated analyses, we assessed the relative proportions of manually-gated T cells (CD3+CD45+), B cells (CD19+CD45+) and innate immune cells (CD3−CD19−CD45+) across all subject groups (Fig S1D). UCa mucosa had proportionally fewer T cells and increased B cells compared to all other IBD groups with an enhanced B:T cell ratio (Fig S1D). The T and B cell findings in UC compared to non-IBD mucosa were validated by flow analysis of an independent cohort (n=10 non-IBD, 9 UCa, 10 CDa) (Table S5, Fig S1E). No overall differences in the proportion of innate cells were observed (Fig S1D).
T cells were clustered in a dedicated automated analysis (Fig 1B–C). T cell memory status (naïve, effector memory [EM], central memory [CM], terminally differentiated EM cells re-expressing CD45RA [TEMRA], and a subtype that did not clearly fall into these categories, labeled CD45RO+CD45RA+) was assigned based on differential expression of CD45RA, CD45RO, CCR7 and CD27 (Fig 1C). A range of CD4+, CD8+, CD4+CD8+ (DP) and CD4−CD8− (DN) T cell subtypes were identified.
IL-17A++ CD161+ EM T cells are enriched while IFNγ+TNFα+ EM T cell subsets are diminished in UCa mucosa
We identified disease-specific compositional differences in T cells pertaining to cytokine-producing EM subsets. Specifically, DN IL-17A++ CD161+ EM T cell clusters (belonging to Node 4(+)) were expanded in UCa mucosa (Fig 1D). Given cytokine co-expression (not only IL-17A++ but also TNFα+ and IFNγ+) as well as CD161 and CCR6 co-expression, these DN EM T cells may represent mucosal-associated invariant T cells (MAIT) (or related lymphocytes with innate characteristics)8, although our CyTOF panel was not equipped to capture MAIT-specific semi-invariant T cell receptors for more definitive classification. While these clusters were expanded, IFNγ+TNFα+ EM T cell subsets were decreased compared to all other subject groups in UCa mucosa, including Node 11(+) (cytotoxic CD8+ TEMRA cells) and Node 12(−), which were CD161+CD56+ EM T cells that could represent natural killer T (NKT)-like cells (Fig 1E).
A decrease in overall IFNγ+ T cells in UCa compared to both non-IBD and CDa mucosa was confirmed with flow cytometry, as was an increased ratio of IL-17A+:IFNγ+ T cells in UCa mucosa compared to non-IBD (Fig S2A).
To gain greater molecular insights into these cell subsets, we performed scRNA-seq on matched cryopreserved mucosal samples from 5 UCa subjects in our CyTOF cohort. We recovered all expected epithelial, stromal, and immune cell subsets9, and focused further analyses on the T cell clusters (Fig 2A). T cells were identified, subsetted and reclustered independently (Fig 2A; Supplemental Methods). We identified a T cell cluster co-expressing IL17A, IFNG, CD8A (but not CD8B)10, and KLRB1 (CD161), potentially representing IL-17A+ CD161+ cells of similar phenotype to those expanded in UCa mucosa (Node 4(+)) identified with CyTOF (Fig 2A–B). As our sequencing data did not capture enrichment of specific TCR transcripts, such as TRAV1-2 or the specific TRAJ transcripts that make up the semi-invariant MAIT T cell receptor, these cells may represent MAIT cells or polyclonal CD8αα IELs. Specific sequencing of the TCR region (https://www.nature.com/articles/s41590-019-0544-5) will be necessary to identify if this subset is composed of public or private TCRs. Nevertheless, our scRNA-seq analysis did highlight several MAIT-related markers11,12 in this cluster which were not included in our CyTOF panels, including ITGAE (CD103), CXCR6, LAG3, GNLY, CCR5, and RORA, a transcription factor belonging to the same family as RORGT, associated with Th17 responses (Table S7).
Figure 2. Mucosal scRNA-seq identifies IL17A+ T cells in UC and CyTOF Analysis Demonstrates Expansion of HLA-DR+CD38+ T Cell Subsets in IBD.
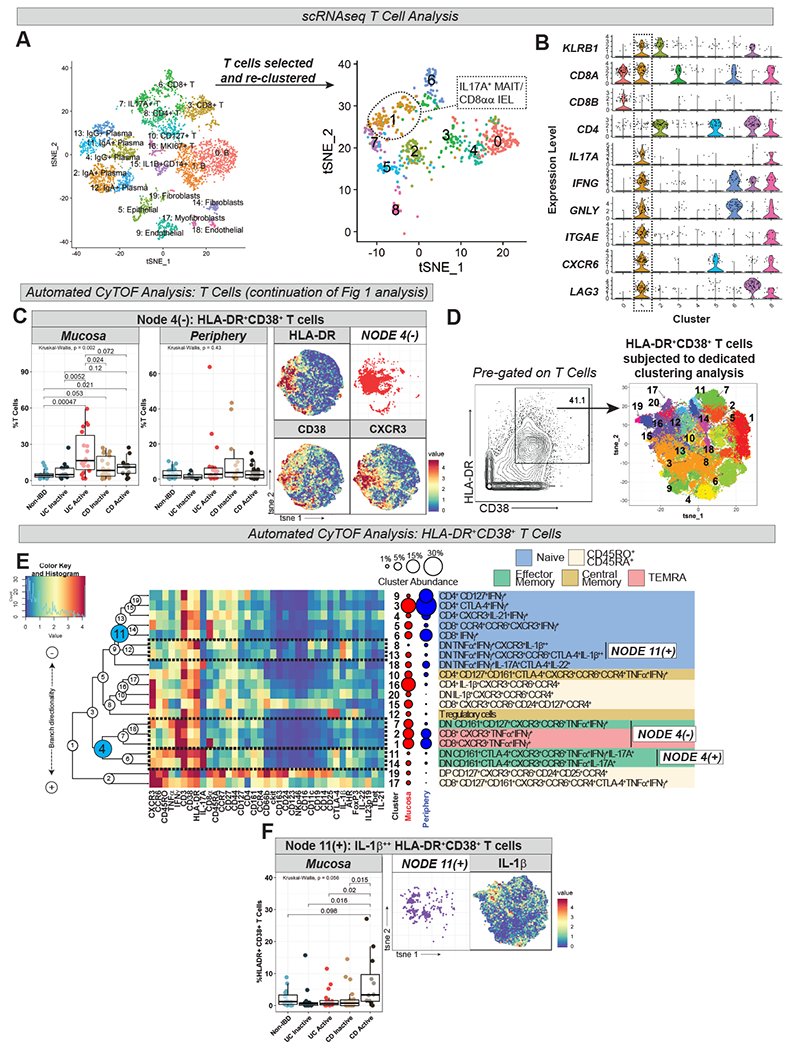
A. scRNA-seq of UCa subjects from CyTOF cohort (n=5 samples) represented by t-SNE plot colored by cluster (left; total cells analyzed = 3,979) with cluster identity labeled according to differential gene expression (see Table S6). Data was subsetted on T cells, which were then re-clustered (right; total cells analyzed = 718) with generation of 9 clusters labeled “0” through “8” (see Table S7, Supplemental Methods); cluster 1, corresponding to IL17A+ MAIT cells or IL17A+ CD8αα intraepithelial lymphocytes (IEL), is circled. B. Violin plots of selected transcripts, with expression profile of cluster 1 outlined. KLRB1 = CD161; ITGAE = CD103; GNLY = granulysin. All violin plots generated using standard Seurat v3.1 implementation; y-axis represents normalized and log-transformed expression data (log(scaled transcript counts +1)) C. Node 4(−) (from Fig 1C) abundance plot, t-SNE, and HLA-DR/CD38/CXCR3 heatmaps. D. Gating strategy defining HLA-DR+CD38+ T cells (left) with labeled t-SNE cluster plot (right) from dedicated clustering analysis. E. CyTOF marker heatmap, cluster dendrogram, cluster abundance and identity for HLA-DR+CD38+ T cell analysis with labeling strategy as per Fig 1C. F. Node 11(+) (from Fig 2E) abundance plot, t-SNE, and IL-1β heatmap.
IBD mucosa is characterized by an abundance of HLA-DR+CD38+ T cell populations
In our CyTOF analysis, T cell clusters co-expressing HLA-DR and CD38 (Node 4(−)) were expanded in IBD mucosa (Fig 2C) and this finding was validated by flow cytometry (Fig S2B). HLA-DR+CD38+ T cells were characterized by expression of chemokine receptors such as CXCR3, CCR6 and CCR7 as well as co-expression of the CD45R isoforms CD45RA and CD45RO (e.g. clusters 9 and 15) (Fig 1C). In contrast to some prior reports13,14, HLA-DR+CD38+ T cells were not found to be expanded in peripheral IBD (Fig 2C).
To better phenotype HLA-DR+CD38+ T cells, we manually gated this population and performed a dedicated clustering analysis (Fig 2D–E). HLA-DR+CD38+ T cells were found to represent a mix of T cell subtypes (CD4, CD8 and DN T cells, T regulatory cells [Tregs]) and memory states (Fig 2E). Similar to our findings in T cells at large, HLA-DR+CD38+ T cells co-expressing IFNγ+TNFα+ (Node 4(−) in Fig 2E) were diminished in UCa mucosa whereas IL-17A+HLA-DR+CD38+ CD161+ DN EM T cells (Node 4(+) in Fig 2E) were enhanced (Fig S3A). IL-1β+HLA-DR+CD38+ T cells (Node 11(+) in Fig 2E) demonstrated a strong trend towards expansion in CDa mucosa (Fig 2F).
Memory Tregs are increased in abundance in active IBD mucosa and express pro-inflammatory cytokines
Tregs were manually gated (as CD4+CD25+CD127− T cells) and subjected to dedicated automated analysis (Fig 3A–B). Memory Treg subsets were assigned according to the same algorithm detailed for other T cells. We identified disease-specific signatures in Tregs that mirrored findings in our preceding T cell analyses, including HLA-DR and CD38 co-expression in IBD mucosa and IL-17A expression in UCa mucosa:
Figure 3. T Regulatory Cell (Treg) Analysis Demonstrates Expansion of Pro-Inflammatory Memory Treg Subsets in IBD.
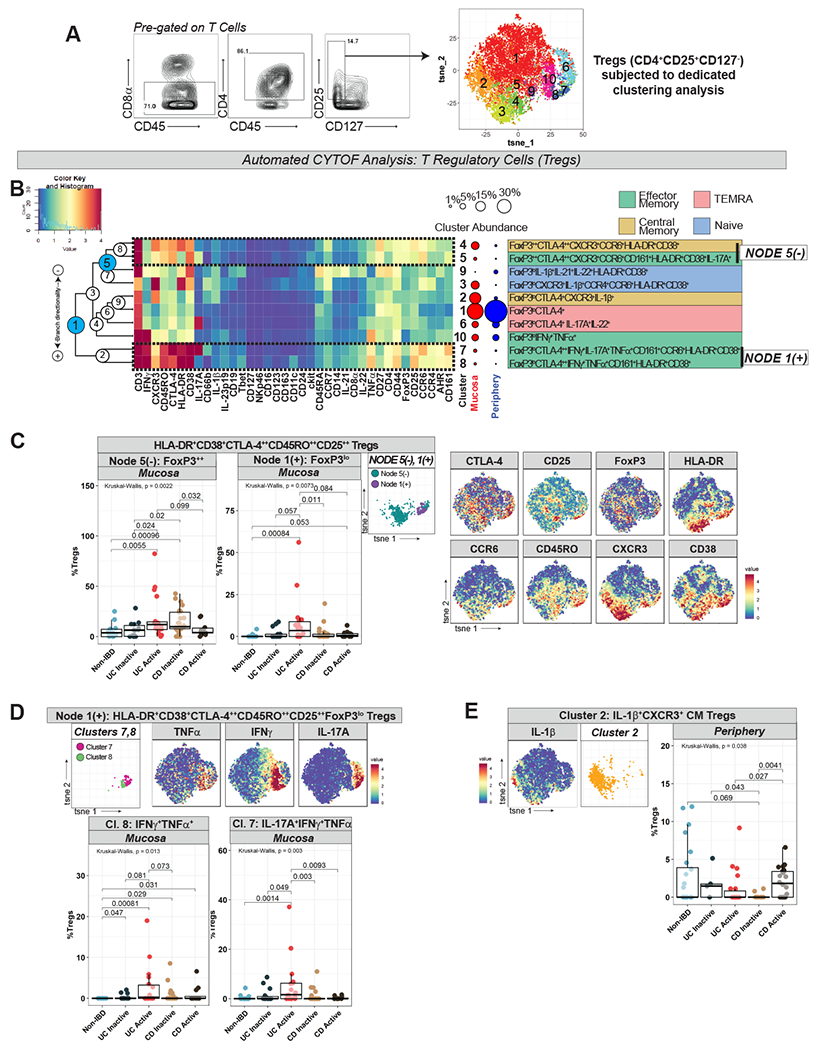
A. Gating strategy defining Tregs cells (left) with labeled t-SNE cluster plot (right) from dedicated clustering analysis. B. CyTOF marker heatmap, cluster dendrogram, cluster abundance and identity for Treg analysis with labeling strategy as per Fig 1C. C. Node 5(−) and Node 1(+) (from Fig 3B) abundance plots, t-SNE, and selected Treg marker heatmaps for reference. D. Clusters 7 and 8 (from Node 1(+) in Fig 3B) abundance plots, t-SNE, and TNFα/IFNγ/IL-17A marker heatmaps. E. Cluster 2 (from Fig 3B) abundance plot, t-SNE, and IL-1β marker heatmaps.
Treg populations enhanced in IBD mucosa were HLA-DR+CD38+, especially in UCa (Node 5(−), Node 1(+) in Fig 3B–C), similar to our findings in preceding T cell analyses. HLA-DR+CD38+ IBD-associated Tregs co-expressed various chemokine receptors including CCR6 and CXCR3 and were uniformly CD25++CTLA-4++CD45RO++, suggesting an activated memory phenotype (Fig 3B–C). Some branches were characterized by FoxP3++ expression, perhaps signifying high suppressive capacity (Node 5(−)). Others, e.g., Clusters 7 and 8 (Node 1(+)), were FoxP3lo and expressed pro-inflammatory cytokines (IFNγ+TNFα+IL-17A+/−), possibly indicating non-suppressive or even non-Treg properties15,16 (Fig 3B–C).
Cluster 8, which co-expressed IFNγ and TNFα, was increased in both UCa and CDa, whereas Cluster 7, which co-expressed IFNγ, TNFα, and IL-17A, was specifically increased in UCa mucosa (Fig 3D). Only one Treg cluster differed in peripheral disease: Cluster 2, IL-1β+CXCR3+ CM Tregs, enhanced in CDa compared to UCa and CDi (Fig 3E). Given the novelty of identifying IL-1β expression in Tregs, we confirmed this finding using flow cytometry (Fig S4A). Our data supports the possibility that Tregs in active IBD tissue may be altered, possibly with pathogenic potential, as has been described in IBD17 and other inflammatory disorders18,19.
Finally, as has been previously reported20,21, manual gating of two independent cohorts with CyTOF or flow cytometry revealed increased Tregs in IBD compared to non-IBD mucosa (Fig S1D, Fig S4B). In contrast to some prior reports20, no difference was observed in peripheral abundance of Tregs in IBD (Fig S1D).
IL-1β+IFNγ+TNFα+ naive B cells are enriched in CDa mucosa
As noted, manual gating of CyTOF data demonstrated enrichment of B cells in UCa mucosa (Fig S1D). To investigate differences within B cell populations across subject groups, CD19+ B cells were clustered in a dedicated analysis (Fig 4A–B). Multiple B cell subtypes including CD27− naïve, CD27+ memory, CD27−CD24+CD38+ transitional, and CD27+CD24−CD38++ plasmablasts were identified (Fig 4B).
Figure 4. B Cell Analysis Highlights Unique Naïve B Cell and Plasmablast Populations in IBD.
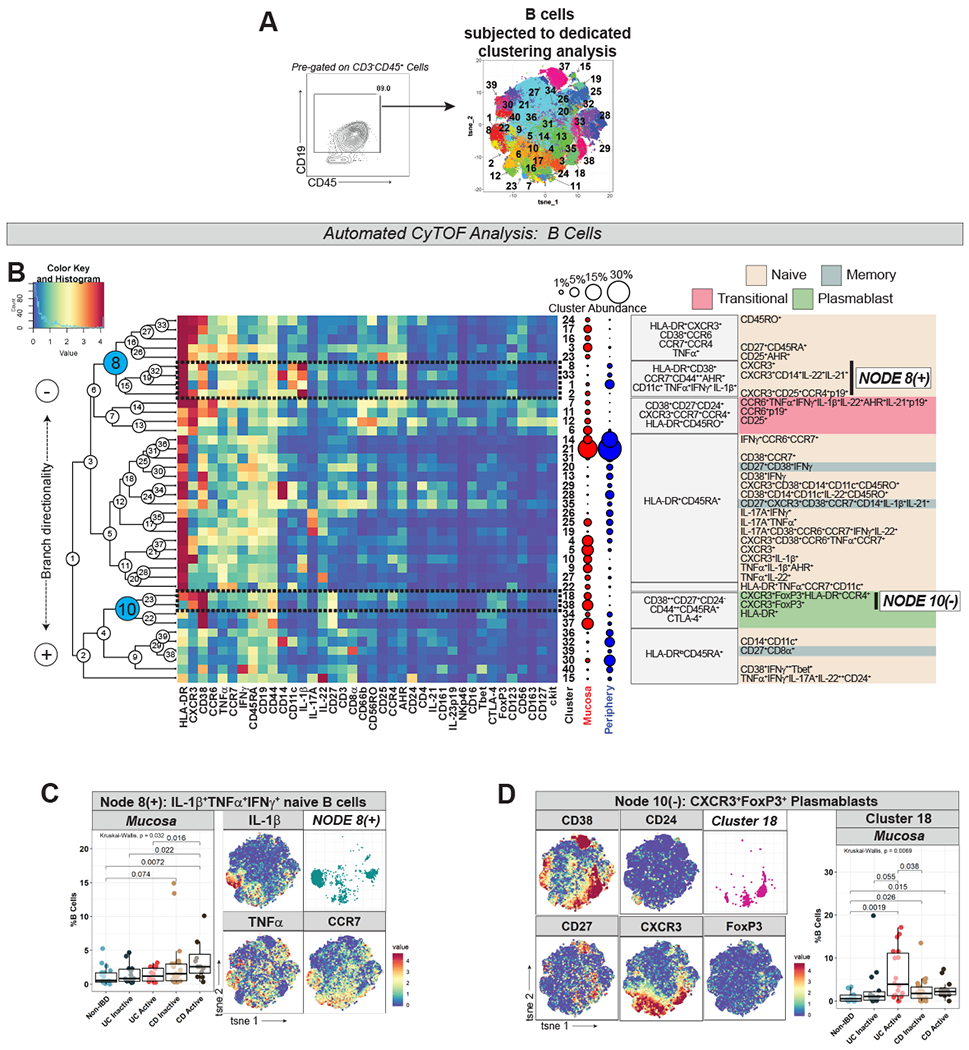
A. Gating strategy defining B cells (left) with labeled t-SNE cluster plot (right) from dedicated clustering analysis. B. CyTOF marker heatmap, cluster dendrogram, cluster abundance and identity (color-coded by subset) organized as per Fig 1C. C. Node 8(+) (from Fig 4B) abundance plots, t-SNE, and IL-1β/TNFα/CCR7 marker heatmaps. D. Cluster 18 (from Node 10(−) in Fig 4B) abundance plots, t-SNE, and selected marker heatmaps.
IL-1β+IFNγ+TNFα+ naïve B cell clusters (Node 8(+) in Fig 4B) were increased in CDa mucosa (Fig 4C). These clusters were CD44++ (marker of activated B cells), CCR7+, AHR+, HLA-DR+, CD38+ and CD11c+, a marker expressed in B cells capable of antigen presentation associated with autoimmunity22 (Fig 4B–C). Cluster 33 within this node branch was found to express CD14, which could reflect a non-B cell macrophage/monocyte population or CD14-expressing B cells which have been previously reported23.
CXCR3+ plasmablasts are increased in IBD mucosa
A population of CXCR3+ plasmablasts (Cluster 18 in Fig 4B) was found to be expanded in active IBD mucosa, especially in UCa (Fig 4D). CXCR3+ plasmablast clusters (Node 10(−) in Fig 4B) expressed FoxP3, which was further investigated through manual gating of CyTOF data (Fig S5A), also supporting a FoxP3 signal in mucosal plasmablasts. Although FoxP3 expression in non-T cell lineages has been controversial24, our findings may suggest a regulatory function for mucosal plasmablasts as has been suggested by others25.
UCa mucosa is enriched with unconventional granulocytes and CDa mucosa with IL-1β+ dendritic cells
CD3−CD19−CD45+ cells (innate immune cells) were clustered in a dedicated analysis (Fig 5A–B). Multiple subsets of innate immune cells were identified, including granulocytes (CD66b+), macrophages/monocytes (Mφ/mono; CD11c+CD14+), dendritic cells (DCs; HLA-DR+CD11c+CD14−), plasmacytoid DCs (pDCs; CD123+HLA-DR+CD11c+CD14−), and innate lymphoid cells (ILCs) groups 1 (CD56+Tbet+CD161+IFNγ+TNFα+), 2 (CD161+CD127+CD25++ckit+/−) and 3 (CD161+CD127+CCR6++ckit+) (Fig 5B).
Figure 5. Innate Immune Cell Analysis Reveals Granulocyte and Dendritic Cell Differences in UC and CD.
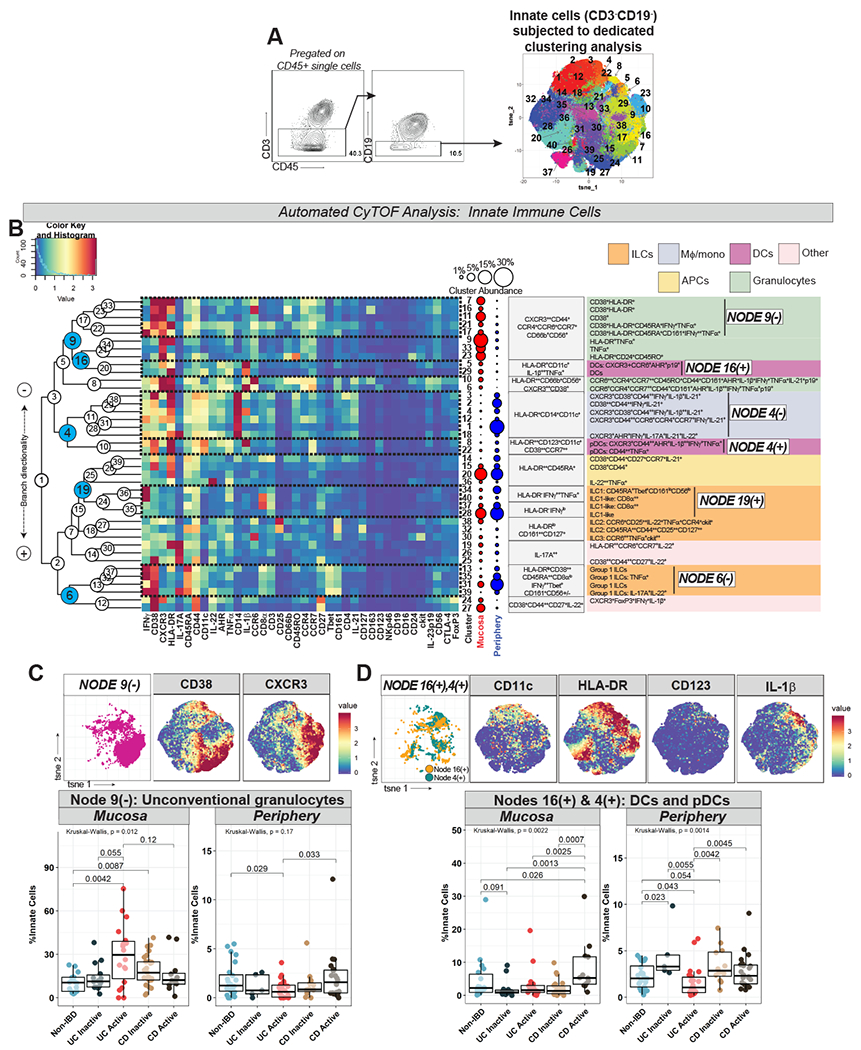
A. Gating strategy defining innate immune cells (left) with labeled t-SNE cluster plot (right) from dedicated clustering analysis. B. CyTOF marker heatmap, cluster dendrogram, cluster abundance and identity (color-coded by subset) organized as per Fig 1C. C. Node 9(−) (from Fig 5B) abundance plots, t-SNE, and CD38/CXCR3 marker heatmaps. D. Nodes 16(+) and 4(+) (from Fig 5B) abundance plots (combined), t-SNE, and selected marker heatmaps.
UCa mucosa was characterized by increased granulocytes (Node 9(−) in Fig 5B) with a concomitant decrease (trend) in the periphery (Fig 5C). This population expressed chemokine receptors (CXCR3, CCR6), as well as unconventional granulocyte markers including HLA-DR, CD38, and CD56, which have been reported to be upregulated on granulocytes in other human diseases26,27 (Fig 5B–C). CDa mucosa, on the other hand, was characterized by increased DCs and pDCs (Nodes 16(+) and 4(+) respectively in Fig 5B), which were also increased in peripheral CDa>UCa (Fig 5D). The majority of these DC and pDC clusters, notably, highly expressed IL-1β (Fig 5B, D).
ILC signatures differentiate CD from UC in mucosa and periphery
Group 1 ILCs (likely including both ILC1 and natural killer [NK] cells) (Node 6(−) in Fig 5B) were decreased in peripheral CDa, without subject group differences in the mucosa (Fig 6A). Node 19(+) (in Fig 5B), which included both ILC1 (Cluster 34) as well as “ILC1-like” clusters (identified by lack of expression of lineage markers [e.g. CD14, CD11c] but with expression of the ILC1-hallmark cytokine IFNγ and by CD8α, which has been reported in ILCs28) was also found to be decreased in peripheral CDa (Fig 6A). ILC1 and ILC1-like clusters conversely were increased in the mucosa in CDa>UCa (Fig 6A), while Cluster 30 (in Fig 5B), representing ILC3s, was specifically reduced in UCa mucosa (Fig 6B).
Figure 6. CyTOF Demonstrates Differential Innate Lymphoid Cell and IL-1β-Related Macrophage/Monocyte Signatures in UC vs CD.
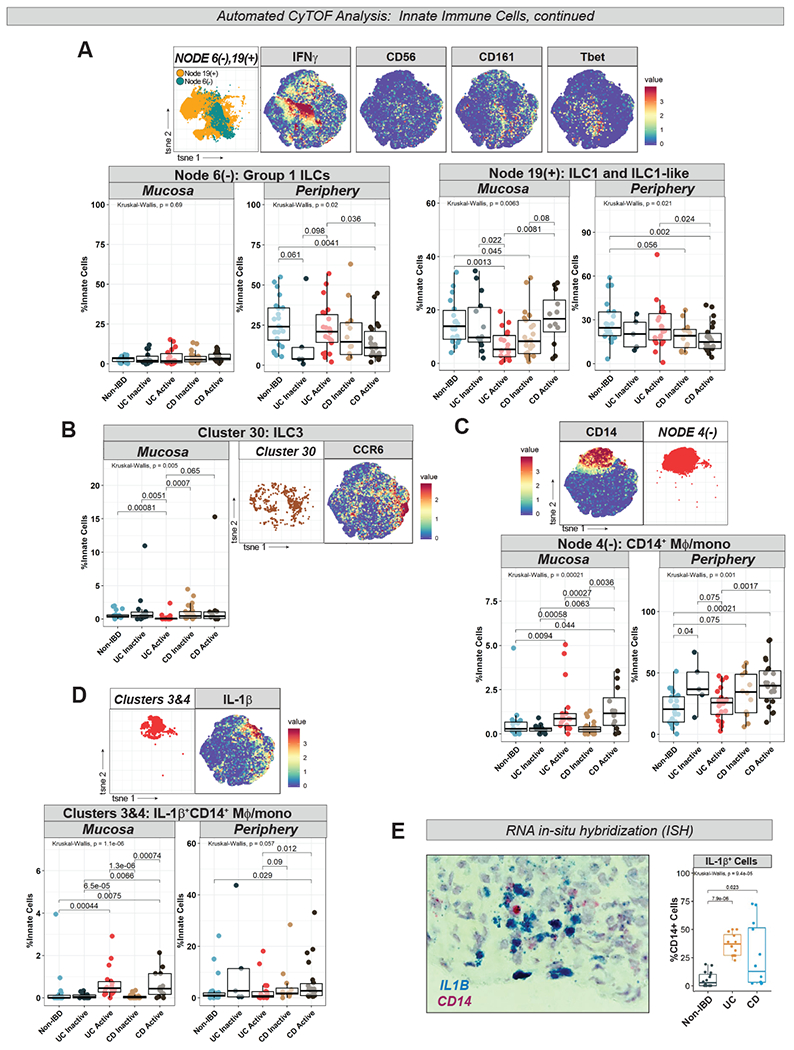
A. Nodes 6(−) and 19(+) (from Fig 5B) abundance plots, t-SNE, and selected marker heatmaps. B. Cluster 30 (from Fig 5B) abundance plot, t-SNE, and CCR6 marker heatmap. C. Node 4(−) (from Fig 5B) abundance plot, t-SNE, and CD14 marker heatmap. D. Clusters 3 and 4 (from Fig 5B) abundance plot (combined), t-SNE, and IL-1β marker heatmap. E. Box-and-whisker plot of IL1B+CD14+ cells counted in ISH images (4 images per subject) with representative image.
IL-1β+Mφ/mono are increased in active IBD mucosa and in peripheral CDa
Total CD14+ Mφ/mono, corresponding to Node 4(−) (in Fig 5B), were increased in active IBD mucosa and in peripheral CDa (Fig 6C) as were IL-1β+ Mφ/mono clusters (clusters 3 and 4) (Fig 6D). Expansion of IL-1β+ Mφ/mono in active IBD mucosa was confirmed in an independent cohort through ISH (Fig 6E, Table S5). scRNA-seq analysis of colonic mucosa of 5 active UC subjects also identified a cluster of myeloid cells expressing IL1B, CD14, and FCGR3A (CD16) (Cluster 15 in Table S6). Additional cluster-defining genes included inflammatory mediators such as IL8, S100A8/A9 (calprotectin), CD163, SOD2, and LYZ (Table S6).
RF modeling discriminates CDa vs UCa in mucosa and periphery
We applied machine learning with RF to determine if differences between subject groups based on automated T, B and innate clustering could classify mucosal and peripheral disease. In brief, the relative abundance of the daughter branches of every node was computed in all samples, and RF analysis was used to model how these compositional differences vary across subject groups. RF models accurately differentiated CDa and UCa both in the mucosa and periphery (Fig 7A–B). Model receiver operating characteristic (ROC) curves associated with area under the curve (AUC) p-values demonstrate that a 6-feature model discriminates CDa vs UCa mucosa and periphery (p=0.017 and p=0.0095 respectively) (Fig 7A–B).
Figure 7. Signatures of Immune Dysregulation in IBD.
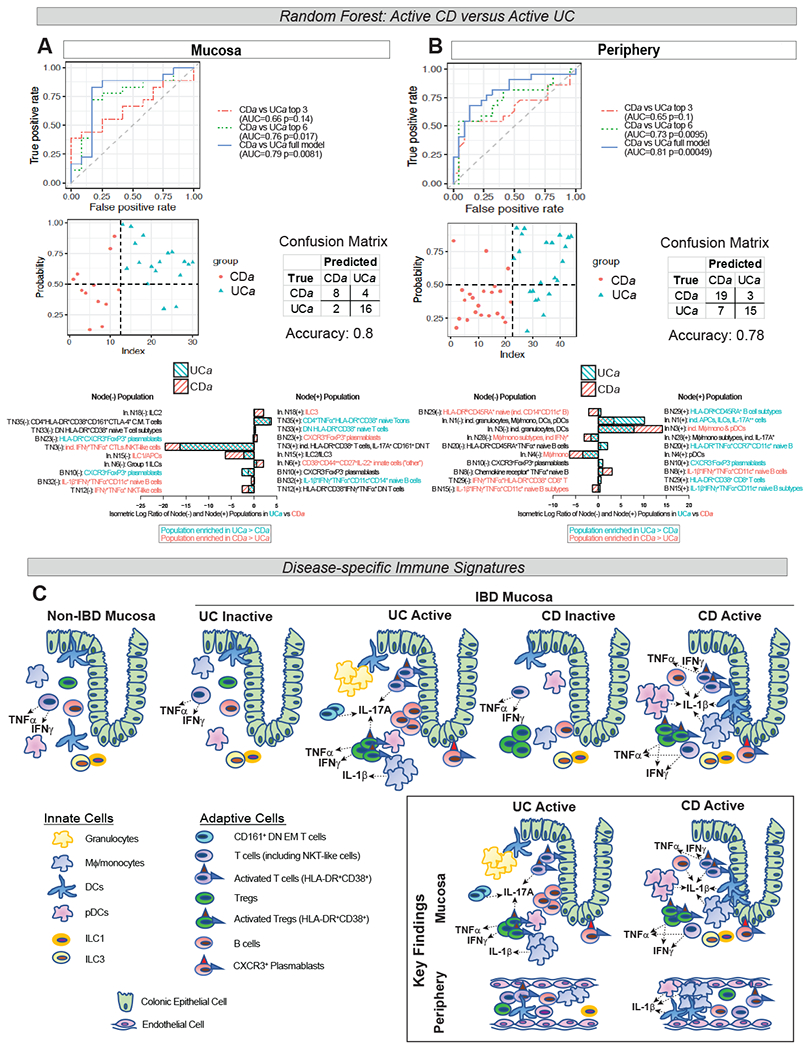
Random forest (RF)-generated models of UCa:CDa discrimination in mucosa (A) and periphery (B). Receiver operator characteristic (ROC) curves (top panels) with models using top 3, top 6, and full model of input features shown. Area under the curve (AUC) for each model shown with associated p-value. Probability plots with associated confusion matrices (middle panels) demonstrating model accuracy of the full model. Top 10 features (in descending order of importance), representing isometric log-ratio of depicted nodes, with relative abundance of node branches in bar graphs and colored based on preferential abundance in UCa vs CDa (bottom panels). “In.”=“innate”. C. Schematic of key findings in IBD mucosa and periphery: IL-17A expression by several immune populations in UCa>CDa mucosa (CD161+ DN EM T cells, HLA-DR+CD38+ T cells and Tregs), IL-1β expression in CDa>UCa mucosa (in DCs, pDCs, HLA-DR+CD38+ T cells), expansion of granulocytes in UCa>CDa and ILC1 and ILC3 in CDa>UCa mucosa; and in the periphery, expansion of IL-1β+ Mφ/mono, DCs, and pDCs in CDa>UCa and expansion of Group 1 ILCs in UCa>CDa.
Interestingly, half of the top 6 nodes differentiating CDa from UCa mucosa were T cell nodes (Fig 7A), while those in the periphery were predominantly innate cell nodes (Fig 7B). The top 6 nodes differentiating CDa from UCa mucosa were T Cell Nodes 35 and 33, which both branch into clusters of HLA-DR+CD38+ T cells; T Cell Node 3, which has a daughter branch giving rise to HLA-DR+CD38+ T cells and IL-17A+ CD161+ DN EM T cells; B Cell Node 23, which branches into clusters of CXCR3+ plasmablasts; and Innate Cell Nodes 15 and 18, which branch into ILC1/IL2/ILC3 populations. The ILC3 branch of Innate Cell Node 18 (the #1 feature discriminating UCa from CDa mucosa) was enriched in CDa>UCa compared to the ILC2 branch (Fig 7A). Among the top 6 nodes differentiating peripheral CDa from UCa were multiple innate cell nodes branching into IL-1β+/− Mφ/mono and DCs, complementing our findings demonstrating enrichment of IL-1β+ Mφ/mono/DCs in peripheral CDa>UCa (in Fig 5D, Fig 6D).
RF was additionally used to differentiate other subject group pairings (Fig S6A–B). Based on AUC p-values, in the mucosa, RF modeling accurately classified non-IBD:UCa, non-IBD:CDa (strong trend with p=0.079), and UCa:UCi, but not CDa:CDi, perhaps suggesting that differences between active and inactive CD are more subtle (Fig S6A). In the periphery, apart from UCa:CDa, only the comparison between non-IBD and CDa was significant, suggesting that perhaps CD is associated with more systemic inflammation than UC (Fig S6B).
Discussion:
UC and CD result from immune dysregulation in the context of genetics and environment that is not adequately understood. Translational investigation using human samples is critical in identifying hallmarks of disease to improve understanding of pathogenesis, discern new therapeutic targets and expand our diagnostic repertoire.
With these relevant issues in mind, we employed single-cell analysis with CyTOF on IBD and non-IBD colonic mucosa and blood to identify disease-specific immune signatures (summarized in Fig 7C). Many findings have yet to be reported and could potentially be harnessed for disease- or even patient-specific treatments. Furthermore, we used machine learning to create models based on our data that can accurately classify disease type/activity in both tissue and periphery, potentially heralding new diagnostic avenues in this field.
As expected, immune cell populations in active IBD mucosa were significantly altered. We identified abundant HLA-DR+CD38+ T cells in UCa and CDa mucosa, previously reported only in the circulation of immune-mediated disease states including HIV29 and IBD14,30. CD38 has been implicated in colitis in mice31 and CD38+ effector T cells in the severity of pediatric IBD13. Our results suggest that CD38 could be targeted as an IBD therapeutic. Interestingly, we did not reliably observe HLA-DRA/CD38 transcripts in T cells in scRNA-seq data (or in mining available published scRNA-seq data from human UC colonic mucosa9), suggesting T cells may acquire HLA-DR/CD38 proteins through membrane fusion upon cellular interaction32.
CXCR3+ plasmablasts were enriched in active IBD tissue. Plasmablasts, precursors to antibody-secreting plasma cells, migrate to sites of inflammation via the chemokine receptor CXCR333. Circulating CXCR3+ plasmablasts have been described in immune-mediated diseases including UC34, as have increased plasma cells in UC colonic mucosa35. Our finding of IBD-associated mucosal CXCR3+ plasmablasts complements and builds upon this knowledge. Classically associated with Tregs and suppression, FoxP3 expression in non-T cells is controversial; nevertheless, we did detect FoxP3 expression in the CXCR3+ plasmablast population suggesting these cells may possibly play a regulatory role in inflamed mucosa.
Our results identified several disease-specific mucosal signatures related to differential cytokine expression. In T cells, effector memory subsets were stratified in UCa versus CDa mucosa along a cytokine axis, with IL-17A+ T cells expanded in UCa and IFNγ+TNFα+ T cells expanded in CDa. The role of Th17 cells in IBD has been controversial, with some studies suggesting pathogenic implication in CD36,37, while others suggesting a UC-specific signature38. MAIT cells, known to express pro-inflammatory cytokines including IFNγ and IL-17A, have not been rigorously studied in IBD although enrichment of MAIT cells in IBD mucosa has been reported39. In this study, we identify a UC-specific IL-17A+ CD161+ EM T cell subset which could represent MAIT cells or T cells with a similar innate phenotype8, and based on scRNA-seq analysis, may be characterized by the Th17-related transcription factor RORA. While IL-17A blockade was not efficacious in treating CD40, its use in UC might be considered.
Our analysis of Tregs similarly identified expansion of IL-17A+ memory subsets specific to UCa, belonging to umbrella populations of highly activated IBD-associated memory Tregs. Whereas one population of IBD-enriched, activated memory Tregs was FoxP3++, the other was FoxP3lo with intense pro-inflammatory cytokine expression (IFNγ+TNFα+IL-17A+/−), suggesting that Treg function in IBD may be altered, as has been suggested by one prior study in CD17. In addition to these mucosal Treg signatures, we identified the unusual finding of an IL-1β+ Treg population expanded in peripheral CDa.
IL-1β signatures specific to CD also involved HLA-DR+CD38+ T cells, naïve B cells and DCs. IL-1β+ Mφ/mono were expanded in both CDa and UCa mucosa, which has been reported previously employing in vitro studies41, however here we also identify expansion of IL-1β+ monocytes specific to peripheral CDa. We hypothesize that in a subgroup of CD patients, targeting IL-1β may be a promising strategy.
Peripheral immune population differences distinguishing UCa from CDa were primarily found in innate immune cells. DCs, pDCs, and CD14+ Mφ/mono were all expanded while Group 1 ILCs were decreased in peripheral CDa. In peripheral UCa, we found a decrease (trend) in granulocytes expressing unconventional granulocyte markers including HLA-DR and CD56 with a concomitant increase in these cells in UCa mucosa, potentially reflective of tissue homing. This is consistent with previous data suggesting that intestinal neutrophil infiltration correlates with severity of UC42,43.
Predictive modeling with RF built upon these findings. Many of the top RF nodes branched into clusters we had identified through our initial analysis as being hallmarks of disease, including HLA-DR+CD38+ T cells, FoxP3+CXCR3+/− plasmablasts, and IL-1β+/− Mφ/mono and DCs. Other nodes identified through RF revealed important patterns related to specific clusters, such as the enrichment of ILC3>ILC2 in CDa mucosa. ILC1 (which we found to be increased in CDa>UCa mucosa) can transition to an ILC3 phenotype in an IL-1 dependent manner44, complementing our data demonstrating IL-1-specific signatures in CDa. Importantly, RF models could distinguish nearly all mucosal subject group comparisons but in the periphery could only distinguish UCa:CDa and CDa:non-IBD. This suggests that although robust immunologic signatures are more likely to be mucosal, there are some that can be peripherally detected (especially in CDa) potentially of great biological and diagnostic relevance.
There are several limitations to these studies. Our IBD cohort was heterogenous and given the variety of clinical phenotypes, we were unable to extract immune signatures specific to treatment response or other characteristics. Only a subset of subjects had matched tissue and blood, limiting our interpretation of cellular interchange between mucosal and peripheral compartments. Additional investigation with functional studies is needed to understand whether our findings contribute to pathogenesis and/or severity of disease.
In summary, our results highlight that CyTOF analysis of mucosal and peripheral immune cells can be used to define unique signatures differentiating disease type and activity. A number of these signatures, such as IL-17A in UC, IL-1β in CD and CD38 in IBD, already have approved biologic inhibitors that can allow for targeted therapeutics. Further translational work in this field can build upon these findings and potentially identify patient-specific signatures in an evolving era of personalized therapeutic approaches.
Materials and Methods
Human sample collection
Peripheral blood and/or colonic tissue from pediatric (age >6) and adult subjects were collected after providing written informed consent. Samples were collected peri-procedure (colectomy/colonoscopy) or during a clinical lab draw at Boston Children’s Hospital or Brigham and Women’s Hospital under Institutional Review Board protocol IRB-P00000529.
Determination of inflammation status and disease phenotype
The inflammatory status of IBD tissue was based on blinded histopathological scoring by an experienced pathologist using the Nancy Index45 (Fig S1B). An index of 0-1 was considered inactive disease while 2-4 was considered active. Nancy Index assignments and endoscopic assessments of inflammation were correlated (Fig S1C). See Fig S1C for further methodology for peripheral samples. Chart review was performed to obtain age, gender, treatment status, CRP values and disease phenotype per the Montreal Classification System (Table S1).
Peripheral blood mononuclear cell (PBMC) and tissue isolation/cryopreservation
To isolate PMBCs, whole blood collected in K2 EDTA tubes (BD Vacutainer) was processed using density-gradient centrifugation with Lympholyte-H Cell Separation Media (Cedarlane). Biopsies and resected surgical specimens were collected in T-cell media (500mL RPMI 1640 medium (ThermoFisher), 50mL FBS plus 5mL of: Pen/Strep (ThermoFisher), NEAA, Sodium pyruvate, Glutamax, and HEPES (Gibco)). PBMC suspensions (1 million cells per 100uL) and intestinal samples were cryopreserved in freezing media (10% dimethyl sulfoxide (DMSO) (Sigma) and 90% fetal bovine serum (FBS) (Gibco))7. Samples were transferred to liquid nitrogen for long-term storage.
Mucosal cell isolation from cryopreserved samples
For CyTOF, cryopreserved intestinal samples were thawed and digested overnight in digestion media (10μg/mL collagenase I (Sigma) + 1μg/mL DNaseI (10,000 IU/mL) (Sigma) in 20mL T-cell media/sample) @37°C @200 rpm. For flow cytometry, samples were digested in 300U/mL collagenase VIII (Sigma) + 50μg/mL DNAseI (Sigma) in 20mL T-cell media/sample x45min. Digested solutions were strained and pelleted to isolate cells.
CyTOF staining and acquisition
Single cell suspensions were stimulated with PMA (1:2000 of 100μg/mL stock, Sigma), ionomycin (1:1000 of 1mg/mL stock, Sigma), and GolgiStop (1:1500, BD Biosciences) x4hr. Cells were stained with Rh103 intercalator (500μM, Fluidigm) to label non-viable cells. Samples were stained with CyTOF antibody panels (Fig S1A, Table S2). Following staining, samples were labeled with Ir191/193 intercalator (1:1000 of 125μM stock, Fluidigm), then acquired on a Helios2 Mass Cytometer (Fluidigm). EQ 4 Elemental beads (Fluidigm) were used for normalization. Specifics of total cell numbers and viability of mucosal cells acquired in Table S3. Further details regarding CyTOF staining protocol can be found in Supplemental Methods.
CyTOF data analysis
Normalized FCS files were uploaded into Cytobank46 to define CD45+ viable single cell events, and subsequently gated as demonstrated in results (Fig 1B, 2D, 3A, 4A, 5A). Gated subsets were exported, uploaded into FlowJo and re-exported to ensure channel uniformity. Through cytofkit47, clustering using FlowSOM48 and dimensionality reduction using t-stochastic neighbor embedding (t-SNE)49 was performed using only markers common to all samples (Table S4). Hierarchical clustering dendrograms were created with euclidean agglomeration in R. Heatmaps were created using heatmap.2 in R gplots50.
All statistical computations were performed in R, including Kruskal-Wallis (for multiple group comparisons) and Wilcoxon t-tests (for two-group comparisons). Box-and-whisker plots were generated using ggplot251.
Flow cytometry
Colonic mucosal samples from a separate cohort (demographic data in Table S5) were digested and stimulated as above. Cells were stained with fluorophore-conjugated antibodies in FCS buffer (PBS plus 2% FBS) (antibodies listed in Table S2). Samples were acquired on a BD LSRFortessa. Further compensation and analysis were performed in FlowJo. Further details regarding flow cytometry staining protocol can be found in Supplemental Methods.
RNA in situ hybridization (ISH)
Formalin-fixed tissue samples were paraffin-embedded and sectioned by the University of Pittsburgh Biospecimen Core. Tissue sections were deparaffinized using xylene and 100% ethanol. RNAscope® probes (ACD Bio) were used to stain targets, including IL1B (C1) and CD14 (C2). RNAscope® Duplex Detection reagents (ACD Bio) were used according to manufacturer’s instructions to amplify target RNA signal and bind probes to chromophores. Sections were stained with hematoxylin for detection of cell bodies. An Echo Revolve microscope was used to image stained sections at 40X. Cells positive for one or both probes were counted on 40X images using ImageJ 1.52 in a blinded fashion. Available demographic data of this cohort in Table S5.
scRNA-seq: tissue preparation, protocols, analysis
Please refer to Supplemental Methods for full protocol. In brief, processing of single-cell biopsies was based on a protocol adapted from Smilie et al9. Cryopreserved mucosal samples (2-3 biopsies/sample, or equivalently-sized pieces of resected surgical tissue, as described in Konnikova et al7) were thawed and separation of epithelial layer from lamina propria (LP) was performed. The two cellular fractions were enzymatically digested and run on separate Seq-Well arrays as described in Ordovas-Montanes et al52 with improved protocol for library preparation based on second-strand synthesis for cDNA (S^3) from Hughes et al53. Two arrays were sequenced per sequencing run with an Illumina 75 Cycle NextSeq500/550v2.5 kit on an Illumina NextSeq. Read alignment was performed as done previously52,53. Quality-filtered base calls were converted to demultiplexed FASTQ files and aligned to the Hg19 genome using Cell Ranger on the Galaxy portal maintained by the Broad Institute.
Merging of datasets, clustering, and differential gene expression analyses were performed using Seurat v3.154 (https://satijalab.org/seurat/). Lists of differentially expressed genes defining the cellular clusters for all cells and for T cells (from Fig 2A,B) can be found in Table S6 and S7.
Random forest (RF) predictive modeling
RF classifiers55 were constructed to differentiate between two subject groups (pairwise comparisons depicted in Fig 7A–B, S6). RF modeling was performed using the leave-one-out cross-validation (LOOCV) strategy, removing one sample as a testing set and using the rest as training set. This strategy is repeated until each sample is left out at least once. The input features were the isometric log-ratios (ILRs)56 of branch abundance of each node in the hierarchical clustering dendrograms from T, B and innate cell analyses. Prediction accuracy (with a cutoff point equally weighing false positive and false negative predictions) and area under the curve (AUC) were calculated to evaluate model performance.
To choose the proper number of features to include in classifiers, each time in LOOCV, we selected top n (n=5,10,20,30,50 or 100) differential features by Wilcoxon test based on training data to construct classifiers; the n that yielded the highest prediction accuracy was selected as the number of features for the full models.
Data Availability Statement
CyTOF:
All mass cytometry files (.fcs files) can be accessed through a publicly available experiment on Cytobank platform (https://premium.cytobank.org) entitled “Raw mass cytometry data from: Mitsialis et. al. Single-Cell Analyses of Colon and Blood Reveal Distinct Immune Cell Signatures of Ulcerative Colitis and Crohn’s Disease. Gastroenterology. 2020.” File names are deidentified and correlate with a metadata spreadsheet (Table S8).
scRNA-seq:
The cells-by-genes matrices generated from colonic mucosa from the five ulcerative colitis subjects included in this study can be accessed on NIH GEO (https://www.ncbi.nlm.nih.gov/geo/) with the accession number GSE150115. Associated clinical metadata for these subjects can be found in Table S8.
Supplementary Material
What you need to know:
BACKGROUND AND CONTEXT:
Studies are needed to determine the mechanisms of mucosal dysregulation in patients with inflammatory bowel diseases (IBD) and differences in inflammatory responses of patients with ulcerative colitis (UC) vs Crohn’s disease (CD).
NEW FINDINGS:
The authors used single-cell technologies to identify immune cell populations specific to mucosa and blood samples from patients with active or inactive CD and UC and controls.
LIMITATIONS:
This study analyzed colon and blood samples from fewer than 100 patients; larger studies, with more samples types and patients, are needed to confirm these differences.
IMPACT:
This information might be used to develop therapeutics that target different cell types and stages of IBD.
Acknowledgements:
V.M. is a recipient of a Research Fellowship Award from the Crohn’s and Colitis Foundation (RFA 622723). S.B.S. is supported by NIH Grants: R01 DK115217, R56 AI125766; P30DK034854, the Helmsley Charitable Trust, the Wolpow Family Chair in IBD Treatment and Research, and the Translational Investigator Service at Boston Children’s Hospital. L.K. is a recipient of a Career Development Award Grant from the Crohn’s and Colitis Foundation (CDA 422348). A.K.S. is supported by the Beckman Young Investigator Program, a Sloan Fellowship in Chemistry, and NIH 5U24AI118672.
Conflict of interest:
S.B.S. is supported by grants or in-kind contributions from Pfizer, Novartis, Janssen, Merck, and Regeneron. He is on the scientific advisory boards of Pfizer, Janssen, IFM Therapeutics, Lycera, Inc., Celgene, Lilly, Pandion Therapeutics, and Applied Molecular Transport. He has consulted for Amgen and Hoffman La-Roche. L.K. is supported by funding from NGMB Biopharmaceuticals. A.K.S. has received compensation for consulting and/or SAB membership from Merck, Honeycomb Biotechnologies, Cellarity, Cogen Therapeutics and Dahlia Biosciences, as well as grants from Novartis, Janssen, and Merck. There are no conflicts of interest that are related to this work.
Footnotes
Publisher's Disclaimer: This is a PDF file of an unedited manuscript that has been accepted for publication. As a service to our customers we are providing this early version of the manuscript. The manuscript will undergo copyediting, typesetting, and review of the resulting proof before it is published in its final form. Please note that during the production process errors may be discovered which could affect the content, and all legal disclaimers that apply to the journal pertain.
References:
- 1.Dahlhamer JM, Zammitti EP, Ward BW, et al. Prevalence of Inflammatory Bowel Disease Among Adults Aged >/=18 Years - United States, 2015. MMWR Morb Mortal Wkly Rep 2016;65:1166–9. [DOI] [PubMed] [Google Scholar]
- 2.de Souza HS, Fiocchi C. Immunopathogenesis of IBD: current state of the art. Nat Rev Gastroenterol Hepatol 2016;13:13–27. [DOI] [PubMed] [Google Scholar]
- 3.Neurath MF. Current and emerging therapeutic targets for IBD. Nat Rev Gastroenterol Hepatol 2017;14:269–78. [DOI] [PubMed] [Google Scholar]
- 4.Cohen BL, Sachar DB. Update on anti-tumor necrosis factor agents and other new drugs for inflammatory bowel disease. BMJ 2017;357:j2505. [DOI] [PubMed] [Google Scholar]
- 5.Ford AC, Sandborn WJ, Khan KJ, et al. Efficacy of biological therapies in inflammatory bowel disease: systematic review and meta-analysis. Am J Gastroenterol 2011;106:644–59, quiz 60. [DOI] [PubMed] [Google Scholar]
- 6.Reinecker HC, Steffen M, Witthoeft T, et al. Enhanced secretion of tumour necrosis factor-alpha, IL-6, and IL-1 beta by isolated lamina propria mononuclear cells from patients with ulcerative colitis and Crohn’s disease. Clin Exp Immunol 1993;94:174–81. [DOI] [PMC free article] [PubMed] [Google Scholar]
- 7.Konnikova L, Boschetti G, Rahman A, et al. High-dimensional immune phenotyping and transcriptional analyses reveal robust recovery of viable human immune and epithelial cells from frozen gastrointestinal tissue. Mucosal immunology 2018. [DOI] [PMC free article] [PubMed] [Google Scholar]
- 8.Fergusson JR, Smith KE, Fleming VM, et al. CD161 defines a transcriptional and functional phenotype across distinct human T cell lineages. Cell reports 2014;9:1075–88. [DOI] [PMC free article] [PubMed] [Google Scholar]
- 9.Smillie CS, Biton M, Ordovas-Montanes J, et al. Intra- and Inter-cellular Rewiring of the Human Colon during Ulcerative Colitis. Cell 2019;178:714–30 e22. [DOI] [PMC free article] [PubMed] [Google Scholar]
- 10.Walker LJ, Kang YH, Smith MO, et al. Human MAIT and CD8alphaalpha cells develop from a pool of type-17 precommitted CD8+ T cells. Blood 2012;119:422–33. [DOI] [PMC free article] [PubMed] [Google Scholar]
- 11.Koay HF, Su S, Amann-Zalcenstein D, et al. A divergent transcriptional landscape underpins the development and functional branching of MAIT cells. Sci Immunol 2019;4. [DOI] [PMC free article] [PubMed] [Google Scholar]
- 12.Shaler CR, Choi J, Rudak PT, et al. MAIT cells launch a rapid, robust and distinct hyperinflammatory response to bacterial superantigens and quickly acquire an anergic phenotype that impedes their cognate antimicrobial function: Defining a novel mechanism of superantigen-induced immunopathology and immunosuppression. PLoS Biol 2017;15:e2001930. [DOI] [PMC free article] [PubMed] [Google Scholar]
- 13.Joosse ME, Menckeberg CL, de Ruiter LF, et al. Frequencies of circulating regulatory TIGIT(+)CD38(+) effector T cells correlate with the course of inflammatory bowel disease. Mucosal immunology 2019;12:154–63. [DOI] [PubMed] [Google Scholar]
- 14.Funderburg NT, Stubblefield Park SR, Sung HC, et al. Circulating CD4(+) and CD8(+) T cells are activated in inflammatory bowel disease and are associated with plasma markers of inflammation. Immunology 2013;140:87–97. [DOI] [PMC free article] [PubMed] [Google Scholar]
- 15.Baecher-Allan C, Wolf E, Hafler DA. MHC class II expression identifies functionally distinct human regulatory T cells. J Immunol 2006;176:4622–31. [DOI] [PubMed] [Google Scholar]
- 16.Miyara M, Yoshioka Y, Kitoh A, et al. Functional delineation and differentiation dynamics of human CD4+ T cells expressing the FoxP3 transcription factor. Immunity 2009;30:899–911. [DOI] [PubMed] [Google Scholar]
- 17.Hovhannisyan Z, Treatman J, Littman DR, et al. Characterization of interleukin-17-producing regulatory T cells in inflamed intestinal mucosa from patients with inflammatory bowel diseases. Gastroenterology 2011;140:957–65. [DOI] [PMC free article] [PubMed] [Google Scholar]
- 18.Koenecke C, Lee CW, Thamm K, et al. IFN-gamma production by allogeneic Foxp3+ regulatory T cells is essential for preventing experimental graft-versus-host disease. J Immunol 2012;189:2890–6. [DOI] [PubMed] [Google Scholar]
- 19.Esposito M, Ruffini F, Bergami A, et al. IL-17- and IFN-gamma-secreting Foxp3+ T cells infiltrate the target tissue in experimental autoimmunity. J Immunol 2010;185:7467–73. [DOI] [PubMed] [Google Scholar]
- 20.Maul J, Loddenkemper C, Mundt P, et al. Peripheral and intestinal regulatory CD4+ CD25(high) T cells in inflammatory bowel disease. Gastroenterology 2005;128:1868–78. [DOI] [PubMed] [Google Scholar]
- 21.Holmen N, Lundgren A, Lundin S, et al. Functional CD4+CD25high regulatory T cells are enriched in the colonic mucosa of patients with active ulcerative colitis and increase with disease activity. Inflammatory bowel diseases 2006;12:447–56. [DOI] [PubMed] [Google Scholar]
- 22.Ma S, Wang C, Mao X, et al. B Cell Dysfunction Associated With Aging and Autoimmune Diseases. Front Immunol 2019;10:318. [DOI] [PMC free article] [PubMed] [Google Scholar]
- 23.Ziegler-Heitbrock HW, Pechumer H, Petersmann I, et al. CD14 is expressed and functional in human B cells. Eur J Immunol 1994;24:1937–40. [DOI] [PubMed] [Google Scholar]
- 24.Vadasz Z, Toubi E. FoxP3 Expression in Macrophages, Cancer, and B Cells-Is It Real? Clin Rev Allergy Immunol 2017;52:364–72. [DOI] [PubMed] [Google Scholar]
- 25.Mao H, Pan F, Wu Z, et al. CD19(lo)CD27(hi) Plasmablasts Suppress Harmful Th17 Inflammation Through Interleukin 10 Pathway in Colorectal Cancer. DNA Cell Biol 2017;36:870–7. [DOI] [PubMed] [Google Scholar]
- 26.Lok LSC, Dennison TW, Mahbubani KM, et al. Phenotypically distinct neutrophils patrol uninfected human and mouse lymph nodes. Proc Natl Acad Sci U S A 2019;116:19083–9. [DOI] [PMC free article] [PubMed] [Google Scholar]
- 27.Lin A, Lore K. Granulocytes: New Members of the Antigen-Presenting Cell Family. Front Immunol 2017;8:1781. [DOI] [PMC free article] [PubMed] [Google Scholar]
- 28.Roan F, Stoklasek TA, Whalen E, et al. CD4+ Group 1 Innate Lymphoid Cells (ILC) Form a Functionally Distinct ILC Subset That Is Increased in Systemic Sclerosis. J Immunol 2016;196:2051–62. [DOI] [PMC free article] [PubMed] [Google Scholar]
- 29.Kestens L, Vanham G, Gigase P, et al. Expression of activation antigens, HLA-DR and CD38, on CD8 lymphocytes during HIV-1 infection. AIDS 1992;6:793–7. [DOI] [PubMed] [Google Scholar]
- 30.Rubin SJS, Bai L, Haileselassie Y, et al. Mass cytometry reveals systemic and local immune signatures that distinguish inflammatory bowel diseases. Nat Commun 2019;10:2686. [DOI] [PMC free article] [PubMed] [Google Scholar]
- 31.Schneider M, Schumacher V, Lischke T, et al. CD38 is expressed on inflammatory cells of the intestine and promotes intestinal inflammation. PLoS One 2015;10:e0126007. [DOI] [PMC free article] [PubMed] [Google Scholar]
- 32.Game DS, Rogers NJ, Lechler RI. Acquisition of HLA-DR and costimulatory molecules by T cells from allogeneic antigen presenting cells. Am J Transplant 2005;5:1614–25. [DOI] [PubMed] [Google Scholar]
- 33.Radbruch A, Muehlinghaus G, Luger EO, et al. Competence and competition: the challenge of becoming a long-lived plasma cell. Nat Rev Immunol 2006;6:741–50. [DOI] [PubMed] [Google Scholar]
- 34.Hosomi S, Oshitani N, Kamata N, et al. Increased numbers of immature plasma cells in peripheral blood specifically overexpress chemokine receptor CXCR3 and CXCR4 in patients with ulcerative colitis. Clin Exp Immunol 2011;163:215–24. [DOI] [PMC free article] [PubMed] [Google Scholar]
- 35.Mitsuishi T Correlation between histological findings and endoscopic findings in patients with ulcerative colitis: Basal plasmacytosis is an important finding suggesting active inflammation. JGH Open 2019;3:100–4. [DOI] [PMC free article] [PubMed] [Google Scholar]
- 36.Brand S Crohn’s disease: Th1, Th17 or both? The change of a paradigm: new immunological and genetic insights implicate Th17 cells in the pathogenesis of Crohn’s disease. Gut 2009;58:1152–67. [DOI] [PubMed] [Google Scholar]
- 37.Seiderer J, Elben I, Diegelmann J, et al. Role of the novel Th17 cytokine IL-17F in inflammatory bowel disease (IBD): upregulated colonic IL-17F expression in active Crohn’s disease and analysis of the IL17F p.His161Arg polymorphism in IBD. Inflammatory bowel diseases 2008;14:437–45. [DOI] [PubMed] [Google Scholar]
- 38.Rosen MJ, Karns R, Vallance JE, et al. Mucosal Expression of Type 2 and Type 17 Immune Response Genes Distinguishes Ulcerative Colitis From Colon-Only Crohn’s Disease in Treatment-Naive Pediatric Patients. Gastroenterology 2017;152:1345–57 e7. [DOI] [PMC free article] [PubMed] [Google Scholar]
- 39.Tominaga K, Yamagiwa S, Setsu T, et al. Possible involvement of mucosal-associated invariant T cells in the progression of inflammatory bowel diseases. Biomed Res 2017;38:111–21. [DOI] [PubMed] [Google Scholar]
- 40.Hueber W, Sands BE, Lewitzky S, et al. Secukinumab, a human anti-IL-17A monoclonal antibody, for moderate to severe Crohn’s disease: unexpected results of a randomised, double-blind placebo-controlled trial. Gut 2012;61:1693–700. [DOI] [PMC free article] [PubMed] [Google Scholar]
- 41.Mahida YR, Wu K, Jewell DP. Enhanced production of interleukin 1-beta by mononuclear cells isolated from mucosa with active ulcerative colitis of Crohn’s disease. Gut 1989;30:835–8. [DOI] [PMC free article] [PubMed] [Google Scholar]
- 42.Raab Y, Gerdin B, Ahlstedt S, et al. Neutrophil mucosal involvement is accompanied by enhanced local production of interleukin-8 in ulcerative colitis. Gut 1993;34:1203–6. [DOI] [PMC free article] [PubMed] [Google Scholar]
- 43.Bressenot A, Salleron J, Bastien C, et al. Comparing histological activity indexes in UC. Gut 2015;64:1412–8. [DOI] [PubMed] [Google Scholar]
- 44.Bernink JH, Krabbendam L, Germar K, et al. Interleukin-12 and -23 Control Plasticity of CD127(+) Group 1 and Group 3 Innate Lymphoid Cells in the Intestinal Lamina Propria. Immunity 2015;43:146–60. [DOI] [PubMed] [Google Scholar]
- 45.Marchal-Bressenot A, Scherl A, Salleron J, et al. A practical guide to assess the Nancy histological index for UC. Gut 2016;65:1919–20. [DOI] [PMC free article] [PubMed] [Google Scholar]
- 46.Kotecha N, Krutzik PO, Irish JM. Web-based analysis and publication of flow cytometry experiments. Curr Protoc Cytom 2010;Chapter 10:Unit10 7. [DOI] [PMC free article] [PubMed] [Google Scholar]
- 47.Chen H, Lau MC, Wong MT, et al. Cytofkit: A Bioconductor Package for an Integrated Mass Cytometry Data Analysis Pipeline. PLoS computational biology 2016;12:e1005112. [DOI] [PMC free article] [PubMed] [Google Scholar]
- 48.Van Gassen S, Callebaut B, Van Helden MJ, et al. FlowSOM: Using self-organizing maps for visualization and interpretation of cytometry data. Cytometry Part A : the journal of the International Society for Analytical Cytology 2015;87:636–45. [DOI] [PubMed] [Google Scholar]
- 49.van der Maaten L Visualizing Data using t-SNE. J of Machine Learning Research 2008;9:2579–605. [Google Scholar]
- 50.Warnes GR, Bolker B, Bonebakker L, et al. gplots: Various R Programming Tools for Plotting Data 2019. [Google Scholar]
- 51.Wickham H ggplot2: Elegant Graphics for Data Analysis. Springer-Verlag; New York: 2016. [Google Scholar]
- 52.Ordovas-Montanes J, Dwyer DF, Nyquist SK, et al. Allergic inflammatory memory in human respiratory epithelial progenitor cells. Nature 2018;560:649–54. [DOI] [PMC free article] [PubMed] [Google Scholar]
- 53.Hughes TK, Wadsworth MH, Gierahn TM, et al. Highly Efficient, Massively-Parallel Single-Cell RNA-Seq Reveals Cellular States and Molecular Features of Human Skin Pathology. bioRxiv 2019:689273. [Google Scholar]
- 54.Satija R, Farrell JA, Gennert D, et al. Spatial reconstruction of single-cell gene expression data. Nat Biotechnol 2015;33:495–502. [DOI] [PMC free article] [PubMed] [Google Scholar]
- 55.Svetnik V, Liaw A, Tong C, et al. Random forest: a classification and regression tool for compound classification and QSAR modeling. J Chem Inf Comput Sci 2003;43:1947–58. [DOI] [PubMed] [Google Scholar]
- 56.Egozcue JJ, Pawlowsky-Glahn V, Mateu-Figueras G, et al. Isometric Logratio Transformations for Compositional Data Analysis. Mathematical Geology 2003;35:279–300. [Google Scholar]
Associated Data
This section collects any data citations, data availability statements, or supplementary materials included in this article.
Supplementary Materials
Data Availability Statement
CyTOF:
All mass cytometry files (.fcs files) can be accessed through a publicly available experiment on Cytobank platform (https://premium.cytobank.org) entitled “Raw mass cytometry data from: Mitsialis et. al. Single-Cell Analyses of Colon and Blood Reveal Distinct Immune Cell Signatures of Ulcerative Colitis and Crohn’s Disease. Gastroenterology. 2020.” File names are deidentified and correlate with a metadata spreadsheet (Table S8).
scRNA-seq:
The cells-by-genes matrices generated from colonic mucosa from the five ulcerative colitis subjects included in this study can be accessed on NIH GEO (https://www.ncbi.nlm.nih.gov/geo/) with the accession number GSE150115. Associated clinical metadata for these subjects can be found in Table S8.