Abstract
Objective
To develop a reliable and fast assay to quantify the α-synuclein (α-syn)–containing extracellular vesicles (EVs) in CSF and to assess their diagnostic potential for Parkinson disease (PD).
Methods
A cross-sectional, multicenter study was designed, including 170 patients with PD and 131 healthy controls (HCs) with a similar distribution of age and sex recruited from existing center studies at the University of Washington and Oregon Health and Science University. CSF EVs carrying α-syn or aggregated α-syn were quantified using antibodies against total or aggregated α-syn, respectively, and highly specific, sensitive, and rapid assays based on the novel Apogee nanoscale flow cytometry technology.
Results
No significant differences in the number and size distribution of total EVs between patients with PD and HCs in CSF were observed. When examining the total α-syn–positive and aggregated α-syn–positive EV subpopulations, the proportions of both among all detected CSF EVs were significantly lower in patients with PD compared to HCs (p < 0.0001). While each EV subpopulation showed better diagnostic sensitivity and specificity than total CSF α-syn measured directly with an immunoassay, a combination of the 2 EV subpopulations demonstrated a diagnostic accuracy that attained clinical relevance (area under curve 0.819, sensitivity 80%, specificity 71%).
Conclusion
Using newly established, sensitive nanoscale flow cytometry assays, we have demonstrated that total α-syn–positive and aggregated α-syn–positive EVs in CSF may serve as a helpful tool in PD diagnosis.
Classification of Evidence
This study provides Class III evidence that total and aggregated α-syn–positive EVs in CSF identify patients with PD.
Parkinson disease (PD) is frequently misdiagnosed,1 particularly during early stages. Because usage of neuroimaging measurements (the most accurate markers available) is limited by relatively high cost and poor accessibility,2 simple, accurate, and reliable biochemical markers are urgently needed. α-Synuclein (α-syn), a protein whose pathologic forms (e.g., oligomers/aggregates) are critically involved in PD,3 is the leading candidate molecular biomarker for PD, but its diagnostic performance in CSF and other body fluids has been largely moderate and inconsistent.2,4-7
Extracellular vesicles (EVs), including exosomes and microvesicles, are membrane-bound vesicles important in cell-to-cell communication and signaling.8 EVs and their cargo, which include lipids, proteins (e.g., α-syn), and nucleic acids, are thought to play critical roles in normal CNS function and neurologic disorders, including PD,8,9 and have been suggested as an ideal source of biomarkers for PD and other neurodegenerative diseases.8,10
We developed novel, highly sensitive, and specific assays to quantify α-syn–containing EVs in CSF based on a new strategy utilizing Apogee nanoscale flow cytometry technology11; to our knowledge, the first such assay to examine intravesicular proteins. Unlike conventional flow cytometers, the Apogee flow cytometer allows quantification and classification of particles in the size range of EVs (∼100 nm in diameter) by light scattering.12 In this study, total or aggregated (oligomeric or fibrillar) α-syn within EVs in a small volume (60 μL) of CSF could be labeled and analyzed within 2 hours. The diagnostic potential of CSF α-syn–containing EVs was confirmed in patients with PD and healthy controls (HCs).
Methods
Study Design and Participants
This cross-sectional, multicenter study was designed to determine whether CSF α-syn–containing EVs could discriminate patients with PD from HCs (see below). Total or aggregated α-syn–containing EVs in CSF were independently assessed, and the outcome (the proportions of target EV types among all detected CSF EVs and their combinations) was independently derived by objective measurements. This study provides Class III evidence for identification of patients with PD, because the comparison to nondisease controls might introduce the risk of spectrum bias.
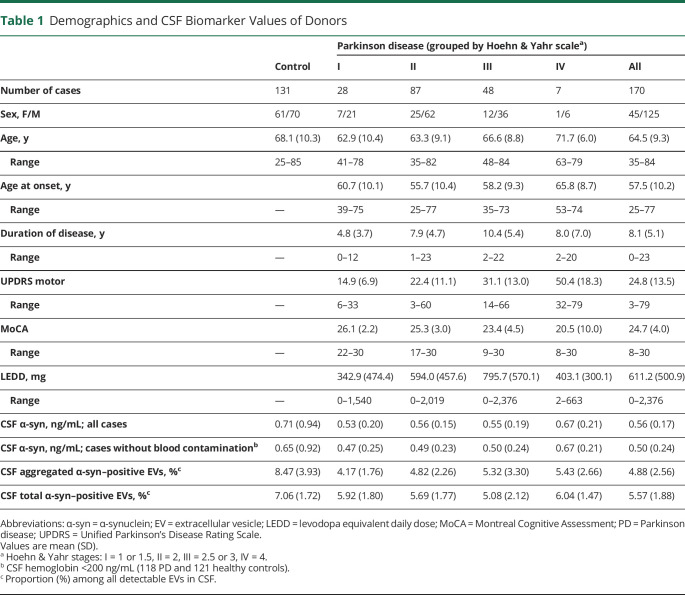
Samples were obtained from a total of 301 participants (170 patients with PD and 131 age- and sex-matched HCs [frequency matching]) (table 1) enrolled in existing studies4,10,13-15 via long-term collaborators of the Pacific Northwest Udall Center and the University of Washington (UW) Alzheimer's Disease Research Center (both located at the Veterans Affairs [VA] Puget Sound Health Care System in Seattle); 94 patients with PD and 108 HCs were from Seattle VA, and 76 patients with PD and 23 HCs were from non-Seattle VA collaborators.
Table 1.
Demographics and CSF Biomarker Values of Donors
All participants underwent extensive clinical evaluation as previously described.4,10,13-15 All patients with PD met UK PD Society Brain Bank clinical diagnostic criteria for PD16 except that having “more than one affected relative” was not considered an exclusion criterion.4,10,13-15 Patients carrying PD-related gene mutations/variants (e.g., LRRK2, GBA, or parkin) were excluded from the study. Assessments of PD included the Movement Disorder Society–sponsored version of the Unified Parkinson’s Disease Rating Scale (UPDRS), Hoehn & Yahr (H&Y) stage, and Montreal Cognitive Assessment (MoCA) adjusted for education level for cognitive impairment.17 Levodopa equivalent daily dose (LEDD) was calculated using an established formula.18 HCs had no signs or symptoms suggesting cognitive impairment or neurologic disease; all controls had a Mini-Mental State Examination score19 between 28 and 30, a Clinical Dementia Rating Scale score20 of 0, and New York University version of the Logical Memory II subscale21 paragraph recall scores (immediate and delayed) >6.4,10,13-15 Exclusion criteria for HCs also included moderate/heavy cigarette smoking (>10 packs/year), alcohol use other than socially, and any psychotherapeutic drug use (e.g., antidepressants, neuroleptics, and drugs used in the treatment of PD and related disorders or dementia). Finally, although pathologic confirmation had not been obtained in most participants, all of them had been followed for ≥12 months (median 3 years) after recruitment. Controls demonstrated no symptoms or signs of neurologic disorders, including mild cognitive impairment, and all patients with PD included in this study had sustained response to antiparkinsonism drugs and did not show any evidence to suggest an alternative diagnosis.
Clinical evaluation and CSF collection were consecutively conducted between January 2002 and May 2018. CSF EV and α-syn data were acquired in 2019.
Collection of CSF and Other Quality Controls
All CSF samples were obtained by lumbar puncture as described previously.4,10,13 Similar protocols were used to obtain all samples, including collection between 6 and 10 am, immediate freezing, use of polypropylene tubes, addition of protease inhibitor cocktail, and thawing immediately prior to the assay.13,22 For assay development, reference CSF was obtained from the clinical laboratory at Harborview Medical Center (Seattle, WA). During lumbar puncture, up to 25 mL CSF was taken from each participant, with every 5 mL pooled into one fraction before storage. The study used CSF from the first 2 fractions.
EV-depleted CSF samples for testing Apogee assay specificity were prepared using a 2-step ultracentrifugation (180,000g for 3 hours at 4°C × 2).
Human α-syn knock-in mice (FVB; 129S6-Sncatm1Nbm Tg[SNCA]1Nbm/J) and α-syn knock-out mice (B6; 129X1-Sncatm1Rosl/J) were purchased from the Jackson laboratory (Bar Harbor, ME) and kept on a 12/12-hour light/dark cycle with ad libitum food and water. Three-month-old mice were killed with carbon dioxide and decapitation for blood collection in EDTA tubes. Whole blood samples were centrifuged for 15 minutes at 1,600g (4°C) and then for 15 minutes at 3,200g (4°C) to collect platelet-poor plasma (stored at −80°C before use).
Apogee Nanoscale Cytometry Assay for CSF α-Syn–Containing EVs
Conjugation of Antibodies With Fluorescent Reagents
Zenon immunoglobulin G (IgG) labeling kits (Invitrogen/Life Technologies, Carlsbad, CA) were used to generate fluorophore-conjugated antibodies according to the manufacturer's protocol. Specifically, mouse anti-total α-syn monoclonal antibody (syn 211, Invitrogen) was labeled with the Zenon Alexa Fluor 405 mouse IgG1 labeling kit. Rabbit conformation-specific, anti–α-syn oligomer/aggregate monoclonal antibody (MJFR-14-6-4-2, Abcam, Cambridge, MA), a recently developed antibody that recognizes the conformation taken by α-syn in oligomers/aggregates,23,24 was fluorescently labeled with the Zenon Alexa Fluor 405 rabbit IgG labeling kit. Immunoglobulin isotype controls of corresponding species (mouse IgG1, Invitrogen; rabbit IgG, Abcam) were also labeled at the same final concentrations as the anti–α-syn antibodies. Another negative control (no antibody “blank”, i.e., dye only) was the use of the same volume of phosphate-buffered saline (PBS) instead of specific antibodies during the labeling reaction.
Internal (Intravesicular) Protein Labeling of CSF or Plasma EVs
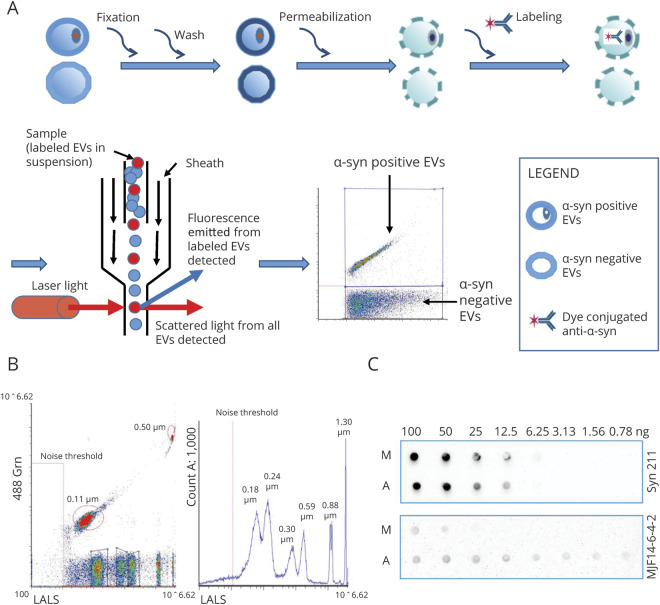
The workflow for detection of nanoparticles with intravesicular proteins is shown in figure 1A. Human CSF samples were centrifuged at 2,000g for 15 minutes and then 12,000g for 30 minutes at 4°C to remove large cell debris as described previously.25 CSF samples (60 µL/filter) were then loaded onto 100 kDa 0.5-mL Amicon Ultra Filters (Millipore, Billerica, MA) and fixed with 200 µL/filter 4% paraformaldehyde (PFA) for 0.5 hours at room temperature. After the sample solution (small molecules and water) was removed by centrifugation at 12,000g at 20°C for 3 minutes, EVs were permeabilized by addition of 200 µL/filter of 1% Triton in PBS and incubated for 0.5 hours at 25°C. The filter tubes were then centrifuged at 12,000g at 20°C for 3 minutes to remove the solution. Another 200 µL/filter of 1% Triton was added to the EVs, and centrifuged at 12,000g at 20°C for 2 minutes. EVs were collected by inverting the filter into a new collection tube and centrifuging at 2,000g (20°C) for 2 minutes; 0.2 μg of conjugated antibodies or controls (diluted in 1% Triton, 10 μL/sample) were then added to each sample and incubated for 30 minutes at 25°C in the dark for internal antigen labeling. The samples were finally diluted with 200 µL/tube of cold PBS (pH 7.4) and vortexed briefly before Apogee analysis.
Figure 1. Establishment of Apogee Nanoscale Flow Cytometry Assays to Quantify α-Synuclein (α-Syn)–Containing Extracellular Vesicles (EVs) in CSF.
(A) Apogee nanoscale flow cytometry workflow for detection of EVs with intravesicular protein labeling. The EVs in CSF are fixed with paraformaldehyde and permeabilized with Triton to expose the intravesicular antigen (α-syn) prior to staining with fluorescent dye-conjugated antibodies. With the Apogee microflow cytometry instrument, the labeled sample flows from top to bottom and is surrounded by sheath fluid. The laser intersects with the sample stream, generating 3 different light scatters (large angle light scatter [LALS], middle angle light scatter, and small angle light scatter). This unique optical design of the Apogee flow cytometer allows detection of particles down to approximately 100 nm in diameter by light scattering and provides exceptional resolution of small particle populations. The inclusion of fluorescent detection with small and wide-angle scatter enables interrogation of each particle with fluorescent antibodies, thereby bringing the advantages of traditional flow cytometry to the analysis of EVs. (B) Apogee nanoscale flow cytometer performance assessed using a reference bead mix. A typical cytogram (left) shows that all bead populations, including 2 green fluorescent (488 nm laser) polystyrene beads with diameters of 0.11 and 0.50 µm, and 6 silica beads with a refractive index similar to biological particles and diameters of 0.18, 0.24, 0.30, 0.59, 0.88, and 1.30 µm, were resolved from each other and from instrument noise. The histogram (right) shows side scattering from 0.18, 0.24, 0.30, 0.59, 0.88, and 1.30 µm silica microspheres (blue peaks) and the noise threshold limit (dotted pink line). (C) Confirmation of antibody specificity using dot blot. Serial dilutions of monomeric α-syn (M) and aggregated α-syn (A) were spotted directly onto nitrocellulose membrane. The membrane was then incubated with anti-total α-syn antibodies (syn 211; 0.5 μg/mL) or conformation-specific, antiaggregated α-syn antibodies (MJF14-6-4-2; 2.2 ng/mL), followed by horseradish peroxidase–conjugated secondary antibodies for electrochemiluminescence visualization.
Mouse plasma EVs were labeled for intravesicular α-syn similarly, except that 5 µL (per filter) of plasma were used for each experiment.
EV Analysis Using Apogee Microflow Cytometry
Apogee Micro-PLUS flow cytometer (Apogee Flow Systems, Hemel Hempstead, UK), equipped with 405 nm and 488 nm lasers, was used for measuring EV samples.
The instrument performance (sensitivity and resolution for light scattering and fluorescence) was assessed daily, using a reference bead mix (ApogeeMix, Cat# 1493, Apogee) (see typical performance in figure 1B). PBS was run as a background control. All solutions were filtered with 0.1 µm pore filters (Millipore) to reduce background, debris, and precipitates in particle analysis.
The reference beads and EV samples were run at the following high-threshold settings (minimizing background noise): the threshold numerical values for lasers 405-LALS and 405-Blue were set at 17 and 25, respectively; the numerical value and voltage for laser 405-Blue were set at 1 and 450 V, respectively. The sheath fluid pressure was set at 150 mbar and samples were introduced at a flow rate of 1.5 μL/min.
All samples were kept at 4°C and tested within 8 hours after labeling, and labeling was stable under these conditions. Clinical samples were analyzed in a single batch in 2 days, and PD and control samples were distributed across each day. Two reference CSF samples, pooled from ∼30 HCs, were added into each day's measurements to help to assess day-to-day variations (<8%).
Immunoassays for α-Syn and Hemoglobin
CSF total α-syn levels were measured by using a previously established Luminex immunoassay and CSF hemoglobin levels (an index of the degree of red blood cell contamination) were measured using a Human Hemoglobin ELISA Quantitation Kit from Bethyl Lab Inc (Montgomery, TX), as previously described.4,13,26
Nanoparticle Tracking Analysis (NTA)
For independent quantification of total EV concentrations in CSF, 400 µL pooled CSF samples (n = 10 in each pool) were analyzed using NTA with a NanoSight NS300 system with a 405 nm laser module (Malvern Instruments, Malvern, UK). CSF samples were diluted 1:2 in filtered PBS to obtain ∼50 particles in the field of view for optimal counting. A syringe pump (Malvern Instruments) equipped with a 1 mL syringe (BD insulin syringe, Franklin Lakes, NJ) was used to inject samples at the default system speed. Three separate 60-second videos of each sample were recorded in scatter mode. The cell was cleaned with PBS between samples. The videos were processed using the NTA software (version 3.3) for particle distribution and concentration. All NTA measurements were performed with identical camera and detection settings for consistency.
Dot Blot
Dot blot was used to confirm the specificity of anti–α-syn antibodies following a previously described protocol.27 Briefly, monomeric (Cat# RP-001, Proteos, Kalamazoo, MI) and aggregated α-syn (Cat# RP-002, Proteos) were spotted directly onto a nitrocellulose membrane. The membrane was incubated with primary antibodies (syn 211 for total α-syn, 0.5 μg/mL; or MJF14-6-4-2 for aggregated α-syn, 2.2 ng/mL) overnight at 4°C, followed by horseradish peroxidase–conjugated secondary antibodies (Abcam) for 0.5 hours at room temperature. Proteins were visualized by using electrochemiluminescence with a FluorChem Q instrument (Alpha Innotech, San Leandro, CA).
Statistical Analysis
All analyses were performed in SPSS 25 (IBM, Chicago, IL), Prism 8.0 (GraphPad Software, La Jolla, CA), or R 4.0.3. To minimize the effects from variable individual total CSF EV concentrations, the proportion (%) of total or aggregated α-syn–positive EVs among all EVs detected in the same CSF were used for analyses. Correlations between biomarkers are reported as Pearson correlation coefficients. Mann-Whitney U test (for 2 groups; difference in means [MD] and its standard error are indicated) or one-way analysis of variance (for 3 or more groups; effect size was estimated by using η2) was used to compare group means. As previously described,26 receiver operating characteristic (ROC) curves for analytes were generated to evaluate their sensitivities and specificities in distinguishing PD from HCs. The “optimum” cutoff value for an ROC curve was defined as the value associated with the maximal sum of sensitivity and specificity. Backward stepwise logistic regression was used to determine the best prediction models that included multiple CSF biomarkers as well as age and sex of participants.26 Bootstrapping (1,000 samples) was performed to estimate the optimistic bias of the final model with the rms package (ver 6.1-0) in R. Values with p < 0.05 were regarded as significant.
Standard Protocol Approvals, Registrations, and Patient Consents
The institutional review boards of all participating institutions approved the study and informed consent was obtained from all participants or authorized representatives. The animal study was approved by the UW Institutional Animal Care and Use Committee.
Data Availability
The anonymized data supporting the findings of this study are available from the corresponding author, upon request from qualified investigators.
Results
Development of Apogee Assays for α-Syn–Carrying EVs
CSF EVs carrying either any α-syn or specifically aggregated forms of α-syn were quantified using antibodies against total or aggregated α-syn, respectively. First, the specificities of the conformation-specific, anti–α-syn oligomer/aggregate antibody (MJF14-6-4-2) and the anti-total α-syn antibody (syn 211) were evaluated using dot blotting under nondenaturing conditions. As expected, syn 211 recognized both monomeric and aggregated α-syn, while MJF14-6-4-2 detected α-syn aggregates much more robustly than even highly concentrated monomers (50–100 ng) (figure 1C), consistent with previous reports demonstrating its specificity towards α-syn aggregates.23,24
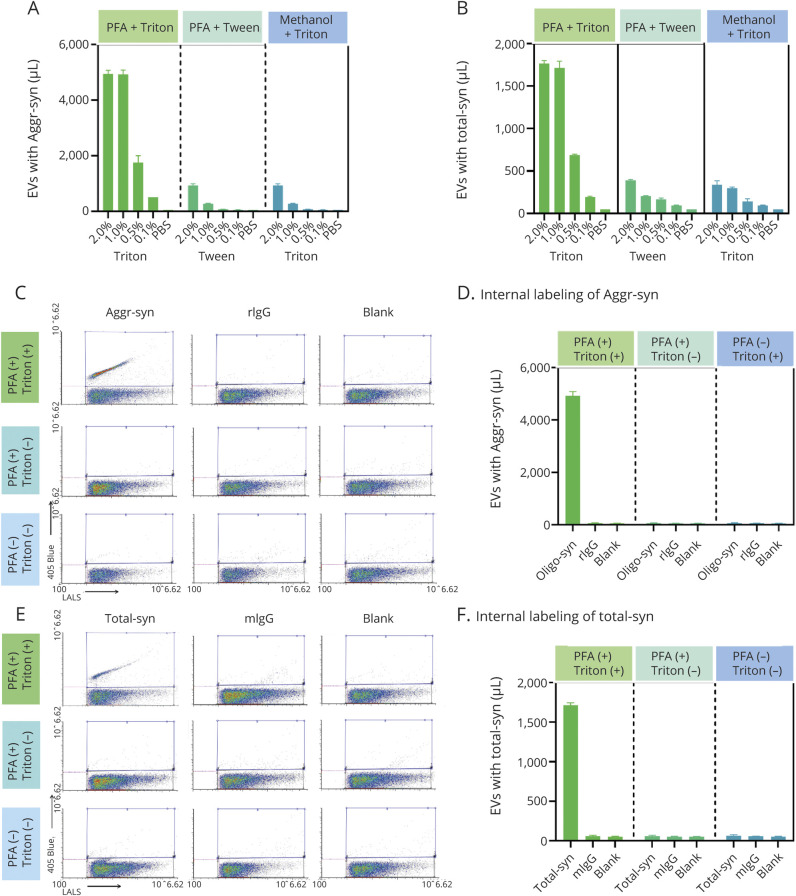
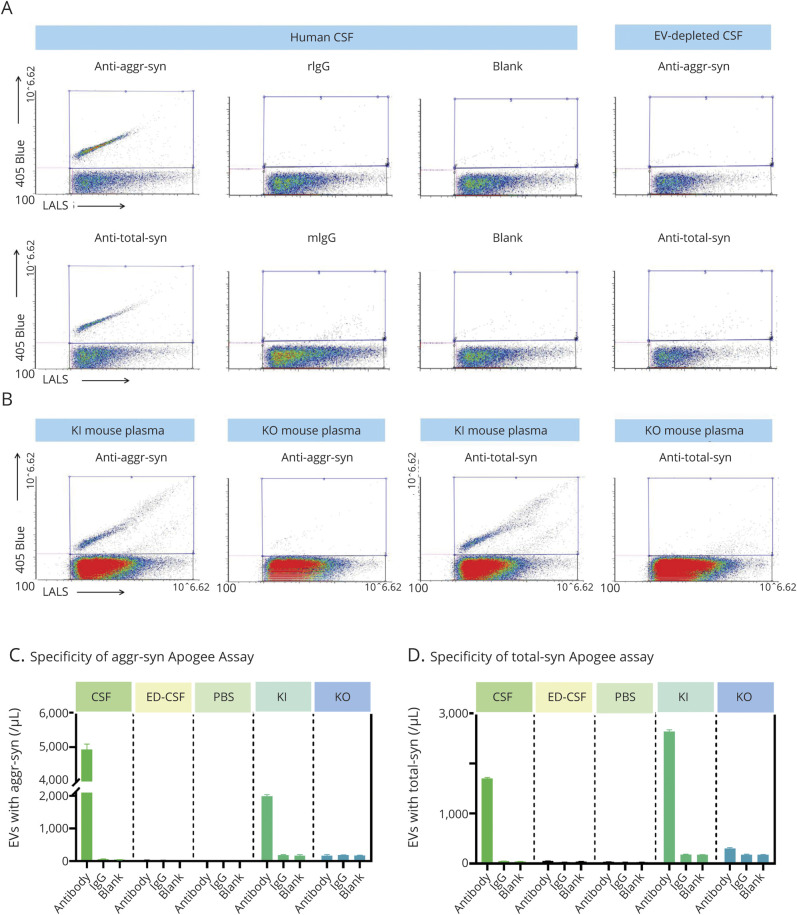
Previous studies have examined markers located on the membrane surface of EVs.28 However, to our knowledge, no previous study has attempted to categorize EVs based on cargo carried internally, without disruption/removal of the lipid membrane. To accomplish this task, sample preparation parameters, for example, fixation and permeabilization conditions, were optimized for exposure of intravesicular antigens (α-syn) (figure 2, A and B), while leaving the EV structure largely intact. Using the optimized conditions (4% PFA for fixation and 1% Triton for permeabilization), the specificity of the assays for intravesicular cargo was confirmed by the lack of signal without sample permeabilization (figure 2, C–F). In addition, α-syn–positive particle concentration of the reference CSF was compared to negative controls (samples incubated with labeled, nonspecific, isotype-matched IgG, or PBS without antibodies). The greater signal of the α-syn–positive EVs (∼5,000 events/µL for aggregated α-syn, which was 200 times greater than the PBS or IgG controls; 1,700 events/µL for total α-syn, which was 85-fold greater than the negative controls; figures 2 and 3) indicates specificity of the labeling process. The assay specificity was further confirmed using CSF with EVs depleted by ultracentrifugation (figure 3, A, C, and D) and human α-syn knock-in vs α-syn knock-out mouse plasma (figure 3, B, C, and D).
Figure 2. Optimization of Aggregated α-Synuclein (α-Syn) or Total α-Syn Apogee Nanoscale Flow Cytometry Assay System.
(A, B) For intravesicular labeling of aggregated α-syn (A) or total α-syn (B) carrying extracellular vesicles (EVs) in CSF, multiple fixation (to retain the target protein in the original vesicle location) and permeabilization (to allow the antibodies to enter) pairs were tested, including paraformaldehyde (PFA)/Triton, PFA/Tween, and methanol/Triton at different concentrations. The PFA (4%)/Triton (1%) pair demonstrated the best efficiency (positive events in CSF) and was selected for further measurements in this study. (C–F) To confirm the specificity of the intravesicular labeling and Apogee assay measurements, CSF samples with (PFA+) or without (PFA−) fixation and with (Triton+) or without (Triton−) permeabilization were tested for aggregated α-syn (C and D) or total α-syn (E and F) carrying EVs. Samples were labeled with anti-aggregated α-syn (Aggr-syn) or total α-syn (Total-syn) antibodies, or corresponding immunoglobulin G (IgG) isotype controls (rabbit IgG [rIgG] and mouse IgG [mIgG]) and no antibody “blank” as negative controls. In representative cytograms (C and E) acquired from the Apogee instrument, the x axis shows values obtained at the large angle light scatter (LALS), and the y axis shows the log fluorescence intensity measured on 405 blue laser; blue frames represent regions of interest of the target (aggregated α-syn or total α-syn). The quantitative data (EV concentrations) is shown in corresponding histograms (D and F). All measurements were acquired from at least 3 replicates, and the data are shown as mean ± SD.
Figure 3. Confirmation of the Apogee Assay Specificity for α-Synuclein (α-Syn).
(A) Specificity of Apogee nanoscale flow cytometry assays for CSF aggregated or total α-syn–positive extracellular vesicle (EV) measurements. Representative fluorescence cytograms show aggregated α-syn or total α-syn–positive events (rabbit anti-aggregated α-syn [aggr-syn] or mouse anti-total α-syn antibody labeling) in CSF, with immunoglobulin G (IgG) isotype control labeling and no antibody labeling (blank) as negative controls. The positive signal was nearly completely removed in CSF with EVs depleted using ultracentrifugation (ED-CSF). Blue frames represent regions of interest. (B) Mouse plasma samples were obtained from human α-syn knock-in (KI) or α-syn knock-out (KO) mice, labeled with aggr-syn or total α-syn antibodies, or corresponding IgG and no antibody (blank) negative controls, and analyzed with the Apogee assays for aggregated α-syn or total α-syn carrying EVs. Representative fluorescence cytograms for aggregated α-syn or total α-syn–positive events in plasma are shown. (C) The corresponding histograms demonstrate the assay specificity for aggregated α-syn–positive EVs. (D) The corresponding histograms demonstrate the assay specificity for total α-syn–positive EVs. All measurements were acquired from at least 3 replicates, and data are shown as mean ± SD. LALS = large angle light scatter; mIgG = mouse immunoglobulin G; PBS = phosphate-buffered saline; rIgG = rabbit immunoglobulin G.
The optimized assays demonstrated high accuracy (linearity of dilution) (data not shown) and reproducibility, with average within-day coefficients of variation (CVs) of 1.9%–6.9% and average day-to-day CVs of 7.1% and 6.3% for aggregated α-syn–carrying EVs and total α-syn–carrying EVs, respectively.
Characteristics of CSF EVs by NTA
The ability of CSF EVs carrying total or aggregated α-syn to distinguish PD from HCs was assessed in a cohort of 301 samples, including 170 patients with PD at different disease stages (mean H&Y stage 2.18, SD 0.68) and 131 age- and sex-matched HCs (table 1).
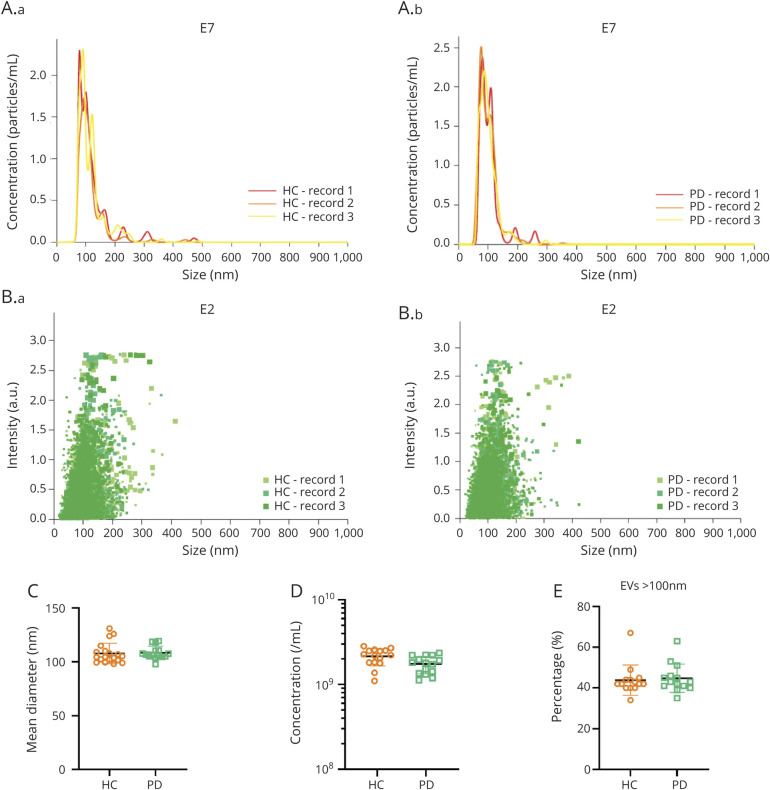
The number and size distribution of all EVs in CSF, regardless of their α-syn content, were first compared between PD and controls. Because Apogee technology only reliably detects EVs >100 nm, an independent technology, NTA, which can measure and quantify EVs to a size limit of ∼10 nm, was used for this purpose. NTA from pooled samples detected CSF EVs ranging from 20 to 500 nm (figure 4, A and B), with a major peak between 70 and 120 nm for both HC and PD CSF. Neither vesicle size nor concentration differed between PD and HC (figure 4, C and D). In addition, EVs >100 nm contributed an average of 43.9% in HC and 44.8% in PD among all detected EVs, with no significant difference between the groups (p = 0.595, Mann-Whitney) (figure 4E).
Figure 4. Nanoparticle Tracking Analysis (NTA) of CSF Extracellular Vesicles (EVs) in Patients With Parkinson Disease (PD) and Healthy Controls (HCs).
Pooled CSF samples (n = 10 in each pool) from the same cohort for Apogee analyses were analyzed using NTA. (A, B) Representative NTA data demonstrating the concentrations (A) and intensity (B) of EVs in CSF from patients with PD and healthy controls (HCs). (C–E) Comparisons of EV size (C), EV concentration (D), and the proportions of larger EVs (>100 nm) among all detected CSF EVs between patients with PD and HCs. The mean sizes for EVs in CSF were 107.9 ± 9.57 and 108.5 ± 6.05 nm, and the mean concentrations of EVs in CSF were 2.15 ± 1.27 × 10⁹ and 1.94 ± 1.06 × 10⁹ particles/mL for HC and PD, respectively.
α-Syn–Carrying EVs in PD and Control CSF
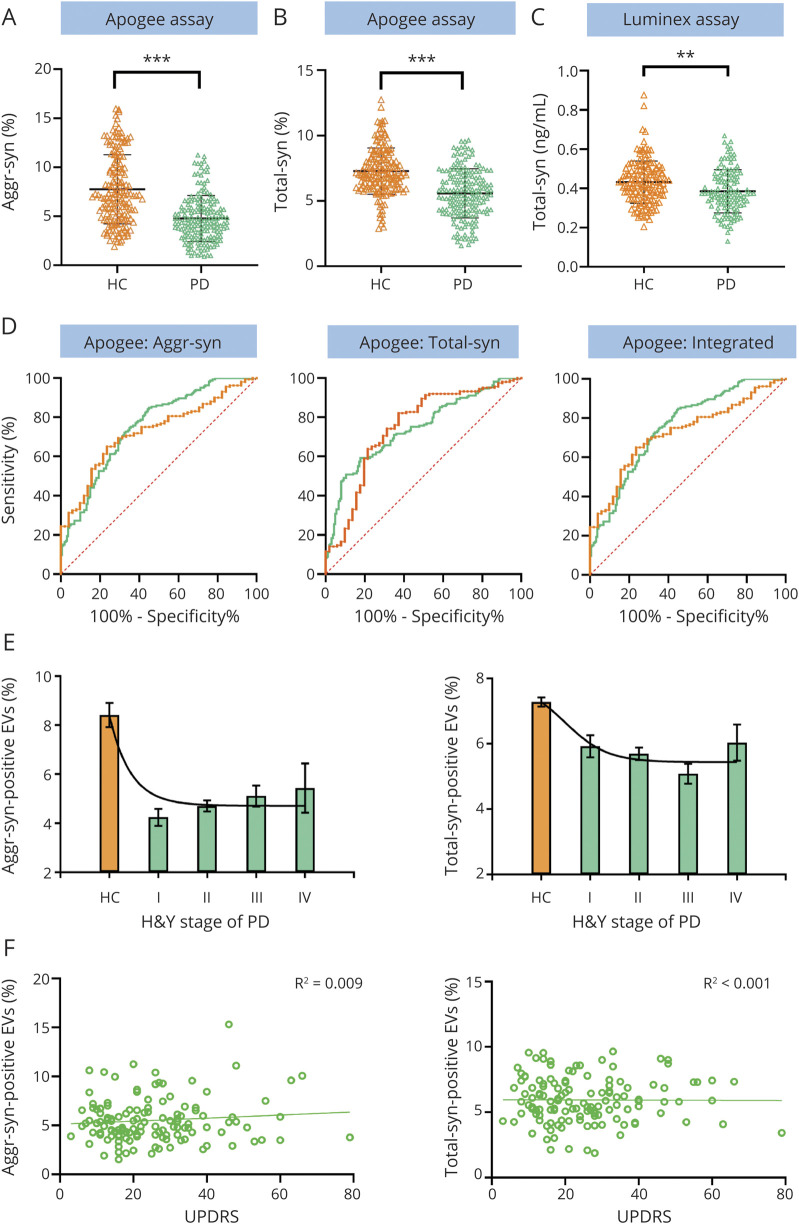
The ability of the optimized Apogee assays to distinguish PD from HC was then assessed in individual CSF samples (table 1). Levels of both total and aggregated α-syn–positive EVs were lower in patients with PD than in controls (MD −3.59 ± 0.40, p << 0.001 for aggregated α-syn+, and MD −1.49 ± 0.21, p << 0.001 for total α-syn + EVs, Mann-Whitney) (figure 5, A and B, respectively). No site differences (Seattle VA vs non-Seattle VA) were observed in total α-syn+ and aggregated α-syn+ EVs from patients with PD or HCs (p > 0.05). Further, neither correlated with age, sex, age at disease onset, LEDD, CSF hemoglobin levels, or CSF total α-syn levels measured by Luminex (all p values > 0.05) (data not shown). Decreased CSF total α-syn protein level in patients with PD compared to HCs (MD −0.16 ± 0.09, p = 0.008, Mann-Whitney) validated our previous study4 with less significance than α-syn–positive EVs (figure 5C).
Figure 5. Cross-Sectional Examination of CSF Aggregated or Total α-Synuclein (α-Syn)–Containing Extracellular Vesicle (EV) Concentrations and Total α-Synuclein Protein Concentrations.
(A, B) Quantitative Apogee nanoscale flow cytometry analysis of CSF aggregated α-syn (A) or total α-syn (B) positive EV levels in patients with Parkinson disease (PD) (n = 170) and healthy controls (HCs) (n = 131). The proportions of total or aggregated α-syn–positive EVs among all EVs detected in CSF were used for analysis. ***p < 0.0001. (C) Quantitative Luminex analysis of CSF total α-syn protein levels in PD (n = 118) and HC (n = 121) after elimination of blood contaminated samples (200 ng/mL hemoglobin was used as a cutoff). **p < 0.001. (D) Receiver operating characteristic curves to evaluate the CSF aggregated α-syn or total α-syn–positive EVs for PD diagnosis (170 patients with PD vs 131 HCs) or early PD diagnosis (51 patients with PD with disease duration of <5 years vs 131 HCs). An integrative model generated by logistic regression combination of both aggregated α-syn (aggr-syn) and total α-syn–positive EVs was also evaluated. The AUCs for all patients with PD vs HCs and early patients with PD vs HCs were 0.785 and 0.770, respectively, for aggregated α-syn–positive EVs, 0.754 and 0.756 for total α-syn–positive EVs, and 0.819 and 0.808 for the integrative model (see also table 2). By comparison, the areas under curve for CSF total α-syn levels measured by Luminex were 0.604 for all patients with PD and 0.712 for early patients with PD, respectively (after excluding blood contaminated samples) (not shown). Green lines, all patients with PD vs HCs; orange lines, patients with early PD vs HCs. (E) Comparisons of CSF aggregated α-syn–carrying EV and total α-syn–carrying EV levels in PD at different disease stages (indexed by Hoehn & Yahr [H&Y] scales) and HCs. (F) Associations of CSF aggregated α-syn–carrying EV and total α-syn–carrying EV levels with the severity of motor symptoms (Unified Parkinson’s Disease Rating Scale [UPDRS] motor scores) in PD.
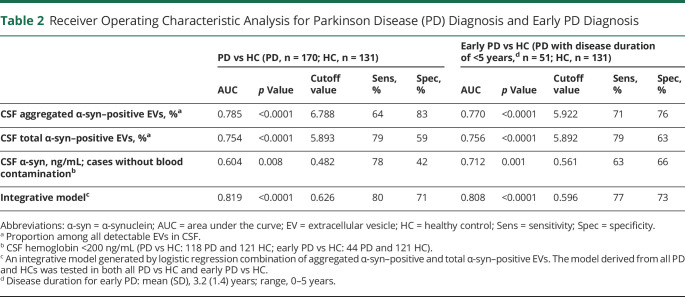
We further evaluated the performance of α-syn–positive EVs in discriminating PD from HCs using ROC analyses. The sensitivity and specificity using aggregated- and total-α-syn–positive EVs were 64% and 83% (area under curve [AUC] 0.785, 95% confidence interval [CI] 0.73–0.84) and 79% and 59% (AUC 0.754, 95% CI 0.70–0.81), respectively (figure 5D). Further, stepwise logistic analysis was conducted to select the best predictors; aggregated-α-syn–positive and total α-syn–positive EVs were algorithmically selected as major influencing factors for PD diagnosis. An integrated logistic regression model based on these parameters was then established, which discriminated PD from HCs with an AUC of 0.819 (95% CI 0.78–0.87), sensitivity of 80%, and specificity of 71% (figure 5D). Bootstrap resampling indicated minimal optimistic bias in estimates of model performance (e.g., bias in AUC was ∼0.002).
To evaluate whether CSF α-syn–carrying EVs have the potential to aid in early PD diagnosis, which is often difficult in clinical practice, we performed ROC analyses after restricting the PD cases to have a disease duration of <5 years (n = 51 after restriction). The sensitivity and specificity for distinguishing early PD from HC using aggregated and total-α-syn–positive EVs were 71% and 76% (AUC 0.770, 95% CI 0.70–0.84), and 79% and 63% (AUC 0.756, 95% CI 0.67–0.84), respectively, similar to the values acquired for all patients with PD vs HCs in this cohort (figure 5D and table 2). The integrative model of both aggregated and total-α-syn–positive EVs discriminated patients with early PD from HCs with an AUC of 0.808 (95% CI 0.74–0.88, sensitivity 77%, specificity 73%) (figure 5D and table 2).
Table 2.
Receiver Operating Characteristic Analysis for Parkinson Disease (PD) Diagnosis and Early PD Diagnosis
The associations between CSF total or aggregated α-syn–positive EVs and disease severity were evaluated. The levels of total or aggregated α-syn–positive EVs were lower in all PD groups at different disease stages based on their H&Y scores compared to HCs, but neither were significantly different among different PD groups (η2 = 0.045, p = 0.41 for total α-syn, and η2 = 0.036, p = 0.86 for aggregated α-syn, analysis of variance; figure 5E). Levels of CSF α-syn–positive EVs were not associated with UPDRS motor scores or disease duration of the patients with PD (p values > 0.05; figure 5F). Furthermore, no correlation between the CSF α-syn–positive EV levels and the cognitive status approximated by MoCA scores in PD was found (R2 = 0.004, p = 0.46 for aggregated α-syn; R2 = 0.004, p = 0.87 for total α-syn) (data not shown).
Discussion
Immunoassay measures of α-syn in body fluids as PD biomarkers have been largely disappointing,2,4-6 with the possible exception of aggregated α-syn measured by protein-misfolding cyclic amplification (PMCA) or real-time quaking-induced conversion (RT-QuIC).7 PMCA and RT-QuIC assess the amount of CSF α-syn oligomers/aggregates (“seeds”) that can promote synthetic α-syn monomers to aggregate in vitro and have demonstrated high sensitivity and specificity to differentiate PD from HC.7 Measuring CSF aggregated α-syn–carrying EVs in our study also showed promising results, suggesting the potential of α-syn oligomers/aggregates, which may represent more pathologically relevant disease isoforms, as PD biomarkers. Unlike PMCA and RT-QuIC, which may require days to complete, our novel assay rapidly quantifies CSF α-syn–carrying EVs and shows potential in PD diagnosis. Measured using advanced nanoscale flow cytometry, the concentrations of both aggregated and total α-syn–positive EVs in CSF displayed relatively high sensitivity and specificity for the discrimination of PD or even early PD (disease duration <5 years) and HCs, which is an important first step in the biomarker field for PD and related disorders. Further, neither neuroimaging nor CSF α-syn PMCA or RT-QuIC measures reliably differentiates PD from other parkinsonian disorders,2,7 and the usefulness of our Apogee assays in the urgently needed differential diagnosis of PD should be examined.
Our robust Apogee assay improves on other α-syn assays by analyzing individual EVs and their cargo in a rapid, sensitive, and accurate manner. The presence of α-syn in EVs from human CSF and other body fluids has been confirmed by mass spectrometry,10,29 but the lack of efficient methods to isolate pure EVs and difficulty in quantifying cargo proteins8 have limited their usefulness. For example, previous studies of α-syn in EVs9,10 depended on first isolating the EVs, then quantifying the total protein released upon their lysis, a process that necessarily leads to ambiguity between an alteration in the number of α-syn–carrying EVs vs a change in the amount of α-syn carried by each EV. Early studies directly analyzing CSF EVs generated promising results,9,28 but were also limited by the technologies and methodologies used. In this study, we developed assays to quantify intact, α-syn–carrying EVs in CSF based on Apogee nanoscale flow cytometry technology. Several technical advantages of the methodology are apparent: (1) Apogee technology allows detection of particles as small as approximately 100 nm by light scattering, and the inclusion of sensitive fluorescent detection further enables the high-throughput and multiparametric characterization of small EVs. Moreover, among similar technologies, the Apogee technology is one of the most accurate in determining the size of vesicles, making it highly applicable to clinical research.30,31 (2) The assays developed in this study provide rapid (<2 hours staining protocol) and sensitive readouts directly from small volumes of CSF or plasma, without requiring extensive sample processing that is typically necessary for most other EV-based assays, and are thus suitable for direct clinical applicability. (3) To our knowledge, our Apogee assay is the first assay to examine intravesicular proteins in individual EVs. As shown in this study, targeting disease-related proteins or other EV cargos beyond the EV surface has the potential to expand the EV-based biomarker discovery significantly.
Limitations of Apogee technology may prevent detection of EVs smaller than 100 nm.30 Based on NTA, approximately 50% of EVs in CSF were <100 nm, though there were no significant differences in EV size distribution and concentrations between PD and controls (figure 4). Although NTA may provide size distribution profiles and concentration measurements for these smaller EVs, it faces several limitations when used for examining particles in biofluids.8 In particular, simultaneous measurements of scatter and fluorescence or multiple fluorescent signals are unavailable. Therefore, new technologies are required for future studies to examine smaller EVs.
Using advanced Apogee flow cytometry, we provided the first comprehensive analysis and quantification of α-syn–positive EVs in CSF from patients with PD and HCs. A novel finding is that both aggregated and total α-syn–positive EV levels in CSF are much lower in patients with PD as compared to controls. An early study9 demonstrated differing concentrations of CSF “total” EVs between diagnostic groups using NTA (higher in PD as compared to dementia with Lewy bodies [DLB], polyneuropathy, and progressive supranuclear palsy), but HCs were not included in the comparison. In the same study, the authors also examined α-syn concentrations in CSF “exosomes”/EVs (prepared using ultracentrifugation, which generates mixed preparations containing many different types of EVs and even larger free protein aggregates8,32) using an immunoassay, and reported slightly but significantly lower CSF “exosomal” α-syn in PD compared to HCs in one cohort, and even lower levels in DLB as compared to PD in another cohort (no HCs were included in the second cohort).9 Although these results in lysed EVs appear to be in line with ours on CSF α-syn–positive EVs, further studies are needed to confirm whether CSF EV levels, α-syn levels contained in each EV, or both are changed in PD.
It is unclear why the concentrations of α-syn–carrying EVs in CSF were lower in patients with PD compared to HCs. Previous reports demonstrated lower CSF “total” α-syn in patients with PD compared to controls,4,5,13,33,34 which has been hypothesized to reflect sequestration of α-syn in brain (within Lewy bodies and neurites). The decrease of α-syn–carrying EVs might also be a result of low availability of α-syn in CSF. However, as better discrimination between patients and controls could be achieved by analyzing CSF α-syn–carrying EVs compared to CSF total α-syn, other contributors might play more significant roles. For example, because EVs are believed to be critically involved in toxic protein (e.g., α-syn and its toxic forms) disposal from cells,8,35 decreased α-syn–positive EVs may reflect dysfunction in the clearance mechanisms. Alternatively, increased efflux of α-syn from the brain into peripheral blood in PD, as implied in some recent studies,10 might also contribute to the decreased α-syn–positive EV levels in CSF.
The present study failed to show associations between CSF α-syn–positive EV levels and PD severity. Because focusing on cases at early stages (disease duration <5 years) in ROC analyses did not affect discrimination values substantially, these EV markers might change early and then stay at stable levels during the disease course (i.e., a floor effect), though longitudinal confirmation is needed. Nonetheless, the study cohort lacked de novo and advanced (e.g., H&Y 5) cases. Further studies with a wider spectrum of disease stages, including prodromal stages, and a longitudinal cohort are required to systematically evaluate whether CSF α-syn–carrying EV levels are changed with disease severity and progression and whether they could aid in earlier diagnosis. Moreover, additional disease-related proteins in EVs (e.g., tau15) can be investigated to improve the diagnostic and prognostic performance. Another potential limitation of the study is that pathologic confirmation had not been obtained in most participants. Although the study participants had been followed for a median of 3 years following recruitment (and longer following diagnosis) without changing diagnosis, the results need to be validated in future studies. Longer follow-up periods, use of neuroimaging and other tools for participant selection, and inclusion of disease controls (patients with PD-related disorders) will be considered to further minimize the possibility of including presymptomatic PD/parkinsonism in the controls or including other related diseases in the PD group. The integrative models proposed in this study need to be validated in independent cohorts in future studies, as the approach might overtrain the models to the data. Finally, it would be interesting to compare biomarker profiles of patients with idiopathic PD and those of patients carrying known PD-related gene mutations/variants (e.g., LRRK2, GBA, or parkin).
In this study, we provide the first comprehensive analysis and quantification of CSF α-syn–positive EVs using advanced nanoscale flow cytometry. A combination of total and aggregated α-syn–positive EV subpopulations demonstrated diagnostic accuracy that attained clinical relevance. If the performance on PD diagnosis and differential diagnosis can be improved/confirmed and validated in further independent studies, our assay could be useful to improve diagnostic accuracy of PD in clinical practice and to increase power and reduce costs in clinical trials by lowering the misclassification rate during participant recruitment.
Acknowledgment
The authors thank Dr. Kathleen Kerr for help with the bootstrapping analysis and the participants who donated their CSF for this study.
Glossary
- α-syn
α-synuclein
- AUC
area under the curve
- CI
confidence interval
- CV
coefficient of variation
- DLB
dementia with Lewy bodies
- EV
extracellular vesicle
- H&Y
Hoehn & Yahr
- HC
healthy control
- IgG
immunoglobulin G
- LEDD
levodopa equivalent daily dose
- MD
difference in means
- MoCA
Montreal Cognitive Assessment
- NTA
Nanoparticle Tracking Analysis
- PBS
phosphate-buffered saline
- PD
Parkinson disease
- PFA
paraformaldehyde
- PMCA
protein-misfolding cyclic amplification
- ROC
receiver operating characteristic
- RT-QuIC
real-time quaking-induced conversion
- UPDRS
Unified Parkinson’s Disease Rating Scale
- UW
University of Washington
- VA
Veterans Affairs
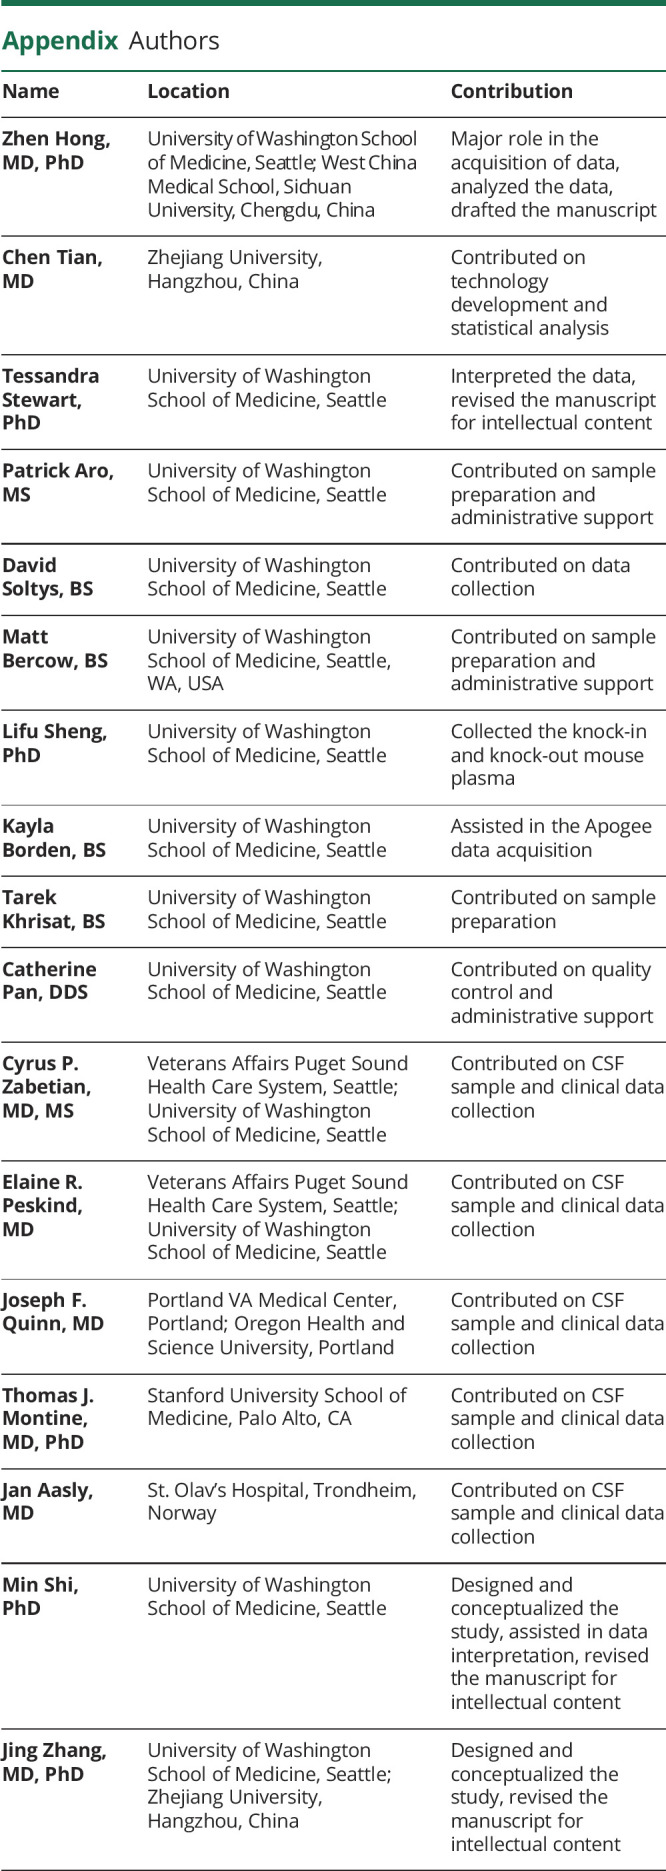
Appendix. Authors
Footnotes
Class of Evidence: NPub.org/coe
Study Funding
This study was supported by the NIH (U01 NS091272, R01 AG056711, and R21 NS104511 to J.Z. and M.S., R21/R33 MH118160 to J.Z. and T.S., R01 AG061383 and RF1 AG068406 to M.S., and P50 NS062684 to T.J.M. and C.P.Z.) and with resources and the use of facilities at the Veterans Affairs Puget Sound and Veterans Affairs Portland Health Care Systems. The content is solely the responsibility of the authors and does not necessarily represent the official views of the sponsors. The sponsors of this study had no role in the study design, data collection, analysis and interpretation, or the writing of the report. The authors had full access to all the data in the study and had final responsibility for the decision to submit for publication.
Disclosure
The authors report no disclosures relevant to the manuscript. Go to Neurology.org/Nhttps://n.neurology.org/lookup/doi/10.1212/WNL.0000000000011853 for full disclosures.
References
- 1.Marti MJ, Tolosa E. Parkinson disease: new guidelines for diagnosis of Parkinson disease. Nat Rev Neurol 2013;9:190–191. [DOI] [PubMed] [Google Scholar]
- 2.Schapira AH. Recent developments in biomarkers in Parkinson disease. Curr Opin Neurol 2013;26:395–400. [DOI] [PMC free article] [PubMed] [Google Scholar]
- 3.Shulman JM, De Jager PL, Feany MB. Parkinson's disease: genetics and pathogenesis. Annu Rev Pathol 2011;6:193–222. [DOI] [PubMed] [Google Scholar]
- 4.Hong Z, Shi M, Chung KA, et al. DJ-1 and alpha-synuclein in human cerebrospinal fluid as biomarkers of Parkinson's disease. Brain 2010;133:713–726. [DOI] [PMC free article] [PubMed] [Google Scholar]
- 5.Kang JH, Mollenhauer B, Coffey CS, et al. CSF biomarkers associated with disease heterogeneity in early Parkinson's disease: the Parkinson's Progression Markers Initiative study. Acta Neuropathol 2016;131:935–949. [DOI] [PMC free article] [PubMed] [Google Scholar]
- 6.Majbour NK, Vaikath NN, van Dijk KD, et al. Oligomeric and phosphorylated alpha-synuclein as potential CSF biomarkers for Parkinson's disease. Mol Neurodegener 2016;11:7. [DOI] [PMC free article] [PubMed] [Google Scholar]
- 7.Kang UJ, Boehme AK, Fairfoul G, et al. Comparative study of cerebrospinal fluid alpha-synuclein seeding aggregation assays for diagnosis of Parkinson's disease. Mov Disord 2019;34:536–544. [DOI] [PMC free article] [PubMed] [Google Scholar]
- 8.Shi M, Sheng L, Stewart T, Zabetian CP, Zhang J. New windows into the brain: central nervous system-derived extracellular vesicles in blood. Prog Neurobiol 2019;175:96–106. [DOI] [PMC free article] [PubMed] [Google Scholar]
- 9.Stuendl A, Kunadt M, Kruse N, et al. Induction of alpha-synuclein aggregate formation by CSF exosomes from patients with Parkinson's disease and dementia with Lewy bodies. Brain 2016;139:481–494. [DOI] [PMC free article] [PubMed] [Google Scholar]
- 10.Shi M, Liu C, Cook TJ, et al. Plasma exosomal alpha-synuclein is likely CNS-derived and increased in Parkinson's disease. Acta Neuropathol 2014;128:639–650. [DOI] [PMC free article] [PubMed] [Google Scholar]
- 11.Kibria G, Ramos EK, Lee KE, et al. A rapid, automated surface protein profiling of single circulating exosomes in human blood. SciRep 2016;6:36502. [DOI] [PMC free article] [PubMed] [Google Scholar]
- 12.Allory Y, Audard V, Fontanges P, Ronco P, Debiec H. The L1 cell adhesion molecule is a potential biomarker of human distal nephron injury in acute tubular necrosis. Kidney Int 2008;73:751–758. [DOI] [PubMed] [Google Scholar]
- 13.Shi M, Bradner J, Hancock AM, et al. Cerebrospinal fluid biomarkers for Parkinson disease diagnosis and progression. Ann Neurol 2011;69:570–580. [DOI] [PMC free article] [PubMed] [Google Scholar]
- 14.Mata IF, Shi M, Agarwal P, et al. SNCA variant associated with Parkinson disease and plasma alpha-synuclein level. Arch Neurol 2010;67:1350–1356. [DOI] [PMC free article] [PubMed] [Google Scholar]
- 15.Shi M, Kovac A, Korff A, et al. CNS tau efflux via exosomes is likely increased in Parkinson's disease but not in Alzheimer's disease. Alzheimers Demen 2016;12:1125–1131. [DOI] [PMC free article] [PubMed] [Google Scholar]
- 16.Hughes AJ, Daniel SE, Lees AJ. Improved accuracy of clinical diagnosis of Lewy body Parkinson's disease. Neurology 2001;57:1497–1499. [DOI] [PubMed] [Google Scholar]
- 17.Emre M, Aarsland D, Brown R, et al. Clinical diagnostic criteria for dementia associated with Parkinson's disease. Mov Disord 2007;22:1689–1707. quiz 1837. [DOI] [PubMed] [Google Scholar]
- 18.Tomlinson CL, Stowe R, Patel S, Rick C, Gray R, Clarke CE. Systematic review of levodopa dose equivalency reporting in Parkinson's disease. Mov Disord 2010;25:2649–2653. [DOI] [PubMed] [Google Scholar]
- 19.Folstein MF, Folstein SE, McHugh PR. Mini-mental state: a practical method for grading the cognitive state of patients for the clinician. J Psychiatr Res 1975;12:189–198. [DOI] [PubMed] [Google Scholar]
- 20.Morris JC. Clinical dementia rating: a reliable and valid diagnostic and staging measure for dementia of the Alzheimer type. Int Psychogeriatr 1997;9:173–176. discussion 177-178. [DOI] [PubMed] [Google Scholar]
- 21.Flicker C, Ferris SH, Reisberg B. Mild cognitive impairment in the elderly: predictors of dementia. Neurology 1991;41:1006–1009. [DOI] [PubMed] [Google Scholar]
- 22.Stewart T, Sossi V, Aasly JO, et al. Phosphorylated alpha-synuclein in Parkinson's disease: correlation depends on disease severity. Acta Neuropathol Commun 2015;3. [DOI] [PMC free article] [PubMed] [Google Scholar]
- 23.Lassen LB, Gregersen E, Isager AK, Betzer C, Kofoed RH, Jensen PH. ELISA method to detect alpha-synuclein oligomers in cell and animal models. PloS One 2018;13:e0196056. [DOI] [PMC free article] [PubMed] [Google Scholar]
- 24.Tian C, Liu G, Gao L, et al. Erythrocytic alpha-synuclein as a potential biomarker for Parkinson's disease. Transl Neurodegener 2019;8:15. [DOI] [PMC free article] [PubMed] [Google Scholar]
- 25.Thery C, Amigorena S, Raposo G, Clayton A. Isolation and characterization of exosomes from cell culture supernatants and biological fluids. Curr Protoc Cel Biol 2006;Chapter 3:Unit 3 22. [DOI] [PubMed] [Google Scholar]
- 26.Shi M, Tang L, Toledo JB, et al. Cerebrospinal fluid alpha-synuclein contributes to the differential diagnosis of Alzheimer's disease. Alzheimers Dement 2018;14:1052–1062. [DOI] [PMC free article] [PubMed] [Google Scholar]
- 27.Sheng L, Stewart T, Yang D, et al. Erythrocytic α-synuclein contained in microvesicles regulates astrocytic glutamate homeostasis: a new perspective on Parkinson's disease pathogenesis. Acta Neuropathol Commun 2020;8:102. [DOI] [PMC free article] [PubMed] [Google Scholar]
- 28.Yang Y, Keene CD, Peskind ER, et al. Cerebrospinal fluid particles in Alzheimer disease and Parkinson disease. J Neuropathol Exp Neurol 2015;74:672–687. [DOI] [PMC free article] [PubMed] [Google Scholar]
- 29.Guha D, Lorenz DR, Misra V, Chettimada S, Morgello S, Gabuzda D. Proteomic analysis of cerebrospinal fluid extracellular vesicles reveals synaptic injury, inflammation, and stress response markers in HIV patients with cognitive impairment. J Neuroinflamm 2019;16:254. [DOI] [PMC free article] [PubMed] [Google Scholar]
- 30.van der Pol E, Coumans FA, Grootemaat AE, et al. Particle size distribution of exosomes and microvesicles determined by transmission electron microscopy, flow cytometry, nanoparticle tracking analysis, and resistive pulse sensing. J Thromb Haemost 2014;12:1182–1192. [DOI] [PubMed] [Google Scholar]
- 31.van der Pol E, Hoekstra AG, Sturk A, Otto C, van Leeuwen TG, Nieuwland R. Optical and non-optical methods for detection and characterization of microparticles and exosomes. J Thromb Haemost 2010;8:2596–2607. [DOI] [PubMed] [Google Scholar]
- 32.Xu R, Greening DW, Zhu HJ, Takahashi N, Simpson RJ. Extracellular vesicle isolation and characterization: toward clinical application. J Clin Invest 2016;126:1152–1162. [DOI] [PMC free article] [PubMed] [Google Scholar]
- 33.Mollenhauer B, Locascio JJ, Schulz-Schaeffer W, Sixel-Döring F, Trenkwalder C, Schlossmacher MG. alpha-Synuclein and tau concentrations in cerebrospinal fluid of patients presenting with parkinsonism: a cohort study. Lancet Neurol 2011;10:230–240. [DOI] [PubMed] [Google Scholar]
- 34.Hall S, Ohrfelt A, Constantinescu R, et al. Accuracy of a panel of 5 cerebrospinal fluid biomarkers in the differential diagnosis of patients with dementia and/or parkinsonian disorders. Arch Neurol 2012;69:1445–1452. [DOI] [PubMed] [Google Scholar]
- 35.Thompson AG, Gray E, Heman-Ackah SM, et al. Extracellular vesicles in neurodegenerative disease: pathogenesis to biomarkers. Nat Rev Neurol 2016;12:346–357. [DOI] [PubMed] [Google Scholar]
Associated Data
This section collects any data citations, data availability statements, or supplementary materials included in this article.
Data Availability Statement
The anonymized data supporting the findings of this study are available from the corresponding author, upon request from qualified investigators.


