

Abstract
Objective
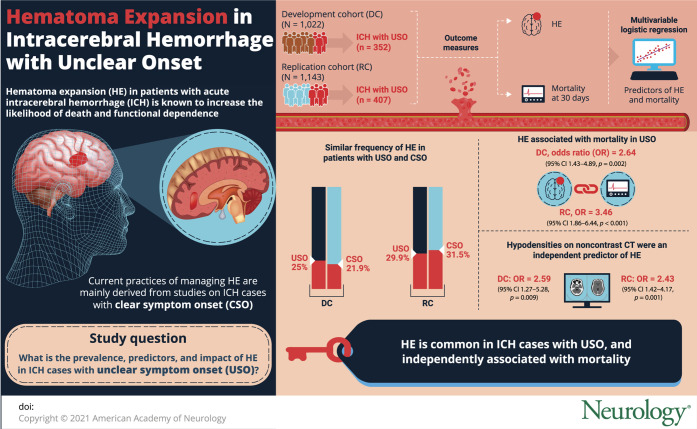
To investigate the prevalence, predictors, and prognostic effect of hematoma expansion (HE) in patients with intracerebral hemorrhage (ICH) with unclear symptom onset (USO).
Methods
We performed a retrospective analysis of patients with primary spontaneous ICH admitted at 5 academic medical centers in the United States and Italy. HE (volume increase >6 mL or >33% from baseline to follow-up noncontrast CT [NCCT]) and mortality at 30 days were the outcomes of interest. Baseline NCCT was also analyzed for presence of hypodensities (any hypodense region within the hematoma margins). Predictors of HE and mortality were explored with multivariable logistic regression.
Results
We enrolled 2,165 participants, 1,022 in the development cohort and 1,143 in the replication cohort, of whom 352 (34.4%) and 407 (35.6%) had ICH with USO, respectively. When compared with participants having a clear symptom onset, patients with USO had a similar frequency of HE (25.0% vs 21.9%, p = 0.269 and 29.9% vs 31.5%, p = 0.423). Among patients with USO, HE was independently associated with mortality after adjustment for confounders (odds ratio [OR] 2.64, 95% confidence interval [CI] 1.43–4.89, p = 0.002). This finding was similar in the replication cohort (OR 3.46, 95% CI 1.86–6.44, p < 0.001). The presence of NCCT hypodensities in patients with USO was an independent predictor of HE in the development (OR 2.59, 95% CI 1.27–5.28, p = 0.009) and replication (OR 2.43, 95% CI 1.42–4.17, p = 0.001) population.
Conclusion
HE is common in patients with USO and independently associated with worse outcome. These findings suggest that patients with USO may be enrolled in clinical trials of medical treatments targeting HE.
Hematoma expansion (HE) is common in patients with acute intracerebral hemorrhage (ICH) and even small amounts of hematoma growth increase the likelihood of death and functional dependence.1 Being potentially preventable and independently associated with unfavorable outcome, HE represents a plausible therapeutic target.2 Active bleeding leading to hematoma enlargement typically occurs early in the natural history of ICH, as confirmed by the observation that shorter time from symptom onset to ICH diagnosis strongly predicts HE.3 Furthermore, medical treatments targeting HE such as intensive systolic blood pressure (SBP) reduction and coagulopathy reversal are likely to be most effective when administered very soon after ICH onset.4,5 Therefore, known time of symptom onset and hospital presentation within few hours are typical inclusion criteria for the majority of clinical trials targeting HE.6-8 Patients with ICH with unclear time of symptom onset (USO) are underrepresented in clinical trials and observational studies on HE. Furthermore, most of the imaging predictors and tools to stratify the risk of HE have been described and validated only in patients with ICH with a clear onset of symptoms.9,10 Preliminary evidence from a retrospective single-center study suggested that more than one-third of patients with ICH present with USO but the significance of HE in this population remains unknown.11 We aimed to characterize the frequency, predictors, and prognostic effect of HE in patients with ICH with USO.
Methods
Standard Protocol Approvals, Registrations, and Patient Consents
The Institutional review boards and ethical committees of each participating center approved all the study procedures. Written informed consent was obtained by patients or family members or waived by the institutional review board.
Patient Selection
To answer the research question of this study, predictors of HE and outcome in patients with USO were explored in a single center population of patients with ICH (development cohort). In order to assess the generalizability and external validity of our findings, all the analyses were repeated in an independent multicenter population (replication cohort).12,13
Participants included in the development cohort were retrospectively selected from a single prospectively collected cohort of patients with primary spontaneous ICH (Massachusetts General Hospital, Boston; patients admitted from 1994 to 2015). Participants included in the replication cohort were retrospectively selected from the pool of patients with primary spontaneous ICH admitted at the following 4 academic stroke centers: (1) Spedali Civili, Brescia, Italy (patients admitted from 2008 to 2019); (2) Arcispedale S. Anna, Ferrara, Italy (patients admitted from 2010 to 2019); (3) IRCCS Mondino Foundation, Pavia, Italy (patients admitted from 2017 to 2019); and (4) IRCCS Istituto di Scienze Neurologiche di Bologna, Italy (patients admitted from 2015 to 2019).
For the present study, we applied the following main inclusion criteria: (1) diagnosis of primary spontaneous ICH; (2) age ≥18; (3) availability of baseline and follow-up noncontrast CT (NCCT) images; and (4) for patients with USO, inclusion was restricted to those receiving a baseline NCCT within 48 hours from time last seen well (LSW). ICH cases associated with anticoagulant treatment were also included. We excluded patients with any of the following conditions: (1) traumatic intracranial bleeding; (2) vascular malformation, tumor, or any other intracranial lesion known or presumed to be cause of secondary ICH; (3) isolated primary intraventricular hemorrhage (IVH); (4) missing NCCT images; (5) hematoma evacuation before follow-up NCCT; (6) hemorrhagic conversion of ischemic brain lesion; or (7) presence of multiple ICH. The figure illustrates the study population selection flowchart.
Figure. Population Selection Flowchart.

ICH = intracerebral hemorrhage; IVH = intraventricular hemorrhage; NCCT = noncontrast CT.
Clinical Variables
The following categories were created: patients with an uncertain time of symptom onset, including patients with wake-up stroke, were classified as USO; patients with a known onset of stroke symptoms were classified as clear symptom onset (CSO).11,14
The following variables were collected: history of hypertension, history of diabetes, antiplatelet and anticoagulant treatment, admission blood pressure (BP), Glasgow Coma Scale score (GCS), and baseline NCCT timing (defined as time from LSW to NCCT in patients with USO and time from symptom onset to NCCT in patients with CSO). These clinical variables were collected by trained investigators, blinded to the outcomes of interest, through patients' or family members' interview and review of all available medical records. BP was treated following the American Heart Association/American Stroke Association guidelines.15-18 Patients with anticoagulant-associated ICH underwent coagulopathy reversal following international guidelines.16,19 Mortality at 30 days from the index event was recorded through outpatient clinical evaluations, telephone interviews, or querying national social security databases.
Image Acquisition and Analysis
NCCT scans were acquired with 3- to 5-mm slice thickness axial reconstruction following the local NCCT acquisition protocol at each site. Baseline and follow-up ICH volumes on NCCT images were determined with a semi-automated, computer-assisted planimetric measurement. All patients underwent follow-up NCCT scan at 24 hours from baseline scan or earlier in case of neurologic deterioration and HE was defined as absolute hematoma volume increase >6 mL or relative hematoma volume increase >33%.1
NCCT images were reviewed by trained raters, blinded to the outcomes of interest, for determination of ICH location and presence of intrahematoma hypodensities and IVH. ICH location was classified as lobar (parenchymal bleeding in cortex and cortical–subcortical junction), deep (parenchymal bleeding in thalamus, basal ganglia, internal capsule, deep periventricular white matter), cerebellar, or brainstem (parenchymal bleeding in midbrain, pons, or medulla oblongata).20 NCCT hypodensities were defined as any hypodense area encapsulated within the ICH with any shape, size, and density.10 Good inter-rater reliability for hypodensities detection (Cohen κ > 0.80) has been previously shown.21-23
When available, CT angiography (CTA) images were analyzed for the presence of the spot sign, defined as at least one focus of contrast extravasation within the hematoma, not connected with any surrounding blood vessels and having any size or shape and density ≥120 Hounsfield units.24
Statistical Analysis
Categorical variables were expressed as count (percentage) and compared using the χ2 test. Continuous variables were expressed as median (interquartile range [IQR]) or mean (SD) based on their distribution, evaluated with the Shapiro-Wilk test, and compared using the Mann-Whitney and t test, respectively. Mortality at 30 days and HE were the main outcomes of interest of the analysis and their predictors were investigated with multivariable binary logistic regression. All covariates included in logistic regression models were predefined, based on previous literature on HE and outcome in ICH.
Prediction models for mortality were adjusted for age, admission GCS, IVH presence, ICH volume, and location (infratentorial vs supratentorial).1,25 Prediction models for HE included baseline ICH volume, anticoagulant treatment, and time from symptom onset/LSW to baseline NCCT.26
In secondary analyses, all logistic regression models for mortality were adjusted also for variables with a potential effect on HE and outcome (anticoagulant treatment, history of hypertension, admission BP values, and NCCT timing)3,27 and logistic regression models for HE included admission SBP27 and antiplatelet treatment3 as well. We also analyzed HE as a continuous variable, defining absolute hematoma growth as total ICH volume increase from baseline to follow-up NCCT. The following secondary analyses were performed as well: (1) in patients with availability of CTA, we analyzed the risk of HE in spot sign positive patients with USO; (2) the logistic regression models for HE and mortality in patients with USO were repeated after the exclusion of infratentorial ICH and including ICH location (supratentorial lobar vs supratentorial deep) as a covariate28,29; and (3) predictors of HE and mortality were studied also in CSO participants to allow comparison with predictors in patients with USO.
All the analyses were performed with the statistical package SPSS version 21.0 (spss.com) and statistical significance was set at p < 0.05.
Data Availability
Requests to access the dataset may be sent to the corresponding author.
Results
A total of 2,165 patients were included in the study: 1,022 in the development cohort and 1,143 in the replication cohort. The flowchart is illustrated in the figure. The comparison between included and excluded participants showed that excluded patients were more frequently on anticoagulant treatment and had larger baseline ICH volume and higher rates of IVH and mortality (all p < 0.01). Table 1 shows the general characteristics of the study populations. The frequency of USO was 34.4% and 35.6% in the development and replication cohort, respectively.
Table 2.
Comparison Between Patients With Unclear Symptom Onset (USO) and Clear Symptom Onset (CSO)

Table 1.
Population Characteristics

Table 2 summarizes the comparison between USO and CSO participants. Patients with ICH with USO more frequently had hypertension, had larger baseline ICH volume, and had higher rate of mortality at 30 days. However, this difference in outcome was no longer significant after adjustment for ICH volume and other potential confounders in multivariable logistic regression.
The rate of HE was similar in patients with USO and CSO (25.0% vs 21.9%, p = 0.269 and 29.9% vs 31.5%, p = 0.423) and among patients with USO the occurrence of HE was independently associated with mortality at 30 days, as shown in table 3. This finding was confirmed also when HE was analyzed as a continuous variable, with each mL of hematoma growth associated with a 4% and 6% increase in the odds of death in the development and replication cohort, respectively. The independent association between HE and mortality in patients with USO was confirmed when the logistic regression models were also adjusted for other potential confounders in secondary analyses (odds ratio [OR] 2.64, 95% confidence interval [CI] 1.38–5.05, p = 0.003 in the development cohort and OR 3.43, 95% CI 1.76–6.69, p < 0.001 in the replication cohort).
Table 3.
Predictors of Mortality in Patients With Unclear Symptom Onset

Multivariable analysis of HE predictors in patients with USO showed that the presence of NCCT hypodensities was independently associated with an increased risk of HE (OR 2.59, 95% CI 1.27–5.28, p = 0.009 and OR 2.43, 95% CI 1.42–4.17, p = 0.001 in the development and replication cohort, respectively), as shown in table 4. These findings remained significant also after adjustment for SBP and antiplatelet treatment (OR 2.80, 95% CI 1.35–5.79, p = 0.006 in the development cohort; OR 2.23, 95% CI 1.29–3.85, p = 0.004 in the replication cohort). Table 5 summarizes the risk of ICH expansion stratified by baseline NCCT timing. Among patients with USO, 45.5% and 69.7% of patients experiencing HE presented after 6 hours from LSW in the development and replication cohort, respectively.
Table 4.
Predictors of Hematoma Expansion in Patients With Unclear Symptom Onset

Table 5.
Frequency of Hematoma Expansion Stratified by Noncontrast CT (NCCT) Timing

In patients with USO with availability of CTA images (n = 201, 57.1% and n = 69, 17% in the development and replication cohort, respectively), the risk of HE was significantly higher in spot sign positive patients (development cohort: 22/50, 44.0% vs 24/151, 15.9%, p < 0.001; replication cohort: 14/24, 58.3% vs 10/45, 22.2%, p = 0.003). This association was confirmed after adjustment for confounders (binary multivariable logistic regression with backward elimination at p < 0.1, including baseline ICH volume, NCCT timing, and anticoagulant treatment) in both the study populations (OR 3.60, 95% CI 1.67–7.74, p = 0.001 in the development cohort and OR 3.36, 95% CI 1.07–10.54, p = 0.038 in the replication cohort).
Secondary analysis on ICH location showed that HE remained associated with mortality in patients with USO also after exclusion of infratentorial ICH (OR 3.29, 95% CI 1.71–6.33, p < 0.001 in the development cohort and OR 3.30, 95 CI 1.75–6.24, p < 0.001 in the replication cohort). When we explored the association between ICH location and HE in USO patients, the risk of HE did not differ between lobar and deep supratentorial ICH (OR 0.86, 95% CI 0.48–1.54, p = 0.619 and OR 0.76, 95% CI 0.46–1.25, p = 0.275 in the development and replication population, respectively).
Finally, when predictors of HE were analyzed also in patients with CSO and compared with patients with USO, we observed that the CTA spot sign predicted HE with a higher effect size in the CSO population (OR 4.36, 95% 2.48–7.68, p < 0.001 in the development cohort and OR 7.21, 95% CI 2.84–18.31, p < 0.001 in the replication cohort).
Discussion
In this retrospective multicenter study, we observed that approximately one-third of patients with ICH presented with USO and among these patients HE was common and independently associated with mortality. The presence of hypodensities on baseline NCCT, a known marker of HE in CSO,30 was an independent predictor of HE also in patients with USO.
Despite the extended time to initial NCCT, the rate of HE did not differ between patients with USO and CSO in our cohorts, in agreement with previously reported results by Inoue et al.11 ICH size is directly associated with the risk of HE3,26 and the larger baseline ICH volume in patients with USO may explain this finding. Differences in ICH volume may also account for the observed higher unadjusted mortality risk in patients with USO and in line with previous literature this difference was no longer significant after accounting for ICH volume and other potential confounders in multivariable analysis.11 The lack of a significant difference in HE rate between CSO and USO may also be the consequence of limited statistical power. However, this possibility appears unlikely as our power to detect a 5% difference in the rate of HE between CSO and USO, assuming a type I error rate (α) of 0.05, was greater than 80%.31
As expected, we noted an inverse association between time from LSW to NCCT and the probability of HE in patients with USO, consistent with findings from patients with CSO that HE risk is highest with early presentation. This suggests the need for prompt recognition and treatment of acute ICH even when the time of symptom onset is unknown. However, another interesting finding of our analysis is that the majority of USO expanders presented beyond 6 hours from LSW and HE was not uncommon in USO patients receiving a NCCT after 12 hours from LSW.
Accurate identification of ideal candidates for antiexpansion treatment in clinical trials is a research priority and the optimal selection strategy remains a matter of debate.32,33 Because the presence of USO is a common cause of ineligibility for ICH trials,34 the results of our analysis may help the design and implementation of future randomized studies targeting HE. Our findings raise the intriguing hypothesis that patients with USO at high risk of HE may be included in clinical trials, therefore expanding the pool of ICH-eligible patients. The probability of HE in USO cases can be stratified with the presence of hypodensities, a neuroimaging marker that requires only a baseline NCCT scan and identifies patients at high risk of HE and therefore more likely to benefit from experimental therapies targeting active bleeding in ICH. However, previous studies did not find an interaction between hypodensities presence and clinical benefit from intensive SBP lowering35 or tranexamic acid administration.36
Multiple NCCT predictors and tools to stratify the risk of HE have been described recently but the majority of these studies were restricted to patients presenting within 6 hours from a known, witnessed onset of symptoms.30,37-39 Further research efforts to validate these imaging markers and test their diagnostic performance in patients with USO appear warranted. We also showed that the CTA spot sign, a validated imaging marker of HE in patients with CSO,9 predicted HE in patients with USO as well, but with different effect size. The observed higher OR for HE in patients with CSO may be explained by the different onset to scan time in the 2 groups as the spot sign's positive predictive value for HE decreases with longer time from onset to scan.40
Some limitations should be considered when interpreting the results of this analysis. First, our results derive from a retrospective analysis and all the procedures for data collection, laboratory tests, and imaging acquisition in different ICH registries were not homogeneous. This may have influenced our analysis and suggests the need for prospective confirmation of our observations. We also noted heterogeneity in the clinical and imaging features of the 2 study populations. In particular, patients in the development population were more severely affected and had worse outcome. The different enrollment setting, with the development cohort including also intensive care unit patients and the replication cohort deriving from stroke unit–based registries only, may account for these discrepancies. Although these differences may have influenced our study, the reproducibility and stability of our findings across different settings and intensity of ICH care may also be a strength of our analysis. Second, many patients were excluded because of missing follow-up NCCT, therefore introducing the possibility of selection bias in favor of less severely affected patients.41 Excluded patients had larger baseline ICH volume, higher rates of IVH, more anticoagulant treatment, and worse outcome (data not shown), and may have experienced hematoma enlargement and death before receiving a follow-up CT scan. Early withdrawal of care may also be a plausible explanation for the higher mortality observed in excluded patients.42 Discontinuation of life-sustaining therapies may have influenced our results (self-fulfilling prophecy) and we did not have accurate data to account for this important variable.43 Furthermore, previous studies reported geographical heterogeneity in limitation of care dispositions and we cannot exclude relevant differences between the 2 populations of our study.44 Third, as this is a nonrandomized study, influence by unmeasured confounders cannot be excluded. Fourth, data on other imaging markers such as CT angiography spot sign were limited and our preliminary findings require prospective validation on a larger sample size. Fifth, intensive BP reduction and its fluctuations may modify the odds of HE and we were able to account for admission SBP only.27 Furthermore, all the included patients, especially in the development cohort, were recruited over a long time period, during which multiple ICH guidelines were published, with differences in SBP targets in the acute phase of ICH.15-18 Therefore SBP management in the 2 study populations and between patients in the same center may not have been homogeneous, with a potential effect on the occurrence of HE.27 Sixth, rapid coagulopathy treatment can modify the odds of HE and poor outcome and we were not able to explore the influence of this variable.4 Further studies are needed to clarify the influence of coagulopathy reversal and investigate whether there are differences in coagulopathy management in patients with USO vs CSO.
One in 3 patients with ICH present with USO. Among these patients, HE is common and independently associated with mortality, representing an appealing therapeutic target. If prospectively confirmed, these findings may inform future studies and expand the number of patients eligible for randomized trials targeting active bleeding.
Glossary
- BP
blood pressure
- CI
confidence interval
- CSO
clear symptom onset
- CTA
CT angiography
- GCS
Glasgow Coma Scale score
- HE
hematoma expansion
- ICH
intracerebral hemorrhage
- IQR
interquartile range
- IVH
intraventricular hemorrhage
- LSW
last seen well
- NCCT
noncontrast CT
- OR
odds ratio
- SBP
systolic blood pressure
- USO
unclear time of symptom onset
Appendix. Authors

Footnotes
Infographic: http://links.lww.com/WNL/B384
Study Funding
No targeted funding reported.
Disclosure
Dr. Morotti, Dr. Boulouis, Dr. Charidimou, Dr. Li, Dr. Poli, Dr. Costa, Dr. De Giuli, Dr. Leuci, Dr. Mazzacane, Dr. Busto, Dr. Arba, Dr. Brancaleoni, Dr. Giacomozzi, Dr. Simonetti, Dr. Laudisi, Dr. Micieli, Dr. Cavallini, Dr. Candeloro, Dr. Gamba, Dr. Magoni, and A.D. Warren report no disclosures. Dr. Anderson receives sponsored research support from the NIH (R01NS103924), the American Heart Association Strategically Focused Research Network in Atrial Fibrillation, Massachusetts General Hospital, and Bayer AG, and has consulted for ApoPharma, Inc. Dr. Gurol, Dr. Biffi, Dr. Viswanathan, Dr. Casetta, Dr. Fainardi, Dr. Zini, Dr. Pezzini, Dr. Padovani, and Dr. Greenberg report no disclosures. Dr. Rosand reports research support from the NIH, the American Heart Association, and OneMind, and has consulted for Boehringer Ingelheim, Inc. Dr. Goldstein reports research and consulting from Pfizer, Phillips, CSL Behring, Portola, Octapharma, NControl, and Cayuga. Go to Neurology.org/N for full disclosures.
References
- 1.Dowlatshahi D, Demchuk AM, Flaherty ML, Ali M, Lyden PL, Smith EE. Defining hematoma expansion in intracerebral hemorrhage: relationship with patient outcomes. Neurology 2011;76:1238–1244. [DOI] [PMC free article] [PubMed] [Google Scholar]
- 2.Steiner T, Bösel J. Options to restrict hematoma expansion after spontaneous intracerebral hemorrhage. Stroke 2010;41:402–409. [DOI] [PubMed] [Google Scholar]
- 3.Al-Shahi Salman R, Frantzias J, Lee RJ, et al. Absolute risk and predictors of the growth of acute spontaneous intracerebral haemorrhage: a systematic review and meta-analysis of individual patient data. Lancet Neurol 2018;17:885–894. [DOI] [PMC free article] [PubMed] [Google Scholar]
- 4.Kuramatsu JB, Gerner ST, Schellinger PD, et al. Anticoagulant reversal, blood pressure levels, and anticoagulant resumption in patients with anticoagulation-related intracerebral hemorrhage. JAMA 2015;313:824. [DOI] [PubMed] [Google Scholar]
- 5.Li Q, Warren AD, Qureshi AI, et al. Ultra‐early blood pressure reduction attenuates hematoma growth and improves outcome in intracerebral hemorrhage. Ann Neurol 2020;88:388–395. [DOI] [PMC free article] [PubMed] [Google Scholar]
- 6.Anderson C, Heeley E, Huang Y, et al. Rapid blood-pressure lowering in patients with acute intracerebral hemorrhage. N Engl J Med 2013;368:2355–2365. [DOI] [PubMed] [Google Scholar]
- 7.Qureshi AI, Palesch YY, Barsan WG, et al. Intensive blood-pressure lowering in patients with acute cerebral hemorrhage. N Engl J Med 2016;375:1033–1043. [DOI] [PMC free article] [PubMed] [Google Scholar]
- 8.Gladstone DJ, Aviv RI, Demchuk AM, et al. Effect of recombinant activated coagulation factor VII on hemorrhage expansion among patients with spot sign–positive acute intracerebral hemorrhage. JAMA Neurol 2019;76(12):1493–1501. [DOI] [PMC free article] [PubMed] [Google Scholar]
- 9.Demchuk AM, Dowlatshahi D, Rodriguez-Luna D, et al. Prediction of haematoma growth and outcome in patients with intracerebral haemorrhage using the CT-angiography spot sign (PREDICT): a prospective observational study. Lancet Neurol 2012;11:307–314. [DOI] [PubMed] [Google Scholar]
- 10.Morotti A, Boulouis G, Dowlatshahi D, et al. Standards for detecting, interpreting, and reporting noncontrast computed tomographic markers of intracerebral hemorrhage expansion. Ann Neurol 2019;86:480–492. [DOI] [PubMed] [Google Scholar]
- 11.Inoue Y, Miyashita F, Koga M, Minematsu K, Toyoda K. Unclear-onset intracerebral hemorrhage: clinical characteristics, hematoma features, and outcomes. Int J Stroke 2017;12:961–968. [DOI] [PubMed] [Google Scholar]
- 12.Steckler A, McLeroy KR. The importance of external validity. Am J Public Health 2008;98(1):9–10. [DOI] [PMC free article] [PubMed] [Google Scholar]
- 13.Justice AC, Covinsky KE, Berlin JA. Assessing the generalizability of prognostic information. Ann Intern Med 1999;130:515–524. [DOI] [PubMed] [Google Scholar]
- 14.Wu O, Schwamm LH, Sorensen AG. Imaging stroke patients with unclear onset times. Neuroimaging Clin N Am 2011;21:327–344.xi. [DOI] [PMC free article] [PubMed] [Google Scholar]
- 15.Morgenstern LB, Hemphill JC, Anderson C, et al. Guidelines for the management of spontaneous intracerebral hemorrhage: a guideline for healthcare professionals from the American Heart Association/American Stroke Association. Stroke 2010;41:2108–2129. [DOI] [PMC free article] [PubMed] [Google Scholar]
- 16.Hemphill JC, Greenberg SM, Anderson C. Guidelines for the management of spontaneous intracerebral hemorrhage: a guideline for healthcare professionals from the American Heart Association/American Stroke Association. Stroke 2015;46:2032–2060. [DOI] [PubMed] [Google Scholar]
- 17.Broderick J, Connolly S, Feldmann E, et al. Guidelines for the management of spontaneous intracerebral hemorrhage in adults. Stroke 2007;38:2001–2023. [DOI] [PubMed] [Google Scholar]
- 18.Broderick JP, Adams HP, Barsan W, et al. Guidelines for the management of spontaneous intracerebral hemorrhage: a statement for health professionals from a special writing group of the Stroke Council. Stroke 1999;30(4):905–915. [DOI] [PubMed] [Google Scholar]
- 19.Frontera JA, Lewin JJ, Rabinstein AA, et al. Guideline for reversal of antithrombotics in intracranial hemorrhage: a statement for healthcare professionals from the Neurocritical Care Society and Society of Critical Care Medicine. Neurocrit Care 2016;24:6–46. [DOI] [PubMed] [Google Scholar]
- 20.Falcone GJ, Biffi A, Brouwers HB, et al. Predictors of hematoma volume in deep and lobar supratentorial intracerebral hemorrhage. JAMA Neurol 2013;70(8):988–994. [DOI] [PMC free article] [PubMed] [Google Scholar]
- 21.Boulouis G, Morotti A, Bart Brouwers H, et al. Association between hypodensities detected by computed tomography and hematoma expansion in patients with intracerebral hemorrhage. JAMA Neurol 2016;73:961–968. [DOI] [PMC free article] [PubMed] [Google Scholar]
- 22.Dowlatshahi D, Morotti A, Al-Ajlan FS, et al. Interrater and intrarater measurement reliability of noncontrast computed tomography predictors of intracerebral hemorrhage expansion. Stroke 2019;50:1260–1262. [DOI] [PubMed] [Google Scholar]
- 23.Poli L, Leuci E, Costa P, et al. Validation and comparison of noncontrast CT scores to predict intracerebral hemorrhage expansion. Neurocrit Care 2020;32:804–811. [DOI] [PubMed] [Google Scholar]
- 24.Romero JM, Bart Brouwers H, Lu J, et al. Prospective validation of the computed tomographic angiography spot sign score for intracerebral hemorrhage. Stroke 2013;44:3097–3102. [DOI] [PMC free article] [PubMed] [Google Scholar]
- 25.Hemphill JC, Bonovich DC, Besmertis L, Manley GT, Johnston SC. The ICH score: a simple, reliable grading scale for intracerebral hemorrhage. Stroke 2001;32:891–897. [DOI] [PubMed] [Google Scholar]
- 26.Brouwers HB, Chang Y, Falcone GJ, et al. Predicting hematoma expansion after primary intracerebral hemorrhage. JAMA Neurol 2014;71:158–164. [DOI] [PMC free article] [PubMed] [Google Scholar]
- 27.Moullaali TJ, Wang X, Martin RH, et al. Blood pressure control and clinical outcomes in acute intracerebral haemorrhage: a preplanned pooled analysis of individual participant data. Lancet Neurol 2019;18:857–864. [DOI] [PubMed] [Google Scholar]
- 28.Roh D, Boehme A, Young C, et al. Hematoma expansion is more frequent in deep than lobar intracerebral hemorrhage. Neurology 2020;95:e3386–e3393. [DOI] [PMC free article] [PubMed] [Google Scholar]
- 29.Yogendrakumar V, Demchuk AM, Aviv RI, et al. Location of intracerebral haemorrhage predicts haematoma expansion. Eur Stroke J 2017;2:257–263. [DOI] [PMC free article] [PubMed] [Google Scholar]
- 30.Morotti A, Arba F, Boulouis G, Charidimou A. Noncontrast CT markers of intracerebral hemorrhage expansion and poor outcome: a meta-analysis. Neurology 2020;95(14):632–643. [DOI] [PubMed] [Google Scholar]
- 31.Rosner B. Fundam Biostat, 7th ed. MA Brooks/Cole; 2011. [Google Scholar]
- 32.Casolla B, Cordonnier C. Is hyperselection of patients the right strategy? JAMA Neurol 2019;76:1426–1427. [DOI] [PubMed] [Google Scholar]
- 33.Hemorrhagic Stroke Academia Industry (HEADS) roundtable participants; second HEADS roundtable participants recommendations for clinical trials in ICH: the second hemorrhagic stroke academia industry roundtable. Stroke 2020;51:1333–1338. [DOI] [PMC free article] [PubMed] [Google Scholar]
- 34.Fonville AF, Samarasekera N, Hutchison A, Perry D, Roos YB, Salman RAS. Eligibility for randomized trials of treatments specifically for intracerebral hemorrhage community-based study. Stroke 2013;44:2729–2734. [DOI] [PubMed] [Google Scholar]
- 35.Morotti A, Boulouis G, Romero JM, et al. Blood pressure reduction and noncontrast CT markers of intracerebral hemorrhage expansion. Neurology 2017;89:548–554. [DOI] [PMC free article] [PubMed] [Google Scholar]
- 36.Sprigg N, Flaherty K, Appleton JP, et al. Tranexamic acid for hyperacute primary IntraCerebral Haemorrhage (TICH-2): an international randomised, placebo-controlled, phase 3 superiority trial. Lancet 2018;391:2107–2115. [DOI] [PMC free article] [PubMed] [Google Scholar]
- 37.Li Q, Liu QJ, Yang WS, et al. Island sign: an imaging predictor for early hematoma expansion and poor outcome in patients with intracerebral hemorrhage. Stroke 2017;48:3019–3025. [DOI] [PubMed] [Google Scholar]
- 38.Li Q, Zhang G, Huang YJ, et al. Blend sign on computed tomography: novel and reliable predictor for early hematoma growth in patients with intracerebral hemorrhage. Stroke 2015;46:2119–2123. [DOI] [PubMed] [Google Scholar]
- 39.Li Q, Zhang G, Xiong X, et al. Black hole sign: novel imaging marker that predicts hematoma growth in patients with intracerebral hemorrhage. Stroke 2016;47:1777–1781. [DOI] [PubMed] [Google Scholar]
- 40.Dowlatshahi D, Brouwers HB, Demchuk AM, et al. Predicting intracerebral hemorrhage growth with the spot sign: the effect of onset-to-scan time. Stroke 2016;47:695–700. [DOI] [PMC free article] [PubMed] [Google Scholar]
- 41.Delgado-Rodriguez M. Bias. J Epidemiol Community Health 2004;58:635–641. [DOI] [PMC free article] [PubMed] [Google Scholar]
- 42.Zahuranec DB, Brown DL, Lisabeth LD, et al. Early care limitations independently predict mortality after intracerebral hemorrhage. Neurology 2007;68:1651–1657. [DOI] [PubMed] [Google Scholar]
- 43.Rabinstein AA, Diringer MN. Withholding care in intracerebral hemorrhage: realistic compassion or self-fulfilling prophecy? Neurology 2007;68:1647–1648. [DOI] [PubMed] [Google Scholar]
- 44.Mark NM, Rayner SG, Lee NJ, Curtis JR. Global variability in withholding and withdrawal of life-sustaining treatment in the intensive care unit: a systematic review. Intens Care Med 2015;41:1572–1585. [DOI] [PubMed] [Google Scholar]
Associated Data
This section collects any data citations, data availability statements, or supplementary materials included in this article.
Data Availability Statement
Requests to access the dataset may be sent to the corresponding author.