

Abstract
Heavy metal mixture can induce multiple organ damage through oxidative stress and inflammatory processes. Dietary intervention using natural antidotes in resource poor countries where classical metal chelators are either not affordable or available can be explored as an alternative means of management of public health effects of chronic heavy metal exposure. The search for natural antidote against the deleterious effects of heavy metals gives the thrust for this study. Thus, the study investigated the effect of aqueous leaf extract of Costus afer on liver, kidney, brain and testis induced by low dose heavy metal mixture (LDHMM) of PbCl2, CdCl2 and HgCl2 of concentrations of 20 mg/kg, 1.61 mg/kg and 0.40 mg/kg, respectively. Five groups of seven rats each (weight-matched) were used. First and second groups received deionized water and heavy metal mixture and served as normal and toxic controls, respectively. Groups 3, 4 and 5 received through oral gavage 750, 1500, 2250 mg/kg of the Costus afer extract respectively, with the metal mixture concurrently. All treatments were four times a week for 90 days (4/week/90 days). Hepatorenal, hormonal, oxidative stress markers, cytokines (interleukin-6 and interleukin-10), and heavy metals (Pb, Cd and Hg) concentrations were assayed. The one-way analysis of variance, agglomerative hierarchical clustering, parallel coordinates plot, principal component analysis and Bray Curtis dissimilarity were used to statistically analyze the data. LDHMM caused significant changes in these organs and however, the plant extract provided a protective effect against these pathological changes. The statistical analysis revealed that the kidney was the most affected organ, followed by the liver, then brain and testis, respectively. Costus afer may be an important nutraceutical in multi-organ deleterious effects of LDHMM following its regulation of oxidative stress markers, inflammatory cytokines and biometal chelation.
Keywords: Costus afer, liver, brain, kidney, testis, inflammation, oxidative stress
Introduction
Costus afer is a tall perennial herbaceous, unbranched medicinal plant with creeping rhizome, commonly found in moist or shady forests and riverbanks of tropical West Africa including Nigeria, Ghana and Cameroon [1]. It belongs to the family of Zingiberaceae. The plant is commonly known as gingerlily. It is known as “Okpete” or “Okpoto” in Igboland, “Kakizawa” in Hausa “tete-egun” in Yoruba and “Mbritem” in Efik all in Nigeria [2]. Anglophone Cameroon calls it “Monkey sugar cane”. The therapeutic properties of Costus afer include nephroprotective, hepatoprotective and antioxidant roles [3,4]. It also possesses antinociceptive property and hypolipidemic effect [5,6]. Costus afer has proven to possess antimicrobial and anti-inflammatory effects [7,8].
Among the consequences of technological developments and urbanization are the risks to environmental safety and public health. This may be due to ineffective policy on pollution and discharge controls [9]. Today, our environment is contaminated heavily with many pollutants including heavy metals, pesticides, and other chemicals resulting from both natural and manmade activities. Because heavy metals have been used in recent activities to sustain life, the risk of human exposure continues to rise due to their dominance in the environment. Heavy metals are non-degradable elements found in the earth and known for their toxicological effects on humans and the environment. Lead (Pb), mercury (Hg) and cadmium (Cd) are toxic to humans and show no significance in the biological processes in the body [10].
Reports have shown that even at low concentration, exposure to these heavy metals has caused many health problems including neurotoxicity, nephrotoxicity, hepatotoxicity, testicular injuries and carcinogenicity [11]. They are generally circulated in the environment as major environmental pollutants and are listed as top toxic substances. These elements are confirmed or probable carcinogens and they affect many body systems, including the renal, endocrine, nervous, immunological, musculoskeletal and cardiovascular systems [12]. The exact mechanism linked with exposure to heavy metal mixture remains obscure but several studies suggest that it leads to reactive oxygen species (ROS) generation and oxidative damage which induce oxidative injury [13]. This presents a disproportion amid the development of ROS and the body’s ability to fight the ensuing consequence [13]. Owing to its ability to scavenge ROS, antioxidants might be used to protect against its toxicity.
Recently, interests have shifted from modern chelating agents to medicinal plants because of the high presence of antioxidant properties in them. Human and animal health care treatment with ethno-medicine is no longer seen as a myth or unholy practice and this has gained popularity across the globe [14,15]. It is recently believed that “natural is better” and approximately 80% of the world’s population depends solely on herbal medicines for disease management [14,15]. Owing to the fact that these herbal medicines are constantly available, simply affordable and already an important part of people’s life, the World Health Organization (WHO) encourages developing countries to make use of herbal medicine in treating health problems affecting them locally [14]. This study was therefore designed to evaluate the protective effect of the aqueous leaf extract of Costus afer on male albino rats exposed to heavy metal mixture of Pb, Cd and Hg.
Materials and methods
Collection and identification of Costus afer
Costus afer was harvested from the interior part of a farm land (away from vehicular traffic) behind the World Bank African Centre of Excellence for Oilfield Chemicals Research, University of Port Harcourt in Ikwerre Local Government Area of Rivers State, Nigeria. Identification and authentication of the plant material was done by Mr. A.O. Ozioko of the Department of Botany, University of Nigeria, Nsukka and given the voucher number [INTERCEDDO/033].
Preparation of the plant extract
Fresh leaves of Costus afer were collected and washed clean to remove sand particles. The leaves were pulverized and properly stored. Then, 250 g of the pulverized leaves was weighed and macerated in 500 ml deionized water in a stoppered container and allowed to stand for 24 hours with constant agitations at intervals following the previous work of Ezejiofor and Orisakwe [16]. After vigorous shaking of the mixture, the slurry was sieved and filtered through a Whatman filter paper No.1. The volume was made up to 1000 ml by using deionized water. This was considered as 50% stock solution of the extract. The filtered liquid was then stored in a refrigerator at 4°C. The extract was redundant after the fourth day of treatment and fresh preparation was made. This process was continuous over the 90 days of treatment.
Animal care handling
Thirty-five (35) young male Wistar rats, approximately 8 weeks old and weighing 100-200 g bought from the animal house of the Department of Experimental Pharmacology and Toxicology, University of Port Harcourt, Choba, Rivers State, Nigeria were used for the study. The test animals were kept for fourteen days to adapt in polypropylene cages under standard conditions following the procedures of Ezejiofor and Orisakwe [16]. The protocol for the experiment was approved by the University of Port Harcourt Research Ethics Committee and the reference number UPH/CEREMAD/REC/04 was assigned. The animals were given standard feed and deionized water ad libitum.
Experimental design
Weight matched rats were divided into five groups of seven rats each. Group 1 was maintained as the standard control and was given only the deionized water, while group 2 was maintained as the toxic control and given only metal mixture (PbCl2, 20 mg/kg; CdCl2, 1.61 mg/kg; HgCl2, 0.40 mg/kg) (Sigma Aldrich WGK Germany) according to the study by Institoris et al. [17]. This represents an environmentally relevant dose in which metals occur in nature (at low doses as cocktail rather than singly). Rats belonging to groups 3, 4 and 5 received the metal mixture and Costus afer extract at 750 mg/kg, 1500 mg/kg and 2250 mg/kg respectively through oral gavage following the procedures recorded in the work of Ezejiofor and Orisakwe [16]. Based on 1% of stock solution, the volume given to the animals for 750 mg/kg, 1500 mg/kg and 2250 mg/kg doses of Costus afer is 1.31 ml, 2.4 ml and 3.4 ml, respectively. The volume was calculated according to the average weight of the animals in each treatment group.
Sample collection
After the 90 days of treatment period, animals were sacrificed under ether anesthesia. Approximately, 4 ml of blood was taken from each rat by cardiac puncture and stored in plain vial for biochemical analysis. The liver, kidney, brain and testis were weighed after excision the relative organ weights were obtained by;
Relative weight = Absolute weight/Final body weight × 100
Metal analysis
Acid digestion of the liver, kidney, brain and testis was done by using 6 ml of Nitric acid and 2 ml of perchloric acid after isolating and weighing the organs. After acidification, the samples are placed for 30 minutes before heating at 105°C until digestion is completed. The solution was then filtered with Whatmann filter paper Number (1) to get a clear solution. The solution was later made up to 15 ml (final volume) with distilled water. Solar thermo elemental flame Atomic Absorption Spectrometer (Model SG 71906) was used to determine the levels of lead, cadmium and mercury present.
Antioxidant analysis
Catalase (CAT) activity
Catalase activity was estimated by slightly modifying the method by Clairborne [18]. This method is supported by the principle that catalase in the sample preparation split hydrogen peroxide which can be measured spectrophotometrically at 240 nm.
Estimation of glutathione (GSH) level
The glutathione level was estimated using the procedure explained by Sedlak and Lindsay [19].
Estimation of Superoxide dismutase (SOD) activity
Superoxide dismutase activity was evaluated by using the method described by Misra and Fridovich [20]. This is principally based on the ability of SOD to inhibit the autoxidation of epinephrine at pH 10.2.
Lipid peroxidation marker (MDA) activity
The MDA level was assayed by using the procedure of Ohkawa and Ohishi [21]. Under acidic medium, MDA reacts with the chromogenic reagent, 2-thiobarbituric acid (TBA), to form a pink coloured complex at 532 nm absorbance.
Estimation of inflammatory cytokines [Interlukin-6 (IL-6) and Interlukin-10 (IL-10)]
The activities of Il-6 and IL-10 were assayed using the enzyme linked immunosorbent assay kit (ELISA-Bioassay Technology Laboratory, 1713 Junjiang Inter. Bldg. 218 Ningguo Rd. Yangpu Dist. Shanghai, China) with the sensitivity of 0.052 ng/L and 1.51 pg/ml respectively. This process is principally based on immobilization.
Statistical analysis
The analysis of variance (ANOVA) was applied to the sequence of observations for the purpose of comparative analysis at 5% significance. For this study, the multiple comparisons were carried out with Duncan’s multiple comparison method at 5% significant level. All results were expressed as mean ± standard deviation. Principal component analysis (PCA) was carried out as a factor reduction technique; parallel coordinate plot was done to establish the trends between the different groups against the parameters; and the agglomerative hierarchical clustering (AHC) analysis was also done as an equivalent factor reduction technique to compare the different groups of treatment. To evaluate the organ that was mostly affected by exposure to the mixture of heavy metals, a statistical tool called the Bray Curtis dissimilarity was used to calculate the dissimilarity between the treatment groups across the organs (liver, kidney, brain and testis) [22]. Bray Curtis dissimilarity is a statistic used to quantify the compositional dissimilarity between different sites, based on counts at each site. It is bounded between 0 and 1, where 0 means the sites have the same composition (that is they share all the species), and 1 means the sites do not share any species. At sites where Bray Curtis is intermediate (0.5), this index differs from other commonly used indices.
Results
Organ weight assay
After 90 consecutive days of treatment, animals treated with only the metal mixture showed a marked elevation in organ weights (P < 0.05) contrast to that in standard control rats (treated with only deionized water). However, rats co-treated with Costus afer significantly reduced the organ weights compared to that in metal mixture-exposed rats in a dose-dependent approach (Table 1).
Table 1.
Effects of Costus afer on absolute (g) and relative (%) weights of liver, kidney, brain and testis in male albino rats treated with metal mixture
| Treatment | Liver | Kidney | Brain | Testis | ||||
|---|---|---|---|---|---|---|---|---|
|
|
|
|
|
|||||
| *Abs.wt. (g) | Rel.wt. (%) | *Abs.wt. (g) | Rel.wt. (%) | *Abs.wt. (g) | Rel.wt. (%) | *Abs.wt. (g) | Rel.wt. (%) | |
| Deionized H2O (only) | 5.08±0.95a | 2.45 | 1.04±0.05a | 0.50 | 1.54±0.09a | 0.74 | 2.44±0.29a | 1.18 |
| Metal mixture (only) | 9.4±1.35c | 3.62 | 1.66±0.21c | 0.64 | 1.84±0.09c | 0.71 | 2.80±0.34b | 1.08 |
| Metal mixture + 750 mg/kg CA | 8.48±1.13b,c | 3.52 | 1.38±0.13b | 0.57 | 1.74±0.09b,c | 0.72 | 2.72±0.08a,b | 1.13 |
| Metal mixture + 1500 mg/kg CA | 8.36±0.52b,c | 3.15 | 1.34±0.09b | 0.50 | 1.72±0.08b | 0.65 | 2.66±0.13a,b | 1.00 |
| Metal mixture + 2250 mg/kg CA | 7.86±0.22b | 3.06 | 1.26±0.15b | 0.49 | 1.62±0.08a,b | 0.63 | 2.54±0.11a,b | 0.99 |
Values are expressed as (Mean ± SD, N = 5).
Values in the same column with different superscripts (a, b, c) are significantly different from each other (P < 0.05) and those with the same superscripts are not significantly different. Abs.wt. and Rel. wt. represent absolute and relative weights of different organs, respectively. CA = Costus afer.
Liver and Kidney function assay
To estimate the probable protective role of Costus afer treatment following metal mixture exposure, liver function tests were conducted. Metal mixture caused a significant elevation in liver enzymes (alanine aminotransferase ALT; aspartate aminotransferase AST), together with bilirubin (total and direct) levels, and a decline in total protein and albumin levels, while Costus afer co-treated animals showed a decrease in the liver enzyme markers and an increase in total protein and albumin compared to metal mixture-treated albino rats in a dose-dependent manner (Table 2).
Table 2.
Effect of Costus afer on liver function, electrolytes and kidney function parameters of male albino rats treated with metal mixture
| Treatment | Liver function tests | Electrolytes and Kidney function tests | |||||||||
|---|---|---|---|---|---|---|---|---|---|---|---|
|
|
|
||||||||||
| AST (µ/l) | ALT (µ/l) | Total bilirubin | Direct bilirubin | Total protein (g/l) | Albumin (g/l) | Na+ (mmol/l) | Cl- (mmol/l) | K (mmol/l) | U (mmol/l) | Cr (µmol/l) | |
| Deionized H2O (only) | 78.6±6.58a | 21.6±5.03a | 11.4±3.60a | 4.1±0.58a | 67.8±6.42c | 39.6±4.83c | 139.90±2.85a | 105.00±5.24b | 4.72±0.60b | 3.72±0.82b | 84.40±2.41a |
| Metal mixture (only) | 172.0±1.87e | 77.8±2.17e | 32.6±2.80d | 15.2±1.70d | 43.8±6.18a | 25.4±3.36a | 160.80±4.55d | 118.20±4.21d | 8.14±0.51d | 8.92 1.05d | 177.40±6.31d |
| Metal mixture + 750 mg/kg CA | 156.0±6.67d | 68.6±2.41d | 27.0±1.75c | 11.2±1.79c | 49.4±3.05a | 31.2±4.32b | 152.70±3.21c | 113.60±3.51d,c | 7.04±1.52c | 6.28±0.84c | 144.00±11.40c |
| Metal mixture + 1500 mg/kg CA | 131.8±6.30c | 46.2±4.55c | 19.0±2.80b | 7.2±1.00b | 57.6±6.58b | 34.6±2.97b,c | 145.90±5.46b | 108.60±3.90c,b | 5.42±0.82b | 4.50±0.58b | 122.60±7.77b |
| Metal mixture + 2250 mg/kg CA | 94.6±13.59b | 31.0±2.92b | 11.6±2.47a | 5.1±0.39a | 66.8±7.43c | 38.8±3.90c | 141.18±2.51b,a | 103.80±1.79b | 4.66±0.52b | 3.58±0.34b | 77.20±4.43a |
Values are expressed as (Mean ± SD, N = 5). Values in the same column with different superscripts (a, b, c, d, e) are significantly different from each other (P < 0.05) and those with the same superscripts in the same column are not significantly different; where CA = Costus afer, AST = aspartate aminotransferase, ALT = alanine aminotransferase, Na+ = sodium, Cl- = chloride, K = potassium, U = urea and Cr = creatinine.
Furthermore, metal mixture caused a marked elevation in the electrolytes, together with urea and creatinine levels, while rats treated with a co-administration of Costus afer at 750 mg/kg, 1500 mg/kg and 2250 mg/kg showed a decline in the physiological markers compared to metal mixture-treated albino rats (Table 2). The electrolyte levels (sodium, chloride and potassium) in rats treated with only the heavy metal mixture were significantly different from the electrolyte levels in rats co-treated with Costus afer at varying doses. Similarly, the urea and creatinine levels of rats treated with only the heavy metal mixture were significantly different from those co-treated with Costus afer.
Pro- and anti-inflammatory cytokines assay
Measuring the pro- and anti-inflammatory cytokine levels in the liver, kidney, brain and testis is beneficial in assessing the inflammatory status after metal mixture exposure. Co-administration with Costus afer significantly reduced and increased (P < 0.05) the levels of pro- and anti- inflammatory cytokines (IL-6 and IL-10) respectively in these organs when compared to those in metal mixture-treated group (Table 3), showing that Costus afer possess protective effect over inflammatory activity.
Table 3.
Effect of Costus afer on inflammatory cytokines (interlukin-10 (IL-10) and interlukin-6 (IL-6) (Pg/g tissue) on liver, kidney, brain and testis of male albino rats treated with metal mixture
| Organs | Treatment | IL-10 | IL-6 |
|---|---|---|---|
| Liver | Deionized H2O (only) | 76.60±15.41c | 6.25±0.35a |
| Metal mixture (only) | 14.70±0.42a | 61.80±1.13d | |
| Metal mixture + 750 mg/kg CA | 22.55±0.64a | 41.80±2.83c | |
| Metal mixture + 1500 mg/kg CA | 37.05±14.21a,b | 21.25±2.05b | |
| Metal mixture + 2250 mg/kg CA | 70.55±5.87c | 10.75±5.59a | |
| Kidney | Deionized H2O (only) | 57.70±11.31c | 2.20±0.99a |
| Metal mixture (only) | 11.45±0.35a | 57.00±3.82d | |
| Metal mixture + 750 mg/kg CA | 18.20±4.53a,b | 27.50±7.35c | |
| Metal mixture + 1500 mg/kg CA | 27.10±4.10b | 17.45±0.63b | |
| Metal mixture + 2250 mg/kg CA | 48.15±1.48c | 7.05±0.35a | |
| Brain | Deionized H2O (only) | 30.50±4.67c | 7.50±0.28a |
| Metal mixture (only) | 2.20±0.14a | 32.55±0.21d | |
| Metal mixture + 750 mg/kg CA | 11.75±4.60b | 22.35±2.76c | |
| Metal mixture + 1500 mg/kg CA | 23.10±0.57c | 16.15±0.92b | |
| Metal mixture + 2250 mg/kg CA | 31.50±1.41c | 8.75±2.05a | |
| Testis | Deionized H2O (only) | 31.10±1.98c | 2.05±0.35a |
| Metal mixture (only) | 9.45±1.91a | 16.00±1.41c | |
| Metal mixture + 750 mg/kg CA | 13.45±3.18a,b | 14.85±0.21b,c | |
| Metal mixture + 1500 mg/kg CA | 16.85±0.49b | 11.35±3.04b | |
| Metal mixture + 2250 mg/kg CA | 25.95±0.78c | 4.50±0.85a |
Values are expressed as (Mean ± SD). Values in the same column with different superscripts (a, b, c, d) are significantly different from each other (P < 0.05) and those with the same superscripts in the same column are not significantly different; where CA = Costus afer, IL-10 = interlukin-10 and IL-6 = interlukin-6.
A parallel coordinates plot showing comparison of inflammatory markers interaction in various groups is presented in Figure 1. After Varimax rotation, the factor loading of inflammatory variables on significant principal components is presented in Table 4, while Figure 2 depicts the correlation plot. A score plot illustrating the differentiation of parameters associated with interactions among inflammatory markers in different groups is presented in Figure 3. A three-dimensional component system explaining 98.84% of the total variance was observed after the principal component (PC) analysis.
Figure 1.
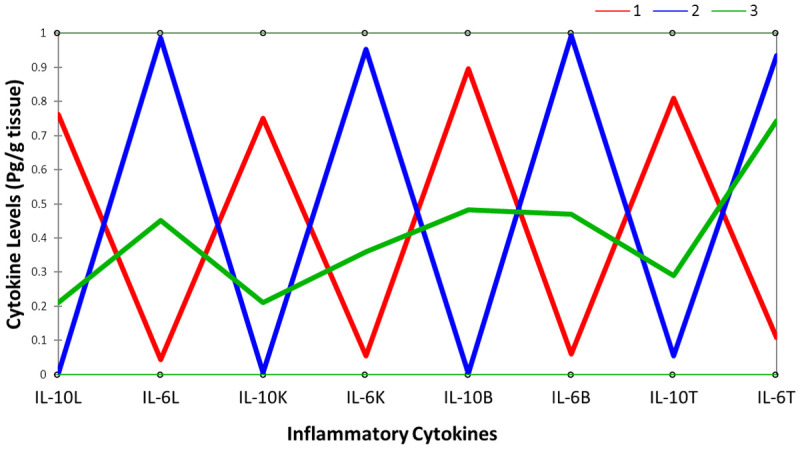
A parallel coordinates plot showing comparison of inflammatory markers interaction in different groups; class 1 which include rats in groups 1 and 5, class 2 comprising of rats in group 2, and class 3 which include rats in groups 3 and 4. It was deduced that class 1 rats have high IL-10 in the organs with low IL-6 levels, while class 2 rats have low IL-10 in the organs with high IL-6 levels. Class 3 rats fit into the intermediate class showing that they have in-between values for the inflammatory cytokines. *L is liver, K is kidney, B is brain and T is testis.
Table 4.
Loadings of inflammatory variables on significant principal components after Varimax rotation
| Inflammatory parameters | *PC1 | PC2 | PC3 |
|---|---|---|---|
| IL-10L | 0.9028 | 0.0520 | 0.0329 |
| IL-6L | 0.9581 | 0.0326 | 0.0001 |
| IL-10K | 0.9349 | 0.0365 | 0.0151 |
| IL-6K | 0.8983 | 0.0699 | 0.0074 |
| IL-10B | 0.9318 | 0.0198 | 0.0413 |
| IL-6B | 0.9642 | 0.0256 | 0.0000 |
| IL-10T | 0.8871 | 0.0137 | 0.0944 |
| IL-6T | 0.9294 | 0.0469 | 0.0127 |
| Eigen value | 7.4065 | 0.2970 | 0.2038 |
| Variability (%) | 92.5809 | 3.7128 | 2.5474 |
| Cummulative (%) | 92.5809 | 96.2937 | 98.8411 |
Bold figures are highly correlated coefficients;
and thus, the principal factors where L represents the liver, K = kidney, B = Brain, T = testis, PC1 = principal component 1, PC2 = principal component 2, and PC3 = principal component 3.
Figure 2.

Correlation plot of inflammatory parameters on male albino rats against the generated factors (F1 and F2) where IL-6T = testis interlukin-6, IL-6B = brain interlukin-6, IL-6K = kidney interlukin-6, IL-6L = liver interlukin-6, IL-10T = testis interlukin-10, IL-10B = brain interlukin-10, IL-10K = kidney interlukin-10, IL-10L = liver interlukin-10. Variables clustered together around the axes indicate component factor values with the highest correlation coefficient. Variables that form an acute angle have a very strong positive correlation between them, while variables at right angle have weak or no correlation between them. Also, any two variables that are opposite themselves have a negative correlation between them.
Figure 3.
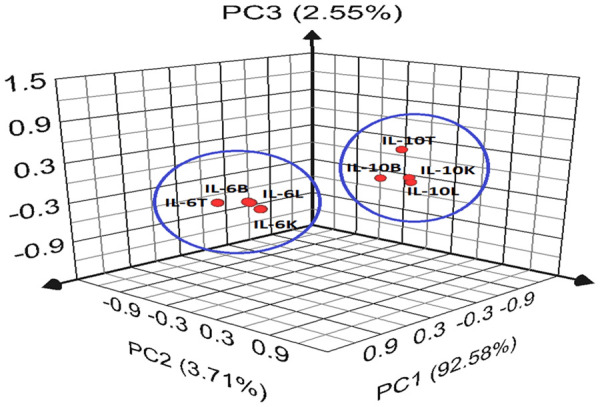
Score plot illustrating the differentiation of parameters associated with interactions among inflammatory markers where L represents the liver, K = kidney, B = Brain, T = testis, PC1 = principal component 1, PC2 = principal component 2, and PC3 = principal component 3. A three-dimensional component system explaining 98.84% of total variance was observed after the PC analysis.
Antioxidant and Lipid peroxidation assays
To determine the oxidative status in the organs after administration of the metal mixture, the lipid peroxidation marker, MDA, was evaluated. Treatment with a mixture of metals at 20 mg/kg PbCl2, 1.61 mg/kg CdCl2 and 0.40 mg/kg HgCl2 body weight for 90 consecutive days caused oxidative reactions in the organs. Table 5 showed that the level of MDA increased significantly (P < 0.05) in different organs of metal mixture-intoxicated rats compared to those of rats in the standard control group. Rats co-treated with Costus afer significantly showed reduced MDA level in a dose-dependent manner compared to metal mixture-treated rats.
Table 5.
Effect of Costus afer on oxidative stress markers (nMole/mg tissue) of liver, kidney, brain and testis of male albino rats treated with metal mixture
| Organs | Treatment | CAT | SOD | GSH | MDA |
|---|---|---|---|---|---|
| Liver | Deionized H2O (only) | 2.87±0.95a,b | 0.35±0.06a | 1.36±0.28b | 0.39±0.08c,d |
| Metal mixture (only) | 2.36±1.85a | 0.24±0.06a | 0.81±0.18a | 0.64±0.10e | |
| Metal mixture + 750 mg/kg CA | 5.64±3.39b,c | 0.33±0.06a | 1.04±0.07a | 0.45±0.11d | |
| Metal mixture + 1500 mg/kg CA | 6.08±1.84c | 0.54±0.08b | 1.35±0.24b | 0.24±0.04b | |
| Metal mixture + 2250 mg/kg CA | 9.18±1.90d | 0.82±0.12b | 1.82±0.20c | 0.12±0.03a | |
| Kidney | Distilled H2O (only) | 2.07±1.12a,b | 0.21±0.03a | 1.96±0.15b | 0.60±0.06c |
| Metal mixture (only) | 1.64±0.51a | 0.19±0.05a | 1.03±0.22a | 0.74±0.10d | |
| Metal mixture + 750 mg/kg CA | 2.80±2.05a,b | 0.23±0.06a | 1.17±0.06a | 0.60±0.11c | |
| Metal mixture + 1500 mg/kg CA | 4.00±1.79b,c | 0.42±0.06b | 1.66±0.15b | 0.34±0.04b | |
| Metal mixture + 2250 mg/kg CA | 5.07±0.89c | 0.63±0.14c | 2.30±0.30c | 0.18±0.06a | |
| Brain | Deionized H2O (only) | 0.43±0.15a | 0.11±0.01a | 2.74±0.24c | 0.81±0.08b,c |
| Metal mixture (only) | 0.36±0.14a | 0.09±0.02a | 1.58±0.15a | 0.89±0.04c | |
| Metal mixture + 750 mg/kg CA | 0.43±0.13a | 0.10±0.04a | 1.75±0.31a | 0.81±0.04b,c | |
| Metal mixture + 1500 mg/kg CA | 0.53±0.21a | 0.18±0.04b | 2.21±0.31b | 0.73±0.06b | |
| Metal mixture + 2250 mg/kg CA | 1.05±0.38b | 0.29±0.08c | 2.59±0.30c | 0.51±0.14a | |
| Testis | Deionized H2O (only) | 0.67±0.26a | 0.14±0.03a | 2.28±0.15b | 0.73±0.12b |
| Metal mixture (only) | 0.85±0.56a,b | 0.19±0.07a,b | 1.36±0.06a | 0.72±0.11b | |
| Metal mixture + 750 mg/kg CA | 0.56±0.13a | 0.19±0.07a,b | 1.36±0.07a | 0.64±0.14b | |
| Metal mixture + 1500 mg/kg CA | 1.68±0.59b,c | 0.25±0.04b | 2.14±0.25b | 0.58±0.10b | |
| Metal mixture + 2250 mg/kg CA | 2.18±1.01c | 0.42±0.06c | 2.31±0.27b | 0.32±0.06a |
Values are expressed as (Mean ± SD, N = 5). Values in the same column with different superscripts (a, b, c, d, e) are significantly different from each other (P < 0.05) and those with the same superscripts in the same column are not significantly different; where CA = Costus afer, CAT = catalase, SOD = superoxide dismutase, GSH = glutathione and MDA = malondialdehyde.
Concerning the effect on non-enzymatic (GSH) and enzymatic (SOD and CAT) antioxidant system activities in various organs, data presented in Table 5 shows that the exposure to low dose metal mixture induced a marked decline (P < 0.05) in GSH content, SOD and CAT levels when compared to the corresponding control rats. However, rats co-treated with Costus afer showed a rise in GSH, SOD and CAT levels when compared to the metal mixture-treated animals, representing the potent antioxidant capacities of Costus afer in the liver, kidney, brain and testis following metal mixture-induced oxidative damage.
After Varimax rotation, the factor loading of oxidative stress variables on significant principal components is presented in Table 6 and the correlation plot is shown in Figure 4. A score plot illustrating the differentiation of parameters associated with interactions among oxidative stress markers in different groups is presented in Figure 5. A three-dimensional component system explaining 83.89% of the total variance was observed after the principal component (PC) analysis.
Table 6.
Loadings of antioxidant profile variables on significant principal components after Varimax rotation
| Antioxidant parameters | *PC1 | *PC2 | *PC3 |
|---|---|---|---|
| CATL | 0.4799 | 0.1515 | 0.2966 |
| SODL | 0.8844 | 0.0007 | 0.0436 |
| GSHL | 0.5418 | 0.1682 | 0.0423 |
| MDAL | 0.7496 | 0.0153 | 0.0600 |
| CATK | 0.5021 | 0.0660 | 0.3624 |
| SODK | 0.8836 | 0.0113 | 0.0116 |
| GSHK | 0.6013 | 0.2959 | 0.0013 |
| MDAK | 0.8692 | 0.0000 | 0.0270 |
| CATB | 0.5563 | 0.0163 | 0.0014 |
| SODB | 0.8295 | 0.0301 | 0.0049 |
| GSHB | 0.2930 | 0.5406 | 0.0292 |
| MDAB | 0.8300 | 0.0328 | 0.0016 |
| CATT | 0.5340 | 0.0081 | 0.0037 |
| SODT | 0.7590 | 0.1189 | 0.0479 |
| GSHT | 0.4834 | 0.3789 | 0.0000 |
| MDAT | 0.7078 | 0.1214 | 0.0265 |
| Eigen value | 10.5049 | 1.9560 | 0.9600 |
| Variability (%) | 65.6557 | 12.2250 | 5.9998 |
| Cummulative (%) | 65.6557 | 77.8808 | 83.8806 |
Bold figures are highly correlated coefficients;
and thus, the principal factors where CAT = catalase, SOD = superoxide dismutase, GSH = glutathione, MDA = Malaondialdehyde, L = liver, K = kidney, B = brain, T = testis.
Figure 4.

Correlation plot of oxidative stress markers on male albino rats against the generated factors (F1 and F2) where SODT = testis superoxide dismutase, SODB = brain superoxide dismutase, SODK = kidney superoxide dismutase, SODL = liver superoxide dismutase, MDAT = testis malondialdehyde, MDAB = brain malondialdehyde, MDAK = kidney malondialdehyde, MDAL = liver malondialdehyde, CATT = testis catalase, CATB = brain catalase, CATK = kidney catalase, CATL = liver catalase, GSHT = testis reduced glutathione, GSHB = brain reduced glutathione, GSHK = kidney reduced glutathione and GSHL = liver reduced glutathione. Variables clustered together around the axes indicate component factor values with the highest correlation coefficient. Variables that form an acute angle have a very strong positive correlation between them, while variables at right angle have weak or no correlation between them. Also, any two variables that are opposite themselves have a negative correlation between them.
Figure 5.

Score plot illustrating the differentiation of parameters associated with interactions amo- ng oxidative stress markers where CAT = catalase, SOD = superoxide dismutase, GSH = glutathione, MDA = Malaondialdehyde, L = liver, K = kidney, B = brain, T = testis. A three-dimensional component system explaining 83.89% of the total variance was observed after PC analysis.
Assay of heavy metal concentrations
The heavy metal content on the liver, kidney, brain and testis of male albino rats treated with the metal mixture is shown in Table 7. After 90 days of treatment with 20 mg/kg of PbCl2, 1.61 mg/kg of CdCl2 and 0.40 mg/kg of HgCl2, the concentration of the metals increased as compared to the group receiving only deionized water and groups co-treated with Costus afer at 750 mg/kg, 1500 mg/kg and 2500 mg/kg.
Table 7.
Effect of Costus afer on heavy metal concentrations (mg/kg) in liver, kidney, brain and testis of male albino rats
| Organs | Treatment | Cd | Hg | Pb |
|---|---|---|---|---|
| Liver | Deionized H2O (only) | < 0.001±0.000a | < 0.001±0.000a | 0.392±0.552a |
| Metal mixture (only) | 0.782±0.133c | 0.305±0.039c | 90.992±13.284c | |
| Metal mixture + 750 mg/kg CA | 0.143±0.046b | 0.051±0.020b | 31.007±6.017b | |
| Metal mixture + 1500 mg/kg CA | 0.033±0.024a | 0.009±0.001a | 8.857±4.849a | |
| Metal mixture + 2250 mg/kg CA | 0.003±0.002a | 0.001±0.001a | 3.500±1.141a | |
| Kidney | Deionized H2O (only) | 0.001±0.001a | 0.002±0.001a | 0.730±0.730a |
| Metal mixture (only) | 5.430±0.383e | 6.559±0.190c | 77.375±9.123d | |
| Metal mixture + 750 mg/kg CA | 3.961±0.104d | 5.174±0.676e | 29.445±7.695c | |
| Metal mixture + 1500 mg/kg CA | 1.344±0.218c | 3.459±0.244d | 13.129±3.889b | |
| Metal mixture + 2250 mg/kg CA | 0.003±0.001a | 1.736±0.254b | 2.788±0.474a | |
| Brain | Deionized H2O (only) | < 0.001±0.000a | < 0.001±0.000a | 0.122±0.012a |
| Metal mixture (only) | 1.543±0.049c | 5.191±0.287d | 78.906±10.389d | |
| Metal mixture + 750 mg/kg CA | 0.274±0.200b | 3.873±0.389c | 39.278±5.966c | |
| Metal mixture + 1500 mg/kg CA | 0.055±0.033a | 1.534±0.385b | 12.063±1.308b | |
| Metal mixture + 2250 mg/kg CA | 0.002±0.001a | 0.007±0.001a | 3.507±1.560a,b | |
| Testis | Deionized H2O (only) | 0.003±0.002a | 0.002±0.001a | 0.047±0.022a |
| Metal mixture (only) | 0.745±0.168c | 0.081±0.004c | 39.501±4.728d | |
| Metal mixture + 750 mg/kg CA | 0.530±0.019b | 0.041±0.004b | 22.352±4.371c | |
| Metal mixture + 1500 mg/kg CA | 0.401±0.084b | 0.027±0.005b | 10.740±4.719b | |
| Metal mixture + 2250 mg/kg CA | 0.026±0.019a | 0.004±0.004a | 5.936±3.643a,b |
Values are expressed as (Mean ± SD). Values in the same column with different superscripts (a, b, c, d, e) are significantly different from each other (P < 0.05) and those with the same superscripts in the same column are not significantly different; where CA = Costus afer, Pb = lead, Cd = cadmium, Hg = mercury.
The dendrogram showing clustering of toxic metals interaction in the organs; Liver (L), Kidney (K), Brain (Br), Testis (T), Blood (Bl) is presented in Figure 6. Three clusters were distinctively identified which consist of CdL, PbL, HgL and CdBr (cluster 1), HgK and CdT (cluster 2), and CdK, HgBr, PbT, PbK, PbBr, PbBl, CdBl, HgT and HgBl (cluster 3). A parallel coordinates plot showing clustering of toxic metals interaction in different groups in shown in Figure 7.
Figure 6.
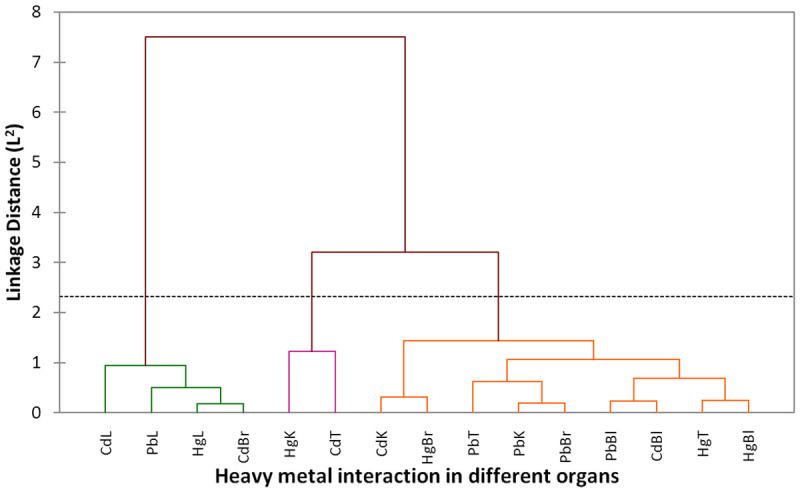
Dendrogram showing clustering of toxic metals interaction in different organs; Liver (L), Kidney (K), Brain (Br), Testis (T), Blood (Bl), Cd = cadmium, Pb = lead and Hg = mercury. Three clusters were distinctively identified which consist of CdL, PbL, HgL and CdBr (cluster 1), HgK and CdT (cluster 2), CdK, HgBr, PbT, PbK, PbBr, PbBl, CdBl, HgT and HgBl (cluster 3).
Figure 7.

A parallel coordinates plot showing comparison of toxic metals interaction in different groups where Liver (L), Kidney (K), Brain (Br), Testis (T), Blood (Bl), Cd = cadmium, Pb = lead and Hg = mercury. Four classes were distinctively identified which were made up of rats belonging to groups 1 and 5 (class 1), rats belonging to group 2 (class 2), rats belonging to group 3 (class 3) and rats belonging to group 4 (class 4). It was deduced that class 1 rats have the least values of the toxic metal contents, while class 2 has the maximum values for metal concentrations. Class 3 and 4 belong to the intermediate class showing that they have in-between values for the metal concentration with class 3 being higher than class 4.
Determination of the most and least affected organs
To evaluate the organ that was mostly affected by exposure to the mixture of metals, a statistical tool called the Bray Curtis disimilarity was used to calculate the distance between the treatment groups across the organs (liver, kidney, brain and testis). The input data include the antioxidant profile parameters (CAT, SOD, GSH and MDA), inflammatory cytokines (interleukin-6 and interleukin-10), and the heavy metal concentrations (Pb, Cd and Hg) for each of the organs. These set of data formed the input data because these parameters were assayed in all organs. The compositional dissimilarities between the organs were then plotted on principal component analysis showing 48.7% variability on PC1 and 29.5% variability on PC2 as presented in Figure 8.
Figure 8.

Principal component analysis plot showing the Bray Curtis distance across the different organs where MM = metal mixture, CA = Costus afer, PC1 = principal component 1 and PC2 = principal component 2. The distance connecting the metal mixture treated group is farthest to the deionized water treated group in the kidney compared to other organs thereby making it the most affected organ by the metal mixture.
Discussion
The study investigated the protective effect of Costus afer in the liver, kidney, brain and testis. When the body is exposed to xenobiotics such as heavy metals, chemicals or drugs, it becomes imperative for organs such as the liver and kidney to detoxify such substances. The liver is usually involved in the biotransformation of toxins to less toxic compounds through phase I and II reactions to enhance their elimination by kidneys [9]. In a disease state of the kidney, its detoxifying capacity is impaired. In the present study, toxicity of the kidney resulted in elevated concentrations of sodium, chloride and potassium in the serum and enlarged kidney weight. Absolute kidney weight is a relative sensitive indicator of kidney damage, with nephrotoxicity having been evidenced as enlarged kidney weight (either absolute or relative) by Bhattacharjee et al. [23]. Furthermore, there was an increase in the levels of blood urea nitrogen (BUN) and creatinine in the metal mixture treated group compared to the control group and Costus afer co-treated group. It is worthy to note that the Costus afer protective effect was dose-dependent.
A significant elevation of serum K+, Na+, BUN, and creatinine in negative control animals compared to the normal rats was evidenced in cyclosporina- (Csa-) induced nephrotoxicity animal model. A study by Ezejiofor et al. [24] indicates that oral administration of aqueous Costus afer leaf extract showed a significant dose-dependent reduction of serum BUN and K+. In a gentamicin-induced nephrotoxicity model involving oral administration of aqueous Costus afer leaf extract, there was a significant decrease in sodium, blood urea level, and serum creatinine level. There was as well a significant decrease in serum potassium concentration, which occurred in a dose-dependent manner. The low and medium dose of aqueous leaf extract of Costus afer reversed the deleterious effect of gentamicin on the kidney [3]. In the present study, Costus afer-treated rats regained their normal kidney morphology with decreased kidney weight, decreased Na+, Cl-, K+, BUN and creatinine levels. This depicts the fact that Costus afer leaves have nephroprotective property.
The potentiality of the protective effect of aqueous leaf extract of Costus afer was also further investigated in this study. The study showed that the liver enzymes and bilirubin levels increased in rats treated with only the metal mixture compared to the control rats. Additionally, the heavy metal mixture reduced the total protein and albumin levels in rats. However, co-treatment with Costus afer caused a significant decrease (P < 0.05) in liver enzyme levels (aspartate and alanine aminotransferases) and bilirubin levels and caused a significant increase in total protein and albumin levels. These changes caused by Costus afer were dose-dependent. A study demonstrated that Costus afer stem extract possesses the ability to protect against alcohol-induced liver damage in rats indicating that Costus afer has pharmacological activity against alcohol liver cirrhosis [25]. A significant increase was also observed in the liver weight of rats treated with the heavy metal mixture. Since an elevation or decline in either absolute or relative weight of an organ after administering a chemical is a sign of the toxic effect of that chemical, this study confirms that the kidney and liver could be among the target organs for exposure to a mixture of lead, cadmium and mercury after a subchronic exposure [23,26].
The individual roles of the liver, kidney, brain and testis are so critical that there is a need to protect them from damage. The kidney helps to remove waste products and excess fluid from the body, while the liver primarily processes nutrients from food, makes bile, removes toxins from the body and builds proteins. The brain controls our thoughts, memory and speech, movement of the arms and legs, and the function of many organs within our body. The testes are very important to the male reproductive system because they produce sperm and secrete hormones particularly, testosterone. One of the causes of damage to these organs is oxidative stress and the damaging effect of free radicals to these organs is increased during exposure to xenobiotics such as heavy metals, toxins and drugs. Almost all the pharmacological effects observed in the chemical-induced organ damage models have been attributed to antioxidant or free radical scavenging potential as demonstrated by Tchamgoue et al. [27]. The present study has demonstrated the antioxidant abilities of Costus afer in male albino rats. The aqueous leaf extract of Costus afer caused a significant increase (P < 0.05) in catalase (CAT), superoxide dismutase (SOD) and reduced glutathione (GSH), and a significant decrease (P < 0.05) in malondialdehyde (MDA), a lipid peroxidation marker, compared to the heavy metal mixture-treated rats.
In the antioxidant profile parameters of male albino rats treated with low dose heavy metal mixture of Pb, Cd and Hg, sixteen principal factors (F1-F16) explained 100% cumulative variations. The first component (PC1) accounted for 65.66%, PC2 accounted for 12.23% of the total variance, while PC3 occupied only 6.0% of the total variance. Factors 1 and 2 (F1 and F2) had Eigenvalue > 1 explaining 77.89% of the total variation, while factor 3 (F2 and F3) had Eigenvalues < 1 explaining 6.0% of the total variation. Variables clustered together around the axes indicate component factor values with the highest correlation coefficient. Variables that form an acute angle have a very strong positive correlation between them, while variables at right angle have weak or no correlation between them. Also, any two variables that are opposite themselves have a negative correlation between them.
PC1 showed high loadings on CATL, SODL, GSHL, MDAL, CATK, SODK, GSHK, MDAK, CATB, SODB, MDAB, CATT, SODT, GSHT, and MDAT with the highest loading on SODL followed by SODK. PC2 showed high loading on GSHB after varimax rotation. MDA showed a negative correlation with other variables (SOD, CAT and GSH). SODK and SODL showed a positively strong relationship (r = 0.9385), SODK and SODB showed a relationship of 0.8975, while SODK and SODT showed 0.8776 correlation. CATL showed (r = 0.8839) relationship with CATK, 0.5036 correlation with CATB and 0.5105 relationship with CATT. GSHL showed 0.7969 correlations with GSHK, 0.7251 with GSHB and 0.6370 with GSHT. MDAL had 0.8934 relationships with MDAK, 0.7683 with MDAB and 0.6805 with MDAT.
Many studies have demonstrated the in vitro and in vivo antioxidant abilities of Costus afer. In an in vivo study on cardiac toxicity, for example, there was a significant reduction in lipid peroxidation, improvement in lipid profile, and increase in antioxidant activity [28]. Whereas, there was an improvement in the activity of superoxide dismutase (SOD), catalase (CAT), and glutathione S-reductase (GSR) which shows that Costus afer extract renders cardiac protection against toxicity [28]. In an in vivo nephrotoxicity model, Costus afer aqueous leaf extract significantly resulted in an increase in GSH, CAT, SOD, and GST (glutathione S-transferase) activity in rats [24]. Another study reported by Ezejiofor and Orisakwe also noticed the ability of Costus afer in lead-induced kidney damage model [29]. The study observed a significant reversal in the decreased levels of glutathione peroxidase (GSH-PX), superoxide dismutase (SOD), catalase (CAT), glutathione S-transferase activity (GST) seen in the lead acetate only treated group [29]. All these data depict the fact that Costus afer could be considered in the drug discovery pipeline as a candidate for protective agent against liver, kidney, brain, heart, testicles, and mitochondrial damage.
Inflammation can be defined as the body’s attempt at self-protection with the aim of removing harmful stimuli including damaged cells, irritants, or pathogens [30]. It is one of the first lines of defense the body adapts to localize and destroy invaded microorganisms or neutralizes chemical toxins. Cytokines attract immune cells to an injury site or infection. Oxidative stress induces several health risks and pertinent to this, it activates persistent neuroinflammation, which is distinguished by pro-inflammatory mediators locally produced by host cells, thus engaging the intrinsic immune system [31]. Thus, the poise between pro- and anti-inflammatory factors determines the basis of the inflammatory response, oxidative stress level and resultant neurodegeneration according to Bethea [32]. In this study, the aqueous leaf extract of Costus afer caused a significant increase (P < 0.05) in interleukin-10 (IL-10) and a significant reduction (P < 0.05) in interleukin-6 (IL-6) compared to the heavy metal mixture treated rats.
A parallel coordinates plot of inflammatory cytokines showing the relationship between the variables comprises of three classes; class 1 which include rats in groups 1 and 5, class 2 comprising of rats in group 2, and class 3 which include rats in groups 3 and 4. It was deduced that class 1 rats have high IL-10 in the organs with low IL-6 levels, while class 2 rats have low IL-10 in the organs with high IL-6 levels. Class 3 rats fit into the intermediate class showing that they have in-between values for the inflammatory cytokines. In the inflammatory parameters of rats treated with low dose heavy metal mixture of Pb, Cd and Hg, eight principal factors (F1-F8) explained 100% cumulative variations. The first component (PC1) accounted for 92.58%, PC2 accounted for 3.71% of the total variance, while PC3 occupied only 2.55% of the total variance. Factor 1 (F1) had Eigenvalue > 1 explaining 92.58% of the total variance, while factors 2 and 3 (F2 and F3) had Eigenvalues < 1 explaining 6.26% of the total variation. Variables clustered together around the axes indicate component factor values with the highest correlation coefficient. Variables that form an acute angle have a very strong positive correlation between them, while variables at right angle have weak or no correlation between them. Also, any two variables that are opposite themselves have a negative correlation between them.
Strong associations of above 0.90 were observed with the highest loadings on PC1. This indicates that they positively influence PC1 in the same manner after Varimax rotation. IL-6B and IL-6L had approximately 96% factor loading on PC1. A positively strong correlation was observed between IL-10 level in the liver and IL-10 levels in the kidney, brain and testis as (r = 0.9780, 0.9166, 0.8645) respectively. Also, a positively strong relationship was observed between IL-6 level in the liver and IL-6 levels in the kidney, brain and testis as (r = 0.9657, 0.9904, 0.9115), respectively. Furthermore, a negative relationship was observed between IL-10 and IL-6 levels in the organs such that as the value of IL-10 decreases, IL-6 value increases and vice versa. This implies that IL-10 and IL-6 have an inverse relationship.
Moody and Okwagbe had hinted that the chloroform and methanol extracts from the aerial parts displayed a noteworthy reduction in carrageenan-induced rat paw edema, while the methanol extract of the rhizome exhibited marked topical anti-inflammatory effect in croton aldehyde-induced mouse ear edema [33]. Anyasor et al. linked the anti-inflammatory effects to a boost in the antioxidant status in vivo [34]. The in vivo antioxidant study showed that Costus afer hexane extract-treated animals had a marked elevation in the levels of GSH, SOD, CAT, and GST activities while the level of MDA was significantly reduced in the plasma, liver, kidney, and brain. These reports on anti-inflammatory experiments seem to provide some evidence to support the traditional use of Costus afer extract for inflammations. Unreservedly, the plant could be considered as a drug candidate in inflammatory drug development.
Costus afer tended to bring about chelation of lead, cadmium and mercury as evidenced by the reduced levels of these metals in the treatment groups. It is now postulated that a novel therapeutic approach to suppress oxidative stress should be based on the development of dual function antioxidants comprising not only chelating, but also scavenging components since paradoxically, two major antioxidant enzymes, superoxide dismutase (SOD) and catalase contain as an integral part of their active sites metal ions to battle against toxic effects of metal-induced free radicals [35]. Costus afer fits into this novel therapeutic approach.
The dendrogram showed the clustering of toxic metals interaction in various organs; Liver (L), Kidney (K), Brain (Br), Testis (T), Blood (Bl). Three clusters were distinctively recognized which consists of CdL, PbL, HgL and CdBr (cluster 1), HgK and CdT (cluster 2), and CdK, HgBr, PbT, PbK, PbBr, PbBl, CdBl, HgT and HgBl (cluster 3). The variables identified in each cluster are more directly correlated to each other than other clusters. A parallel coordinates plot of toxic metals showing the connection between the variables is represented and the plot comprises of four classes; class 1 which include rats in groups 1and 5, class 2 comprising of rats in group 2, class 3 comprising of rats in group 3 and class 4 which include rats in groups 4. It was deduced that class 1 rats have the least values of the toxic metal contents, while class 2 has the maximum values for metal concentrations. Class 3 and 4 belong to the intermediate class showing that they have in-between values for the metal concentration with class 3 being higher than class 4.
Mercury is an ever-present environmental toxicant known to cause infertility in men. Studies with experimental models revealed that mercury induces abnormalities in sperm morphology and motility [36]. A pilot case-control study in Hong Kong revealed that subfertile men with sperm abnormalities had higher blood mercury concentrations than the fertile men [37]. The nervous system is the most susceptible and primary target for lead-induced toxicity [13]. Lead exposure also causes chronic harm in adults including hypertension and kidney damage [38]. The liver is the chief target organ of Cd toxicity following both short and long-term exposure. Harmful toxic metals like Cd are metabolized and excreted directly into bile for further detoxification. Inside the small intestine, some are excreted through faeces and the rest redistributed to the organs [39]. The strong correlations between these toxic metals in liver, kidney, brain, testis and blood of rats after exposure to metal mixtures, show close physiological connection between the metals as also reported by Krebs et al. [40].
The findings from this study also showed that the kidney was the most affected organ followed by the liver, and then the brain and testis after exposure to a mixture of Pb, Cd and Hg (i.e. damage to kidney > liver > brain > testis) based on the calculated distance between the toxic control (treated with only the metal mixture) and the normal control (treated with only deionized water) groups. The distance connecting the metal mixture treated group is farthest to the deionized water treated group in the kidney compared to other organs. This also is signified by the size of the eclipse across the organs. It is visible that the eclipse size of the kidney is the biggest and that of the testis, smallest. This study has proven that exposure to low dose heavy metal mixture for 90 consecutive days could cause some multi-organ pathological damages in this descending severity: kidney, liver, brain and testis. The kidney is the most affected and the testis is the least affected.
In conclusion, heavy metals can cause hepatotoxicity, nephrotoxicity, neurotoxicity and testicular damage after exposure for 90 days even at a low dose. Co-treatment with Costus afer could protect against hepatotoxicity, nephrotoxicity, neurotoxicity and testicular injuries caused by exposure to the metal mixture. Hence, the findings indicate the potential hepatoprotective, nephroprotective, neuroprotective and reproprotective effects of the plant extract. This suggests that Costus afer may be a potential nutraceutical in the management of low dose heavy metal mixture exposure as obtainable in occupational settings.
Acknowledgements
We acknowledge the help of the statisticians (Dr. Chinedu Obieze and Mr. Nelson Eyenike) for the data analysis. Also, we thank ACE-CEFOR for partially supporting this work financially.
Disclosure of conflict of interest
None.
References
- 1.Anaga AO, Njoku CJ, Ekejiuba ES, Esiaka MN, Asuzu IU. Investigations of the methanolic leaf extract of costus afer. Ker for pharmacological activities in vitro and in vivo. Phytomedicine. 2004;11:242–8. doi: 10.1078/0944-7113-00349. [DOI] [PubMed] [Google Scholar]
- 2.Iwu MM. Handbook of African medicinal plants. CRC press; 2014. [Google Scholar]
- 3.Ezejiofor AN, Orish CN, Orisakwe OE. Costus afer ker gawl leaves against gentamicin-induced nephrotoxicity in rats. Iran J Kidney Dis. 2014;8:310. [PubMed] [Google Scholar]
- 4.Ezejiofor AN, Orisakwe OE. Assessment of the hepatoprotective and antioxidant effect of aqueous leaf extract of costus afer “ker gawl” on cyclosporine a induced hepatotoxicity. Toxicol Int. 2015;22:83–91. [Google Scholar]
- 5.Ijioma SN, Nwosu CO, Emelike CU, Okafor AI, Nwankwo AA. Antinociceptive property of Costus afer Ker stem juice and ethanol leaf extract in albino rats. Comprehensive Journal of Medical Sciences. 2014;2:14–9. [Google Scholar]
- 6.Emeh CC, Abbey BW, Essien EB. Hypolipidemic activity of aqueous extract of costus afer stem in diet induced hyperlipidemic rats: arch. of app. Sci Res. 2014;6:55–62. [Google Scholar]
- 7.Akpan MM, Odeomena CS, Nwachukwu CN, Danladi B. Antimicrobial assessment of ethanolic extract of costus afer leaves. Asian J Plant Sci Res. 2012;2:335–41. [Google Scholar]
- 8.Ezejiofor AN, Udowelle NA, Orisakwe OE. Nephroprotective and antioxidant effect of aqueous leaf extract of costus afer ker gawl on cyclosporin-a (Csa) induced nephrotoxicity. Clinical Phytoscience. 2017;2:11. [Google Scholar]
- 9.Anyanwu BO, Ezejiofor AN, Igweze ZN, Orisakwe OE. Heavy metal mixture exposure and effects in developing nations: an update. Toxics. 2018;6:65. doi: 10.3390/toxics6040065. [DOI] [PMC free article] [PubMed] [Google Scholar]
- 10.Eom SY, Lee YS, Lee SG, Seo MN, Choi BS, Kim YD, Lim J, Hwang MS, Kwon HJ, Kim YM, Hong YS. Lead, mercury, and cadmium exposure in the Korean general population. J Korean Med Sci. 2017;33:e9. doi: 10.3346/jkms.2018.33.e9. [DOI] [PMC free article] [PubMed] [Google Scholar]
- 11.Faroon O, Ashizawa A, Wright S, Tucker P, Jenkins K, Ingerman L, Rudisill C. Toxicological profile for cadmium. Atlanta (GA): Agency for Toxic Substances and Disease Registry (US); 2012. Sep, [PubMed] [Google Scholar]
- 12.Agency for Toxic Substances and Disease Registry. Toxicological Profile for Cadmium. Atlanta, GA, USA: Agency for Toxic Substances Disease Registry; 2008. [Google Scholar]
- 13.Flora G, Gupta D, Tiwari A. Toxicity of lead: a review with recent updates. Interdiscip Toxicol. 2012;5:47–58. doi: 10.2478/v10102-012-0009-2. [DOI] [PMC free article] [PubMed] [Google Scholar]
- 14.Tumpa SI, Hossain MI, Ishika T. Ethnomedicinal uses of herbs by indigenous medicine practitioners of Jhenaidah district, Bangladesh. Journal of Pharmacognosy and Phytochemistry. 2014;3:23–33. [Google Scholar]
- 15.Nanyingi MO, Mbaria JM, Lanyasunya AL, Wagate CG, Koros KB, Kaburia HF, Munenge RW, Ogara WO. Ethnopharmacological survey of Samburu district, Kenya. J Ethnobiol Ethnomed. 2008;4:14. doi: 10.1186/1746-4269-4-14. [DOI] [PMC free article] [PubMed] [Google Scholar]
- 16.Ezejiofor AN, Orisakwe OE. Evaluation of protective effect of aqueous leave extract of costus afer on female albino Wistar rats exposed to lead acetate. EC Pharmacol Toxicol. 2017;4:75–92. [Google Scholar]
- 17.Institóris L, Kovács D, Kecskemeti-Kovacs I, Lukács A, Szabó A, Lengyel Z, Papp A, Nagymajtényi L, Dési I. Immunotoxicological investigation of subacute combined exposure with low doses of Pb, Hg and Cd in rats. Acta Biologica Hungarica. 2006;57:433–9. doi: 10.1556/ABiol.57.2006.4.5. [DOI] [PubMed] [Google Scholar]
- 18.Clairborne A, Greenwald RA. Handbook of methods for oxygen radical research. InCatalase Activity. 1985:283–284. [Google Scholar]
- 19.Sedlak J, Lindsay RH. Estimation of total, protein-bound, and nonprotein sulfhydryl groups in tissue with Ellman’s reagent. Analytical Biochem. 1968;25:192–205. doi: 10.1016/0003-2697(68)90092-4. [DOI] [PubMed] [Google Scholar]
- 20.Misra HP, Fridovich I. The role of superoxide anion in the autoxidation of epinephrine and a simple assay for superoxide dismutase. J Biol Chem. 1972;247:3170–5. [PubMed] [Google Scholar]
- 21.Ohkawa H, Ohishi N, Yagi K. Assay for lipid peroxides in animal tissues by thiobarbituric acid reaction. Anal Biochem. 1979;95:351–8. doi: 10.1016/0003-2697(79)90738-3. [DOI] [PubMed] [Google Scholar]
- 22.Ricotta C, Podani J. On some properties of the bray-curtis dissimilarity and their ecological meaning. Ecological Complexity. 2017;31:201–5. [Google Scholar]
- 23.Bhattacharjee T, Bhattacharjee S, Choudhuri D. Hepatotoxic and nephrotoxic effects of chronic low dose exposure to a mixture of heavy metals-lead, cadmium and arsenic. Int J Pharm Chem Biol Sci. 2016;6:39–47. [Google Scholar]
- 24.Ezejiofor AN, Udowelle NA, Orisakwe OE. Nephroprotective and antioxidant effect of aqueous leaf extract of costus afer Ker gawl on cyclosporin-a (Csa) induced nephrotoxicity. Clinical Phytoscience. 2017;2:11. [Google Scholar]
- 25.Tonkiri A, Essien ES, Akaninwor JO. Evaluation of hepatoprotective and in vivo antioxidant activity of the methanolic stem extract of costus afer (bush cane) in alcohol induced liver cirrhosis in rats. J Biol Food Sci Res. 2014;3:29–34. [Google Scholar]
- 26.Orisakwe OE, Husaini DC, Afonne OJ. Testicular effects of sub-chronic administration of Hibiscus sabdariffa calyx aqueous extract in rats. Reprod Toxicol. 2004;18:295–8. doi: 10.1016/j.reprotox.2003.11.001. [DOI] [PubMed] [Google Scholar]
- 27.Tchamgoue AD, Tchokouaha LR, Tsabang N, Tarkang PA, Kuiate JR, Agbor GA. Costus afer protects cardio-, hepato-, and reno-antioxidant status in streptozotocin-intoxicated wistar rats. Biomed Res Int. 2018;2018:1–9. doi: 10.1155/2018/4907648. [DOI] [PMC free article] [PubMed] [Google Scholar]
- 28.Njoku UO, Nwodo OF, Ogugofor MO. Cardioprotective potential of methanol extract of Costus afer leaf on carbon tetrachloride-induced cardiotoxicity in Albino rats. Asian Journal of Pharmaceutical Research and Health Care. 2017;9:51–8. [Google Scholar]
- 29.Ezejiofor AN, Orisakwe OE. Nephroprotective effect of costus afer on lead induced kidney damage in albino rats. Int J Physiol Pathophysiol Pharmacol. 2019;11:36. [PMC free article] [PubMed] [Google Scholar]
- 30.Boison D, Adinortey CA, Babanyinah GK, Quasie O, Agbeko R, Wiabo-Asabil GK, Adinortey MB. Costus afer: a systematic review of evidence-based data in support of its medicinal relevance. Scientifica. 2019;2019:1–10. doi: 10.1155/2019/3732687. [DOI] [PMC free article] [PubMed] [Google Scholar]
- 31.Salim S, Chugh G, Asghar M. Inflammation in anxiety. Adv Protein Chem Struct Biol. 2012;88:1–25. doi: 10.1016/B978-0-12-398314-5.00001-5. [DOI] [PubMed] [Google Scholar]
- 32.Bethea JR. Spinal cord injury-induced inflammation: a dual-edged sword. Prog Brain Res. 2000;128:33–42. doi: 10.1016/S0079-6123(00)28005-9. [DOI] [PubMed] [Google Scholar]
- 33.Moody JO, Okwagbe KE. Topical anti-inflammatory activity of costus afer. Niger J Nat Prod Med. 2003;7:46–8. [Google Scholar]
- 34.Anyasor GN, Onajobi F, Osilesi O, Adebawo O, Oboutor EM. Anti-inflammatory and antioxidant activities of costus afer ker gawl. hexane leaf fraction in arthritic rat models. J Ethnopharmacol. 2014;155:543–51. doi: 10.1016/j.jep.2014.05.057. [DOI] [PubMed] [Google Scholar]
- 35.Jomova K, Valko M. Advances in metal-induced oxidative stress and human disease. Toxicology. 2011;283:65–87. doi: 10.1016/j.tox.2011.03.001. [DOI] [PubMed] [Google Scholar]
- 36.Mocevic E, Specht IO, Marott JL, Giwercman A, Jönsson BA, Toft G, Lundh T, Bonde JP. Environmental mercury exposure, semen quality and reproductive hormones in Greenlandic Inuit and European men: a cross-sectional study. Asian J Androl. 2013;15:97. doi: 10.1038/aja.2012.121. [DOI] [PMC free article] [PubMed] [Google Scholar]
- 37.Choy CM, Yeung QS, Briton-Jones CM, Cheung CK, Lam CW, Haines CJ. Relationship between semen parameters and mercury concentrations in blood and in seminal fluid from subfertile males in Hong Kong. Fertil Steril. 2002;78:426–8. doi: 10.1016/s0015-0282(02)03232-6. [DOI] [PubMed] [Google Scholar]
- 38.World Health Organization. Chemicals of public health concern in the African region and their management: regional assessment report. 2015
- 39.Boening DW. Ecological effects, transport, and fate of mercury: a general review. Chemosphere. 2000;40:1335–51. doi: 10.1016/s0045-6535(99)00283-0. [DOI] [PubMed] [Google Scholar]
- 40.Krebs N, Langkammer C, Goessler W, Ropele S, Fazekas F, Yen K, Scheurer E. Assessment of trace elements in human brain using inductively coupled plasma mass spectrometry. J Trace Elem Med Biol. 2014;28:1–7. doi: 10.1016/j.jtemb.2013.09.006. [DOI] [PubMed] [Google Scholar]