Canadians will spend more than $12 billion on prescription drugs this year, more than 5 times the annual amount spent in the mid-1980s and as much as is now spent for physicians' services.1 Pharmaceutical price indexes reported by Statistics Canada and the Patented Medicine Prices Review Board indicate that inflation has been relatively slow in the pharmaceutical sector, which has led some to conclude that drug utilization has driven most of the expenditure growth in recent years.1,2 Students of physician behaviour and the pharmaceutical industry may read these data as evidence of a dramatic increase in prescribing rates. However, such inferences are based on economic statistics that do not necessarily relate to the actual number of drug courses prescribed.3 Trends in the use and cost of prescription drugs by community-dwelling senior citizens in British Columbia illustrate the problem.
Records for the more than 64 million prescriptions dispensed to beneficiaries of British Columbia's Pharmacare plan A over the period 1987 to 1999 were used to explore trends in the use and costs of drugs. Pharmacare plan A covers the cost of prescription drugs, excluding dispensing fees, purchased by residents 65 years of age and older, except those in hospitals and long-term care facilities. From 1987 to 1999, prescription drug costs per beneficiary of plan A grew from $192 to $479, a 150% increase. Over the same period, price inflation was virtually zero. A standard economic price index for Pharmacare plan A would track a sales-weighted average of price movements for individual drugs (by strength and dosage form) purchased over the period. Such an index rose by 21% between 1987 and 1993 and fell back to the 1987 level by 1999, largely because increased use of generic drugs incited by a 1994 generic substitution policy reduced the price of drug products available in generic form.4 Given the lack of overall price change, standard economic inference leads to the conclusion that “utilization” per beneficiary grew by 150%, which would explain all of the expenditure growth between 1987 and 1999. However, the number of prescriptions per beneficiary grew by only 15% over this period. The difference between the economic inference and the actual rate of prescribing is due to changes in the types of drugs prescribed over time and, most importantly, in how the economic utilization measure responds to such changes when there are differences in the cost of new and old products.
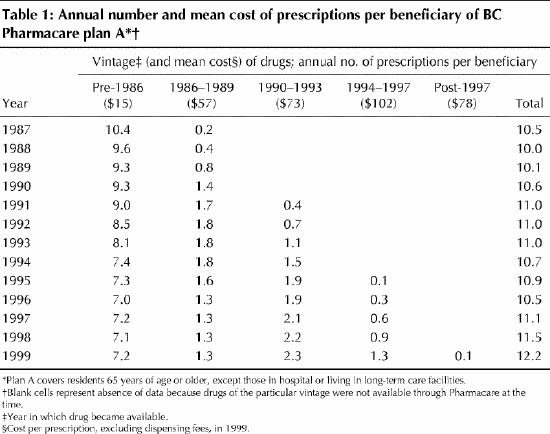
Table 1 presents the annual number of prescriptions per plan A beneficiary. Prescriptions are grouped by product vintage, as determined by the year in which each drug was first available through Pharmacare. In 1999 the cost per prescription, excluding dispensing fees, varied by almost 700% across the vintages of product prescribed, in part because of differences in the availability of generic equivalents. Perhaps surprisingly, the oldest drugs — those available before 1986 — were used with significant frequency over the entire period. In 1999, at least 15 years after they first became available, these products continued to account for more than 60% of prescriptions.
Table 1

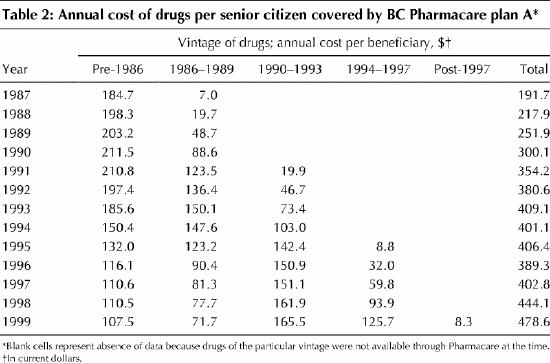
The gradual reduction in the prescribing rate for older products was offset by increased use of newer products. While the overall number of prescriptions per beneficiary increased by only 15%, the cost impact of changes in the vintage of products prescribed was significant (Table 2). In terms of cost, older products accounted for only 22% of the 1999 totals, although they accounted for a substantial proportion of the number of prescriptions.
Table 2

Because newer drugs tend to be more costly than older ones, they are weighted more heavily in standard economic measures of utilization. Thus, the substitution of newer for older drugs gives the impression that physicians are prescribing more frequently. Economists rationalize such inferences on the assumption that newer medicines are “better” because they are more expensive. “Better” medicines, so defined, deliver “more” therapy (or consumer utility, as economists are wont to describe it), which is why economic measures of utilization increase when higher-cost drugs are used in place of lower-cost ones.
The standard economic methods of inferring utilization trends ignore the value (and savings) created by physicians who appropriately prescribe older, low-cost medicines. Despite their low price, appropriately prescribed older medicines can sometimes generate unparalleled therapeutic value (e.g., hydrochlorothiazide for uncomplicated hypertension5). Analysts must therefore be sure that “better” (as inferred by cost) really means “more” (in terms of appropriate and cost-effective drug utilization) when reporting and interpreting economic trends in the pharmaceutical sector. Failure to do so will result in policy misguided by inappropriate measures of prescribing trends and associated costs.
Footnotes
This article has been peer reviewed.
Acknowledgements: This research was supported in part by a postdoctoral fellowship from the Canadian Institutes of Health Research. Data were extracted at the Centre for Health Services and Policy Research, University of British Columbia, with permission of the British Columbia Ministry of Health and Ministry Responsible for Seniors.
Competing interests: None declared.
Correspondence to: Dr. Steve Morgan, 109-2250 Wesbrook Mall, Vancouver BC V6T 1W6; fax 604 822-1370; morgan@chspr.ubc.ca
References
- 1.Canadian Institute for Health Information. Drug expenditures in Canada 1985–2000. Ottawa: The Institute; 2001.
- 2.Patented Medicine Prices Review Board. Patented Medicine Prices Review Board: annual report 1999. Ottawa: Health Canada; 2000.
- 3.Anderson GM, Kerluke KJ, Pulcins IR, Hertzman C, Barer ML. Trends and determinants of prescription drug expenditures in the elderly: data from the British Columbia Pharmacare Program. Inquiry 1993;30(2):199-207. [PubMed]
- 4.Grootendorst PL, Goldsmith L, Hurley J, O'Brian B, Dolovich L. Financial incentives to dispense low cost drugs: a case study of British Columbia Pharmacare [report for Health System and Policy Division, Health Canada]. Hamilton: McMaster University; 1996.
- 5.Wright JM. Choosing a first-line drug in the management of elevated blood pressure: What is the evidence? 1: Thiazide diuretics. CMAJ 2000;163(1):57-60. Available: www.cma.ca/cmaj/vol-163/issue-1/0057.htm [PMC free article] [PubMed]


