Abstract
Hyperuricemia, the high uric acid (UA) state in blood, has been accepted as an important risk factor for gout. The liver is a main factory of UA production. In the present study, we have examined the effects of three kinds of flavonol and flavones as typical aglycons, i.e., quercetin, luteolin, apigenin, their glycosides and related compounds, on UA productivity in cultured hepatocytes, adopting allopurinol as the positive control drug. Quercetin, luteolin, diosmetin (4′-O-methylluteolin) and apigenin at 10, 30 and 100 μM as well as allopurinol at 0.1, 0.3 and 1 μM dose-dependently and significantly decreased UA production in the hepatocytes, when compared with 0 μM (control). Both rutin (quercetin-3-O-rutinoside) and quercitrin (quercetin-3-O-ramnoside) significantly reduced UA production in the hepatocytes at 100 μM. Luteolin glycosides such as orientin (luteolin-8-C-glucoside) and isoorientin (luteolin-6-C-glucoside) exerted no influences on it even at 100 μM. Likewise, apigenin glycosides such as vitexin (apigenin-8-C-glucoside) and isovitexin (apigenin-6-C-glucoside) showed no inhibitory effect on it, while apigetrin (apigenin-7-O-glucoside) significantly reduced it at 100 μM. In model mice with purine bodies-induced hyperuricemia, allopurinol completely suppressed the hyperuricemia at a dose of 10 mg/kg body weight. Rutin suppressed significantly the hyperuricemia at a dose of 300 mg/kg body weight, while vitexin showed no significant effect up to 300 mg/kg body weight. Thus, rutin (O-glycoside) is demonstrated to be hypouricemic in both cultured hepatocytes and model mice with recently contrived purine bodies-induced hyperuricemia.
Keywords: AML12 hepatocytes, Hyperuricemia, Purine body, Quercetin, Rutin, Uric acid
Introduction
Hyperuricemia is the state characterized by high uric acid (UA) levels in blood (serum or plasma) and results from the balance between UA production mainly in the liver and its excretion from the body mainly via the kidney (Ishikawa et al. 2013). The high UA state in blood has been accepted as an important risk factor for gout (Richette and Bardine 2012; Bardine and Richette 2014; Abeles 2015). Hyperuricemia has also been suggested to increase the risk of other symptoms such as hypertension, kidney disease and metabolic syndrome (Choi et al. 2005; Abeles 2015; Babio et al. 2015).
The association of chronic intake of purine-rich foods and gout incidence is well established (Choi et al. 2004). Recently, a positive correlation has been reported between blood high UA levels and insulin resistance in vitro (Zhu et al. 2014) and in vivo (Adachi et al. 2017a), this leading to aggravation of type 2 diabetes or vice versa.
The liver and hence hepatocytes are recognized as main factory of UA production in mammals. Xanthine oxidase (XO) is the key enzyme of UA production (Ishikawa et al. 2013). We have thus far contrived assay systems for screening food and natural substances that have antihyperuricemic activities, adopting both cultured AML12 hepatocytes (Petrie et al. 2013) to estimate in vitro UA productivity and novel model mice with purine bodies-induced hyperuricemia to estimate in vivo efficacy (Adachi et al. 2017b). Employing the combination assay systems in vitro and in vivo, we have found so far that two kinds of phytochemicals, namely taxifolin and isorhamnetin, are capable of suppressing both UA production in the hepatocytes and purine bodies-induced hyperuricemia in mice (Adachi et al. 2017c, 2019).
Buckwheat seeds have been reported to contain various phytochemicals such as rutin, vitexin, isovitexin, orientin, isoorientin, and the contents of these glycosides, especially rutin, were shown to gradually increase during germinating buckwheat seeds (Zhang et al. 2015). In the present study, we have examined the effects of three kinds of flavonol and flavones as typical aglycons present in buckwheat seeds, i.e., quercetin, luteolin, apigenin, and their glycosides and related compounds, on UA productivity in cultured AML12 hepatocytes. Direct inhibitory effects of three aglycons and their related compounds (O-glycosides and C-glycosides) on XO (50% inhibitory concentration, IC50) were also measured in vitro to obtain information on precious candidate compounds for in vivo efficacy evaluation in mice with purine bodies-induced hyperuricemia.
Materials and methods
Materials
AML12 cells were provided by American Type Culture Collection (ATCC® CRL2254, Manassas, VA, USA). Vitexin (apigenin-8-C-glucoside) was purchased from AdipoGen Life Sciences, Inc. (San Diego, CA, USA), luteolin from Cayman Chemical Co. (Ann Arbor, MI, USA), DMEM/F-12 from Life Technologies (Grand Island, NY, USA), fetal bovine serum (FBS) from Hyclone (Logan, UT, USA), penicillin and streptomycin from Nacalai Tesque, Inc. (Kyoto, Japan), Pierce™ BCA Protein Assay kit from Thermo Fisher Scientific Inc. (Waltham, MA, USA). Diosmetin (4′-O-methylluteolin) and isoquercitrin (quercetin-3-O-glucoside) were purchased from AdooQ BioScience, LLC. (Irvine, CA, USA), guanosine-5′-monophosphate (GMP) and inosine-5′-monophosphate (IMP) from Tokyo Chemical Industry Co., Ltd. (Tokyo, Japan), and apigetrin (apigenin-7-O-glucoside), isovitexin (apigenin-6-C-glucoside), quercitrin (quercetin-3-O-rhamnoside), rhoifolin (apigenin-7-O-neohesperidoside) and rutin (quercetin-3-O-rutinoside) from Extrasynthese (Lyon, France). Orientin (luteolin-8-C-glucoside), isoorientin (luteolin-6-C-glucoside), quercetin, selenium, guanosine, inosine and xanthine oxidase (from bovine milk) were obtained from Sigma-Aldrich Chemical Co. (St. Louis, MO, USA). Allopurinol, apigenin, carboxylmethyl cellulose sodium (CMC-Na), dexamethasone, dimethylsulfoxide (DMSO), recombinant human insulin, transferrin from human blood and uric acid assay kit (Uric acid C-test Wako) were purchased from Wako Pure Chemical Industries, Ltd., (Osaka, Japan), and they were of the best grade commercially available.
Culture of AML12 cells
AML12 cells were cultured in DMEM/F-12 supplemented with 10% FBS, 5 µg/ml recombinant human insulin, 5 µg/ml transferrin from human blood, 3 ng/ml selenium, 40 ng/ml dexamethasone, 100 U/ml penicillin and 100 µg/ml streptomycin (10% FBS/DMEM/F-12) under an atmosphere of 5% CO2/95% humidified air at 37 °C as described previously (Petrie et al. 2013) with slight modifications. The cells (1.0 × 10⁵ cells/well) were subcultured into 24-place multiwell plates and grown for 72 h in 10% FBS/DMEM/F-12, and then kept for 24 h in serum-free DMEM/F-12 that contained all other factors such as insulin, transferrin, selenium, dexamethasone and antibiotics.
Effects of flavonoids, their related compounds, and allopurinol on uric acid production in AML12 hepatocytes
UA productivity by AML12 hepatocytes was evaluated as described previously (Adachi et al. 2017b). In brief, after 24 h culture in serum-free DMEM/F-12, AML12 cells were washed once with phosphate buffered saline without calcium2+ and magnesium2+ [PBS (–)], and then incubated in 200 µl of balanced salt solution (BSS) including 188 mM NaCl, 5 mM KCl, 1 mM MgCl2, 0.8 mM CaCl2, 25 mM NaHCO3, 1 mM NaH2PO4, 10 mM HEPES and 5 mM glucose (Petrie et al. 2013). Furthermore, BSS contained guanosine and inosine (100 µM each) in combination (GI mixture) as UA precursors in the absence or presence of allopurinol (0, 0.1, 0.3, 1 µM), quercetin, rutin, quercitrin, isoquercitrin, luteolin, orientin, isoorientin, diosmetin, apigenin, vitexin, isovitexin, apigetrin, or rhoifolin (0, 10, 30, 100 µM) at the final DMSO concentration of 0.15%. On the termination of 2 h incubation, 200 µl of BSS was collected for determination of UA. UA detected in BSS was considered to be an index for UA productivity (Adachi et al. 2017b). The hepatocytes were washed once with PBS (–) and scraped into 300 µl of buffer including 50 mM Tris and 1 mM sodium phosphate (pH 7.5). After being sonicated and centrifuged (12,000×g, 5 min, 4 °C), the supernatants were subjected to protein determination with a Pierce™ BCA Protein Assay kit. UA levels in the BSS were determined by the uricase methods (Uric acid C-test Wako). UA production was expressed as nmol per 2 h per mg cellular protein (nmol/2 h/mg protein).
Effects of flavonoids, their related compounds, and allopurinol on xanthine oxidase activity in vitro
XO inhibitory activity assay of quercetin, rutin, apigenin, vitexin, isovitexin, luteolin, orientin, isoorientin and allopurinol in vitro was carried out according to the procedure as described previously (Nguyen et al. 2004) with slight modifications. Test samples were dissolved in 30% DMSO/70% 100 mM phosphate buffer (pH 7.5) at the final concentrations from 0 to 100 µM just before the assay. Test solution (50 µl), 100 mM phosphate buffer (pH7.5, 60 µl) and XO (7.8 mU/ml in the same buffer, 30 µl) were applied into 96-well plates. After preincubation at 37 °C for 10 min, the reaction was initiated by the addition of 60 µl of 150 µM xanthine in the same buffer. Immediately after the addition of the substrate buffer, the absorbance at 295 nm and 37 °C was measured with Spark 10 M (Tecan Group Ltd., Männedorf, Switzerland) for 30 min. XO inhibitory activity was indicated as the percentage inhibition of XO, this being calculated as (1−B/A) × 100 where A and B were the increases in the absorbance without and with test samples for 30 min. All assays were performed in quadruplicate. The 50% inhibitory concentration (IC50) for each sample was calculated as described in statistical analyses (see below).
Animals
Male ICR mice (Charles River Japan, Inc., Yokohama, Japan) at 4 weeks of age were housed in plastic cages in a room with a 12-h light–dark cycle (dark phase of 18:00–6:00) and constant temperature (22 °C). The mice were housed in groups of four mice for 7 days to acclimatize to the environment and maintained on tap water and regular diet (CRF-1, Oriental Yeast Co., Tokyo, Japan) ad libitum. This experiment was carried out in accordance with the guideline for Animal Experiments of Utsunomiya University Animal Research Committee (ethic approval number: A14-0017).
Rutin and vitexin administration to hyperuricemic model mice
Antihyperuricemic effect in the model mice was estimated as described previously (Adachi et al. 2017b). In brief, after acclimatization to the environment for 7 days, the mice were divided into seven groups with similar average body weights; normal group (n = 8), hyperuricemic model group (n = 10), allopurinol group (n = 8), low-dose of rutin group (n = 8), high-dose of rutin group (n = 8), low-dose of vitexin group (n = 8) and high-dose of vitexin group (n = 8). Allopurinol, rutin and vitexin were suspended in 0.5% CMC-Na. After 4 h fasting, allopurinol at 10 mg/kg body weight, rutin at 100 mg/kg (low-dose group) and 300 mg/kg body weight (high-dose group), and vitexin at 100 mg/kg (low-dose group) and 300 mg/kg body weight (high-dose group) were orally given to the mice once a day for the three consecutive days. Mice of normal control and hyperuricemic model control groups were orally given 0.5% CMC-Na alone for 3 days. On day 3, the mice were intraperitoneally injected with both GMP and IMP (300 mg each/kg body weight) to induce hyperuricemia 1 h after the oral administration of allopurinol, rutin, vitexin, or the vehicle (the model control). GMP and IMP were dissolved in PBS (–). The normal control group was injected with the PBS (–) alone as a vehicle. One hour after GMP and IMP injection, the blood was collected under isoflurane anesthesia from the inferior vena cava in the microtube with heparin sodium. The blood samples were centrifuged at 5000×g for 10 min at 4 °C to obtain the plasma. The plasma samples were stored at − 80 °C until analyzed. Plasma UA levels were measured by the uricase method (Uric acid C-test Wako).
Statistical analyses
Data on UA production in AML12 cells and UA levels in hyperuricemic mice are expressed as means ± SEM. Data on UA production were analyzed by one-way ANOVA and Tukey’s multiple-comparisons test as a post hoc test. The results of the animal experiment were analyzed by one-way ANOVA with Dunnett's multiple-comparisons test. P values < 0.05 were considered statistically significant. Data on XO inhibitory experiments in vitro are expressed as means from two individual experiments. IC50 values were calculated by curve fitting of at least six different concentrations of test samples. These analyses were conducted by using the Prism 6 software package (GraphPad, San Diego, CA, USA).
Results
Effects of quercetin and its glycosides on UA production in AML12 hepatocytes
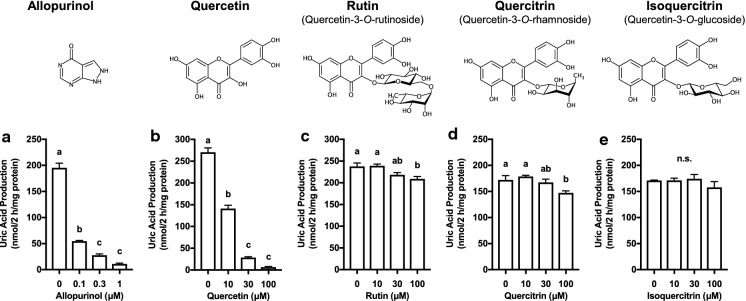
We selected three kinds of typical aglycons, i.e., quercetin, luteolin and apigenin. Figure 1 shows effects of quercetin and its glycosides; rutin (quercetin-3-O-rutinoside), quercitrin (quercetin-3-O-rhamnoside) and isoquercitrin (quercetin-3-O-glucoside), on UA production in cultured AML12 hepatocytes. Allopurinol, a well-known inhibitor of XO and hence UA production, was adopted as the positive control drug. Allopurinol dose-dependently and strongly reduced UA production at the concentrations of 0.1, 0.3 and 1 μM as compared with 0 μM (control) (Fig. 1a). Likewise, quercetin also dose-dependently and significantly reduced it at 10, 30 and100 μM (Fig. 1b); when we calculated IC50 values of allopurinol and quercetin from Fig. 1a (0.0237 µM) and Fig. 1b (10.2 µM), the inhibitory effect of allopurinol on UA production in hepatocytes was approximately 400 times as strong as that of quercetin. In contrast, inhibitory effects of glycosides of quercetin on UA production in cultured hepatocytes were not remarkable; both rutin (Fig. 1c) and quercitrin (Fig. 1d) showed significant reduction at 100 μM, while isoquercitrin (Fig. 1e) showed no inhibitory effect even at 100 μM on UA productivity in cultured hepatocytes.
Fig. 1.
Effects of allopurinol, quercetin and its glycosides on UA production in cultured AML12 hepatocytes. The hepatocytes were treated with allopurinol at 0 (control), 0.1, 0.3 and 1 µM as a positive control drug (a) or quercetin (b), rutin (c), quercitrin (d) and isoquercitrin (e) at 0 (control), 10, 30 and 100 µM for 2 h in BSS containing guanosine and inosine (100 µM each) in combination (GI mixture) as UA precursors. Each value represents mean ± SEM for 6 wells (duplicate measurement per well). Values not sharing a common letter are significantly different at P < 0.05 (Tukey’s test)
Effects of luteolin, its C-glucosides and O-methylluteolin on UA production in AML12 hepatocytes
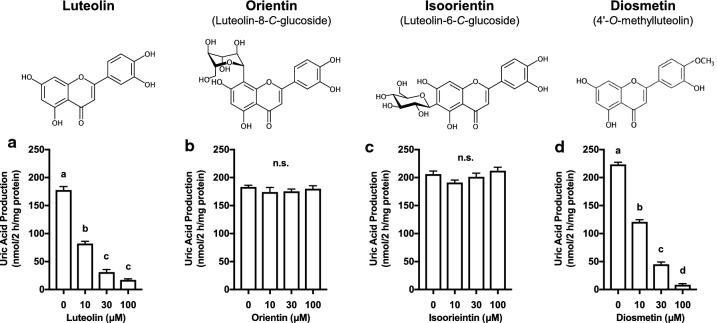
Luteolin (Fig. 2a) and diosmetin (4′-O-methylluteolin, Fig. 2d) dose-dependently and strongly reduced UA production at the concentrations of 10, 30 and 100 μM. In contrast, orientin (luteolin-8-C-glucoside, Fig. 2b) and isoorientin (luteolin-6-C-glucoside, Fig. 2c) showed no inhibitory effect on UA production at the concentrations up to 100 μM.
Fig. 2.
Effects of luteolin, its glycosides and related compound on UA production in cultured AML12 hepatocytes. The hepatocytes were treated with luteolin (a), orientin (b), isoorientin (c) and diosmetin (d) at 0 (control), 10, 30 and 100 µM for 2 h in BSS containing guanosine and inosine (100 µM each) in combination (GI mixture) as UA precursors. Each value represents mean ± SEM for 6 wells (duplicate measurement per well). Values not sharing a common letter are significantly different at P < 0.05 (Tukey’s test)
Effects of apigenin and its glycosides on UA production in AML12 hepatocytes
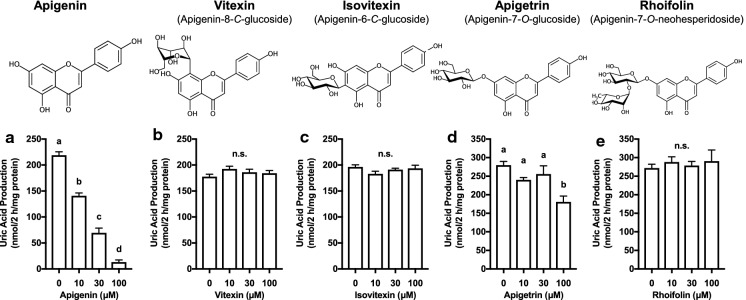
Apigenin dose-dependently and significantly reduced UA production in cultured hepatocytes at 10, 30 and 100 μM (Fig. 3a). Apigetrin (apigenin-7-O-glucoside) significantly reduced UA production at 100 μM in the hepatocytes (Fig. 3d). Other glycosides of apigenin, i.e., vitexin (apigenin-8-C-glucoside), isovitexin (apigenin-6-C-glucoside) and rhoifolin (apigenin-7-O-neohesperidoside) exerted no influences on UA production in cultured hepatocytes up to 100 μM (Fig. 3b, c and e).
Fig. 3.
Effects of apigenin and its glycosides on UA production in cultured AML12 hepatocytes. The hepatocytes were treated with apigenin (a), vitexin (b), isovitexin (c), apigetrin (d) and rhoifolin (e) at 0 (control), 10, 30 and 100 µM for 2 h in BSS containing guanosine and inosine (100 µM each) in combination (GI mixture) as UA precursors. Each value represents mean ± SEM for 6 wells (duplicate measurement per well). Values not sharing a common letter are significantly different at P < 0.05 (Tukey’s test)
Direct inhibitory effects of aglycons and their glycosides on xanthine oxidase activity in vitro
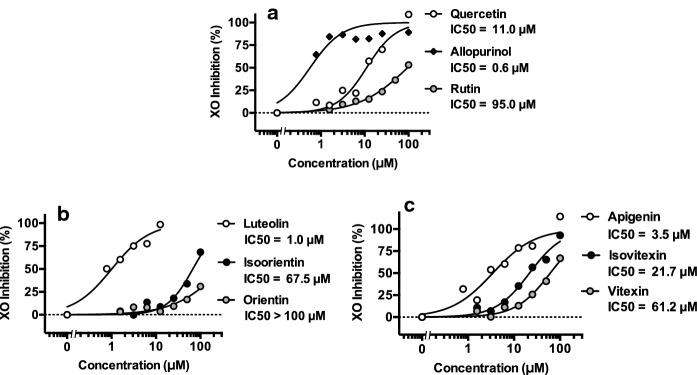
Three kinds of aglycons, that is, quercetin, luteolin and apigenin directly inhibited XO activity in vitro (Fig. 4). Their IC50 values were 11.0 μM (quercetin, Fig. 4a), 1.0 μM (luteolin, Fig. 4b) and 3.5 μM (apigenin, Fig. 4c), respectively. IC50 of allopurinol was 0.6 μM (allopurinol, Fig. 4a), indicating the assay system employed here worked correctly. As to glycosides, IC50 values were as follows; rutin; 95.0 μM), orientin; > 100 μM, isoorientin; 67.5 μM, vitexin; 61.2 μM and isovitexin; 21.7 μM. Of various components in buckwheat seeds, rutin reportedly occupies the highest content during their germination periods (0–72 h), while those of vitexin and isovitexin (vitexins) as well as orientin and isoorientin (orientins) increase gradually during germination periods, and the contents of orientins are lower than those of vitexins (Zhang et al. 2015). IC50 value of orientin was higher than 100 μM as above mentioned. From these information and present results, we decided to select both rutin (quercetin-3-O-rutinoside) and vitexin (apigenin-8-C-glucoside) as representatives of O-glycosides and C-glycosides, respectively, of buckwheat seeds in the following animal experiments.
Fig. 4.
Direct inhibitory effects of aglycons and their glycosides on xanthine oxidase activity in vitro. Data on direct XO inhibitions in vitro are expressed as means from two individual experiments. IC50 values were calculated by curve fitting of at least six different concentrations of test samples as described in Materials and methods. Allopurinol was adopted as a positive control drug. IC50 values are shown in Fig. a (allopurinol, quercetin, rutin), b (luteolin, orientin, isoorientin) and c (apigenin, vitexin, isovitexin), respectively
Effects of rutin and vitexin on purine bodies-induced hyperuricemia in mice
As illustrated in Fig. 5, the plasma UA level significantly and strikingly increased in the model control group as compared with the normal control group. This rise was significantly and completely suppressed by allopurinol administration at 10 mg/kg body weight. Likewise, rutin also significantly suppressed the purine bodies-induced hyperuricemia at 300 mg/kg body weight. In contrast, vitexin exerted no significant influence on the hyperuricemia at 100 and 300 mg/kg body weight.
Fig. 5.
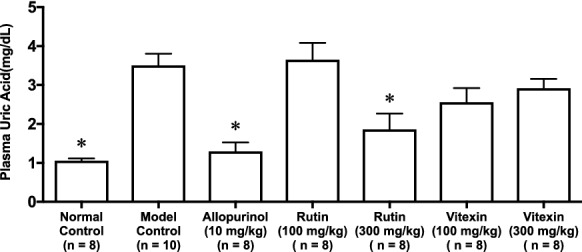
Effects of rutin and vitexin on purine bodies-induced hyperuricemia in mice. Allopurinol was adopted as positive control drug. Each value represents mean ± SEM for 10 (model control group) or 8 (other groups) mice. *P < 0.05 vs. hyperuricemic mice (model control group) by Dunnett's multiple-comparisons test
Discussion
Three kinds of typical aglycons, namely, quercetin, luteolin and apigenin were demonstrated to dose-dependently and significantly decrease UA production in cultured AML12 hepatocytes (Figs. 1b, 2a and 3a). In addition, diosmetin (4′-O-methylluteolin) similarly reduced UA production (Fig. 2d). These findings in cultured hepatocytes imply that de-glycosylation could be a potential to enhance the biological activities of flavonoids as already pointed out (de Araújo et al. 2013; Shin et al. 2016; Yang et al. 2019; Wang et al. 2019).
In our separate calculations, IC50 of quercetin (flavonol) in cell experiment (10.2 µM) was almost the same as that in enzyme (XO) inhibition experiment in vitro (11 µM). In contrast, IC50 values of luteolin and apigenin (flavones) in cell experiment were higher (8.1 µM, 18.6 µM) than those in XO inhibition experiment in vitro (1.0 µM, 3.5 µM), respectively. In summary, quercetin inhibited XO activity in vitro and UA production in cultured hepatocytes at the same extent, while IC50 values of luteolin and apigenin in cultured hepatocytes were higher than those in XO inhibition assay in vitro. Interestingly, IC50 of allopurinol in XO inhibition assay in vitro (0.6 µM) was higher than that in cultured hepatocytes (0.0237 µM). One of the reasons for these phenomena might be due to transferability or permeability of each molecule across cellular membrane, because it must go into cells from buffer (BSS) to affect intracellular XO activity and other targets if any. This process is considered to be essential to glycosides as well as aglycones, and transferability may be different depending on two- or three-dimensional structures of each test molecule. Further studies on the relationships among biological activities, chemical structures and de-glycosylation processes from, for example, chemical (Yang et al. 2019) and enzymatic (de Araújo et al. 2013; Shin et al. 2016) aspects are desirable to clarify these aspects.
Rutin, quercitrin and apigetrin significantly reduced UA production at 100 μM in cultured hepatocytes, suggesting two possibilities that (1) at least these 3 glycosides examined in the present study might be partially de-glycosylated during the incubation of hepatocytes with the glycosides in BSS for 2 h, and (2) glycosides themselves inhibit UA production via XO inhibition like aspalathin (ASP, C-linked dihydrochalcone glucoside found in rooibos tea) (Kondo et al. 2013). We have also found this C-glycoside, ASP, is capable to increase glucose uptake through activation of 5′-adenosine monophosphate-activated protein kinase (AMPK) and promotion of glucose transporter 4 (GLUT4) translocation to cellular membrane in cultured myocytes, this leading to suppression of hyperglycemia in diabetic ob/ob mice (Son et al. 2013). In the present study, rutin is demonstrated for the first time to significantly suppress purine bodies-induced hyperuricemia in mice at the whole-body level.
In our previous report, we have found that three consecutive oral administrations of quercetin at doses of 100 and 300 mg/day/kg body weight are capable to dose-dependently and significantly suppress the increases in the plasma UA levels in mice with hyperuricemia (Adachi et al. 2019). In the present study, despite of the same experimental conditions, rutin (quercetin-3-O-rutinoside) at a dose of 300 mg/day/kg body weight succeeded to, but at 100 mg/day/kg body weight failed to suppress the plasma UA levels in mice with hyperuricemia. One of the reasons for this is considered to be the differences in molecular weight (MW) between quercetin (MW = 302.23 g/mol) and rutin (MW = 610.52 g/mol). MW of quercetin is about half of that of rutin. On the assumption of the chemical entity that decreases UA production is quercetin moiety of rutin, then more than 200 mg/kg body weight of oral administration of rutin might be significantly effective.
Potassium oxosonate (PO)-induced hyperucemic model in rodents has been widely used so far, and rutin has been already reported to be hypouricemic in this model from the aspects of both the inhibitory action of hepatic UA production (Zhu et al. 2004) and the improved regulation of renal organic ion transporters (Chen et al. 2013). In mice with purine bodies-induced hyperuricemia, studies on changes in various renal functions as well as hepatic function are also necessary.
Studies on rutin de-glycosylation (conversion of rutin to quercetin) seem to be important for cell culture screening, and several studies have been conducted recently from chemical (Yang et al. 2019), enzymatic (de Araújo et al. 2013) and microbial (Shin et al. 2016) aspects. Of these, enzymatic and microbial de-glycosylation processes may be deeply involved in the bioavailability and efficacy of O-glycosides when they were orally administered.
In contrast, flavone C-glycosides in which the sugar moieties are usually connected to C-6 or/and C-8 of the flavone skeletons through a C–C bond, but are difficult to be de-glycosylated due to solid C–C bond between sugar moiety and aglycones. However, a newly isolated human intestinal bacterium strain (Enterococcus faecalis W12-1) has been recently reported to easily cleave this bond because they generate various specific enzymes (Zheng et al. 2019). This bacterium can produce apigenin from both vitexin and isovitexin, and luteolin from orientin. Pretreatments of samples by enzymes derived from such intestinal microorganisms seem to be useful for in vitro screening in the cultured cells including hepatocytes and other cells. Further studies are desirable to clarify these possibilities.
Our in vivo findings may also be involved in the bioavailability and efficacy of O- and C-glycosides when they were orally ingested. In the present study, vitexin was administered only 3 consecutive days. If useful intestinal bacterium strain(s) might exist in the intestine of mice like humans (Zheng et al. 2019), then more than 4 consecutive oral administration of vitexin might be effective. Further studies are also desirable to clarify this aspect.
Acknowledgements
Authors are grateful to Dr. Fumiaki Yoshizawa, Utsunomiya University, for providing animal experiment and feeding facility.
Abbreviations
- BSS
Balanced salt solution
- GMP
Guanosine-5′-monophosphate
- IMP
Inosine-5′-monophosphate
- IC50
50% Inhibitory concentration
- PBS (−)
Calcium- and magnesium-free phosphate buffered saline
- UA
Uric acid
- XO
Xanthine oxidase
Author contributions
KY supervised the study and wrote the manuscript in collaboration with SA. SA, MO and SK participated in the experimental works, and collected samples and data. SA conducted all statistical analyses. All authors have read and approved the final version of the manuscript.
Compliance with ethical standards
Conflict of interest
This study was funded by Suntory Malting Ltd., Utsunomiya, Tochigi, Japan. MO is the employee for this company.
Footnotes
Publisher's Note
Springer Nature remains neutral with regard to jurisdictional claims in published maps and institutional affiliations.
References
- Abeles AM. Hyperuricemia, gout, and cardiovascular disease: an update. Curr Rheumatol Rep. 2015;17:13. doi: 10.1007/s11926-015-0495-2. [DOI] [PubMed] [Google Scholar]
- Adachi SI, Yoshizawa F, Yagasaki K. Hyperuricemia in type 2 diabetic model KK-Ay/Ta mice: a potent animal model with positive correlation between insulin resistance and plasma high uric acid levels. BMC Res Notes. 2017;10:577. doi: 10.1186/s13104-017-2897-x. [DOI] [PMC free article] [PubMed] [Google Scholar]
- Adachi SI, Yoshizawa F, Yagasaki K. Assay systems for screening food and natural substances that have anti-hyperuricemic activity: uric acid production in cultured hepatocytes and purine bodies-induced hyperuricemic model mice. Cytotechnology. 2017;69:435–442. doi: 10.1007/s10616-016-0005-z. [DOI] [PMC free article] [PubMed] [Google Scholar]
- Adachi SI, Nihei KI, Ishihara Y, Yoshizawa F, Yagasaki K. Anti-hyperuricemic effect of taxifolin in cultured hepatocytes and model mice. Cytotechnology. 2017;69:329–336. doi: 10.1007/s10616-016-0061-4. [DOI] [PMC free article] [PubMed] [Google Scholar]
- Adachi SI, Kondo S, Sato Y, Yoshizawa F, Yagasaki K. Anti-hyperuricemic effect of isorhamnetin in cultured hepatocytes and model mice: structure-activity relationships of methylquercetins as inhibitors of uric acid production. Cytotechnology. 2019;71:181–192. doi: 10.1007/s10616-018-0275-8. [DOI] [PMC free article] [PubMed] [Google Scholar]
- Babio N, Martínez-González MA, Estruch R, Wärnberg J, Recondo J, Ortega-Calvo M, Serra-Majem L, Corella D, Fitó M, Ros E, Becerra-Tomás N, Basora J, Salas-Salvadó J. Associations between serum uric acid concentrations and metabolic syndrome and its components in the PREDIMED study. Nutr Metab Cardiovasc Dis. 2015;25:173–180. doi: 10.1016/j.numecd.2014.10.006. [DOI] [PubMed] [Google Scholar]
- Bardin T, Richette P. Definition of hyperuricemia and gouty conditions. Curr Opin Rheumatol. 2014;26:186–191. doi: 10.1097/BOR.0000000000000028. [DOI] [PubMed] [Google Scholar]
- Chen YS, Hu QH, Zhang X, Zhu Q, Kong LD. Beneficial effect of rutin on oxonate-induced hyperuricemia and renal dysfunction in mice. Pharmacology. 2013;92:75–83. doi: 10.1159/000351703. [DOI] [PubMed] [Google Scholar]
- Choi HK, Atkinson K, Karlson EW, Willett W, Curhan G. Purine-rich foods, dairy and protein intake, and the risk of gout in men. N Engl J Med. 2004;350:1093–1103. doi: 10.1056/NEJMoa035700. [DOI] [PubMed] [Google Scholar]
- Choi HK, Mount DB, Reginato AM. American college of physicians; American Physiological Society. Pathogenesis of gout. Ann Intern Med. 2005;143:499–516. doi: 10.7326/0003-4819-143-7-200510040-00009. [DOI] [PubMed] [Google Scholar]
- de Araújo ME, Moreira Franco YE, Alberto TG, Sobreiro MA, Conrado MA, Priolli DG, Frankland Sawaya AC, Ruiz AL, de Carvalho JE, de Oliveira CP. Enzymatic de-glycosylation of rutin improves its antioxidant and antiproriferative activities. Food Chem. 2013;141:266–273. doi: 10.1016/j.foodchem.2013.02.127. [DOI] [PubMed] [Google Scholar]
- Ishikawa T, Aw W, Kaneko K. Metabolic interactions of purine derivatives with human ABC transporter ABCG2: genetic testing to assess gout risk. Pharmaceuticals (Basel) 2013;6:1347–1360. doi: 10.3390/ph6111347. [DOI] [PMC free article] [PubMed] [Google Scholar]
- Kondo M, Hirano Y, Nishio M, Furuya Y, Nakamura H, Watanabe T. Xanthine oxidase inhibitory activity and hypouricemic effect of aspalathin from unfermented rooibos. J Food Sci. 2013;78:H1935–1939. doi: 10.1111/1750-3841.12304. [DOI] [PubMed] [Google Scholar]
- Nguyen MT, Awale S, Tezuka Y, Tran QL, Watanabe H, Kadota S. Xanthine oxidase inhibitory activity of Vietnamese medicinal plants. Biol Pharm Bull. 2004;27:1414–1421. doi: 10.1248/bpb.27.1414. [DOI] [PubMed] [Google Scholar]
- Petrie JL, Patman GL, Sinha I, Alexander TD, Reeves HL, Agius L. The rate of production of uric acid by hepatocytes is a sensitive index of compromised cell ATP homeostasis. Am J Physiol Endocrinol Metab. 2013;305:E1255–E1265. doi: 10.1152/ajpendo.00214.2013. [DOI] [PubMed] [Google Scholar]
- Richette P, Bardin T. Purine-rich foods: an innocent bystander of gout attacks? Ann Rheum Dis. 2012;71:1435–1436. doi: 10.1136/annrheumdis-2012-201838. [DOI] [PubMed] [Google Scholar]
- Shin NR, Moon JS, Shin SY, Li L, Lee YB, Kim TJ, Han NS. Isolation and characterization of human intestinal Enterococcus avium EFEL009 converting rutin to quercetin. Lett Appl Microbiol. 2016;62:68–74. doi: 10.1111/lam.12512. [DOI] [PubMed] [Google Scholar]
- Son MJ, Minakawa M, Miura Y, Yagasaki K. Aspalathin improves hyperglycemia and glucose intolerance in obese diabetic ob/ob mice. Eur J Nutr. 2013;52:1607–1619. doi: 10.1007/s00394-012-0466-6. [DOI] [PubMed] [Google Scholar]
- Wang Y, Qin S, Jia J, Huang L, Li F, Jin F, Ren Z, Wang Y. Intestinal microbiota-associated metabolites: crucial factors in the effectiveness of herbal medicines and diet therapies. Front Physiol. 2019;10:1343. doi: 10.3389/fphys.2019.01343. [DOI] [PMC free article] [PubMed] [Google Scholar]
- Yang J, Lee H, Sung J, Kim Y, Jeong HS, Lee J. Conversion of rutin to quercetin by acid treatment in relation to biological activities. Prev Nutr Food Sci. 2019;24:313–320. doi: 10.3746/pnf.2019.24.3.313. [DOI] [PMC free article] [PubMed] [Google Scholar]
- Zhang G, Xu Z, Gao Y, Huang X, Zou Y, Yang T. Effects of germination on the nutritional properties, phenolic profiles, and antioxidant activities of buckwheat. J Food Sci. 2015;80:H1111–H1119. doi: 10.1111/1750-3841.12830. [DOI] [PubMed] [Google Scholar]
- Zheng S, Geng D, Liu S, Wang Q, Liu S, Wang R. A newly isolated human intestinal bacterium strain capable of deglycosylating flavone C-glycosides and its functional properties. Microb Cell Fact. 2019;18:94. doi: 10.1186/s12934-019-1144-7. [DOI] [PMC free article] [PubMed] [Google Scholar]
- Zhu JX, Wang Y, Kong LD, Yang C, Zhang X. Effects of Biota orientalis extract and its flavonoid constituents, quercetin and rutin on serum uric acid levels in oxonate-induced mice and xanthine dehydrogenase and xanthine oxidase activities in mouse liver. J Ethnopharmacol. 2004;93:133–140. doi: 10.1016/j.jep.2004.03.037. [DOI] [PubMed] [Google Scholar]
- Zhu Y, Hu Y, Huang T, Zhang Y, Li Z, Luo C, Luo Y, Yuan H, Hisatome I, Yamamoto T, Cheng J. High uric acid directly inhibits insulin signalling and induces insulin resistance. Biochem Biophys Res Commun. 2014;447:707–714. doi: 10.1016/j.bbrc.2014.04.080. [DOI] [PubMed] [Google Scholar]


