

Abstract
Pterostilbene (Pt) is a natural polyphenol found in blueberries and several grape varieties. Pt's pharmacological importance was well documented. Nevertheless, the depigmenting effects are not demonstrated. We evaluated the Pt's depigmenting effects through autophagy induction in B16F10 cells and inhibition of UVA (3 J/cm2)-irradiated α-MSH in keratinocyte HaCaT cells via Nrf2-mediated antioxidant pathways. Pt (2.5–5μM) attenuated ROS production and downregulated the POMC/α-MSH pathway in HaCaT cells. The conditioned medium-derived from UVA-irradiated HaCaT pretreated with Pt suppressed melanogenesis in B16F10 through MITF-CREB-tyrosinase pathway downregulation. Interestingly, Pt-induced HaCaT autophagy was revealed by enhanced LC3-II accumulation, p62/SQSTM1 activation, and AVO formation. Pt significantly decreased melanosome gp100 but increased LC3-II levels in HaCaT cells exposed to B16F10-derived melanin. Pt activated and facilitated the Nrf2 antioxidant pathway in HaCaT cells leading to increased HO-1, γ-GCLC, and NQO-1 antioxidant protein expression. ERK, AMPK, and ROS pathways mediate the Nrf2 activation. However, Nrf2 knockdown suppressed Pt's antioxidant ability leading to uncontrolled ROS and α-MSH levels after UVA-irradiation suggested the essentiality of the Nrf2 pathway. Moreover, in α-MSH-stimulated B16F10 cells, Pt (10–30 μM) downregulated the MC1R, MITF, tyrosinase, TRP-1/-2, and melanin expression. Further, Pt showed potent anti-melanogenic effects through autophagy induction mechanism in B16F10 cells, verified by increased LC3-II/p62 levels, AVO formation, and Beclin-1/Bcl-2 ratio, decreased ATG4B levels and PI3K/AKT/mTOR pathway. Transmission electron microscopy provided direct evidence by showing autophagosomes engulfing melanosomes following Pt treatment in α-MSH-stimulated B16F10 cells. Moreover, Pt-induced anti-melanogenic activity through the downregulation of CREB-MITF pathway-mediated TRP-1/-2, tyrosinase expressions, melanosome formation, and melanin synthesis was substantially reversed due to 3-MA (autophagy inhibitor) pretreatment or LC3 silencing in B16F10 cells. In vivo results also confirmed that Pt-inhibited tyrosinase expression/activity and endogenous pigmentation in the zebrafish model. Therefore, pterostilbene is a potent skin-whitening and antioxidant agent and could be used in skin-whitening formulations as a topical applicant.
Keywords: Pterostilbene, ROS, Anti-melanogenesis, Nrf2, Autophagy
Graphical abstract
Highlights
-
•
Pt inhibits ROS-mediated POMC/α-MSH pathway in UVA-irradiated HaCaT cells.
-
•
Pt activates Nrf2-mediated HO-1, γ-GCLC, and NQO-1 expression in HaCaT cells.
-
•
Pt-induces autophagy in B16F10 cells leading to melanogenesis inhibition.
-
•
Pt-mediates anti-melanogenic mechanisms in α-MSH-stimulated B16F10 cells.
-
•
Pt-inhibits tyrosinase expression and endogenous pigmentation in zebrafish model.
Abbreviation
- UVA
Ultraviolet A
- cAMP
Cyclic adenosine monophosphate
- ROS
Reactive oxygen species
- POMC
Proopiomelanocortin
- α-MSH
α-melanocyte stimulating hormone
- MITF
Microphthalmia-associated transcription factor
- CREB
cAMP response element-binding protein
- Nrf2
Nuclear factor erythroid 2-related factor 2
- Keap-1
Kelch-like ECH-associated protein-1
- HO-1
Heme oxygenase-1
- γ-GCLC
γ-Glutamate-cysteine ligase catalytic subunit
- NQO-1
NAD(P)H dehydrogenase [quinone]-1
- LC3
Microtubule-associated protein light chain 3
- AVO
Acidic vesicular organelle
- 3-MA
3-methyladenine
- ERK
Extracellular signal regulated protein kinase
- TRP-1/-2
Tyrosinase-related protein-1/-2
- MC1R
Melanocortin 1 receptor
1. Introduction
The skin is the largest organ that interfaces with the environment and plays a vital role in protecting the body from various external factors. Melanin is the nitrogen-containing pigment derived from its precursor compound l-tyrosine and is stored in the subcellular lysosome-like organelles called ‘melanosomes’ [1]. Melanogenesis is the melanin-producing complex process involving both keratinocytes and melanocytes. In the skin, melanocytes synthesize the melanin and transfer it to the surrounding keratinocytes. Nearly thirty-six keratinocytes surround each melanocyte. Therefore, melanosome (and melanin) formation and degradation determine the skin color [2]. However, genetic divergence, polymorphism, and mutations act as the predetermined constitutional pigmentation factors [3]. The facultative pigmentation factors like UV radiation, free radicals, and inflammation also influence skin color changes [4]. Melanogenesis has many functions in the human body. It helps protect the skin from harmful ultraviolet (UV) radiation, toxic drugs, and chemicals [5].
UVA radiation (320–400 nm) possesses strong penetration ability with photosensitization capacity in the skin cells. UVA increases the reactive oxygen species (ROS) levels in keratinocytes and melanocytes. At high concentrations, ROS causes DNA damage and triggers melanogenesis through the activation of p53 protein [5]. Exposure to UVA radiation stimulates the secretion of alpha-melanocyte-stimulating hormone (α-MSH) derived from proopiomelanocortin (POMC) in keratinocytes [6]. However, α-MSH binding to melanocortin 1 receptor (MC1R) on melanocyte surface induces melanin production through different signaling pathways. These include - cAMP, protein kinase A (PKA), cAMP response element-binding protein (CREB), and microphthalmia-associated transcription factor (MITF) [7]. MITF is an essential transcription factor that controls the expression of critical melanogenic enzymes - tyrosinase, tyrosinase-related protein-1 (TRP-1, also called gp75), and tyrosinase-related protein-2 (TRP-2, even familiar as dopachrome tautomerase or Dct) [1]. Although melanin is pivotal in defending the skin from dangerous UV radiation, abnormal melanin accumulation in the skin can lead to melasma, solar lentigines, and freckles, the hyperpigmentation disorders that pose a significant cosmetic nuisance and distress to the affected individual [8]. Therefore, reducing melanogenesis is vital in cosmetic whitening and hyperpigmentation conditions, including dermal, ocular, and diverse neural diseases [9].
Previous studies suggest that the manifestation of skin pigmentary disorders are implicated to defected ‘autophagy’ mechanisms [10]. From the evolutionary perspective, autophagy is a conserved cellular self-catabolic mechanism that degrades and recycles the damaged cellular proteins and organelles and maintains cellular homeostasis. A distinct set of proteins regulates autophagy [11]. LC3-1 conversion (LC3's cytosolic form) to LC3-II (lipidated form) is necessary for autophagy. Further, LC3-II links with isolated membranes to form ‘autophagosomes.’ LC3-II also acts together with the adapter protein p62/SQSTM1 for selective autophagosomal degradation [11]. The ratio of LC3-II/LC3-I is widely considered as an autophagy marker. The association between autophagy and skin color in different ethnic groups was investigated [12]. It was known that autophagy and its regulators play different roles in melanosome homeostasis [13]. For example - β-mangostin, a natural xanthonoid, inhibits α-MSH-stimulated melanogenesis in an autophagy-dependent pathway [14]. Therefore, autophagy inducers may be considered as significant targets in melanogenesis regulation.
Stilbenes are natural polyphenolic compounds found in a variety of dietary sources. Pterostilbene (Pt), chemically familiar as trans-3,5-dimethoxy-4-hydroxystilbene, is a stilbene compound naturally produced by blueberries, tree wood, and several grape varieties under environmental stress conditions [15]. Pt is structurally similar to a well-documented stilbene compound ‘resveratrol.’ However, the presence of two methoxy groups (-OCH3) in the Pt has increased its bioavailability and pharmacological potency over resveratrol. It was documented that Pt exhibits anti-cancer, anti-inflammatory, neuroprotective, anti-obesity, anti-diabetic, antioxidant, anxiolytic, and anti-aging activities [16]. Furthermore, Pt was shown to protect the human keratinocytes against UV radiation-induced photo-damage via the antioxidant Nrf2/ARE pathway [17]. Notably, Pt was reported to help treat and prevent different skin disorders through the induction of autophagy. It was clarified that Pt alleviates the inflammatory responses in skin disorders [18]. The hypopigmentation effect of Pt in melanoma B16F10 cells was elucidated. Pt downregulates the tyrosinase protein expression and has shown better performance than resveratrol and resveratrol trimethyl ether in managing α-MSH-induced melanogenesis in B16F10 cells [19]. Therefore, we aimed to delineate the depigmenting mechanisms elicited by Pt through autophagy induction in melanoma B16F10 cells and inhibition of UVA (3 J/cm2)-irradiated α-MSH in keratinocyte HaCaT cells via Nrf2-mediated antioxidant pathways.
2. Materials and methods
2.1. Chemicals and antibodies
From the Gibco company (Co Dublin, Ireland), cell culture reagents like l-glutamine, the Dulbecco's modified eagle medium (DMEM), penicillin/streptomycin, fetal bovine serum (FBS) were obtained. DAPI was bought from Southern Biotech (Birmingham, AL, USA). Pterostilbene (Pt), Resveratrol (Rv), and 1-Phenyl-2-thiourea (PTU) were purchased from Sigma-Aldrich Chemical Co (St. Louis, MO, USA). α-MSH, dimethyl sulfoxide (DMSO), 3-[4,5-dimethyl-2-yl]-2,5-diphenyl tetrazolium bromide (MTT), l-DOPA, melanin, and 3-MA bought from Sigma Aldrich Chemical Co (St Louis, MO, USA). DCFH2-DA was bought from Santa Cruz Biotechnology Inc. (Heidelberg, Germany). Following pharmacological inhibitors were procured from their respective companies - PD98059 (ERK1/2 inhibitor), SP600125 (JNK inhibitor), SB203580 (p38 MAPK inhibitor), GF10923X (PKC inhibitor), and LY294002 (PI3K/AKT inhibitor) - Calbiochem (La Jolla, CA, USA). CKII (Casein kinase II inhibitor) and compound C (AMPK inhibitor) were from Merck & Co., Inc. (Darmstadt, Germany). N-acetylcysteine (ROS inhibitor) - Sigma-Aldrich Chemical Co (St. Louis, MO, USA). Antibodies such as - β-actin, POMC, p-CREB, TRP-1, TRP-2, p-Nrf2, p-AMPK, p-AKT, and Bax were purchased from Santa Cruz Biotechnology Inc., Heidelberg, Germany. CREB, MITF, p-MITF, Tyrosinase, MC1R, HO-1, and γ-GCLC were supplied by GeneTex International corporation., Hsinchu City, Taiwan. Histone H3, Keap-1, p-ERK, ERK, LC3-II, p62, ATG4B, p-PI3K, PI3K, AKT, p-mTOR, mTOR, Becline-1, and Bcl-2 were from Cell Signal Technology (Beverly, MA, USA) and Anti-α-MSH from Biorbyt (Cambridge, UK). Anti-Melanoma gp100 from Abcam Inc, (Burlingame, CA, USA). The remaining reagents and labware from Sigma-Aldrich (St. Louis, MO, USA) or Merck & Co., Inc. (Darmstadt, Germany).
2.2. Cell culture and stock preparations of test samples
Human skin keratinocyte HaCaT cells (Cat # 300493) were received from Cell Line Services (CLS, Eppelheim, Germany). Whereas murine melanoma B16F10 cells (Cat # CRL-6475) were obtained from the American Type Culture Collection center (ATCC, VA, USA). HaCaT or B16F10 were grown and maintained in the DMEM complete medium added with FBS and antibiotics. As mentioned in our earlier work, the procedure for culturing the cells was followed [6]. The stock solutions (200 mM) of Pt or Rv were made in DMSO and stored at −20 °C.
2.3. UVA-irradiation
HaCaT or B16F10 cells were first stimulated with Pt or Rv or vehicle. 24 h later, cells washed with PBS were re-suspended in a dye-free DMEM complete medium comprising 10% FBS and exposed to varying intensities of UVA (3–12 J/cm2) using the UVI link CL-508L (UVItec, Cambridge, UK) for 18–90 min at 365 nm (λ365) with no observable emission below 320 nm.
2.4. Measurement of cell viability
MTT assay measured the cell viability [20]. Briefly, 5 × 10⁴ HaCaT or B16F10 cells cultured in a 24-well plate were exposed to UVA radiation using UVIlink CL-508L (UVItec, Cambridge, UK) or incubated with different test samples or inducers for the suggested time, with or without UVA irradiation. After PBS wash, cells were further incubated for 2 h in the presence of MTT (0.5 mg/mL). The cytoplasmic formazan crystals were solubilized with DMSO (0.8 mL). The intensity of color developed was estimated using an ELISA plate reader at 570 nm (λ570) (Bio-Tek Instruments, Winooski, VT, USA). Data were calculated from triplicates and denoted as cell viability percentage compared to unstimulated cells. The cell viability percentage of control/unstimulated cells was assigned as 100%.
2.5. Estimation of intracellular ROS by DCFH2-DA method
The cellular ROS levels in UVA-irradiated HaCaT cells were estimated by the DCFH2-DA fluorescence microscopy method. DCFH2-DA is a fluorogenic probe that can penetrate through the cell membrane and oxidize inside the cells to form dichlorofluorescein (DCF). The levels of intracellular DCF are proportional to intracellular ROS produced. Therefore, 1.5 × 10⁵ HaCaT cells were first treated with individual concentrations of Pt (0–10 μM) or Rv (0–10 μM) for the suggested time and then irradiated to 3 J/cm2 UVA for the indicated time. UVA-induced ROS production was estimated as explained in our previous work [20]. Data were collected from three or more independent experiments. Data were denoted as fold-difference over untreated or non-UVA-exposed cells.
2.6. Protein isolation and western blotting
1.5 × 10⁶ HaCaT or B16F10 cells in a 100 mm dish were incubated with different test samples or inducers for the suggested time with or without UVA irradiation. All protein extraction steps were carried out in ice-cold conditions and reagents. These cells were harvested, and protein samples were extracted as explained in our previous work [20]. Protein concentration was determined from a protein standard curve construed using bovine serum albumin (BSA) protein and Bio-Rad protein assay reagent kit (Bio-Rad, Hercules, CA, USA).
Isolated proteins were subjected to the Western blot experiment. Equal concentrations of protein samples were solubilized, separated, and transferred over polyvinylidene difluoride (PVDF) membranes and probed with different primary and secondary antibodies, as explained in our previous work [20]. β-actin or histone proteins functioned as loading controls for total or nuclear proteins, respectively. Densitometry analyses were conducted to estimate the protein expression data using commercial software (AlphaEase, Genetic Technology Inc., Miami, FL, USA). Data were collected from three or more experiments and denoted as fold difference over control. Control values were assigned as one.
2.7. In vitro melanin estimation
Approximately 2.5 × 10⁵ B16F10 cells/well were grown in a 6-well plate. At 50% cell confluence, PBS rinsed cells were exposed to Pt (0–30 μM) followed by stimulated or not with α-MSH (1 μM, 24 h). After incubation, PBS-washed cells were harvested, lysed, and cellular melanin content was solubilized using 1 N sodium hydroxide (NaOH). An ELISA plate reader (Dynatech MR 7000 & Dynex MRX) quantified the melanin (at λ470) [6]. Data were obtained from three or more experiments, and melanin content was calculated and denoted as fold-over control cells.
2.8. Immunofluorescence staining of Nrf2
1.5 × 10⁴ HaCaT cells were pre-incubated with Pt (0–5 μM) for the indicated time. Cells were then subjected to the immunofluorescence staining method [20] using anti-Nrf2 and Fluorescein isothiocyanate (FITC)-conjugated (488 nm) as primary and secondary antibodies, respectively. DAPI functioned as a counterstain for nuclear staining. After staining, cells were observed through a fluorescence microscope (magnification × 200).
2.9. Transfection of Nrf2 and LC3
5 × 10⁵ HaCaT or B16F10 cells in a 6-well plate were allowed to achieve 50% confluence. Lipofectamine RNAiMAX kit (Invitrogen, Carlsbad, CA, USA) was used, and the method was described elsewhere [20]. After transfection, siNrf2-transfected HaCaT cells were subjected to Pt (5 μM, 0.5–24 h) and without or with 3 J/cm2 UVA-irradiation to assess the Nrf2, HO-1, NQO-1, and γ-GCLC proteins expression, as well as the UVA-induced intracellular ROS levels. Similarly, siLC3-transfected B16F10 cells were subjected to Pt (30 μM, 4–24 h) to determine LC3-I/II, tyrosinase, TRP-1, and TRP-2 proteins expression. Data were expressed as fold differences over untreated control values.
2.10. AO staining of B16F10 cells
Pt's effect on lysosomes, phagolysosomes (acidic vesicular organelles – AVOs) development within cells can be estimated through the acridine orange (AO) staining method as explained elsewhere [21]. AO is a membrane-permeable, nucleic acid-specific fluorescence-based cationic dye whose fluorescence emission is proportional to dye accumulation. Based on this fact, the high, intermediate, and low concentrations of AVOs within cells are correlated to red (in lysosomes), yellow (in lysosomes), and green (in cytosol) emissions, respectively. Briefly, B16F10 cells were first subjected to an autophagy inhibitor 3-MA (1 mM, 1 h) followed by Pt (30 μM, 24 h). AO stain (1 μg/mL in PBS+5% FBS, 15 min) was used to observe AVOs within cells through a fluorescence microscope (magnification × 100). Olympus Softimage Solution software (Olympus Imaging America, Inc., Corporate Parkway Centre Valley, PA, USA) was used to quantify the fluorescence. Data were reported as fold differences over control values.
2.11. Transmission electron microscopy
The assimilation of α-MSH induced cytosolic melanosome formation and Pt-facilitated anti-melanogenic effect in B16F10 cells were observed through transmission electron microscopy method slight modifications to an earlier procedure [14]. Pt was treated (30 μM, 24 h) to melanocytes with or without treatment with 3-MA (1 mM) for the indicated time. After treatments, stimulated with α-MSH (1 μM) for 24 h. PBS washed followed by Karnovsky solution (1.5 h), Osmium tetraoxide (1% OsO4) fixed cells were dehydrated to undergo ultrathin sectioning. Uranyl acetate (1%) and lead citrate were used to stain the sections and subsequently observed through a transmission electron microscope, and images were captured (Tecnai 12, FEI, Hillsboro, Oregon USA).
2.12. Zebrafish in vivo studies
All in vivo experiments were approved by the China Medical University Animal Care and Use Committee (IACUC). Zebrafish were used to assess the depigmenting effects of Pt in vivo with some modifications to a previous study [22]. Adult zebrafish were bought from a commercial aquarium store (Gendanio Biotech Inc. Taiwan) and maintained in an acrylic tank supported with the necessary feed. Zebrafish embryos (collected through the natural spawning process) were grouped into a 96-well plate by maintaining three embryos/well. 24 h post-fertilized (hpf) embryos were treated with vehicle (0.1% DMSO), or Pt (2.5 or 5 μM), or Rv (10 μM) for 48 or 72 hpf. 1-Phenyl-2-thiourea (PTU; 8.8 μM) functioned as the positive control in all in vivo experiments. The effect of test compounds on the viability of zebrafish [23] and the endogenous pigmentation process was examined through a stereomicroscope Z16 (Leica Microsystems, Ernst-Leitz-Strasse, Germany) (40X) and Image pro-plus software pack (Media Cybernetics, Inc, Rockville, USA) was used to evaluate body pigmentation.
2.13. Measurement of zebrafish melanin content and tyrosinase activity
The quantification of melanin, tyrosinase enzyme activities was determined as defined in a former study with some modifications [24]. Briefly, 24 hpf zebrafish embryos were treated with vehicle (0.1% DMSO), or Pt (2.5 or 5 μM), or Rv (10 μM) for 72 hpf. Later, embryos were sonicated, and the supernatant was clarified to measure melanin content at 400 nm (λ400). For tyrosinase enzyme activity estimation, fixed volumes of total protein equivalent to 250 μg and 100 μL of l-DOPA (5 mM) were loaded in each well of a 96-well plate. After 1 h at 37 °C, the color developed was measured at 475 nm (λ475). An ELISA plate reader (Dynatech MR 7000 & Dynex MRX) was used to measure melanin and content and tyrosinase activities. Data were obtained from three or more experiments, and melanin or tyrosinase activities were calculated and denoted as a percentage difference over the control value of 100%.
2.14. Extraction of mRNA from zebrafish embryos and RT-PCR
24 h post-fertilized (hpf) zebrafish embryos were subjected to Pt (2.5 and 5 μM), Rv (10 μM), or vehicle (0.1% DMSO) for 72 hpf followed by mRNA isolation was conducted as explained elsewhere [25]. The PCR experiment was run in a Bio-Rad iCycler PCR machine (Bio-Rad, Hercules, CA, US) using SuperScript-III One-Step platinum Taq commercial kit (Invitrogen, Carlsbad, CA, USA). Approximately 1 μg of isolated total RNA and custom-made forward and reverse primers provided by a commercial supplier were used to determine the tyrosinase gene expression [6]. Data were denoted as percentage differences over the vehicle. GAPDH functioned as an internal control.
2.15. Statistical analysis
Analysis of variance (ANOVA), and Dunnett's test were performed for pair-wise comparisons using Sigma Plot 10.0 statistical software among the control and test groups. Data (n = ≥ 3) were indicated as mean ± standard deviation (mean ± SD). Statistical values were assigned as *p < 0.05; **p < 0.01; ***p < 0.001 compared with untreated control or vehicle treated groups and #p < 0.05; ##p < 0.01; ###p < 0.001 compared to test samples or inducers or UVA-irradiated groups.
3. Results
3.1. Pt-treated HaCaT cells restored UVA-induced cell death
Pterostilbene (Pt) and resveratrol's (Rv) cytoprotection efficacy (Fig. 1A) against UVA-induced cytotoxicity in HaCaT cells was first demonstrated. MTT data indicated that Pt (5 μM)-treated cells not only restored but also significantly increased the cell viability compared to the untreated control, 2.5 μM Pt, and 10 μM Rv treatments, suggesting that Pt is relatively safe and more effective than Rv in protecting the HaCaT cells from UVA radiation (Fig. 1B). Subsequently, the protective effect of Pt (5 μM) against different intensities of UVA radiation (0–12 J/cm2) was also demonstrated. Data showed that with increasing UVA intensities, the HaCaT cell viability was gradually decreased (~50%) (Fig. 1C). However, compared to UVA-alone irradiated cells, Pt pretreatment (5 μM) has significantly restored HaCaT cell viability (Fig. 1C). Based on this observation, 3 J/cm2 UVA radiation was opted to use in the rest of the study.
Fig. 1.

Pterostilbene improved HaCaT cell viability but repressed UVA-induced intracellular ROS production. (A) Chemical structures of Pterostilbene (Pt) and Resveratrol (Rv). (B–C) Cell viability was calculated by the MTT method. HaCaT cells were pre-incubated with Pt (0–5 μM) or Rv (10 μM) for 24 h followed by irradiation with 3 J/cm2 UVA (B). HaCaT cells were treated with or without Pt (5 μM) for 24 h and then irradiated with different UVA intensities (0, 3, 6, or 12 J/cm2) (C). Cells neither treated with Pt or Rv or UVA-irradiated were considered as the untreated control. (D–E) HaCaT cells were pretreated with Pt (5 μM) or Rv (10 μM) for 24 h, followed by irradiated or not with 3 J/cm2 UVA. The intracellular ROS levels were indicated by DCF and measured by fluorescence microscopy (200× magnification) (D). Fluorescence intensity of the DCF-stained cells for each condition was quantified by Olympus Softimage solution software, and data were denoted as fold difference over untreated control values (E). Cells neither treated with Pt or Rv or UVA-irradiated were considered as the untreated control. Results were denoted as mean ± SD of three or more independent experiments. Statistical significance was considered as *p < 0.05, **p < 0.01 and ***p < 0.001 compared to untreated control. #p < 0.05 and ###p < 0.001 compared to UVA-irradiated cells.
3.2. Pt suppressed UVA-induced intracellular ROS in HaCaT cells
Later, the antioxidant property of Pt (5 μM) and Rv (10 μM) were compared against UVA-induced intracellular ROS in HaCaT cells. DCF data showed that UVA irradiation caused a remarkable increase in ROS levels in HaCaT cells compared to untreated control cells (~8 folds). The pretreatment (24 h) with Pt or Rv significantly downregulated this effect and brought down the ROS levels close to lesser than control levels. Interestingly, Pt (5 μM) exhibited a potent anti-ROS effect than Rv (10 μM) (Fig. 1D and E).
3.3. Pt suppressed UVA-induced α-MSH expression in HaCaT cells
In keratinocytes, UVA radiation induces ROS-mediated POMC expression, which leads to the production of α-MSH. α-MSH is a peptide hormone that regulates skin pigmentation. Therefore, the anti-melanogenic efficacy of Pt or Rv in UVA-irradiated HaCaT cells was tested. Western blot data showed that compared to non-treated cells, UVA-irradiation caused increased α-MSH and POMC expression levels. But this effect was dose-dependently repressed by Pt, with observable suppression at 5 μM Pt concentration compared to Rv (10 μM). Moreover, in Pt (5 μM) or Rv (10 μM) alone treated cells (used as positive controls), α-MSH and POMC proteins expression were significantly downregulated (Fig. 2A).
Fig. 2.

Pt suppressed UVA-induced α-MSH expression in HaCaT cells and other melanogenic proteins in B16F10 cells. (A) HaCaT cells were first treated with Pt (0–5 μM) or Rv (10 μM) for 24 h and then irradiated or not with 3 J/cm2 UVA. After 8 h, cells were collected, proteins were extracted. The Western blot method to determine POMC and α-MSH protein levels. (B–D) The conditioned medium obtained from Pt pretreated (2.5 or 5 μM, 24 h) and 3 J/cm2 UVA-irradiated HaCaT cells were tested on B16F10 cells for the indicated time points. The Western blot method determined the expression of CREB, p-CREB (2 h) (B), MITF (4 h) (C) or tyrosinase (24 h) proteins (D). β-actin or histone proteins were used as loading control proteins. AlphaEaseFC™ software was used to measure the immunoreactive protein bands (Genetic Technologies, Inc. Florida, USA). (E) Pt inhibited melanin formation in α-MSH-stimulated B16F10 cells – different concentrations of Pt (0–30 μM, 24 h) were first treated to B16F10 cells, and then stimulated or not with α-MSH (1 μM, 24 h). Melanin was quantified as described in the methodology. Results were denoted as mean ± SD of three or more independent experiments. Statistical significance was considered as ***p < 0.001 compared to untreated control and ###p < 0.001 compared to α-MSH-stimulated cells.
3.4. CREB-MITF-tyrosinase pathway downregulated in B16F10 cells treated with HaCaT conditioned medium
α-MSH secreted from keratinocytes binds to melanocyte MC1 receptors leading to adenyl cyclase activation and cAMP production. This cascade of protein expression further drives the stimulation of a transcription factor CREB, facilitating MITF promoter's activation for tyrosinase expression and melanin production. Based on this mechanism, we tested the conditioned medium's effect derived from HaCaT cells pre-incubated with Pt and irradiated with UVA (assuming to contain secreted α-MSH) on melanoma B16F10 cells to check the expression patterns of different proteins. The Western blot data indicated that in the absence of Pt or Rv, conditioned medium-derived from UVA-irradiated HaCaT remarkably upregulated CREB, p-CREB, MITF, tyrosinase levels in B16F10 cells. However, pretreatment with Pt or Rv down-regulated this effect. Compared to Rv, Pt showed a potent effect. Notably, HaCaT cell-conditioned medium obtained from HaCaT cells without UVA exposure but only treated with Pt also suppressed the CREB, p-CREB, MITF, tyrosinase proteins in B16F10 cells (Fig. 2B–D).
3.5. Pt inhibited α-MSH-stimulated melanin production in B16F10 cells
Further, the effect of Pt (0–30 μM) on α-MSH-stimulated melanin formation was demonstrated in B16F10 cells. Data showed that more than 2-fold increase in the production of melanin levels in α-MSH alone stimulated cells. However, Pt dose-dependently suppressed this effect with maximum suppression detected at 30 μM Pt concentration. Notably, 30 μM Pt alone treatment (used as a positive control) also showed significant suppression of melanin production, indicating the anti-melanin ability of Pt in melanocytes (Fig. 2E). Further, Pt alone treatment also showed significant suppression of melanin production.
3.6. Pt suppressed various melanogenesis-associated proteins expression in B16F10 cells stimulated with α-MSH
The effect of the α-MSH-stimulated expression pattern of different melanogenic proteins was demonstrated in Pt-pretreated B16F10 cells. MC1R is a membrane receptor on the melanocyte surface to which α-MSH binds and activates the cascade of downstream effects. The Western blot data showed that MC1R protein expression was significantly upregulated in α-MSH-stimulated cells. But Pt dose-dependently and significantly downregulated this effect with maximum effect detected at 30 μM Pt (Fig. 3A). Further, Pt alone treatment also suppressed MC1R expression.
Fig. 3.

Pt suppressed various melanogenesis-related proteins in B16F10 cells stimulated with α-MSH. (A) B16F10 cells were first treated with Pt (0–30 μM) followed by stimulation or not with α-MSH (1 μM) to determine the expression pattern of different melanogenesis-associated proteins - MC1R (15 min) (A) p-MITF (4 h), MITF (4 h) (B–C), and tyrosinase (24 h), TRP-1 (24 h), and TRP-2 (24 h) (D–E). After incubation, cells were harvested, and protein lysates were put through the Western blot analysis. β-actin functioned as a loading control protein. Results were denoted as mean ± SD of three or more independent experiments. Data were denoted as fold-difference over untreated control. Statistical significance was considered as *p < 0.05, ***p < 0.001 compared to untreated control. #p < 0.05 compared to α-MSH-stimulated cells.
The proteins MITF, tyrosinase, and TRP-1/-2 sequentially lead the melanogenesis process. MITF is a primary transcriptional regulator protein involved in melanocyte survival, proliferation, and growth. Tyrosinase is a rate-limiting enzyme that catalyzes the transformation of l-tyrosine to l-DOPA. The proteins TRP-1 and TRP-2 further lead the process, eventually forming melanin. Therefore, we demonstrated the expression patterns of p-MITF, MITF, tyrosinase, TRP-1, and TRP-2 proteins in α-MSH-stimulated B16F10 cells pretreated with Pt. The Western blot data indicated that compared to α-MSH-treated cells, Pt dose-dependently and significantly downregulated p-MITF, MITF, tyrosinase, TRP-1, and TRP-2 expression with a maximum effect observable at 30 μM Pt concentration (Fig. 3B–E). Remarkably, Pt alone treatment also significantly downregulated these protein's expression (Fig. 3B–E). Therefore, we infer that Pt exhibited a strong anti-melanogenic effect on α-MSH-stimulated melanocytes.
3.7. Pt upregulated LC3 and p62 expressions in HaCaT cells
Of the inter-link between autophagy and anti-melanogenesis [26], we speculated that autophagy plays a strategic role in Pt-facilitated anti-melanogenic effects. Therefore, the effect of Pt on LC3-I/II (autophagy marker) and p62 (adaptor protein) expressions in HaCaT cells was first tested. As shown in Fig. 4A, Pt dose-dependently and significantly upregulated LC3 and p62 proteins in HaCaT cells supported our assumption that autophagy influences the Pt-facilitated anti-melanogenic effects in HaCaT cells (Fig. 4A).
Fig. 4.

Pt induced autophagy in HaCaT cells. Diverse concentrations of Pt (0–5 μM, 24 h) were treated to HaCaT cells - (A) The change of LC3-I to LC3-II and p62 protein expressions were measured through the Western blot method. Data were expressed as fold differences over untreated control cells. The β-actin protein functioned as a loading control. (B–C) Pt increased AVO formation – 3-MA (1 mM, 1 h) pretreated HaCaT cells were incubated with Pt (5 μM, 24 h). A fluorescence microscope (under red filter) was used to visualize the intracellular AVOs (Bar = 50 μm). AVO number is proportional to the intensity of red fluorescence. Values were quantified using Olympus Softimage Solution software. Data were denoted as fold differences over control (untreated) cells. (D) Pt decreased gp100 levels – B16F10 cells were stimulated with α-MSH (1 μM, 72 h). After incubation, the medium was separated and centrifuged at 1200 rpm for 5 min to collect the supernatant (containing melanin). 2 mL of this supernatant was treated to HaCaT cells (grown in 60 mm dish) and incubated for 72 h. Later, HaCaT cells were treated with Pt (2.5 or 5 μM, 24 h). The Western blot technique measured the LC3-II and melanoma gp100 proteins expression. β-actin functioned as an internal control protein. LC3-II data were denoted as percentage difference over untreated control. Melanoma gp100 protein data were denoted as fold-difference over untreated control. All results were denoted as mean ± SD of three or more independent experiments. Statistical significance was considered as *p < 0.05, **p < 0.01, ***p < 0.001 compared to untreated control cells. #p < 0.05, ##p < 0.01 compared to melanin alone or Pt alone treated cells.
3.8. Pt decreased AVO formation in 3-MA pretreated HaCaT cells
Pt-induced autophagy was further evaluated through AVO production in HaCaT cells. AVOs are characterized by increased accumulation of lipidated LC3-II, which can be detected by acridine orange (AO) dye. Based on this, the association between Pt, autophagy, and AVO formation was determined using an autophagy inhibitor 3-MA. Results indicated that compared to the untreated control cells, Pt alone treatment significantly accumulated AVOs within HaCaT cells. However, pre-incubation with 3-MA significantly blocked this effect in HaCaT cells. Notably, 3-MA alone treatment also significantly downregulated AVO production (compared to untreated control), inferring a basal level AVO production signifying autophagy process in the cells (Fig. 4B and C).
3.9. Pt decreased melanosome gp100 but increased LC3-II proteins in HaCaT cells pre-incubated with melanosome content (melanin)-derived from melanoma B16F10 cells
Melanin is synthesized in melanocytes and stored in specialized organelles called ‘melanosomes,’ which transfer the melanin pigment to the neighboring keratinocytes. Melanosomes are lysosome-related organelles on which a transmembrane melanoma antigen protein gp100 is expressed. gp100 protein is also involved in melanosome maturation. Therefore, we tested the effect of Pt on LC3-II and gp100 protein expression levels in HaCaT cells pre-incubated with melanosome content (melanin) derived from melanoma B16F10 melanocytes. The Western blot data indicated that cells treated with melanosome extract alone significantly downregulated the LC3-II levels. However, Pt (2.5 and 5 μM) significantly restored this effect. In the case of melanosome gp100 protein, the expression was significantly upregulated in melanin-treated HaCaT cells. But pretreatment with Pt dose-dependently and significantly suppressed gp100 protein levels. This data inferred that autophagy plays an essential role in Pt-mediated anti-melanogenesis in melanin-treated keratinocytes (Fig. 4D).
3.10. Nrf2, HO-1, and γ-GCLC expression upregulated in Pt-treated HaCaT cells
The Pt's role on the Nrf2 cytoprotective pathway to induce antioxidant protein expressions was evaluated in UVA-exposed HaCaT cells. Fluorescence staining data indicated that Pt (5 μM) significantly upregulated the Nrf2 nuclear localization suggesting that Pt favors the Nrf2 antioxidant pathway in HaCaT cells (Fig. 5A). Notably, this effect was noticeable within 0.5 h after Pt treatment (Fig. 5B), followed by HO-1 and γ-GCLC expressions at 1 h and 2 h, respectively (Fig. 5C). We also tested the effect of Pt on Nrf2 and its-related protein expression in UVA-exposed cells. The Western blot data indicated that Pt (2.5 and 5 μM) significantly increased Nrf2 and p-Nrf2 expressions with a simultaneous decrease in Keap-1 levels suggesting the dissociation of Nrf2-Keap-1 complex and nuclear accumulation of Nrf2 leading to the antioxidant protein's expression in HaCaT cells (Fig. 5D and E).
Fig. 5.

Pt accumulated nuclear Nrf2 levels leading to HO-1, γ-GCLC expressions in HaCaT cells. 5 μM Pt was treated to the cells. (A) The immunofluorescence method was used to examine (magnification × 200) the nuclear localization of Nrf2 protein. (B–C) The Western blot method determined the expression of nuclear Nrf2 (0–4 h) (B) or HO-1 and γ-GCLC proteins (0–8 h) (C). (D–E) Cells were first treated with Pt (0–5 μM for 24 or 0.5 h), followed by 3 J/cm2 UVA-irradiation or not for the indicated time. The Western blot method determined the expressions of Nrf2, Keap-1, p-Nrf2 proteins (D). The Nrf2/Keap-1 ratio data were denoted as the fold-difference over untreated control (E). β-actin functioned as a loading control protein. Results were denoted as mean ± SD of three or more independent experiments. Statistical significance was considered as **p < 0.01, ***p < 0.001 compared to untreated control and #p < 0.05, ###p < 0.001 compared to UVA-irradiated cells.
3.11. ERK, AMPK, and ROS pathways mediated the nuclear translocation of Nrf2 in Pt-treated HaCaT cells
Furthermore, we demonstrated the signaling pathways mediating the Pt-activated Nrf2 nuclear translocation. Western blot data indicated that ERK, AMPK, and ROS signaling pathways were involved in nuclear Nrf2 activation (Fig. 6A). Also, it was shown that the phosphorylation of ERK (p-ERK) and AMPK (p-AMPK) was activated 2 h after Pt treatment (Fig. 6B). In the case of ROS, the DCF fluorescence data showed an increase in ROS levels 30 min (~2-fold) after Pt treatment (Fig. 6C and D). Therefore, we could infer that after Pt treatment, the ROS pathway is first activated, followed by ERK and AMPK pathways in the nuclear Nrf2 activation in HaCaT cells.
Fig. 6.

Various signaling pathways mediate the activation of nuclear Nrf2 in Pt-treated HaCaT cells. (A) Cells were first treated with 20 μM SB203580 (p38 inhibitor), 30 μM PD98059 (ERK inhibitor), 25 μM SP600125 (JNK inhibitor), 30 μM LY294002 (PI3K/AKT inhibitor), 2.5 μM GF109203X (PKC inhibitor), 10 μM Compound C (AMPK inhibitor), 20 μM CKII, (Casein kinase II inhibitor), or 1 mM NAC (ROS inhibitor) for 30 min. Later, Pt was treated to the cells (5 μM, 30 min). After incubation, cells were harvested, and nuclear Nrf2 protein expression was measured through the Western blot method. The histone protein functioned as the loading control. (B) Cells were tested with 5 μM Pt for 0–120 min. p-ERK, ERK, and p-AMPK proteins were measured by the Western blot method. β-actin functioned as an internal control protein. (C–D) Cells were treated with Pt (5 μM, 0–60 min) and the intracellular ROS were indicated by DCF, which were measured by fluorescence microscopy (200× magnification). Fluorescence intensity of the DCF-stained cells for each condition was quantified by Olympus Softimage solution software, and data were denoted as ROS-fold difference over untreated control values versus different time points (D). Results were denoted as mean ± SD of three or more independent experiments. Statistical significance was considered as ***p < 0.001 compared to untreated control and ###p < 0.001 compared to cells treated with 5 μM Pt for at 30 min time point.
3.12. Pt-mediated Nrf2 and antioxidant protein expressions were downregulated in Nrf2-knockdown cells
The knockdown method was used to silence the Nrf2 expression to demonstrate the effect of Pt on different antioxidant proteins. The Western blot data indicated that Nrf2 protein expression was inhibited in siNrf2 cells. Besides this, the antioxidant proteins HO-1, NQO-1, and γ-GCLC were significantly downregulated in siNrf2 cells signifying that Nrf2 expression is pivotal antioxidant protein expression in Pt-treated HaCaT cells (Fig. 7A). Furthermore, the Nrf2 silencing effect on UVA-induced intracellular ROS levels was also tested. DCF fluorescence data revealed that compared to the control siRNA cells, UVA exposure caused a remarkable increase in ROS levels in siNrf2 cells. However, compared to the control siRNA cells, Pt (5 μM) treatment could not significantly suppress ROS levels in siNrf2 cells, inferring that Nrf2 expression is a must to cope with the UVA-induced intracellular ROS insult in HaCaT cells (Fig. 7B).
Fig. 7.

Silencing of Nrf2 suppressed Pt-mediated protective effects in HaCaT cells. (A) Cells transfected with specific siRNA for Nrf2 or nonsilencing control were tested with Pt (5 μM) for the indicated time. The Western blot method measured the expression of total Nrf2 (0.5 h), HO-1 (6 h), NQO-1 (8 h), and γ-GCLC (8 h) proteins. (B) Transfected cells were first treated with Pt (5 μM, 24 h) and then exposed or non-exposed to 3 J/cm2 UVA. DCF fluorescence technique was used to measure the ROS levels. (C) Transfected cells were first treated with Pt (30 μM, 24 h) followed by exposure or non-exposed to 3 J/cm2 UVA to determine α-MSH protein levels through the Western blot method. Results were denoted as mean ± SD of three or more independent experiments. Statistical significance was considered as *p < 0.05, ***p < 0.001 compared to UVA-irradiated transfected cells.
3.13. Nrf2 knockdown reversed UVA-induced α-MSH expression in Pt pre-incubated HaCaT cells
α-MSH protein expression was tested in Nrf2 knockdown cells exposed to UVA-irradiation. Data showed that pre-incubation with 30 μM Pt downregulated α-MSH protein expression in UVA-irradiated control siRNA cells. However, this effect was reversed (increased) in siNrf2 cells provided with the same experimental conditions, suggesting that Nrf2 is essential in regulating UVA-induced α-MSH expression in HaCaT cells (Fig. 7C).
3.14. Pt increased autophagy activity in melanoma B16F10 cells
The role of autophagy in Pt's anti-melanogenic efficacy was investigated in melanoma B16F10 cells as well. Before proceeding, the cytotoxic effect of Pt on B16F10 cell viability was first tested. The MTT analysis revealed that B16F10 cells treated with Pt (30 μM) for 24, 48, or 72 h did not show any obvious effect (>80%) on B16F10 cell viability (Fig. 8A). Based on this data, ≤ 30 μM Pt was considered as non- or sub-cytotoxic Pt concentrations to carry out further in vitro experiments in this study. Later, the autophagy-inducing effect of Pt was tested by demonstrating the expression patterns of various autophagy-regulating proteins. The Western blot data indicated that Pt (0–30 μM) dose-dependently and significantly upregulated the pro-autophagic LC3-II and p62 proteins expression but significantly suppressed the anti-autophagic ATG4B protein expression leading to autophagy induction in B16F10 cells (Fig. 8B and C).
Fig. 8.

Pt induced autophagy flux in B16F10 cells. Different concentrations of Pt (0–30 μM, 24, 48, 72 h) were treated to B16F10 cells - (A) MTT assay determined the cell viability. (B–C) The Western blot technique determined the conversion of LC3-I to LC3-II and p62 and ATG4B proteins. The β-actin functioned as a loading control. (D–E) Pt increased AVO formation – B16F10 cells were first treated with 3-MA (1 mM, 1 h) and then with Pt (30 μM, 24 h). A fluorescence microscope (under red filter) was used to visualize the intracellular AVOs (Bar = 50 μm). AVO number is proportional to the intensity of red fluorescence. Values were quantified using Olympus Softimage Solution software. Data were denoted as fold differences over untreated control cells. Results were denoted as mean ± SD of three or more independent experiments. Statistical significance was considered as **p < 0.01, ***p < 0.001 compared to untreated control cells. ###p < 0.001 compared to Pt-alone treated cells.
3.15. Pt increased AVO formation in B16F10 cells
Pt-induced autophagy flux in B16F10 cells was further investigated through the estimation of AVO production inside the cells. The increased accumulation of lipidated LC3B levels was signified by AVO formation, determined by the AO staining method. Fluorescence data showed a significantly increased appearance for AVOs in the Pt-treated cells. However, an autophagic inhibitor 3-MA significantly downregulated this effect, signifying that Pt strongly induces autophagy flux/AVOs in B16F10 cells (Fig. 8D and E). One notable observation was that compared to the untreated control cells, 3-MA alone treatment (used as a positive control) also significantly downregulated AVO formation (Fig. 8D and E).
3.16. Pt suppressed the PI3K/AKT/mTOR pathway in B16F10 cells
PI3K/AKT/mTOR pathway is known to be a negative regulator of autophagy. Downregulation of this pathway favors cells to undergo autophagy. Therefore, the Pt's effect on PI3K/AKT/mTOR pathway was evaluated in B16F10 cells. The Western blot data showed that the PI3K, AKT, and mTOR phosphorylation were significantly downregulated with increasing Pt (Fig. 9A–D). A maximum downregulation effect was observed at 30 μM concentration, denoting that Pt is facilitating the B16F10 cells to undergo autophagy.
Fig. 9.

Pt suppressed PI3K/AKT/mTOR pathway and dysregulated the Beclin-1/Bcl-2 and Bax/Bcl-2 ratios in B16F10 cells. Inhibitory effects of Pt in B16F10 cells. Different concentrations of Pt (0–30 μM, 8 or 24 h) were treated to the cells. The Western blot technique determined the p-PI3K, PI3K (8 h), p-AKT, AKT (8 h), p-mTOR, mTOR (8 h) (A–D) or Beclin-1, Bcl-2, Bax (24 h) (E–F) proteins. Data were denoted as fold differences between phosphorylated and non-phosphorylated forms of PI3K (B), AKT (C), or mTOR (D) proteins. In Beclin-1, Bcl-2, Bax proteins, data were denoted as fold ratio between Beclin/Bcl-2 (E) or Bax/Bcl-2 (F). The β-actin functioned as a loading control. Results were denoted as mean ± SD of three or more independent experiments. Statistical significance was considered as **p < 0.01, ***p < 0.001 compared to untreated control cells.
3.17. Beclin-1/Bcl-2 ratio deregulated in Pt-treated B16F10 cells
The Beclin-1, Bcl-2, and Bax proteins play interesting roles in autophagy, apoptosis mechanisms. Beclin-1 is essential in pre-autophagosomal structure formation. It also recruits important autophagy proteins and initiates autophagy. Bcl-2 protein acts as a crosstalk protein in both autophagy and apoptosis mechanisms and decides the cellular fate to undergo either autophagy or apoptosis. The binding of Bcl-2 to Beclin-1 decreases the pro-autophagic nature of the later one. But the anti-apoptotic role of Bcl-2 cannot be neutralized by Beclin-1 protein. Bax is a pro-apoptotic protein that counteracts the apoptotic-preventing effect of Bcl-2. Bax/Bcl-2 ratio can act as a ‘rheostat’ and decides cell susceptibility to apoptosis. As shown in Fig. 9E and F, the Beclin-1/Bcl-2 ratio was significantly upregulated in Pt treated cells but no significant effect on Bax/Bcl-2 ratio. This data adds an extra layer of confirmation that Pt is inducing autophagy in B16F10 cells.
3.18. Autophagy inhibitor 3-MA negatively affected the anti-melanogenic activity of Pt in B16F10 cells
The inter-relationship between autophagy and anti-melanogenic effects of Pt in B16F10 cells was further analyzed using a potent autophagic inhibitor 3-MA. For this, we first tested if 3-MA has any negative effect on the viability of Pt-treated B16F10 cells. The 24 h MTT data indicated that B16F10 cells exposed to 3-MA increased cell viability (Fig. 10A). However, when treated with Pt for 24 h, in the absence or presence of 3-MA, it did not show any obvious effect on B16F10 cell viability up to 30 μM Pt concentration (Fig. 10A). Whereas 72 h MTT data indicated that B16F10 cells exposed to 20 or 30 μM Pt slightly decreased cell viability in the absence or presence of 3-MA (Fig. 10B). Later, the effect of 3-MA pretreatment on expression patterns of different melanogenesis-related proteins in Pt-treated B16F10 cells. The Western blot data designated that in the presence of 30 μM Pt, the expression of the proteins p-CREB, CREB, p-MITF, MITF, and tyrosinase, TRP-1/-2 were significantly downregulated (Fig. 10C–E). However, due to autophagy inhibition (because of 3-MA), the expression of these proteins was upregulated in 3-MA- and Pt-treated cells (Fig. 10C–E), inferring that autophagy is key in the Pt-mediated anti-melanogenic effect in B16F10 cells.
Fig. 10.

3-MA negatively affected the anti-melanogenic activity of Pt in B16F10 cells. (A–B) Cells were first treated or not with 3-MA (1 mM, 1 h) followed by Pt (0–30 μM) for 24 h (A) or 72 h (B). After treatments, an MTT assay was performed to determine the cell viability. (C–E) Cells were first treated or not with 3-MA (1 mM, 1 h), followed by 30 μM Pt treatment for different time points to allow the expression of various melanogenesis-associated proteins - p-CREB (2 h), CREB (2 h) (C), p-MITF (4 h), MITF (4 h) (D), tyrosinase (24 h), TRP-1 (24 h), TRP-2 (24 h) (E) through the Western blot method. β-actin functioned as a loading control. (F) Cells were treated with Pt (30 μM) in the absence or presence of 3-MA (1 mM, 1 h) followed by stimulation with α‐MSH (1 μM, 24 h). The melanosome-engulfing autophagosomes in the cells were analyzed through transmission electron microscopy (Tecnai 12, FEI, Hillsboro, Oregon USA) (Bar = 1 μm). The black arrows indicate autophagosome containing melanin or melanosome. (G) Cells were first treated or not with 3-MA (1 mM, 1 h), and then with Pt (30 μM, 72 h) followed by stimulation with α‐MSH (1 μM, 24 h). Cells were harvested, and intracellular melanin levels were estimated as described in the methodology. Cells treated with 30 μM Pt alone or α‐MSH alone or 3-MA alone functioned as controls. Results were denoted as mean ± SD of three or more independent experiments. Statistical significance was considered as ***p < 0.001 compared to untreated control cells or α‐MSH-stimulated cells. ##p < 0.01 compared to α‐MSH + Pt treated cells.
3.19. 3-MA inhibited the Pt-induced melanosome-engulfing autophagosomes in α‐MSH-stimulated B16F10 cells
Transmission electron microscopy was used to evaluate the role of autophagy in Pt-induced melanosome-engulfing autophagosomes in B16F10 cells. Data showed that α‐MSH alone treatment formed melanosomes in B16F10 cell cytosol. However, in Pt-pretreated cells, autophagosomes were engulfing the melanosomes. Interestingly, 3-MA pretreatment inhibited this effect. This data confirmed that Pt caused autophagy flux in B16F10 cells leading to anti-melanogenesis (Fig. 10F).
3.20. 3-MA reversed the Pt-suppressed melanin production in α‐MSH-stimulated B16F10 cells
The effect of 3-MA on Pt-mediated melanin suppression in α‐MSH-stimulated B16F10 cells was demonstrated. Data revealed that compared to the α‐MSH alone treatment, 3-MA+α‐MSH treated cells showed significant upregulation of melanin levels suggesting that due to autophagy inhibition, α‐MSH could remarkably upregulate melanin levels. However, compared to this effect, cells pretreated with 3-MA and 30 μM Pt and stimulation with α‐MSH (3-MA+α‐MSH+30 μM Pt) showed decreased melanin levels (Fig. 10G). Overall, this data inferred that autophagy (3-MA treatment) inhibition negatively affects the anti-melanogenic efficacy of Pt in B16F10 cells, indicating that autophagy is essential to exhibit Pt's depigmenting effects.
3.21. LC3 silencing repressed Pt-mediated anti-melanogenesis in B16F10 cells
The role of Pt-mediated autophagy in melanocytes was further evaluated from the perspective of LC3 protein as well. Knockdown studies were conducted in B16F10 cells by silencing the LC3 expression, and then exposed to 30 μM Pt to evaluate different key melanogenic proteins expression (Fig. 11A–E). The Western blot data suggested that silencing of LC3 in the transfected cells (but not in control siRNA cells) significantly downregulated the Pt-induced LC3-II protein expression confirming that LC3 was successfully knock downed (Fig. 11A and B). The tyrosinase (Fig. 11A and C), TRP-1 (Fig. 11A and D), or TRP-2 (Fig. 11A and E) protein's expression were decreased in the Pt-treated control siRNA cells. However, compared to the Pt-treated control siRNA cells, the tyrosinase (Fig. 11A and C), TRP-1 (Fig. 11A and D), or TRP-2 (Fig. 11A and E) protein's expression in siLC3 cells treated with Pt showed a significant increase in the expression of tyrosinase and TRP-1/-2 proteins (Fig. 11A and C–E). Results infer that LC3 function (autophagy) is essential in Pt-mediated anti-melanogenesis in B16F10 cells.
Fig. 11.

LC3 knockdown diminished Pt-mediated anti-melanogenic proteins expression in B16F10 cells. Transfection experiment was conducted as described in the methodology. The LC3 expression was silenced using a specific siRNA against LC3. Non-silenced cells functioned as control. (A–E) Transfected cells were treated with 30 μM Pt for the indicated time points to allow the expression of LC3 (24 h) (B), tyrosinase (24 h) (C), TRP-1 (24 h) (D), and TRP-2 (24 h) (E) proteins in both non-silenced (control siRNA) and siLC3 cells. After incubation, cells were harvested, and cell lysate was subjected to the Western blot technique. The β-actin protein functioned as a loading control. Results were denoted as mean ± SD of three or more independent experiments. Statistical significance was considered as *p < 0.05 ***p < 0.001 compared to control siRNA cells and #p < 0.05, ###p < 0.001 compared to Pt-treated control siRNA cells.
3.22. 3-MA inhibited Pt-mediated anti-melanogenic effects in zebrafish embryos
The in vitro anti-melanogenic effects of Pt were further evaluated in zebrafish embryos used as the in vivo experimental model. The effect of Pt (2.5 and 5 μM) or Rv (10 μM) on zebrafish endogenous body pigmentation was observed through a stereomicroscope. Data showed that compared to the DMSO exposed 24 h post-fertilized (hpf) embryos, Pt (2.5 or 5 μM) incubated embryos significantly decreased the endogenous body pigmentation in 48 or 72 hpf (Fig. 12A). Pt (2.5 or 5 μM) exhibited more potent depigmentation effect than Rv (10 μM) (Fig. 12A). 1-phenyl-2-thiourea (PTU, 8.8 μM) functioned as a positive control. Interestingly, 72 hpf embryos incubated with the autophagy inhibitor 3-MA and Pt (5 μM, 24 h) showed significantly higher endogenous pigmentation than Pt (5 μM) alone (72 + 24 hpf) (Fig. 12B). These in vivo data confirmed that Pt is exhibiting the anti-melanogenic effects through the autophagy mechanism.
Fig. 12.

Anti-melanogenic effects of Pt on Zebrafish embryos. A stereomicroscope was used to observe the changes in endogenous body pigmentation in the zebrafish embryos (lateral views were denoted in the figures). (A) Vehicle (0.1% DMSO) or Pt (2.5 and 5 μM) or Rv (10 μM) were treated to 24 hpf zebrafish embryos and incubated for 48 or 72 hpf embryos. (B) 72 hpf embryos pre-incubated without or with 3-MA (1 mM) were further incubated in the presence of Pt (5 μM) for 24 h (72 + 24 hpf). 1-phenyl-2-thiourea (PTU, 8.8 μM) functioned as a positive control. Results were calculated from three or more independent experiments.
3.23. Pt did not significantly affect the zebrafish embryo viability
Pt-mediated anti-melanogenesis-associated parameters were further evaluated using the 24 hpf zebrafish embryos. For this, we first tested the zebrafish embryo viability under different experimental conditions. Data showed that compared to untreated control (100%), there was no significant percentage of zebrafish viability observed under different treatment conditions (DMSO or Pt or Rv or PTU for 24, 48, or 72 hpf) (Fig. 13A). Overall, the data suggested that testing the Pt under in vivo experimental conditions is relatively safe.
Fig. 13.

Pt downregulated the tyrosinase expression and melanin levels in zebrafish. Zebrafish embryos (24 hpf) were incubated with vehicle (0.1% DMSO) or Pt (2.5 and 5 μM) or Rv (10 μM) for 72 hpf. (A) The zebrafish viability was counted under the stereomicroscope. (B) The tyrosinase enzyme activity under different treatment conditions was measured as described in the Methodology Section. (C) Tyrosinase gene expression was measured using the RT-PCR technique. GAPDH functioned as an internal control gene (D) Melanin production induced under different treatment conditions was quantified from zebrafish lysates as explained in the Methodology Section. 1-phenyl-2-thiourea (PTU, 8.8 μM) functioned as a positive control. Results were denoted as mean ± SD of three or more independent experiments. Data were denoted as percentage differences over untreated control zebrafish embryos. Statistical significance was considered as *p < 0.05, **p < 0.01, ***p < 0.001 compared to untreated zebrafish embryos.
3.24. Pt suppressed endogenous body pigmentation, tyrosinase activity/expression, and melanin levels in the zebrafish embryos
Later, the effect of Pt on tyrosinase and melanin levels was tested using the 72 hpf zebrafish embryos. Fig. 13B and C showed that tyrosinase enzyme activity and tyrosinase gene expression were significantly downregulated at 2.5 or 5 μM Pt concentration. PTU (8.8 μM) was used as a positive control. Moreover, the percentage of melanin levels was also shown to be significantly downregulated in Pt-treated conditions (Fig. 13D), suggesting the strong anti-melanogenic effect of Pt in zebrafish embryos. Interestingly, Pt (2.5 or 5 μM) exhibited a more potent anti-melanogenesis than Rv (10 μM) (Fig. 13B–D).
Further, the 72 hpf zebrafish embryos incubated with Pt, Rv, or PTU for 24 h (72 + 24 hpf) were subjected to estimate the endogenous body pigmentation, tyrosinase activity, and melanin levels. Stereomicroscopic data showed that compared to the DMSO, Pt (2.5 or 5 μM) treatment significantly downregulated the endogenous body pigmentation (Fig. 14A). Moreover, tyrosinase enzyme activity (Fig. 14B) and melanin levels (Fig. 14C) were also significantly downregulated at Pt-treated conditions. Pt (2.5 or 5 μM) exhibited a more potent anti-melanogenesis than Rv (10 μM) (Fig. 14A–C). PTU (8.8 μM) was used as a positive control. The in vivo data further confirmed that Pt is a potent anti-melanogenic and skin-whitening compound in the treatment of hyper-pigmentation.
Fig. 14.

Pt suppresses melanogenesis in 72 hpf zebrafish embryos. 72 hpf zebrafish embryos were incubated with vehicle (0.1% DMSO) or Pt (2.5 and 5 μM) or Rv (10 μM) for 24 h (72 + 24 hpf). 1-phenyl-2-thiourea (PTU, 8.8 μM) functioned as a positive control. A stereomicroscope was used to measure the endogenous body pigmentation (A). The method for estimating tyrosinase enzyme activity. (B) and melanin contents (C) was explained in the methodology. Results were calculated from three or more independent experiments. Data were denoted as percentage differences over untreated control zebrafish embryos. Statistical significance was considered as *p < 0.05, **p < 0.01, ***p < 0.001 compared to untreated zebrafish embryos.
4. Discussion
Pigmentation of the skin is usually harmless. But increased pigmentation may cause significant cosmetic nuisance leading to emotional and psychological distress to an individual. Nearly 15% of the world population from different cultural backgrounds are fond of lighter skin tone, which is believed to be associated with youth and beauty. The cosmetic business is ever-increasing worldwide, with billions of dollars investing in more efficient depigmenting agents and treatment methods [27]. Compounds developed from the chemical origin pose a significant risk of carcinogenicity, allergy, and other associated side effects. Therefore, natural compounds with potential anti-melanogenic activities and safe to use have garnered research attention. In this regard, identifying novel depigmenting compounds (or) investigating the anti-melanogenic ability of a compound that is already known to possess pharmaceutical applications in any other clinical condition [28] is the need of the hour. Previous research showed that pterostilbene exhibited hypopigmentation effects in α-MSH-triggered B16F10 cells through the downregulation of proteins involved in the pigmentation process [19]. It was also suggested that pterostilbene's hypopigmentation effects are more effective than its analogs resveratrol and resveratrol trimethyl ether [19]. Here, we further explore the depigmenting effects of Pterostilbene (Pt) and its underlying molecular mechanisms in keratinocytes and melanocytes through in vitro and in vivo approaches.
Melanin production provides color to the human skin and coping with the damaging effects of UVA-irradiation, a major extrinsic risk factor. The Pt was reported to be more potent than its analogous resveratrol (Rv), although both Pt and Rv share many similar pharmacological properties [16]. Supporting this fact, the MTT cell viability and DCF fluorescence data-derived from the UVA-irradiated HaCaT cells exhibited greater cytoprotective and antioxidant (anti-ROS) activities in Pt-pretreated than the Rv-pretreated cells, signifying that Pt is relatively effective than Rv [19] (Fig. 1). Both Rv and Pt are monomeric stilbenes. However, Pt works improved in membrane permeability, metabolic stability than resveratrol due to –OCH3 groups. This property raises the bioavailability and improves the pharmacokinetic profile, pharmacological activities of Pt [16].
Melanogenesis is a complex process. In this study, UVA-induced skin pigmentation regulating proteins, POMC and α-MSH were significantly downregulated in Pt pretreated HaCaT cells hinted that Pt exhibits an anti-melanogenic effect in UVA-irradiated keratinocytes. Interestingly, this effect was also shown to be more prominent in Pt than Rv pretreated cells [19] (Fig. 2). The α-MSH secreted from keratinocytes stimulates the MC1R receptor on melanocytes, which triggers cAMP production leading to the phosphorylation of CREB protein for the upregulation of MITF protein, a master regulator of melanocyte development, survival, and other functions [29]. MITF controls transcription of pigmentary genes, tyrosinase, TRP-1, TRP-2. Consequently, the conditioned medium collected from Pt pretreated and UVA-irradiated HaCaT cells (assumed to contain secreted α-MSH) was tested on B16F10 melanocytes shown to suppress the pigmentary proteins significantly CREB, p-CREB, MITF, and tyrosinase expression as well as melanin levels, added another line of support that Pt possess anti-melanogenic property [19] (Fig. 2). Further, it was confirmed that Pt significantly diminished melanogenesis-associated MCIR, MITF, tyrosinase, TRP-1/2, and melanin expression in α-MSH-stimulated B16F10 cells (Fig. 3). Our data also suggested a complex inter-functional complexity in keratinocytes and melanocytes during melanogenesis [30].
Nrf2-keap-1 cytoprotective pathway plays a pivotal part in the cellular antioxidant enzyme (HO-1 and γ-GCLC) production [31]. Different researchers concluded that Nrf2 activation could be carried out through the Nrf2-keap-1 dissociation and/or activation of kinase mechanisms [32,33]. Nrf2 activity is regulated in part by the Keap-1 protein, proposed to bind and tether the transcription factor in the cytoplasm. Previous studies showed that the liberation of Nrf2 from Keap-1 during a ROS/electrophilic stress impulse led to the activation and nuclear translocation of Nrf2 for the expression of phase 2 antioxidant enzymes – HO-1 and γ-GCLC [6,34]. In the current study, Pt treatment to HaCaT cells activated the nuclear translocation of Nrf2 protein (within 0.5 h), directing the expression of HO-1 and γ-GCLC proteins at later time points (Fig. 5A–C). Moreover, the Nrf2/Keap-1 dissociation ratio was significantly upregulated in Pt-pretreated and UVA-irradiated HaCaT cells, indicating the increased expression and nuclear translocation of Nrf2 (to nullify the electrophilic insult posed by UVA) (Fig. 5D and E). Therefore, it is reasonable to explain here that by Nrf2-mediated HO-1 and γ-GCLC activation (Fig. 5), Pt inhibited the UVA-induced ROS-mediated α-MSH production in HaCaT cells (Fig. 1, Fig. 2A). A growing body of literature revealed that Nrf2 stabilization and regulation also takes place through the phosphorylation of its serine/threonine residues by upstream kinases, such as MAPK, PKC, GSK-3β, and PI3K/AKT [35,36]. In a recent study, Pt was shown to mediate antioxidative protective effects through PI3K/AKT-dependent activation of the Nrf2/ARE pathway [17]. Previously, we reported that the natural polyphenolic antioxidant ellagic acid-arbitrate Nrf2 activation via JNK and PKC signaling pathways in HaCaT cells [37]. In this study, ERK and AMPK signaling pathways were shown to mediate the Nrf2 nuclear translocation within 0.5–2 h after Pt treatment (Fig. 6A and B). Additionally, Pt treatment considerably increased the phosphorylation of Nrf2 (p-Nrf2), leading to further antioxidant HO-1 and γ-GCLC proteins expression in HaCaT cells (Fig. 5D). Moreover, Nrf2 knockdown showed a significant increase in ROS levels, downregulation of antioxidant protein expression, and increased UVA-induced α-MSH protein levels (Fig. 7), further confirmed Nrf2 expression is pivotal in Pt-mediated antioxidant effects in UVA-exposed HaCaT cells. These results signify the potent anti-melanogenic effects of Pt through the activation of the Nrf2 signaling pathway and inhibition of UVA-induced α-MSH production in HaCaT cells.
Recently, the direct link between p62 and Keap-1 proteins showed the interconnection among the autophagy and Nrf2 signaling pathways [38]. It is interesting to note that p62 can form a positive feedback loop with Nrf2 protein [39,40], and accumulation of p62 inhibits Keap-1-mediated Nrf2 protein degradation by competing with Nrf2 for the binding site of Keap-1, resulting in transcriptional upregulation of Nrf2 downstream genes [41]. On the other hand, Nrf2 regulates the expression of p62 by direct binding to the antioxidant-response element (ARE) on its promoter region. Previously it was reported that Nrf2 was constitutively activated in arsenic-transformed human HaCaT cells [42]. It was also shown in a recent study that arsenic-induced skin damage in human keratinocytes was restored via the Pt-triggered Nrf2 pathway [43]. Based on these studies and from the current study (Fig. 4, Fig. 5D–E), we explain that Pt is supposedly inducing autophagy in HaCaT cells via the Keap-1/p62 degradation pathway [44].
Autophagy is a self-catabolic cellular mechanism that recycles the damaged or old organelles or proteins. Therefore, basal level autophagy is always indispensable to maintain cellular homeostasis. Autophagy also functions as cell-survival machinery under different conditions [45]. Previous studies reported the autophagy-inducing ability of pterostilbene in human bladder cancer cells [46]. In another study, Pt was shown to increase autophagy in vascular endothelial cells by inhibiting potent autophagy negative regulator mTOR [47]. The importance of autophagy in regulating physiological skin color increases [26,48]. Recently, we reported that a widely available natural polyphenol ellagic acid, present in many berries and nuts, was shown to exhibit anti-melanogenic effects in melanocytes through the autophagy induction mechanism [37]. Regarding skin protection, topical application of Pt to the hairless mice effectively ameliorated the skin damage and carcinogenesis caused due to UVA-radiation [49]. Therefore, we further investigated if Pt could exhibit anti-melanogenesis through autophagy induction in HaCaT cells and melanocytes.
As shown in Fig. 4, Pt significantly upregulated autophagy-associated marker proteins, LC3-II and p62, in HaCaT cells. Moreover, the AVO staining data derived from Pt-treated HaCaT cells, with or without 3-MA, hint that Pt is inducing autophagy in Pt-treated HaCaT cells (Fig. 4A–C). Melanosomes are the specialized organelles of melanocytes that synthesize and store the melanin pigment, which is later transported to the neighboring keratinocytes [50]. Fig. 4D showed a notable observation that Pt treatment significantly downregulated the gp100 protein expression in HaCaT cells that were pre-exposed to the melanin, derived from the α-MSH-stimulated B16F10 culture medium. It is important to mention here that Pmel17 or gp100 is a transmembrane melanoma antigen protein primarily involved in melanosome maturation [51] and necessary for the formation of stage II melanosome structural matrix [52]. From Fig. 4D, one possible mechanism would be that Pt is suppressing the gp100 protein expression and thereby interfering with the melanosome maturation process [26]. Future studies in this direction may confirm this mechanism.
The role of autophagy in melanogenesis was confirmed in B16F10 cells. Pt treatment activated autophagy in B16F10 cells, evidenced from increased LC3-II/p62 proteins levels and increased AVO formation (Fig. 8). ATG4B (autophagin-1) is a cysteine protease and to which LC3 acts as a substrate. ATG4B both cleaves pro-LC3 and also hydrolyzes lipids from cleaved LC3. Therefore, ATG4B acts as a negative regulator of autophagy [53]. Remarkably, Pt showed significant downregulation of ATG4B protein levels leading to autophagy in B16F10 cells (Fig. 8C). An additional layer of confirmation was received when Pt was shown to downregulate the PI3K/AKT/mTOR pathway (a negative regulator of autophagy) and deregulation of Beclin-1/Bcl-2 stoichiometry ratio leading to more Beclin-1 formation and autophagy in these cells (Fig. 9). This observation (downregulation of PI3K/AKT/mTOR pathway) was in support of one of the previous studies, which showed that the resveratrol (analogs stilbene compound) treatment of B16 cells resulted in autophagy induction through the inhibition of AKT/mTOR pathway, suggesting potential in treating melanoma [54,55]. To verify the autophagy-controlled melanogenesis, we directly examined cellular autophagosomes and melanosomes by transmission electron microscopy. Autophagosomes are specialized structures enclosed by two distinctive lipid layers, can be detected in cells undergoing autophagy by transmission electron microscopy. Most importantly, transmission electron microscopy analysis and quantification of melanin levels revealed that the autophagosomes consumed (engulfed) melanin or melanosomes following treatment with α-MSH and Pt (Fig. 10F and G). In addition to transmission electron microscopy analysis, 3-MA pretreatment or LC3 silencing significantly downregulated the early-stage (LC3) and late-stage (tyrosinase and TRP-1/-2) melanosome markers knockdown cells. Therefore, the functioning of LC3 (autophagy) is essential in Pt-mediated anti-melanogenesis in B16F10 cells (Fig. 11).
The anti-melanogenic effects of Pt were further assessed using ‘zebrafish’ as an in vivo experimental model (Fig. 12, Fig. 13, Fig. 14). The anti-melanogenic effects of cosmetic compounds using routine lab animals are not feasible. Because these experiments often raise ethical issues. To overcome this, as an alternative, the zebrafish embryo model has emerged as a powerful vertebrate tool [56]. Both at the physiological and genetic levels, zebrafish embryos resemble mammals. Also, it is easy to observe cosmetic ingredients' effect on the zebrafish skin/surface for the melanin pigmentation [57,58]. Dependable with the in vitro findings, in vivo data using an autophagy inhibitor 3-MA also confirmed that Pt is exhibiting the anti-melanogenic effects through autophagy mechanism in 72 hpf embryos (Fig. 12). Moreover, tyrosinase enzyme activity, tyrosinase mRNA levels, and melanin levels were significantly downregulated in Pt-treated conditions (Fig. 13). However, it is reasonable to mention here that some unknown technical reasons are associated with the decreased tyrosinase mRNA or melanin levels at 2.5 μM Pt treated conditions compared to 5 μM Pt treated conditions (Fig. 13C and D). Further, stereomicroscopic data revealed that zebrafish embryos at later time points, for example, 72 hpf subjected to endogenous body pigmentation, tyrosinase activity, and melanin levels for 24 h (72 + 24 hpf), also confirmed that Pt is a potent depigmenting agent (Fig. 14).
5. Conclusion
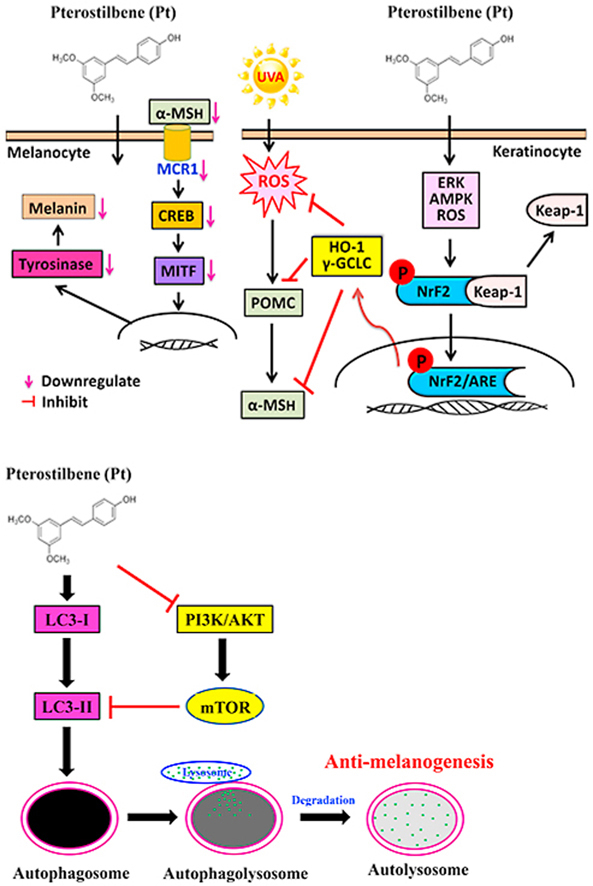
To our understanding, this is the first study that demonstrated the depigmenting effects of Pt on keratinocytes and melanocytes. This study proved that Pt is a potent anti-melanogenic agent than Rv and has derived the following conclusions: In HaCaT cells – (1) Pt suppressed UVA-induced ROS-mediated POMC-α-MSH expression. (2) Pt activated antioxidant Nrf2-mediated HO-1, γ-GCLC, and NQO-1 expression levels. (3) Nrf2 knockdown suppressed Pt's antioxidant ability, and there were uncontrolled ROS and α-MSH levels after UVA-irradiation. (4) Pt-induced autophagy was revealed by enhanced LC3-II accumulation, p62/SQSTM1 activation, and AVO formation but decreased melanosome gp100 proteins. In B16F10 cells – (5) The conditioned medium derived from UVA-irradiated HaCaT pretreated with Pt suppressed melanogenesis in B16F10 cells. (6) Pt also downregulated melanogenesis in α-MSH-stimulated B16F10 cells. (7) Pt showed anti-melanogenesis through autophagy induction. However, this effect was reversed in the presence of an autophagy inhibitor 3-MA or LC3 silencing of B16F10 cells. In vivo data-derived from zebrafish embryos were consistent with the in vitro data and confirmed that pterostilbene is a potent anti-melanogenic agent and could be used as a depigmenting agent in the preparation of topical skin-whitening agents.
Author contributions
Conceptualization and design of the study - Y.C.H., and H.L.Y. Acquisition of data - Y.V.G., L.W.W., Y.Z.Z., and X.Z.C. Interpretation of data - Y.C.H., Y.V.G., L.W.W., Y.Z.Z., X.Z.C., P.J.H., H.R.Y., and H.L.Y. Funding acquisition - Y.C.H., and H.L.Y. Drafting and revising the article - Y.C.H., Y.V.G., and H.L.Y. All authors approved the final version of the manuscript.
Declaration of competing interest
The authors state no conflicts of interest.
Acknowledgments
This study was supported by the Ministry of Science and Technology, Asia University, and China Medical University, Taiwan (grants MOST-109-2320-B-039-057-MY3 and MOST-107-2320-B-039-013-MY3, CMU109-ASIA-11). This work was financially supported by the “Chinese Medicine Research Center, China Medical University” from The Featured Areas Research Center Program within the framework of the Higher Education Sprout Project by the Ministry of Education (MOE) in Taiwan (CMRC-CHM-1).
Contributor Information
You-Cheng Hseu, Email: ychseu@mail.cmu.edu.tw.
Yugandhar Vudhya Gowrisankar, Email: dr.vgyugandhar@gmail.com.
Li-Wei Wang, Email: u104044006@cmu.edu.tw.
Yan-Zhen Zhang, Email: u106010842@cmu.edu.tw.
Xuan-Zao Chen, Email: x28753281@gmail.com.
Pei-Jane Huang, Email: pjhuang@asia.edu.tw.
Hung-Rong Yen, Email: hungrongyen@gmail.com.
Hsin-Ling Yang, Email: hlyang@mail.cmu.edu.tw.
References
- 1.D'Mello S.A., Finlay G.J., Baguley B.C., Askarian-Amiri M.E. Signaling pathways in melanogenesis. Int. J. Mol. Sci. 2016;17(7) doi: 10.3390/ijms17071144. [DOI] [PMC free article] [PubMed] [Google Scholar]
- 2.Wang N., Hebert D.N. Tyrosinase maturation through the mammalian secretory pathway: bringing color to life. Pigm. Cell Res. 2006;19(1):3–18. doi: 10.1111/j.1600-0749.2005.00288.x. [DOI] [PubMed] [Google Scholar]
- 3.Park H.Y., Kosmadaki M., Yaar M., Gilchrest B.A. Cellular mechanisms regulating human melanogenesis. Cell. Mol. Life Sci. 2009;66(9):1493–1506. doi: 10.1007/s00018-009-8703-8. [DOI] [PMC free article] [PubMed] [Google Scholar]
- 4.Ebanks J.P., Wickett R.R., Boissy R.E. Mechanisms regulating skin pigmentation: the rise and fall of complexion coloration. Int. J. Mol. Sci. 2009;10(9):4066–4087. doi: 10.3390/ijms10094066. [DOI] [PMC free article] [PubMed] [Google Scholar]
- 5.Costin G.E., Hearing V.J. Human skin pigmentation: melanocytes modulate skin color in response to stress. Faseb. J. 2007;21(4):976–994. doi: 10.1096/fj.06-6649rev. [DOI] [PubMed] [Google Scholar]
- 6.Hseu Y.C., Chen X.Z., Gowrisankar Y.V., Yen H.R., Chuang J.Y., Yang H.L. The skin-whitening effects of ectoine via the suppression of alpha-MSH-stimulated melanogenesis and the activation of antioxidant Nrf2 pathways in UVA-irradiated keratinocytes. Antioxidants-Basel. 2020;9(1):63. doi: 10.3390/antiox9010063. [DOI] [PMC free article] [PubMed] [Google Scholar]
- 7.Lajis A.F.B., Ariff A.B. Discovery of new depigmenting compounds and their efficacy to treat hyperpigmentation: evidence from in vitro study. J. Cosmet. Dermatol. 2019;18(3):703–727. doi: 10.1111/jocd.12900. [DOI] [PubMed] [Google Scholar]
- 8.Kumari S., Tien Guan Thng S., Kumar Verma N., Gautam H.K. Melanogenesis inhibitors. Acta Derm. Venereol. 2018;98(10):924–931. doi: 10.2340/00015555-3002. [DOI] [PubMed] [Google Scholar]
- 9.Hu D.N. Methodology for evaluation of melanin content and production of pigment cells in vitro. Photochem. Photobiol. 2008;84(3):645–649. doi: 10.1111/j.1751-1097.2007.00228.x. [DOI] [PubMed] [Google Scholar]
- 10.Zhang C.F., Gruber F., Ni C.Y., Mildner M., Koenig U., Karner S., Barresi C., Rossiter H., Narzt M.S., Nagelreiter L.M., Larue L., Tobin D.J., Eckhart L., Tschachler E. Suppression of autophagy dysregulates the antioxidant response and causes premature senescence of melanocytes. J. Invest. Dermatol. 2015;135(5):1348–1357. doi: 10.1038/jid.2014.439. [DOI] [PubMed] [Google Scholar]
- 11.Yang Z.F., Klionsky D.J. Mammalian autophagy: core molecular machinery and signaling regulation. Curr. Opin. Cell Biol. 2010;22(2):124–131. doi: 10.1016/j.ceb.2009.11.014. [DOI] [PMC free article] [PubMed] [Google Scholar]
- 12.Ganesan A.K., Ho H., Bodemann B., Petersen S., Aruri J., Koshy S., Richardson Z., Le L.Q., Krasieva T., Roth M.G., Farmer P., White M.A. Genome-wide siRNA-based functional genomics of pigmentation identifies novel genes and pathways that impact melanogenesis in human cells. PLoS Genet. 2008;4(12) doi: 10.1371/journal.pgen.1000298. [DOI] [PMC free article] [PubMed] [Google Scholar]
- 13.Ho H., Ganesan A.K. The pleiotropic roles of autophagy regulators in melanogenesis. Pigm. Cell Melanoma Res. 2011;24(4):595–604. doi: 10.1111/j.1755-148X.2011.00889.x. [DOI] [PubMed] [Google Scholar]
- 14.Lee K.W., Ryu H.W., Oh S.S., Park S., Madhi H., Yoo J., Park K.H., Kim K.D. Depigmentation of alpha-melanocyte-stimulating hormone-treated melanoma cells by beta-mangostin is mediated by selective autophagy. Exp. Dermatol. 2017;26(7):585–591. doi: 10.1111/exd.13233. [DOI] [PubMed] [Google Scholar]
- 15.Bavaresco L., Fregoni C., Cantu E., Trevisan M. Stilbene compounds: from the grapevine to wine. Drugs Exp. Clin. Res. 1999;25(2–3):57–63. [PubMed] [Google Scholar]
- 16.Chan E.W.C., Tan Y.H., Foo J.P.Y., Wong S.K., Chan H.T. Resveratrol and pterostilbene: a comparative overview of their chemistry, biosynthesis, plant sources and pharmacological properties. J. Appl. Pharmaceut. Sci. 2019;9(7):124–149. doi: 10.7324/JAPS.2019.90717. [DOI] [Google Scholar]
- 17.Li H., Jiang N., Liang B., Liu Q., Zhang E., Peng L., Deng H., Li R., Li Z., Zhu H. Pterostilbene protects against UVB-induced photo-damage through a phosphatidylinositol-3-kinase-dependent Nrf2/ARE pathway in human keratinocytes. Redox Rep. 2017;22(6):501–507. doi: 10.1080/13510002.2017.1329917. [DOI] [PMC free article] [PubMed] [Google Scholar]
- 18.Chen R.J., Lee Y.H., Yeh Y.L., Wu W.S., Ho C.T., Li C.Y., Wang B., Wang Y.J. Autophagy-inducing effect of pterostilbene: a prospective therapeutic/preventive option for skin diseases. J. Food Drug Anal. 2017;25(1):125–133. doi: 10.1016/j.jfda.2016.10.022. [DOI] [PMC free article] [PubMed] [Google Scholar]
- 19.Yoon H.S., Hyun C.G., Lee N.H., Park S.S., Shin D.B. Comparative depigmentation effects of resveratrol and its two methyl analogues in alpha-melanocyte stimulating hormone-triggered B16/F10 murine melanoma cells. Prev. Nutr. Food Sci. 2016;21(2):155–159. doi: 10.3746/pnf.2016.21.2.155. [DOI] [PMC free article] [PubMed] [Google Scholar]
- 20.Hseu Y.C., Chang C.T., Gowrisankar Y.V., Chen X.Z., Lin H.C., Yen H.R., Yang H.L. Zerumbone exhibits antiphotoaging and dermatoprotective properties in ultraviolet A-irradiated human skin fibroblast cells via the activation of Nrf2/ARE defensive pathway. Oxid. Med. Cell Longev. 2019;2019:4098674. doi: 10.1155/2019/4098674. [DOI] [PMC free article] [PubMed] [Google Scholar]
- 21.Hseu Y.C., Cho H.J., Gowrisankar Y.V., Thiyagarajan V., Chen X.Z., Lin K.Y., Huang H.C., Yang H.L. Kalantuboside B induced apoptosis and cytoprotective autophagy in human melanoma A2058cells: an in vitro and in vivo study. Free Radic. Biol. Med. 2019 doi: 10.1016/j.freeradbiomed.2019.08.015. [DOI] [PubMed] [Google Scholar]
- 22.Chen W.C., Tseng T.S., Hsiao N.W., Lin Y.L., Wen Z.H., Tsai C.C., Lee Y.C., Lin H.H., Tsai K.C. Discovery of highly potent tyrosinase inhibitor, T1, with significant anti-melanogenesis ability by zebrafish in vivo assay and computational molecular modeling. Sci. Rep. 2015;5:7995. doi: 10.1038/srep07995. [DOI] [PMC free article] [PubMed] [Google Scholar]
- 23.Truong L., Harper S.L., Tanguay R.L. Evaluation of embryotoxicity using the zebrafish model. Methods Mol. Biol. 2011;691:271–279. doi: 10.1007/978-1-60761-849-2_16. [DOI] [PMC free article] [PubMed] [Google Scholar]
- 24.Tabassum N., Lee J.H., Yim S.H., Batkhuu G.J., Jung D.W., Williams D.R. Isolation of 4,5-O-dicaffeoylquinic acid as a pigmentation inhibitor occurring in Artemisia capillaris Thunberg and its validation in vivo. Evid. base Compl. Alternative Med. 2016;2016:7823541. doi: 10.1155/2016/7823541. [DOI] [PMC free article] [PubMed] [Google Scholar]
- 25.Peterson S.M., Freeman J.L. RNA isolation from embryonic zebrafish and cDNA synthesis for gene expression analysis. JoVE. 2009;30 doi: 10.3791/1470. [DOI] [PMC free article] [PubMed] [Google Scholar]
- 26.Kim J.Y., Kim J., Ahn Y., Lee E.J., Hwang S., Almurayshid A., Park K., Chung H.J., Kim H.J., Lee S.H., Lee M.S., Oh S.H. Autophagy induction can regulate skin pigmentation by causing melanosome degradation in keratinocytes and melanocytes. Pigm. Cell Melanoma Res. 2020;33(3):403–415. doi: 10.1111/pcmr.12838. [DOI] [PubMed] [Google Scholar]
- 27.Pillaiyar T., Namasivayam V., Manickam M., Jung S.H. Inhibitors of melanogenesis: an updated review. J. Med. Chem. 2018;61(17):7395–7418. doi: 10.1021/acs.jmedchem.7b00967. [DOI] [PubMed] [Google Scholar]
- 28.McCormack D., McFadden D. A review of pterostilbene antioxidant activity and disease modification. Oxid. Med. Cell Longev. 2013;2013:575482. doi: 10.1155/2013/575482. [DOI] [PMC free article] [PubMed] [Google Scholar]
- 29.Steingrimsson E., Copeland N.G., Jenkins N.A. Melanocytes and the microphthalmia transcription factor network. Annu. Rev. Genet. 2004;38:365–411. doi: 10.1146/annurev.genet.38.072902.092717. [DOI] [PubMed] [Google Scholar]
- 30.Hirobe T. Keratinocytes regulate the function of melanocytes. Dermatol. Sin. 2014;32(4):200–204. doi: 10.1016/j.dsi.2014.05.002. [DOI] [Google Scholar]
- 31.Gegotek A., Skrzydlewska E. The role of transcription factor Nrf2 in skin cells metabolism. Arch. Dermatol. Res. 2015;307(5):385–396. doi: 10.1007/s00403-015-1554-2. [DOI] [PMC free article] [PubMed] [Google Scholar]
- 32.Nguyen T., Sherratt P.J., Pickett C.B. Regulatory mechanisms controlling gene expression mediated by the antioxidant response element. Annu. Rev. Pharmacol. Toxicol. 2003;43:233–260. doi: 10.1146/annurev.pharmtox.43.100901.140229. [DOI] [PubMed] [Google Scholar]
- 33.Kong A.N., Owuor E., Yu R., Hebbar V., Chen C., Hu R., Mandlekar S. Induction of xenobiotic enzymes by the MAP kinase pathway and the antioxidant or electrophile response element (ARE/EpRE) Drug Metab. Rev. 2001;33(3–4):255–271. doi: 10.1081/dmr-120000652. [DOI] [PubMed] [Google Scholar]
- 34.Itoh K., Tong K.I., Yamamoto M. Molecular mechanism activating Nrf2-Keap1 pathway in regulation of adaptive response to electrophiles. Free Radic. Biol. Med. 2004;36(10):1208–1213. doi: 10.1016/j.freeradbiomed.2004.02.075. [DOI] [PubMed] [Google Scholar]
- 35.Bryan H.K., Olayanju A., Goldring C.E., Park B.K. The Nrf2 cell defence pathway: keap1-dependent and -independent mechanisms of regulation. Biochem. Pharmacol. 2013;85(6):705–717. doi: 10.1016/j.bcp.2012.11.016. [DOI] [PubMed] [Google Scholar]
- 36.Yuan X., Xu C., Pan Z., Keum Y.S., Kim J.H., Shen G., Yu S., Oo K.T., Ma J., Kong A.N. Butylated hydroxyanisole regulates ARE-mediated gene expression via Nrf2 coupled with ERK and JNK signaling pathway in HepG2 cells. Mol. Carcinog. 2006;45(11):841–850. doi: 10.1002/mc.20234. [DOI] [PubMed] [Google Scholar]
- 37.Yang H.L., Lin C.P., Vudhya Gowrisankar Y., Huang P.J., Chang W.L., Shrestha S., Hseu Y.C. The anti-melanogenic effects of ellagic acid through induction of autophagy in melanocytes and suppression of UVA-activated alpha-MSH pathways via Nrf2 activation in keratinocytes. Biochem. Pharmacol. 2021;185:114454. doi: 10.1016/j.bcp.2021.114454. [DOI] [PubMed] [Google Scholar]
- 38.Jiang T., Harder B., Rojo de la Vega M., Wong P.K., Chapman E., Zhang D.D. p62 links autophagy and Nrf2 signaling. Free Radic. Biol. Med. 2015;88(Pt B):199–204. doi: 10.1016/j.freeradbiomed.2015.06.014. [DOI] [PMC free article] [PubMed] [Google Scholar]
- 39.Jain A., Lamark T., Sjottem E., Larsen K.B., Awuh J.A., Overvatn A., McMahon M., Hayes J.D., Johansen T. p62/SQSTM1 is a target gene for transcription factor NRF2 and creates a positive feedback loop by inducing antioxidant response element-driven gene transcription. J. Biol. Chem. 2010;285(29):22576–22591. doi: 10.1074/jbc.M110.118976. [DOI] [PMC free article] [PubMed] [Google Scholar]
- 40.Wu X., Sun R., Wang H., Yang B., Wang F., Xu H., Chen S., Zhao R., Pi J., Xu Y. Enhanced p62-NRF2 feedback loop due to impaired autophagic flux contributes to arsenic-induced malignant transformation of human keratinocytes. Oxid. Med. Cell Longev. 2019;2019:1038932. doi: 10.1155/2019/1038932. [DOI] [PMC free article] [PubMed] [Google Scholar]
- 41.Komatsu M., Kurokawa H., Waguri S., Taguchi K., Kobayashi A., Ichimura Y., Sou Y.S., Ueno I., Sakamoto A., Tong K.I., Kim M., Nishito Y., Iemura S., Natsume T., Ueno T., Kominami E., Motohashi H., Tanaka K., Yamamoto M. The selective autophagy substrate p62 activates the stress responsive transcription factor Nrf2 through inactivation of Keap1. Nat. Cell Biol. 2010;12(3):213–223. doi: 10.1038/ncb2021. [DOI] [PubMed] [Google Scholar]
- 42.Pi J.B., Diwan B.A., Sun Y., Liu J., Qu W., He Y.Y., Styblo M., Waalkes M.P. Arsenic-induced malignant transformation of human keratinocytes: involvement of Nrf2. Free Radic. Biol. Med. 2008;45(5):651–658. doi: 10.1016/j.freeradbiomed.2008.05.020. [DOI] [PMC free article] [PubMed] [Google Scholar]
- 43.Zhou J.F., Ci X.X., Ma X.Y., Yu Q.L., Cui Y., Zhen Y., Li S.S. Pterostilbene activates the Nrf2-dependent antioxidant response to ameliorate arsenic-induced intracellular damage and apoptosis in human keratinocytes. Front. Pharmacol. 2019;10 doi: 10.3389/fphar.2019.00497. ARTN 497. [DOI] [PMC free article] [PubMed] [Google Scholar]
- 44.Zhou Y., Jiang Z., Lu H., Xu Z., Tong R., Shi J., Jia G. Recent advances of natural polyphenols activators for Keap1-Nrf2 signaling pathway. Chem. Biodivers. 2019;16(11) doi: 10.1002/cbdv.201900400. [DOI] [PubMed] [Google Scholar]
- 45.Zhong Z.Y., Sanchez-Lopez E., Karin M. Autophagy, inflammation, and immunity: a troika governing cancer and its treatment. Cell. 2016;166(2):288–298. doi: 10.1016/j.cell.2016.05.051. [DOI] [PMC free article] [PubMed] [Google Scholar]
- 46.Chen R.J., Ho C.T., Wang Y.J. Pterostilbene induces autophagy and apoptosis in sensitive and chemoresistant human bladder cancer cells. Mol. Nutr. Food Res. 2010;54(12):1819–1832. doi: 10.1002/mnfr.201000067. [DOI] [PubMed] [Google Scholar]
- 47.Zhang L., Cui L.Q., Zhou G.Z., Jing H.J., Guo Y.Q., Sun W.K. Pterostilbene, a natural small-molecular compound, promotes cytoprotective macroautophagy in vascular endothelial cells. JNB (J. Nutr. Biochem.) 2013;24(5):903–911. doi: 10.1016/j.jnutbio.2012.06.008. [DOI] [PubMed] [Google Scholar]
- 48.Murase D., Hachiya A., Takano K., Hicks R., Visscher M.O., Kitahara T., Hase T., Takema Y., Yoshimori T. Autophagy has a significant role in determining skin color by regulating melanosome degradation in keratinocytes. J. Invest. Dermatol. 2013;133(10):2416–2424. doi: 10.1038/jid.2013.165. [DOI] [PubMed] [Google Scholar]
- 49.Sirerol J.A., Feddi F., Mena S., Rodriguez M.L., Sirera P., Aupi M., Perez S., Asensi M., Ortega A., Estrela J.M. Topical treatment with pterostilbene, a natural phytoalexin, effectively protects hairless mice against UVB radiation-induced skin damage and carcinogenesis. Free Radic. Biol. Med. 2015;85:1–11. doi: 10.1016/j.freeradbiomed.2015.03.027. [DOI] [PubMed] [Google Scholar]
- 50.Wu X., Hammer J.A. Melanosome transfer: it is best to give and receive. Curr. Opin. Cell Biol. 2014;29:1–7. doi: 10.1016/j.ceb.2014.02.003. [DOI] [PMC free article] [PubMed] [Google Scholar]
- 51.Singh S.K., Nizard C., Kurfurst R., Bonte F., Schnebert S., Tobin D.J. The silver locus product (Silv/gp100/Pmel17) as a new tool for the analysis of melanosome transfer in human melanocyte-keratinocyte co-culture. Exp. Dermatol. 2008;17(5):418–426. doi: 10.1111/j.1600-0625.2008.00702.x. [DOI] [PubMed] [Google Scholar]
- 52.Valencia J.C., Watabe H., Chi A., Rouzaud F., Chen K.G., Vieira W.D., Takahashi K., Yamaguchi Y., Berens W., Nagashima K., Shabanowitz J., Hunt D.F., Appella E., Hearing V.J. Sorting of Pmel17 to melanosomes through the plasma membrane by AP1 and AP2: evidence for the polarized nature of melanocytes. J. Cell Sci. 2006;119(Pt 6):1080–1091. doi: 10.1242/jcs.02804. [DOI] [PMC free article] [PubMed] [Google Scholar]
- 53.Yang Z., Wilkie-Grantham R.P., Yanagi T., Shu C.W., Matsuzawa S., Reed J.C. ATG4B (Autophagin-1) phosphorylation modulates autophagy. J. Biol. Chem. 2015;290(44):26549–26561. doi: 10.1074/jbc.M115.658088. [DOI] [PMC free article] [PubMed] [Google Scholar]
- 54.Wang M., Yu T., Zhu C., Sun H., Qiu Y., Zhu X., Li J. Resveratrol triggers protective autophagy through the ceramide/Akt/mTOR pathway in melanoma B16 cells. Nutr. Canc. 2014;66(3):435–440. doi: 10.1080/01635581.2013.878738. [DOI] [PubMed] [Google Scholar]
- 55.Chamcheu J.C., Roy T., Uddin M.B., Banang-Mbeumi S., Chamcheu R.N., Walker A.L., Liu Y.Y., Huang S. Role and therapeutic targeting of the PI3K/Akt/mTOR signaling pathway in skin cancer: a review of current status and future trends on natural and synthetic agents therapy. Cells. 2019;8(8) doi: 10.3390/cells8080803. [DOI] [PMC free article] [PubMed] [Google Scholar]
- 56.Lajis A.F.B. A zebrafish embryo as an animal model for the treatment of hyperpigmentation in cosmetic dermatology medicine. Medicina (Kaunas) 2018;54(3) doi: 10.3390/medicina54030035. [DOI] [PMC free article] [PubMed] [Google Scholar]
- 57.MacRae C.A., Peterson R.T. Zebrafish as tools for drug discovery. Nat. Rev. Drug Discov. 2015;14(10):721–731. doi: 10.1038/nrd4627. [DOI] [PubMed] [Google Scholar]
- 58.Colanesi S., Taylor K.L., Temperley N.D., Lundegaard P.R., Liu D., North T.E., Ishizaki H., Kelsh R.N., Patton E.E. Small molecule screening identifies targetable zebrafish pigmentation pathways. Pigm. Cell Melanoma Res. 2012;25(2):131–143. doi: 10.1111/j.1755-148X.2012.00977.x. [DOI] [PubMed] [Google Scholar]