

Abstract
Objective.
This study employs a human head model with real skull to demonstrate the feasibility of transcranial acoustoelectric brain imaging (tABI) as a new modality for electrical mapping of deep dipole sources during treatment of epilepsy with much better resolution and accuracy than conventional mapping methods.
Approach.
This technique exploits an interaction between a focused ultrasound (US) beam and tissue resistivity to localize current source densities as deep as 63 mm at high spatial resolution (1 to 4 mm) and resolve fast time-varying currents with sub-ms precision.
Main results.
Detection thresholds through a thick segment of the human skull at biologically safe US intensities was below 0.5 mA and within range of strong currents generated by the human brain.
Significance.
This work suggests that 4D tABI may emerge as a revolutionary modality for real-time high-resolution mapping of neuronal currents for the purpose of monitoring, staging, and guiding treatment of epilepsy and other brain disorders characterized by abnormal rhythms.
Keywords: ultrasound, seizure localization, electrical brain mapping, electroencephalography, inverse problem, fMRI, current source analysis
1. Background
1.1. Electrical brain mapping for treatment of epilepsy
Epilepsy is a debilitating neurological disorder characterized by recurrent seizures: abnormal, spontaneous, synchronized activation of large groups of neurons or neuronal circuits. Epileptic seizures may affect sensation, movement or even briefly cause loss of consciousness. Left untreated, epilepsy can have a disabling effect on cognitive and social function, quality of life, and life expectancy. Of the estimated three million Americans who suffer from the disorder, approximately 20%–40% do not respond to anticonvulsant drug therapy and instead become candidates for neurosurgical intervention (Engel 2003). In these cases, identification of the seizure onset zone is critical, as it determines a patient’s candidacy for surgical resection, which may be curative in anywhere from 50%–90% of cases (West et al 2016).
One barrier to wider use of epilepsy surgery is the difficulty identifying the seizure onset zone through noninvasive means, which typically requires painstaking and prolonged invasive electrical brain mapping. Several thousand of these procedures are performed annually across the U.S. at costs exceeding $50 000 per procedure. Compared to scalp EEG, intracranial EEG (icEEG) benefits from greater spatial and temporal resolution as well as the ability to detect weak signals. However, icEEG is invasive and expensive, and is still limited spatially by the arrangement of the implanted electrode array. As a result, traditional electrical brain mapping is limited by the tradeoff among invasiveness, spatial resolution, and field-of-view for guiding resection during surgical treatment of epilepsy (Ramantani et al 2016). Newer techniques, such as high-density EEG source-localization and magnetoencephalography, attempt to address some of these deficiencies but are themselves still limited by spatial and/or temporal resolution, cost, computational requirements and clinical availability.
The goal of this study is to demonstrate the capabilities, performance and feasibility of transcranial acoustoelectric brain imaging (tABI) as a new modality to dramatically improve the spatial and temporal resolution of mapping deep dipole sources in a realistic human head model. tABI is a patented technology (Witte et al 2011) that exploits the acoustoelectric (AE) effect, an interaction between a focused pressure wave (ultrasound (US)) and tissue resistivity to detect and image current source densities in 4D at a resolution determined by the dimensions of the US focus (e.g. <1 mm3 at 2 MHz). Our preliminary studies along with those by others suggest that AE imaging is capable of high resolution, volumetric current source density imaging with potential for real-time electrical mapping at the millimeter and millisecond scales (Witte et al 2007, Olafsson et al 2008, 2009, Wang et al 2011, Yang et al 2013, Qin et al 2015, 2016, 2017, Berthon et al 2017, 2019, Preston et al 2018, 2020, Wilhite et al 2019).
1.2. Acoustoelectric effect and acoustoelectric brain imaging
A voltage measurement ViEEGacross lead is related to the underlying current densities JI by the standard source equation.
| (1) |
with resistivity ρ0. Electrical source localization depends on reconstructing current source densities from i surface potential measurements followed by solving an underdetermined inverse problem. This process inherently leads to poor spatial resolution and inaccuracies due to blurring of the electric fields as they propagate from the sources to the surface.
The AE effect is a modulation of electric resistivity by pressure waves represented by ∆ρ/ρ = −K∆P with interaction constant K of ~0.1% per MPa of pressure in biological tissue (Li et al 2012). When P intersects a current field JIinside a conductive medium, the change in resistivity leads to a voltage modulation VAE, which can be detected across lead (see figure 1). This voltage modulation detected on electrode i depends on the properties of the pressure waveform by
| (2) |
Figure 1.

(A) Concept of imaging current using pulsed ultrasound combined with an electrical recording system for detecting the AE interaction signal. (B) Timing diagram for ABI, illustrating the physiologic waveform, such as integrated neuronal currents or EEG signal, burst of US pulses for temporal sampling, and generation of AE signals along the US time in µs (or depth in mm). The US beam is electronically steered within a volume of the brain to generate 3D images over time related to the underlying current densities. The AE signal is maximum when the pressure wave intersects the strongest local currents.
Moreover, the US pressure factor ∆P can be separated into it subcomponents, including the beam pattern b(x,y,z) with respect to the transducer origin, pressure amplitude P0, and pulse modulation term a(tus) such that . The general AE equation that defines the detected AE modulation signal becomes
| (3) |
Based on this equation, it is clear that the AE signal is near the carrier frequency of the US transducer and proportional to the local current densities. In addition, the spatial resolution is defined by the extent of the traveling acoustic pulse, which can be controlled by the bandwidth and focusing properties of the US transducer. Finally, both the AE (>100 kHz) and EEG (<10 kHz) signals can be detected on the same electrode and separated by analog or digital filters.
| (4) |
By bursting the US pulses at high rates and detecting the AE signal, time-varying current density images are generated (figure 1(B)). Finally, by electronically sweeping the US beam within a volume of tissue, 2D, 3D and 4D (volume + time) AE images of the brain can be generated.
2. Approach
2.1. Experimental setup
This study implements our bench-top model that includes a human skull and brain phantom with embedded current sources to evaluate and optimize tABI (Qin et al 2016, 2017). A gel phantom mimicking the electrical properties of the human brain (0.9% NaCl and 1% Agarose or 5% porcine gelatin in diH20) was prepared inside an adult human cadaver skull (see figure 2). The goal was to implement this model to describe the capabilities and assess the performance of tABI using three different scenarios relevant to electrical brain mapping for treatment of epilepsy: intraoperative (invasive recording electrodes and skullcap removed), extraoperative (invasive recording electrodes with skullcap intact), and noninvasive (recording electrodes on skull with skullcap intact). The instrumentation, signal processing and analyses are similar for each scenario with details described below for each setup.
Figure 2.

ABI in a human head model. (A) Side-view of the setup. A function generator (Agilent 33120 A) delivers current to the stimulating electrodes (d = 0.5 mm) implanted deep in the brain gel (0.9% NaCl in 1% Agarose). (B) The ultrasound controller (Vantage 64LE) sends transmit sequences to the US array, which also receives echoes for standard pulse echo imaging. One or more recording electrodes were connected to a custom 16 channel preamplifier, which conditioned the signal into high (>100 kHz) and low (<10 kHz) frequencies, while the DAQ system digitized, recorded and stored the signals on a PC.
One or more stimulating electrodes were embedded at different depths below the surface of the brain-mimicking gel. Stimulating electrodes were driven by an arbitrary function generator (Agilent 33120 A, Santa Clara, CA) set to deliver fast waveforms (e.g. three-cycle sine wave at 200 Hz), while injected current was measured across a 1 Ohm resistor. A commercial US system (Vantage 64 LE, Verasonics, Kirkland, WA) and either a commercial 64 element 3 MHz linear array (P4–2, Verasonics, Kirkland, WA) or a custom-designed 0.6 MHz 2D matrix array (fabricated by Sonic Concepts, Bothell, WA) was employed to deliver US for ABI. The US was pulsed at 4 kHz pulse repetition frequency to generate AE M mode images (depth vs. time) and steered to different locations to form 2D and 3D ABI movies of current flow. Ultrasound gel was inserted between the skullcap and the transducer to facilitate acoustic coupling to the skull and brain gel. One or more recording electrodes were placed on the surface of the gel or skull to detect the surface potentials (Vi). Each recording electrode was connected to a single channel on a custom 16 channel differential amplifier, which split the signals into their low (<10 kHz, gain = 4) and high frequency (0.1–10 MHz, gain = 400) components. The output of the amplifier was connected to a multichannel DAQ system controlled by a custom Lab-view program for digitizing and recording the standard low frequency potentials (24 bits, NI PXI-6289, National Instruments, Austin, TX, USA) and high frequency AE signals (12 bits, NI PXI-5105, National Instruments, Austin, TX, USA). In addition, standard pulse echo US imaging was performed to collect structural information of the sample using the Vantage 64LE system in pulse echo mode, which could be collected simultaneously with ABI.
Scenario 1:
‘Intraoperative’ mapping (no skullcap, brain gel exposed). Two different setups were used for mapping current from the surface of the brain gel. First, two platinum electrodes (d = 0.5 mm) separated by 10 mm were embedded deep below the surface of the gel for generating a deep dipole source and sink. A clinical ECoG array (5 x 4, 5 mm spacing, Ad-Tech Medical, Oak Creek, WI) was placed over the frontal cortical region of the brain phantom for detecting the AE signal. The 3 MHz linear US array (P4–2, Verasonics, Kirkland, WA) was placed on the surface of the gel, and the US beam was focused and electronically steered along the azimuthal (X) axis near the tips of the stimulating wires. For volumetric imaging, the linear US array was scanned along the elevational (Y) axis using a stepper motor (Velmex, Bloomfield, NY). The second setup used a clinical depth electrode array (sEEG, 12 channels, 5 mm spacing, Ad-Tech Medical, Oak Creek, WI) and the 0.6 MHz 2D matrix array (see figure 3) to generate multiple sources at different depths below the surface. A gold EEG electrode was placed on the frontal region of the brain phantom for recording AE signals.
Figure 3.

Custom 2D US Array for tABI. (A) Design and (B) geometry for the custom 0.6 MHz 2D matrix US array; (C) Photograph of the array over adult female human skull (Qin et al 2017).
Scenario 2:
‘Extraoperative’ mapping (skullcap intact, implanted recording electrodes). An adult female human skullcap was submerged in a 0.9% NaCl solution for >48 h prior to placing on top of the gel for imaging. Platinum electrodes were used as the source and sink deep below the brain gel surface. The custom 0.6 MHz 2D matrix array was used to steer US through the thick skull to image the deep dipole source and sink driven with an EEG-like stimulation waveform.
Scenario 3:
Transcranial mapping (skull intact, recording electrodes on skull). A single platinum electrode was embedded in the gel phantom to produce a monopole deep below the brain surface. The skullcap was placed on top of the gel phantom. One gold EEG electrode was placed directly under the skullcap, and three more were placed on the skullcap to record the AE signal using both invasive and noninvasive electrodes for comparison. The 0.6 MHz 2D US array was coupled to the skull with acoustic gel (see figure 3 for details on the US array). Ultrasound was focused and steered in the vicinity of the monopole, which was varied in depth. A summary of the various electrodes, clinical devices, and US probes employed for this study are depicted in figure 4.
Figure 4.

Electrodes and US probes implemented in this study. (A) Gold cup EEG electrode. (B) Subdural grid electrode (AdTech-Medical, FG20C-SP10X-000); (C) Infinity deep brain stimulator (Abbott, 6172); (D) sEEG depth electrode (AdTech-Medical, SD12R-SP05X-000). (E) Commercial 3 MHz linear array transducer (Verasonics, P4–2). (F) Custom 0.6 MHz 2D matrix array designed for tABI (see figure 3 for design details).
2.2. Signal processing
Data collected for tABI contained up to six dimensions: US time points × US triggers × azimuth scan points × elevational scan points × current triggers × electrode channels. Signal and image processing were performed in MATLAB (Mathworks, Natick, MA, USA). The digitized VAE signals were bandpass filtered along the US propagation axis (tus) based on the bandwidth of the US array (2–4 MHz for the P4–2 array and 0.3–0.9 MHz for the 0.6 MHz array). Each signal was converted to depth in millimeters by multiplying by the nominal speed of sound of the sample (c in saline gel = 1.48 mm µs−1). A series of VAE signals was bandpass filtered in physiologic time centered near the frequency spectrum of the current waveform (e.g. 150–250 Hz for a three-cycle, 200 Hz sine wave). The VAE was further demodulated to baseband frequency and low pass filtered to determine the sign of the analytical signal, indicating the direction and amplitude of the local current densities (Olafsson et al 2008, Wang et al 2011). Whereas detection at a single US position produced AE M-mode images (depth vs. time), a linear scan of the US beam generated cross sectional AE B mode (lateral vs. depth) movies. Finally, scanning the US beam in the lateral and elevational directions, produced 4D (volume over time) AE movies of the local current densities.
3. Results
‘Intraoperative’ mapping. The setup and images for open skull ABI of a deeply embedded dipole is illustrated in figure 5. The 20-channel ECoG array was placed directly on the surface of the gel for recording the AE signal and generating time-varying maps of the dipole embedded deep below the surface. The 3 MHz linear array was positioned just posterior to the ECoG array with the US beam directed near the source and sink. AE M mode images (one depth line of the US beam over stimulation time) are presented in figures 5(D)–(G), including the unfiltered, bandpass filtered, envelope and signed envelope images, respectively. The current waveform (black) and AE signal (red) at a single depth (row corresponding to 62 mm from the surface) are depicted above the images at the same time scale. ABI is able to pinpoint the location of the deep dipole at high spatial (sub-mm) and temporal (sub-ms) resolutions.
Figure 5.

AE M mode images of a deep dipole with open-skull model. (A) A 3D printed resin skull served as the frame with the skullcap removed, exposing the conductive Agarose gel serving as the ‘brain,’ which contained two 0.5 mm stimulating platinum wires as a source and sink 60 mm below the surface (top view presented in (B), which delivered a three-cycle 200 Hz burst of current. (C) Close-up view of setup with the 3 MHz linear array, 20-electrode ECoG array (on brain gel surface), and needle reference. ECoG Ch. 1 (red circle) was used to record the AE signal in this example (D)–(G). Corresponding AE M-mode images relate to the time-varying injected current, including the raw unfiltered (D), bandpass filtered (E), envelope (or intensity) (F) and the signed envelope (G) image, with the intensity and colors representing the magnitude and polarity of the AE signal near the anode. At top: measured low frequency current waveform injected through platinum wire in mA (black trace) and AE signal at a depth of 63 mm from the gel surface normalized to the black trace (red trace, corresponding to the green hash in (G) on a linear scale). The US transducer face is located at a depth of 0 mm at the surface of the brain gel. The green dashed vertical lines indicate the peaks of the injected current, corresponding to the peaks of the AE signals located at the depth of the anode.
Next, the US beam delivered from the linear array was electronically steered in the azimuth (X) direction and translated along the elevational axis (Y) to produce volumetric movies of the time-varying current. Color ABI B-mode images are presented in figures 6 (left), and (a) 3D-rendered AE image is presented at a single time point (indicated by green asterisk) with an overlay of the pulse echo image in grayscale (figure 6, right). The full width half maximums (FWHMs) at the source were 1.0 mm (transverse normal) and 1.6 mm (azimuthal). The colors relate to the sign of the injected current (i.e. anode and cathode). A four dimensional time-varying movie related to figure 6 are presented in a supplementary multimedia file (stacks.iop.org/JNE/17/056040/mmedia).
Figure 6.

ABI using a clinical ECoG for recording. (left) top: Signed AE M mode image of 200 Hz sinusoidal current; middle: Cross sectional slice near the tips of the two stimulating electrodes placed at a depth of ~62 mm. S+ and S− refer to the anode and cathode, respectively, at the time point indicated by the green asterisk; bottom: AE slice along anode at same time point. (right) 3D image of the source (S +) and sink (S−) at the peak amplitude during the 200 Hz current injection. Multimedia: See time-varying 4D movie in multimedia file MM1.AVI).
whereas the images presented in the previous figures employed only a single recording channel, we also studied the effects and possible benefits of recording on several channels simultaneously. According to equation (3), the AE signal is sensitive to the orientation of the recording lead fields. Because the dipole source was placed deep below the surface in a homogenous medium, the lead field for each of the ECoG electrodes was similar and any differences were assumed to be negligible. Figure 7 presents AE B mode images for six channels (maximum to record simultaneously on our system) at high dynamic display range. Although the images are similar, their background noise is slightly different such that the global average yields higher SNR (32.7 dB) than any individual channel. Figure 8 compares the increase in SNR as a function of N simultaneously recorded channels. Each symbol in the plot represents an average of all possible combinations for that number of recording channels. The total improvement in SNR (~35% for six channels) is considerably less than the theoretical maximum of .
Figure 7.

AE B mode images of a deep dipole recorded on six ECoG channels simultaneously. (top row): wavefield images displaying phase and amplitude of the AE signals on each channel. (middle row) corresponding basebanded AE image. (bottom row) corresponding intensity AE image displayed at a 40 dB dynamic range. Photo (right) of the ECoG array is displayed to the right with the red circles denoting the 6 recorded channels used to produce the images. The global average for the SNR for all six recorded channels was 32.7 dB.
Figure 8.

Effect of multichannel detection on SNR. Six channels were recorded simultaneously (denoted by red circles in figure 7) on the ECoG array. Each symbol represents the average of all possible combinations for that # of recording sites. The SNR on six channels was approximately 35% higher compared to a single channel.
The next setup was designed to image multiple sources at different depths simultaneously using the clinical sEEG electrode as the current source, which was embedded inside a brain gel framed with a human skull (see figure 9). AE images were collected using the 0.6 MHz 2D matrix array of a tripole at multiple depths as displayed in figures 9(C)–(F). 4D tABI (volume + time) was able to identify each stimulating contact while recording from a distant gold cup EEG electrode placed on the surface of the gel.
Figure 9.
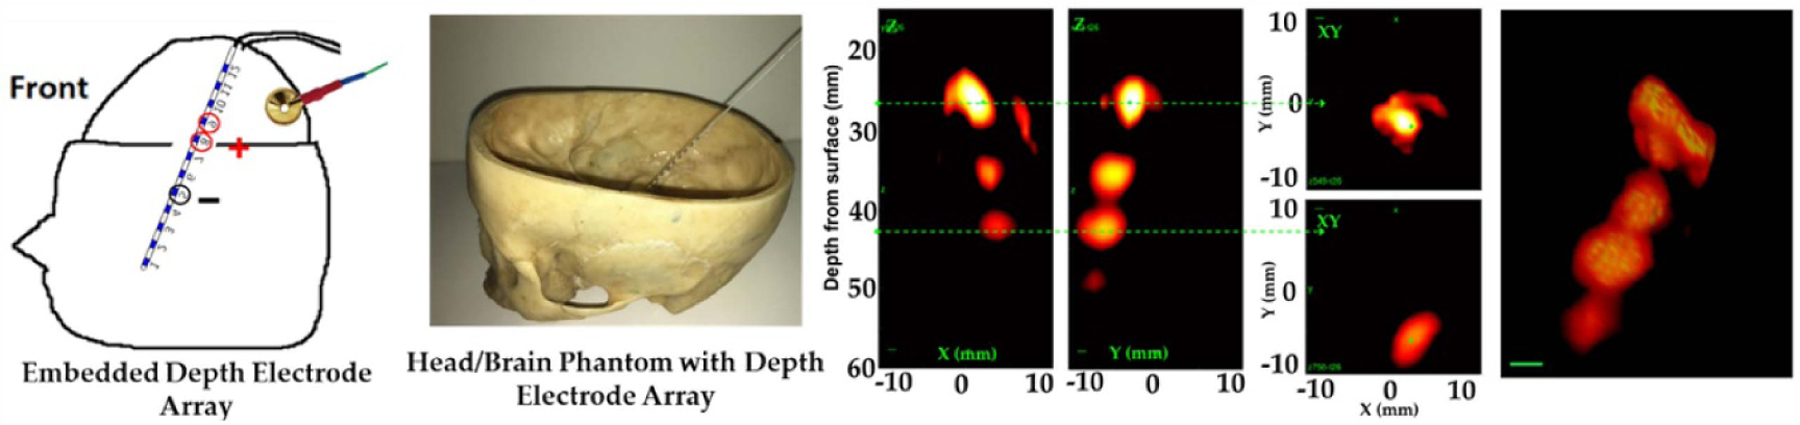
ABI of a tripole at different depths. (A) Side view of the setup displaying the sEEG depth array, stimulating contacts (two active sites and reference circled in red) and a gold EEG electrode for recording the AE signal. (B) Photograph before pouring the gel into the skull. (C) and (D) AE cross sectional XZ and YZ intensity images. (E) Lateral slices through two of the poles (top anode and reference) at the locations indicated by the green dashed lines in (C) and (D). (F) 3D image of the tripole at peak current (20 dB dynamic range).
‘Extraoperative’ mapping. First, we calibrated the custom 0.6 MHz array through a thick portion of the human skullcap (figure 10). The attenuation of the pressure wave through an 8 mm segment of the skull was 70% (or 1.31 dB mm−1) measured by a hydrophone (Onda HDL-200, Sunnyvale, CA). Next, we placed a monopole in saline and measured the peak-to-peak AE signal with (84 µV) and without (228 µV) the skullcap in place, corresponding to a 63% decrease in signal, which is consistent with the attenuation of the pressure wave (figure 10(C)).
Figure 10.
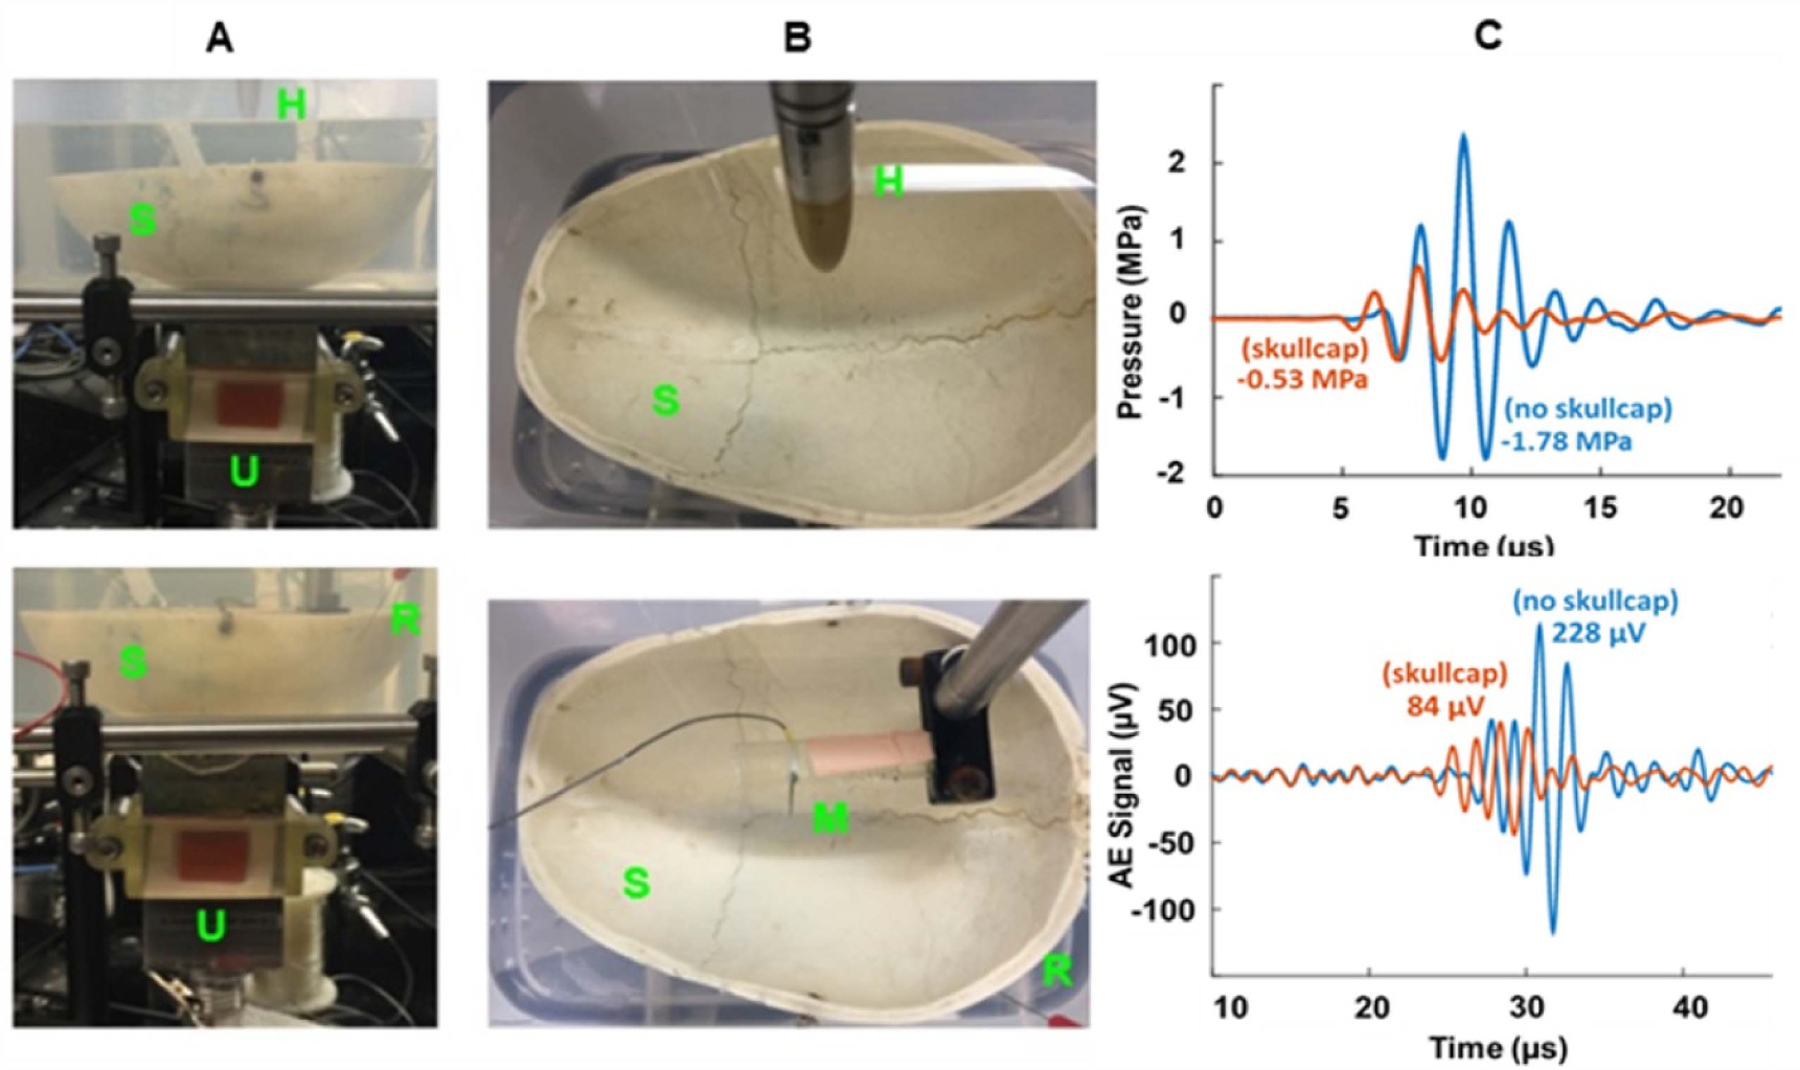
Effect of thick skull on pressure (top row) and AE signal (bottom row) using a custom 0.6 MHz 2D US array; Side (A) and top (B) view of setup with skullcap in place. (C) Comparison between recorded pressure signal near the elevational focus of 35 mm (top) and AE signal generated from a monopole at 45 mm depth (bottom) with and without the skullcap in place. Abbreviations: S = Skull, H = Hydrophone (Onda HGL-200), R = Recording Electrode (stainless steel needle electrode), M = Monopole (platinum needle electrode), U = 0.6 MHz US Array.
The sensitivity for detecting the AE signal through the skull using a short US pulse for excitation is illustrated in figure 11 with a noise equivalent current of 360 µA.
Figure 11.
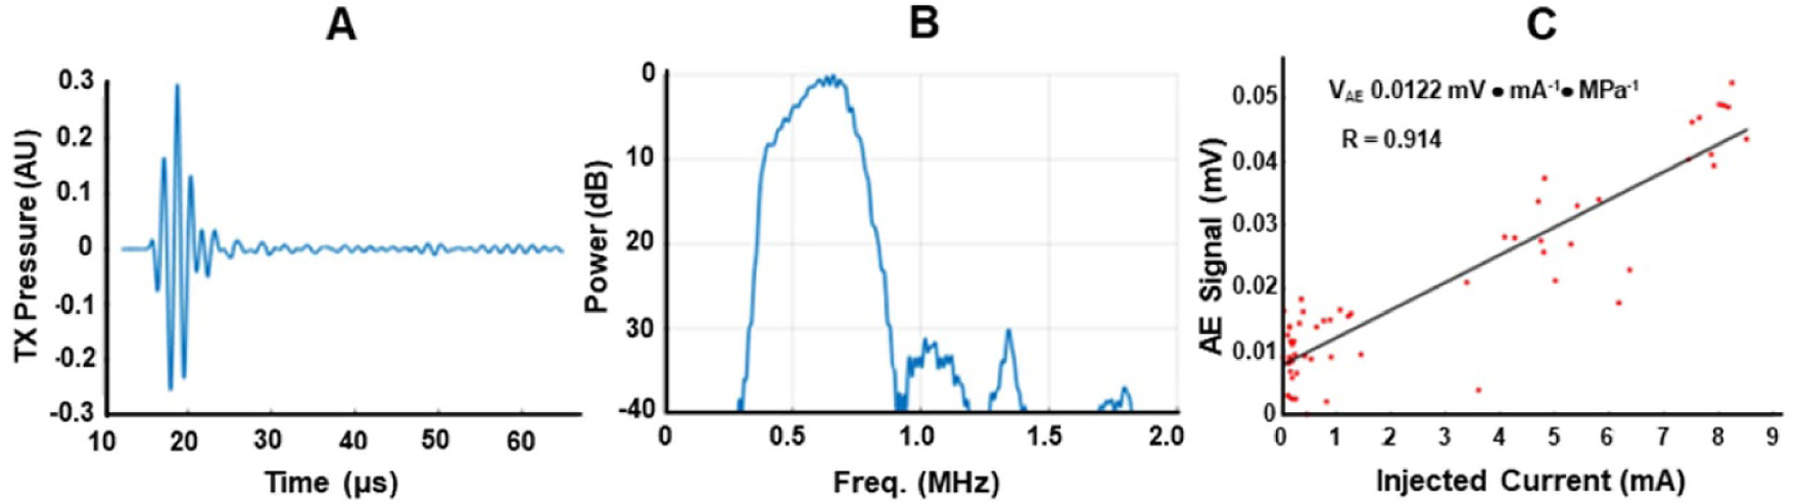
Sensitivity for detecting the AE signal through the skull. Measured transmit (TX) US pulse waveform (A) and corresponding spectrum (B) in water. (C) Sensitivity plot of peak AE signal through 8 mm of thick skull vs. injected current of monopole located at a depth of 40 mm below the top of the skullcap. At 1 MPa peak focal pressure, the noise equivalent current (i.e. where the signal equals mean of noise) was 360 µA through the skullcap.
Following calibration, the human skullcap was placed on the brain gel phantom with two platinum needle electrodes embedded at a depth of 35 mm below the surface of the gel for stimulation (see figure 12). A fast EEG-like current waveform (20–500 Hz) was delivered between the two platinum electrodes. The US beam was electronically scanned along the azimuthal and elevational axes to generate 4D ABI movies of the dipole. The FWHM of the monopole was 5.1, 4.9, and 6.4 mm in the axial (depth), azimuthal, and elevational directions.
Figure 12.

tABI of a time-varying monopole through thick human skull (t = 8 mm) at a depth of 40 mm in the head phantom. (A) Front-view photograph. (B) AE B mode image (signed envelope) at 21.5 ms during stimulation indicated in (C) with vertical dashed line (displayed at ± 12 dB dynamic range). (C) AE M mode image (bottom) indicating time dynamics and depth dependency of the AE signal (signed envelope) at a single pixel (X = 2 mm, Z = 38 mm). The traces above the image represent the measured injected current waveform (black) and normalized AE signal (red) at 38 mm depth with high temporal correlation (R2 = 0.915). Ultrasonic gel was placed between the skullcap (S), and the US array (U) to improve acoustic coupling. U = 0.6 MHz 2D Matrix Array; S = Skull. See time-varying B mode movie in multimedia file MM2.AVI).
This experiment demonstrated the feasibility of tABI to localize a broadband EEG-like current waveform deep below the surface of the brain gel through thick portions of the human skull.
Noninvasive transcranial ABI (tABI). We also evaluated tABI using a completely noninvasive imaging scheme with recording electrodes placed on the surface of the skull delivering US through the parietal skullcap presoaked in 0.9% saline to remove air bubbles and retain bulk skull conductivity closer to in vivo conditions (see figure 13). Ultrasound was focused at the tip of the platinum stimulating electrode at varying depths inside the brain phantom, while recording the AE signal simultaneously from electrodes on the brain gel (R1) and skull surface (R2). The stimulation reference was placed on the skullcap to isolate the current source inside the gel. A saline-damped paper towel was also placed between the recording electrode and the bone to prevent dehydration at the electrode interface. As indicated in figure 13, the image quality was similar when recording ‘invasively’ or ‘noninvasively,’ although there was a loss in signal (3 to 4 dB) likely due to the increased distance and electrical impedance mismatch between the gel and skull. Figure 14 describes the SNR with a current injection of 8 mA, noise equivalent current, FHWM of the monopole at six depth locations and two recording locations.
Figure 13.

Noninvasive tABI through thick human skull of a monopole placed at different depths. (A) (top) Infinity 6172 deep brain stimulator (DBS) by Abbott. (bottom) Placement of a DBS device in the brain gel with the aid of a 3D-printed J hook sleeve to house the DBS device. The US array delivered focused beams through an acoustic window at the bottom of the container. A 3D-printed conical adapter filled with an acoustic rubber (speed of sound = 1455 m s−1) was placed over the US array in contact with the skull to help direct the beam in the nearfield. With this setup, the monopole could be located at different depths (+1, + 10, + 30 mm below the brain gel surface). (B) Bird’s eye view of the skull with surface EEG electrodes and 0.6 MHz 2D array without the adapter. (C) tABI of the monopole placed at three depths and recorded from two different locations (in brain gel [R1] and on skull [R2]) for comparison using setup in (A). Each image is scaled to its maximum and displayed at a dynamic range of 6 dB.
Figure 14.

Performance of noninvasive tABI when recording from the brain gel (red symbol) and skull surface (black symbol). (A) SNR vs. depth; (B) noise equivalent current vs. depth; (c) FWHMs of monopole vs. depth with the 40-mm standoff adapter attached to the US probe.
4. Discussion
We assessed the performance and demonstrated feasibility of tABI in a head phantom using three different clinically relevant scenarios for electrical brain mapping during monitoring and treatment of epileptic seizures. First, with the skullcap removed, a 3 MHz linear US array was combined with an ECoG recording grid array to produce volumetric ABI movies of a source and sink placed at a depth of 63 mm. Voxels near the anode and cathode were highly correlated in time with the injected current waveform with a threshold of detection below 500 µA and a spatial resolution less than 1 mm. Co-registered pulse echo US images provided additional structural detail when combined with current density maps produced by ABI (figure 6). In addition, tABI generated volumetric images of multiple monopoles generated by a clinical sEEG array (figure 9). The ability to remotely resolve sources at different depths overcomes limitations with scalp EEG and current source density analysis, which requires solving an inaccurate and underdetermined inverse problem from surface potentials. Real-time tABI at the millimeter scale would help locate seizure onset zones and deep functional brain regions during intraoperative mapping procedures for guiding resection during treatment of epilepsy or brain cancer.
We also described the performance of a custom 2D matrix US array designed for imaging through thick human skull. With the recording electrode in contact with the brain gel, the scenario was analogous to extraoperative mapping for localizing seizure activity where chronically implanted subdural strip electrodes and/or depth electrodes are employed (Stolk et al 2018). Despite a ~70% loss of pressure through 8 mm of skull, tABI at 0.6 MHz was able to resolve a monopole embedded in a brain gel 40 mm below the skull with a spatial resolution of ~3.5 mm. Moreover, the high temporal sampling of 4 kHz was sufficient to resolve a fast time-varying EEG-like source in the beta-high gamma frequency band (~20–500 Hz). This approach could enable electrical mapping of the majority of the cerebral cortex and possibly deeper regions of gray matter that would normally require invasive electrodes for full mapping.
The final setup investigated tABI as a new modality for noninvasive functional brain imaging. By combining transcranial US with recording electrodes placed on the skull, 4D tABI was able to detect and map current as weak as 0.4 mA at 1 MPa peak pressure deep below the surface of the brain gel. A loss of ~3.5 dB was observed when recording from the skull compared to recording directly from the brain gel. Because our head model did not include a scalp, we predict an additional loss of 3–6 dB based on the conductive properties of the skin and results from previous studies that compared ECoG with scalp EEG recording (Koessler et al 2010). Current detection thresholds <0.4 mA cm−2 at 1 MPa are already within range of strong dipoles generated from evoked cortical activity (typically, 0.01–0.5 mA cm−2, Kamarajan et al 2015) and focal seizures (1–10 mA cm−2, Martinet et al 2017). Further improvements in sensitivity would enable detection of even weaker neuronal currents. Noninvasive tABI also overcomes limitations with scalp EEG by resolving deep dipoles at scales approaching 3 mm and 1 ms. Although the 40 mm standoff adapter attached to the end of the US array and in contact with the skull facilitated focusing at shallow depths (e.g. cortical and subcortical regions), the focal spot and lateral resolution degraded with depth as exhibited in figure 13. By placing the US array directly on the skull (without the adapter), we anticipate better lateral resolution when imaging deeper sources by effectively increasing the aperture at greater depths. In addition, by placing a higher frequency array (e.g. 3 MHz) over a thin portion of the skull, such as the transtemporal window, sub-mm resolution is possible (Preston et al 2018; 2020). Applications of this technology could include replacing cortical brain mapping via transcranial magnetic stimulation, performing translational research into both cortical and basal ganglia function in normal individuals and patients with a variety of neurologic disease both in the baseline condition and under various treatments, and directly investigating the electrical fields and network effects of DBS and other neurostimulators.
We also demonstrated the benefits of multichannel tABI by recording on six electrodes simultaneously. In theory, averaging on N electrodes could boost SNR by as much as with independent noise on each channel. We instead observed a 30% improvement by recording on six electrodes, suggesting that the background noise was highly correlated among channels. Further improvement in the electrode configuration and recording hardware might enable detection and reconstruction of weak neuronal currents in the brain using tABI technology (Olafsson et al 2008, Yang et al 2013).
One of the primary limitations in this study was the use of homogenous conductive gel instead of fresh brain tissue. The speed of sound and acoustic attenuation for brain tissue (1560 m s−1, 0.5 dB/cm/MHz) and conductive Agarose gelatin (1480 m s−1, 0.50 dB/cm/MHz) are very similar (Farrer et al 2015). In addition, the conductivity for gray (0.1–0.45 S m−1) and white (0.18–0.3 S m−1) matter is within range of conductive gelatin at room temperature (0.15–0.3 S m−1) (Kandadai et al 2012). Compared to current patterns generated in homogenous gel, we would expect larger spatial and temporal variation in heterogeneous brain tissue. However, the resolution and sensitivity of tABI are still defined by the size of the US focus and amplitude of the current gradients, respectively, which promotes imaging of more complex current patterns and heterogeneous tissue.
We demonstrated that the attenuation of the US pressure wave through 8 mm of bone (70% or 1.31 dB mm−1) was consistent with the decrease of the AE signal (63% or 1.08 dB mm−1). At 0.6 MHz and modest steering angles, aberration due to the skull did not affect the spatial resolution, which was approximately one acoustic wavelength (~3 mm) at a depth of 40 mm. Moreover, we expect aberration correction (e.g. using time reversal) to optimize US focusing through skull and improve sensitivity and resolution of tABI for mapping deep seizures and evoked activity.
In summary, we implemented a head model with real human skull to demonstrate 4D tABI for mapping time-varying monopoles and dipoles at depths greater than 60 mm and at detection thresholds less than 0.5 mA. Unlike conventional electrical brain mapping with surface and depth electrodes, tABI is able to localize current source densities at high spatial resolution determined by the size of the US focus (1–3 mm). Future work includes comparing and validating tABI with high density EEG, which we expect to have worse spatial resolution (>15 mm) and accuracy degrading with depth (Plummer et al 2019, Kang et al 2020, Sohrabpour et al 2020). As a novel modality for real-time intraoperative mapping, tABI combined with stereotactic navigation could help guide resection of epileptogenic tissue and deep focal seizures by fully characterizing functional brain regions and eloquent cortex. As a new tool for precise, rapid and noninvasive mapping of brain electrical activity, tABI could see numerous applications, including localization of seizure foci, improving our understanding of the effects of existing medical and surgical therapies, and characterizing localized brain activity in normal and diseased states, potentially leading to the rational development of new surgical targets for a wide range of neurologic diseases.
Supplementary Material
Acknowledgments
This work received funding support from the National Institutes of Health: R24MH109060, U01EB028662, T32EB000809, T32HL007955, R25HD080811. We would also like to thank the UA Willed Body Program for providing access to the human skull, and the Center for Gamma Ray Imaging for use of their 3D printer. We further acknowledge Abbott for allowing us to use the Infinity DBS stimulator for tABI. We also acknowledge grant R25 HL108837, Short-Term Training to Increase the Diversity Pipeline in Heart/Lung/Blood Research and R25RR15670, Medical Ignorance (QQQ) Collaboratory: K-12 Curriculum/Dissemination (Science Education Partnership Award - SEPA).
Footnotes
Dr. Witte has a financial interest in ElectroSonix, LLC, which did not contribute this study.
Supplementary material for this article is available online
References
- Berthon B, Behaghel A, Mateo P, Dansette P-M, Favre H, Ialy-Radio N, Tanter M, Pernot M and Provost J 2019. Mapping biological current densities with ultrafast acoustoelectric imaging: application to the beating rat heart IEEE Trans. Med. Imaging 38 1852–7 [DOI] [PubMed] [Google Scholar]
- Berthon B, Dansette P-M, Tanter M, Pernot M and Provost J 2017. An integrated and highly sensitive ultrafast acoustoelectric imaging system for biomedical applications Phys. Med. Biol 62 5808–22 [DOI] [PubMed] [Google Scholar]
- Engel J 2003. A greater role for surgical treatment of epilepsy: why and when? Epilepsy Curr 3 37–40 [DOI] [PMC free article] [PubMed] [Google Scholar]
- Farrer A, Odeen H, Bever J, Coats B, Parker DL, Payne A and Christensen DA 2015. Characterization and evaluation of tissue-mimicking gelatin phantoms for use with MRgFUS J. Ther. Ultrasound 3 9. [DOI] [PMC free article] [PubMed] [Google Scholar]
- Kamarajan C, Pandey AK, Chorlian DB and Porjesz B 2015. The use of current source density as electrophysiological correlates in neuropsychiatric disorders: a review of human studies Int. J. Psychophysiol 97 310–22 [DOI] [PMC free article] [PubMed] [Google Scholar]
- Kandadai MA, Raymond JL and Shaw GJ 2012. Comparison of electrical conductivities of various brain phantom gels developing a ‘brain gel model’ Mater. Sci. Eng. C 32 2664–7 [DOI] [PMC free article] [PubMed] [Google Scholar]
- Kang X, Boly M, Findlay G, Jones B, Gjini K, Maganti R and Struck AF 2020. Quantitative spatio-temporal characterization of epileptic spikes using high density EEG: differences between NREM sleep and REM sleep Sci. Rep 10 1673. [DOI] [PMC free article] [PubMed] [Google Scholar]
- Koessler L, Benar C, Maillard L and Gavaret M 2010. Source localization of ictal epileptic activity investigated by high resolution EEG and validated by SEEG Neuroimage 51 642–53 [DOI] [PubMed] [Google Scholar]
- Li Q, Olafsson R, Ingram CP, Wang Z and Witte RS 2012. Measuring the acoustoelectric interaction constant using ultrasound current source density imaging Phys. Med. Biol 57 5929. [DOI] [PMC free article] [PubMed] [Google Scholar]
- Martinet LE, Fiddyment G, Madsen JR, Eskandar EN, Truccolo W, Eden UT, Cash SS and Kramer MA 2017. Human seizures couple across spatial scales through travelling wave dynamics Nat. Commun 8 14896. [DOI] [PMC free article] [PubMed] [Google Scholar]
- Olafsson R, Li Q, Wang Z and Witte R 2009. Ultrasound current source density imaging of a time-varying current field in a multielectrode nerve chamber Proc. 2009 IEEE Ultrasonics, Ferroelectrics and Frequency Control pp 333–6 [Google Scholar]
- Olafsson R, Witte RS, Huang S-W and O’Donnell M 2008. Ultrasound current source density imaging IEEE Trans. Biomed. Eng 55 1840–8 [DOI] [PMC free article] [PubMed] [Google Scholar]
- Plummer C, Vogrin SJ, Woods WP, Murphy MA, Cook MJ and Liley DTJ 2019. Interictal and ictal source localization for epilepsy surgery using high-density EEG with MEG: a prospective long-term study Brain 142 932–51 [DOI] [PMC free article] [PubMed] [Google Scholar]
- Preston C, Alvarez AM, Barragan A, Becker J, Kasoff W and Witte RS 2020. High resolution transcranial acoustoelectric imaging of current densities from a directional deep brain stimulator J. Neural. Eng 17 016074. [DOI] [PMC free article] [PubMed] [Google Scholar]
- Preston C, Kasoff W and Witte RS 2018. Mapping current patterns generated by a clinical deep brain stimulator using acoustoelectric imaging Ultrasound Med. Biol 44 2345–57 [DOI] [PMC free article] [PubMed] [Google Scholar]
- Qin Y, Ingram P, Burton A and Witte RS 2016. 4D acoustoelectric imaging of current sources in a human head phantom Proc. IEEE UFFC IUS pp 1–4 [Google Scholar]
- Qin Y, Ingram P, Xu Z, O’Donnell M and Witte RS 2017. Performance of a transcranial US array designed for 4D acoustoelectric brain imaging in humans Proc. IEEE UFFC IUS pp 1–4 [Google Scholar]
- Qin Y, Li Q, Ingram CP and Witte RS 2015. Ultrasound current source density imaging of the cardiac activation wave using a clinical cardiac catheter IEEE Trans. BME 62 241–7 [DOI] [PMC free article] [PubMed] [Google Scholar]
- Ramantani G, Maillard L and Koessler L 2016. Correlation of invasive EEG and scalp EEG Seizure 41 196–200 [DOI] [PubMed] [Google Scholar]
- Sohrabpour A, Cai Z, Ye S, Brinkmann B, Worrell G and He B 2020. Noninvasive electromagnetic source imaging of spatiotemporally distributed epileptogenic brain sources Nat. Commun 11 1946. [DOI] [PMC free article] [PubMed] [Google Scholar]
- Stolk A, Griffin S, van der Meij R, Dewar C, Saez I, Lin JJ, Piantoni G, Schoffelen J-M, Knight RT and Oostenveld R 2018. Integrated analysis of anatomical and electrophysiological human intracranial data Nat. Protoc 13 1699–723 [DOI] [PMC free article] [PubMed] [Google Scholar]
- Wang Z, Olafsson R, Ingram CP, Li Q and Witte RS 2011. Four-dimensional ultrasound current source density imaging of a dipole field Appl. Phys. Lett 99 113701. [DOI] [PMC free article] [PubMed] [Google Scholar]
- West S, Nolan SJ and Newton R 2016. Surgery for epilepsy: a systematic review of current evidence Epileptic Disord 18 113–21 [DOI] [PubMed] [Google Scholar]
- Wilhite C, Alvarez A, Burton A, Preston C, Mustacich D, Fuglevand A, Gothard K, Cowen S and Witte RS 2019. In vivo swine model for developing and validating acoustoelectric brain imaging: towards noninvasive, real-time 4D electrical brain mapping Abstracted Accepted to Society for Neuroscience (accepted)
- Witte RS, Olafsson R, Huang S-W and O’Donnell M 2007. Imaging current flow in lobster nerve cord using the acoustoelectric effect Appl. Phys. Lett 90 163902 [Google Scholar]
- Witte RS, Olafsson R and O’Donnell M 2011. High-resolution mapping of bio-electric fields U.S. Patent Specification 8,057,390
- Yang R, Li X, Song A, He B and Yan R 2013. A 3-D reconstruction solution to current density imaging based on acoustoelectric effect by deconvolution: a simulation study IEEE Trans. Biomed. Eng 60 1181–90 [DOI] [PubMed] [Google Scholar]
Associated Data
This section collects any data citations, data availability statements, or supplementary materials included in this article.