Abstract
Chemical inhibitors of the deubiquitinase USP7 are currently being developed as anticancer agents based on their capacity to stabilize P53. Regardless of this activity, USP7 inhibitors also generate DNA damage in a p53‐independent manner. However, the mechanism of this genotoxicity and its contribution to the anticancer effects of USP7 inhibitors are still under debate. Here we show that, surprisingly, even if USP7 inhibitors stop DNA replication, they also induce a widespread activation of CDK1 throughout the cell cycle, which leads to DNA damage and is toxic for mammalian cells. In addition, USP7 interacts with the phosphatase PP2A and supports its active localization in the cytoplasm. Accordingly, inhibition of USP7 or PP2A triggers very similar changes of the phosphoproteome, including a widespread increase in the phosphorylation of CDK1 targets. Importantly, the toxicity of USP7 inhibitors is alleviated by lowering CDK1 activity or by chemical activation of PP2A. Our work reveals that USP7 limits CDK1 activity at all cell cycle stages, providing a novel mechanism that explains the toxicity of USP7 inhibitors through untimely activation of CDK1.
Keywords: anticancer drugs, CDK1, cell cycle, deubiquitinase, USP7
Subject Categories: Cell Cycle; Post-translational Modifications, Proteolysis & Proteomics
The finding that USP7 inhibitors trigger widespread untimely CDK1 activation throughout the cell cycle represents another new toxicity mechanism of these potential anticancer drugs.

Introduction
The eukaryotic cell cycle is governed by cyclin/CDK complexes that coordinate an orderly transition between the different cell cycle stages (G1, S, G2, and M) (Morgan, 2007). While progression through interphase is under the control of CDK2, CDK4, and CDK6, mitotic entry is primarily driven by CDK1. As noted early on, preventing the activation of the mitotic program before DNA replication is completed is particularly critical in cell cycle control (Hartwell & Weinert, 1989; Enoch & Nurse, 1991). A number of studies in the subsequent decades have confirmed that the activation of CDK1 during DNA replication is toxic for eukaryotic cells (Aarts et al, 2012; Duda et al, 2016). Accordingly, genetic conditions that increase CDK1 activity such as wee1 deletion in fission yeast (Russell & Nurse, 1987) or mutation of the inhibitory tyrosine residues of CDK1 in mice (Szmyd et al, 2019) are associated with the induction of DNA damage and reduced fitness. In this context, keeping low levels of CDK1 activity during interphase becomes essential for safeguarding genomic integrity and preserving cellular viability.
As to how CDK1 increased activity in S‐phase leads to DNA damage, work in Xenopus extracts indicates that this is due to the breakage of replication forks upon a premature disassembly of replisomes (Deng et al, 2019). Supporting that CDK1‐dependent DNA damage is related to DNA replication, these breaks are preferentially observed at common fragile sites (CFSs) (preprint: Brison et al, 2020). Importantly, a premature activation of CDK1 underlies the genotoxic effects of a number of drugs that are being explored as anticancer therapies such as WEE1, ATR, CHK1, or phosphatase inhibitors (Ajiro et al, 1996; Aarts et al, 2012; Ruiz et al, 2016). Accordingly, mutations that lower CDK1 activity such as loss of the CDC25A phosphatase confer resistance to ATR inhibitors (Ruiz et al, 2016; Mayor‐Ruiz et al, 2017). Similarly, a recent study revealed that loss of FAM122A provides resistance to CHK1 inhibitors by activating the PP2A‐B55α phosphatase (Li et al, 2020), a key factor in removing CDK1‐dependent phosphorylation events (Schmitz et al, 2010). Thus, identifying new factors that restrict CDK1 activity during interphase could potentially be exploited for the development of new genotoxic cancer therapies.
Previous work from several groups including us identified USP7 as a deubiquitinase (DUB) that is essential for the completion of DNA replication (Jagannathan et al, 2014; Lecona et al, 2016; Hernandez‐Perez et al, 2017). Interest on this DUB as a potential target in cancer therapy has recently intensified leading to the development of a slew of USP7 inhibitors (reviewed in (Zhang & Sidhu, 2018)). The currently accepted mechanism of action for USP7 inhibitors is the stabilization of P53 due to the degradation of MDM2, the main E3 ligase that targets P53 for proteasomal degradation (Li et al, 2002). However, the fact that P53 deficiency does not rescue the lethality of USP7 knockout embryos (Kon et al, 2010) together with the observation that USP7 inhibitors generate DNA damage independently of P53 (Lecona et al, 2016) indicates that additional mechanisms must contribute to the toxicity of these compounds. We here reveal a functional interaction between USP7 and PP2A which suppresses CDK1 activity during interphase. As a consequence, USP7 depletion or its chemical inhibition led to a generalized activation of CDK1 during interphase, which is genotoxic during DNA replication. Besides their relevance for our understanding of the cell cycle, these findings could help in the rational development of USP7 inhibitors as anticancer agents.
Results
USP7 inhibition triggers a premature activation of mitotic kinases
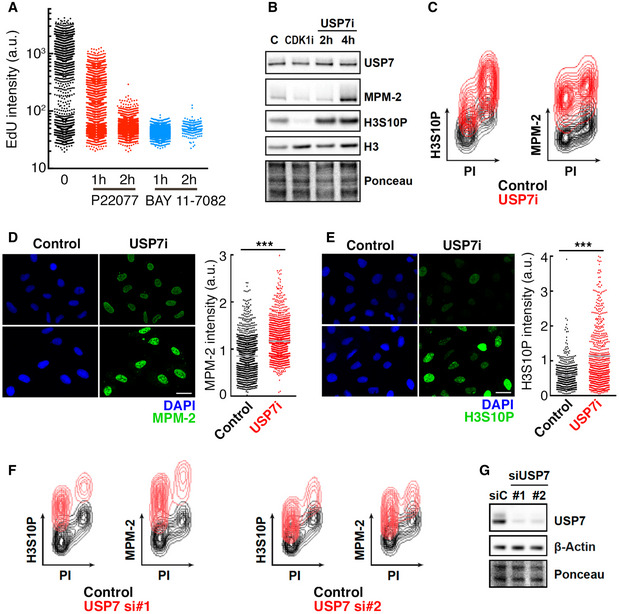
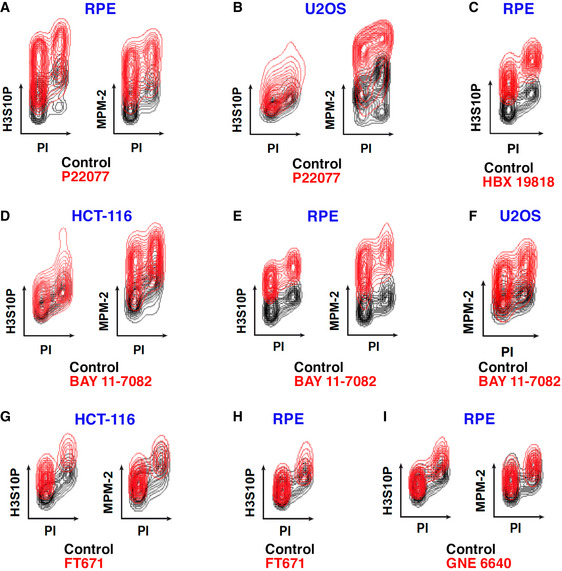
To evaluate the effects of USP7 inhibitors on the cell cycle, we used the human colon cancer cell line HCT‐116, which has been previously used to measure the toxicity of USP7 inhibitors (Turnbull et al, 2017). In agreement with the role of USP7 in DNA replication (Jagannathan et al, 2014; Lecona et al, 2016; Hernandez‐Perez et al, 2017), 2 structurally unrelated USP7 inhibitors (P22007—USP7i hereafter—and BAY 11‐7082) abrogated DNA replication in HCT‐116 cells as measured by the incorporation of 5‐ethynyl‐2′‐deoxyuridine (EdU; Fig 1A). Surprisingly, and despite this blunt arrest of DNA replication, USP7 inhibition led to a marked increase in the levels of phosphorylated histone H3 Ser 10 (H3S10P), a well‐established mitotic mark (Wei et al, 1999) (Fig 1B). A similar increase was observed using MPM‐2, a monoclonal antibody raised against mitosis‐specific phosphorylation events (Davis et al, 1983) (Fig 1B). Interestingly, flow cytometry analyses revealed that, upon USP7 inhibition, the levels of H3S10P and MPM‐2 increased throughout the cell cycle, rather than being restricted to mitotic cells (Fig 1C). Equivalent results were observed using high‐content microscopy (Fig 1D and E). Importantly, this generalized accumulation of H3S10P and MPM‐2 was observed in all cell lines tested (HCT‐116, RPE, and U2OS) and using five independent USP7 inhibitors (P22007, BAY 11‐2082, HBX‐19818, FT671, and GNE‐6640; Fig EV1). Furthermore, it was recapitulated by depleting USP7 with RNA interference (Fig 1F and G), confirming the selectivity of this effect. Together, these data reveal that USP7 inhibition leads to a generalized activation of mitotic signaling throughout the cell cycle.
Figure 1. Targeting USP7 triggers mitotic signaling throughout the cell cycle.
-
AHTM of EdU levels per individual nucleus in response to USP7 inhibition in HCT‐116 cells treated with 50 μM P22077 for 1–2 h or 25 μM BAY 11‐7082 for 1–2 h, or with DMSO as a control.
-
BWestern Blot (WB) showing the levels of USP7, MPM‐2, histone H3S10P, and histone H3 in whole nuclear extracts of HCT‐116 cells treated with 50 μM P22077 for 2–4 h (USP7i), 10 μM RO3306 for 8 h (CDK1i), or DMSO as a control. Ponceau staining is shown as a loading control.
-
CFlow cytometry profile illustrating the levels of histone H3S10P (left) and MPM‐2 (right) in HCT‐116 cells in control conditions (control, black) and after treatment with 50 μM P22077 for 4 h (USP7i, red). DNA content was measured with propidium iodide (PI).
-
D, EHTM‐mediated quantification of MPM‐2 (D) and H3S10P (E) levels per individual nucleus in U2OS cells treated with DMSO as a control or 50 μM P22077 (USP7i) for 4 h. Nuclei were stained with DAPI (blue). Scale bar, 30 μm. The quantification is shown to the right of representative images for each analysis (***P < 0.05; t‐test). Gray lines indicate mean values.
-
FFlow cytometry profile representing the levels of histone H3S10P and MPM‐2 in HCT‐116 cells transfected with two different siRNA against USP7 (red; si#1 and si#2) or with a non‐specific siRNA (control, black), for 96 h. DNA content was measured with propidium iodide (PI).
-
GWB illustrating the depletion of USP7 in the HCT‐116 cells used in (F). Experiments were repeated three times, and one representative result is shown.
Figure EV1. USP7 inhibitors trigger a widespread accumulation of mitotic signaling events.
-
Flow cytometry profiles illustrating the levels of H3S10P and MPM‐2 in cells either treated with different USP7 inhibitors (red) or with DMSO as a control (black).
-
A, BRPE and U2OS cells treated with 25 or 50 μM P22077 for 4 h, respectively.
-
CRPE cells treated with 50 μM HBX 19818 for 16 h.
-
D, EHCT‐116 (D) and RPE (E) cells treated with 25 μM BAY 11‐7082 for 4 h (H3S10P) and 2 h (MPM‐2).
-
FMPM‐2 levels in U2OS cells treated with 25 μM BAY 11‐7082 for 4 h.
-
G, HHCT‐116 and RPE cells treated with 60 μM FT671 for 16 h.
-
IRPE cells treated with 50 μM GNE‐6640 for 8 h (H3S10P) and 24 h (MPM‐2).
USP7 suppresses cyclin B/CDK1 activity throughout the cell cycle
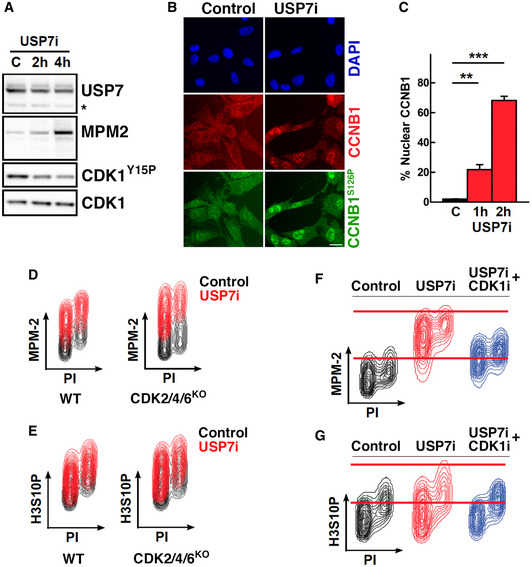
Next, we asked whether USP7 inhibition specifically led to an increased activity of CDK1. The activation of CDK1 at the end of G2 involves the removal of inhibitory phosphorylations at Thr‐14 and Tyr‐15 by multiple phosphatases along with the nuclear translocation and phosphorylation of cyclin B1 (CCNB1) (reviewed in (Rhind & Russell, 2012)). Consistent with the flow cytometry data (Fig 1C), Western blotting (WB) revealed that the increase in MPM‐2 reactivity upon USP7 inhibition is concomitant to a decrease in CDK1‐Tyr15 phosphorylation (Fig 2A). Moreover, immunofluorescence analyses revealed a general accumulation of CCNB1 in the nucleus of RPE cells treated with USP7i, which was phosphorylated at Ser‐126, a CDK1‐dependent site (Li et al, 1997) (Fig 2B and C). These results led us to contemplate the possibility that USP7 inhibition was leading to the activation of CDK1 in the majority of interphase cells. Of note, while CDK1 activity is normally restricted to G2/M, its activation throughout the cell cycle has been observed before in cells where CDK1 Thr‐14 and Tyr‐15 inhibitory residues are mutated to Ala and Phe, respectively (Szmyd et al, 2019). To determine whether the increase in H3S10P and MPM‐2 reactivity observed in response to USP7i was caused by CDK1, we used mouse embryonic fibroblasts (MEFs) lacking CDK2, CDK4, and CDK6, where CDK1 drives all cell cycle transitions by binding to the different cyclins (Santamaria et al, 2007). The effect of USP7i in MPM‐2 and H3S10P levels was similar in wild‐type (WT) and CDK2/4/6 KO MEFs, supporting that this effect is mediated by CDK1 (Fig 2D and E). Furthermore, chemical inhibition of CDK1 with RO3306 (CDK1i, hereafter) (Vassilev et al, 2006) rescued the general increase in H3S10P and MPM‐2 reactivity that is observed upon USP7 inhibition (Fig 2F and G). In contrast, palbociclib, a dual CDK4/CDK6 inhibitor (Toogood et al, 2005), did not have any impact on the increase in H3S10P and MPM‐2 triggered by USP7i (Fig EV2A). In addition, the broad‐spectrum CDK inhibitor roscovitine, which besides CDK1 also inhibits CDK2, CDK5, CDK7, and CDK9, displayed a similar effect as the CDK1‐specific RO3306 (Cicenas et al, 2015) (Fig EV2B). Altogether, these data indicate that USP7 restricts CDK1 activity throughout the cell cycle.
Figure 2. USP7 suppresses CCNB1/CDK1 activity.
-
AWestern blot showing the levels of USP7, MPM‐2, CDK1Y15P, and CDK1 in whole cell extracts of RPE cells treated with 25 μM P22077 for 2–4 h (USP7i), and an asterisk indicates a non‐specific band.
-
BImmunofluorescence of CCNB1 (red) and CCNB1S126P (green) in RPE cells in control conditions (control) and after treatment with 25 μM P22077 for 2 h (USP7i). Nuclei were stained with DAPI (blue). Scale bar, 30 μm.
-
CQuantification of the nuclear translocation of CCNB1 in RPE cells treated with 25 μM P22077 for 1–2 h measured by high‐throughput microscopy in three different experiments (**P < 0.01 and ***P < 0.005; t‐test). Bars represent mean values ± SEM. N > 2,000 cells were analyzed per condition.
-
D, EFlow cytometry profiles representing the levels of MPM‐2 (D) and H3S10P (E) in WT and CDK2/4/6 knockout MEF in control conditions (control, black) and after treatment with 50 μM P22077 for 4 h (USP7i, red). The experiment was performed twice using two different wild‐type and CDK2/4/6 KO MEFs, and one representative result is shown.
-
F, GFlow cytometry profiles representing the levels of MPM‐2 (F) and H3S10P (G) in RPE cells in control conditions (control, black), after treatment with 25 μM P22077 for 4 h (USP7i, red) or after treatment with 10 μM RO3306 for 8 h followed by incubation with 25 μM P22077 and 10 μM RO3306 for four additional hours (CDK1i + USP7i, blue). DNA content was measured with propidium iodide (PI). One representative experiment is shown, out of five.
Figure EV2. Impact of different CDK inhibitors on the increase in MPM‐2 reactivity triggered by USP7 inhibition.

- Flow cytometry profiles representing the levels of MPM‐2 in RPE cells in control conditions and after treatment with 25 μM P22077 (USP7i, red) for 4 h alone or in combination with 10 μM of the CDK1 selective inhibitor RO3306 or 2.5 μM of the CDK4/6 inhibitor palbociclib. DNA content was measured with propidium iodide (PI).
- Flow cytometry profiles as in (A) for RPE cells in control conditions and after treatment with 25 μM P22077 (USP7i, red) alone or in combination with 10 μM of the CDK1‐selective inhibitor RO3306 or with 10 μM of roscovitine, which besides CDK1 also inhibits CDK2, CDK5, CDK7, and CDK9. DNA content was measured with propidium iodide (PI). Red lines illustrate the maximum values in control or upon treatment with USP7i and are provided for an easier assessment of the differences between conditions.
USP7 interacts with and regulates the activity of PP2A
The activation of CDK1 is counteracted by several phosphatases, among which PP2A plays a central role (Hunt, 2013). In fact, PP2A inhibition is the mechanism through which okadaic acid (OA) mediates premature mitotic entry (Mochida et al, 2009). Interestingly, PP2A was among the top targets in our previous proteomic analysis of USP7 substrates (Lecona et al, 2016). In this regard, several lines of evidence support that the rise in CDK1 activity induced by USP7i is related to PP2A. First, reciprocal immunoprecipitation experiments revealed an interaction between USP7 and different subunits of the PP2A complex (PP2A‐A and PP2A‐C), further increased in the presence of USP7i (Fig 3A). Second, WB analyses showed that USP7 inhibition increases the phosphorylation of multiple PP2A targets including AKT, PRC1, MAPKAPK‐2, KAP, or STAT3, similar to what is observed upon treatment with the PP2A inhibitor OA (Fig 3B). Third, depletion of the B55α regulatory subunit of PP2A (PPP2R2A) phenocopied the generalized accumulation of MPM‐2 and H3‐S10P that is triggered by USP7 inhibition throughout the cell cycle (Fig EV3A and B). Of note, although OA also inhibits additional phosphatases such as PP1, the depletion of its catalytic subunit (PP1AC) primarily triggers an accumulation of H3S10P in G1 arrested cells in contrast to the general increase observed with PPP2R2A depletion or USP7 inhibition (Fig EV3C and D). Fourth, while USP7i did not affect the overall levels of members of the PP2A complex (Fig EV3E), it triggered the translocation of PP2A to the nucleus as observed in both chromatin fractionation and immunofluorescence analyses (Fig 3C and D). Since active PP2A‐B55α has been described to reside primarily in the cytoplasm (reviewed in (Alvarez‐Fernandez & Malumbres, 2014)), the change in the localization of PP2A induced by USP7i could underlie the regulation of its activity. Interestingly, high‐throughput microscopy analyses revealed that the nuclear accumulation of PP2A precedes the translocation of CCNB1, suggesting that the changes induced by USP7i on PP2A are upstream of CDK1 activation (Fig EV3F). In strong support of this view, the increase in phosphorylation events triggered by USP7i could be reverted with a recently developed chemical activator of PP2A (DT‐061) (Sangodkar et al, 2017) (Fig 3E).
Figure 3. Targeting USP7 inactivates PP2A.
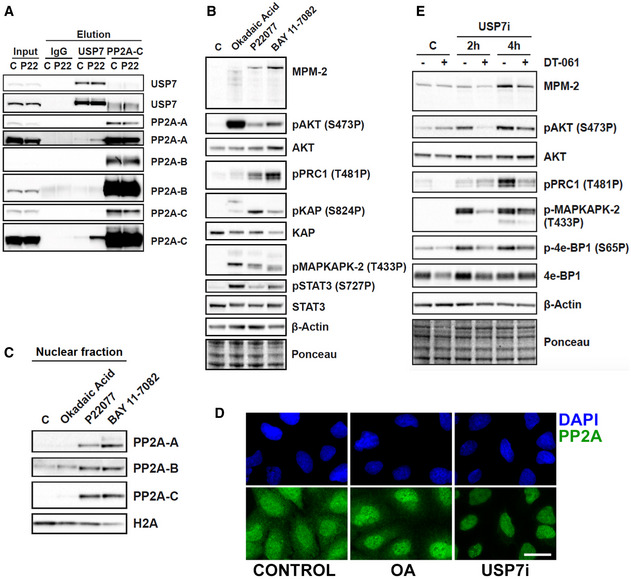
- Immunoprecipitation against IgG, USP7, and PP2A‐C in whole cell extracts of RPE cells that were treated with DMSO (control) or 25 μM P22077 (USP7i). Levels of USP7, PP2A‐A, PP2A‐B, and PP2A‐C are shown. Images from two different exposure times are shown for the better inspection of saturated bands.
- Western blot showing the levels of MPM‐2, pAKT, AKT, pPRC1, pKAP, KAP, pMAPKAPK‐2, pSTAT3, STAT3, and β‐Actin in whole cell extracts of RPE cells treated with DMSO (control), 0.5 μM okadaic acid for 2 h, 25 μM P22077 for 4 h, or 25 μM BAY 11‐7082 for 2 h. Ponceau staining is shown as loading control.
- Western blot showing the levels of PP2A‐A, PP2A‐B, PP2A‐C, and H2A in the nuclear fraction of RPE cells treated with DMSO (control), 0.5 μM okadaic acid for 2 h, 25 μM P22077 for 4 h, and 25 μM BAY 11‐7082 for 2 h.
- Immunofluorescence of PP2A‐A (green) in U2OS cells treated with DMSO (control), 50 μM P22077 (USP7i) for 4 h, or 0.5 μM okadaic acid (OA) for 1 h 30 min. Nuclei were stained with DAPI (blue). Scale bar, 10 μm.
- Western blot showing the levels of MPM‐2, pAKT, AKT, pPRC1, pMAPKAPK‐2, p4e‐BP1, 4e‐BP1, and β‐Actin, in whole cell extracts of RPE cells treated with DMSO (control), 25 μM P22077 (USP7i), and 10 μM of the PP2A activator DT‐061 for 2–4 h. Ponceau staining is shown as loading control.
Figure EV3. Functional interaction between USP7 and PP2A.
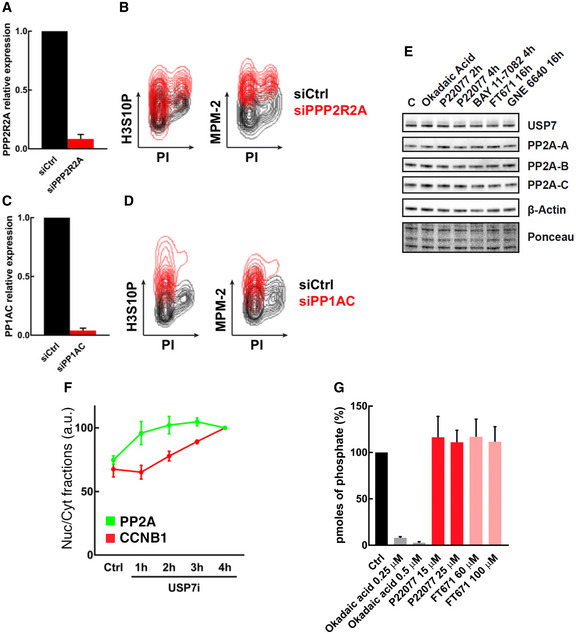
- RT–qPCR for RNA extracts from RPE cells transfected with a non‐specific siRNA (control) or with a siRNA against PPP2R2A for 72 h.
- Flow cytometry profiles representing the levels of histone H3S10P and MPM‐2 in RPE cells transfected as in (A), with a non‐specific siRNA (control, black) or with a siRNA against PPP2R2A (red). DNA content was measured with propidium iodide (PI).
- RT–qPCR for RNA extracts from RPE cells transfected with a non‐specific siRNA (control) or with a siRNA against PP1AC for 72 h.
- Flow cytometry profiles representing the levels of histone H3S10P and MPM‐2 in RPE cells transfected as in (C), with a non‐specific siRNA (control, black) or with a siRNA against PP1AC (red). DNA content was measured with propidium iodide (PI).
- WB representing the levels of USP7, PP2A‐A, PP2A‐B, PP2A‐C, and β‐Actin in whole cell extracts of RPE cells treated with DMSO (control), 0.5 μM OA for 2 h, 25 μM P22077 for 2–4 h, 25 μM BAY 11‐7082 for 2 h, 60 μM FT671 for 16 h, and 50 μM GNE 6640 for 16 h. Ponceau staining is shown as loading control.
- HTM‐mediated quantification of the relative nuclear cytoplasmic ratios of PP2A and CCNB1 per individual cell in response to USP7 inhibition in U2OS cells treated with 50 μM P22077 for the indicated times or with DMSO as a control. The quantification derived from 3 independent experiments. N > 2,000 cells analyzed per condition.
- Phosphatase assay in vitro in RPE cells, showing the quantification of free phosphate. Before the phosphatase reaction, DMSO was added as control, 0.25 and 0.5 μM OA as a potent PP2A inhibitor, and 15 and 25 μM of P22077 or 60 and 100 μM FT671 as independent examples of USP7 inhibitors.
Data information: All data are presented as mean values ± SD.
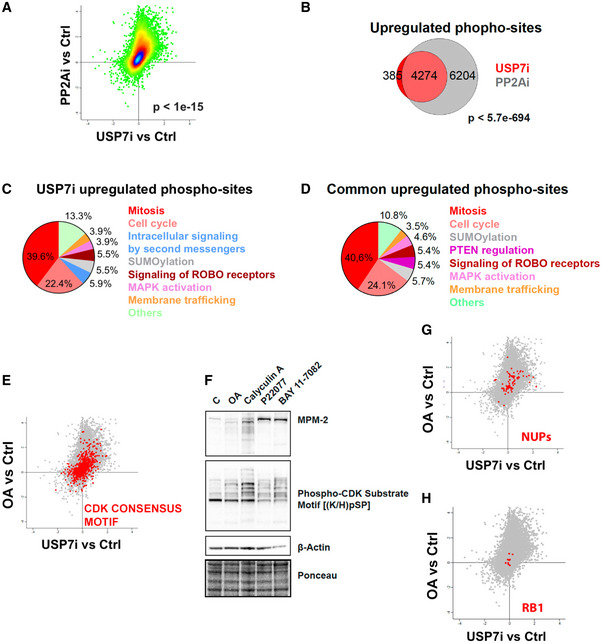
Finally, and to further confirm the functional link between USP7 and PP2A we conducted phosphoproteomic analyses in RPE cells exposed to USP7i and OA to evaluate the changes in protein phosphorylation induced by these agents. These experiments revealed a highly significant (P < 1e‐15) correlation in the changes of the phosphoproteome induced by both treatments (Fig 4A), and the vast majority (91.7%) of the residues that presented increased phosphorylation levels in response to USP7i were also induced by OA (Fig 4B). Next, we carried out a bioinformatic analysis using Reactome (Fabregat et al, 2017) to determine the biological pathways that are enriched in the subset of proteins with increased phosphorylation upon both USP7i and OA treatment. Consistent with a premature activation of CDK activity, “Mitosis” and “Cell Cycle” were the pathways most significantly enriched by USP7i and were also the top pathways induced commonly by both treatments (Fig 4C and D). Moreover, interrogation of the phosphoproteomic data revealed that both OA and USP7i triggered a general increase in phosphorylation of epitopes containing the CDK‐dependent phosphorylation motif p(S/T)Px(K/R) (Amanchy et al, 2007) (Fig 4E), which we could confirm by WB (Fig 4F). Noteworthy, while USP7i increased the phosphorylation of known CDK1 targets such as nucleoporins (Fig 4G), it failed to trigger the phosphorylation of retinoblastoma (RB), regulated by CDK2, CDK4, and CDK6 (Fig 4H). Collectively, these experiments indicate that USP7 inhibition suppresses PP2A activity, which in turn drives the activation of CDK1. Importantly, USP7 inhibitors do not directly inhibit PP2A in in vitro biochemical assays, ruling out an off‐target effect of these compounds on PP2A (Fig EV3G).
Figure 4. USP7 inhibition phenocopies the changes in the phosphoproteome induced by OA.
-
APhosphoproteome‐wide correlation between the effects observed upon USP7i and OA treatments (4 and 2 h, respectively) in RPE cells. The P‐value was obtained by a t‐test to evaluate the Pearson correlation between both samples.
-
BVenn diagrams representing the overlap between the peptides that show increased levels of phosphorylation upon USP7i and OA treatments. The P‐value was obtained by a hypergeometric test.
-
C, DReactome analysis illustrating the biological pathways related to the factors that show increased phosphorylation upon treatment with USP7i or that are commonly upregulated in response to USP7i and OA.
-
ERepresentation of the phosphorylation levels at epitopes that follow the CDK consensus motif p(S/T)Px(K/R) upon USP7i or OA treatments from data obtained at phosphoproteomic analyses.
-
FWestern blot showing the levels of MPM‐2, phosphor‐CDK substrate motif [(K/H)pSP], and β‐Actin in whole cell extracts of RPE cells treated with DMSO (control), 0.5 μM okadaic acid (OA) for 2 h, 10 nM calyculin A for 2 h, 25 μM P22077 for 4 h, or 25 μM BAY 11‐7082 for 2 h. Calyculin A was added to this experiment to illustrate the gain in CDK activity induced by an additional PP2A inhibitor. Ponceau staining is shown as loading control.
-
G, HRepresentation of the phosphorylation levels at epitopes from nucleoporins (NUPs; (G)) or retinoblastoma (RB1; (H)) upon USP7i or OA treatments from data obtained at phosphoproteomic analyses.
USP7 inhibition leads to CDK1‐dependent DNA damage in interphase cells
When analyzing the changes in the phosphoproteome selectively induced by OA but not by USP7i, we found an enrichment of targets associated with the spindle checkpoint or late stages of mitosis (telophase/cytokinesis; Fig EV4A). Since this effect was not observed with USP7i, we hypothesized that even if the inhibition of USP7 drives the phosphorylation of CDK1 targets in interphase, it does not promote a full activation of the mitotic program. Consistent with this view, OA but not USP7i induced the phosphorylation of LMNA, an event that is associated with the breakdown of the nuclear lamina during mitosis (Fig EV4B). Moreover, the rapid accumulation of nuclear CCNB1 triggered by USP7i was not followed by the breakdown of the nuclear lamina, in contrast to what occurs in control conditions (Fig EV4C and D). These findings indicate that USP7 inhibition increases CDK1 activity in interphase cells without triggering mitotic entry.
Figure EV4. USP7 inhibition does not trigger mitotic entry.
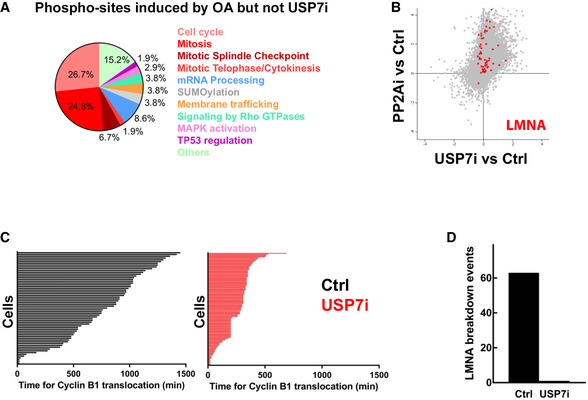
- Reactome analysis illustrating the biological pathways related to the factors that show increased phosphorylation upon treatment with OA but not with USP7i.
- Representation of the phosphorylation levels at epitopes from LMNA upon USP7i or OA treatments from data obtained at phosphoproteomic analyses shown in Fig 4.
- Time‐lapse microscopy‐mediated quantification of the time (min) needed per cell to observe nuclear translocation of a mCherry‐tagged CCNB1 in U2OS treated with DMSO as a control (Ctrl) or 50 μM P22077 (USP7i) for 24 h. Each line indicates the time per cell.
- Quantification of the percentage of nuclear envelope breakdown events for all cells followed in the experiment defined in (C).
To better understand the order of events that follow USP7 inhibition, we used high‐throughput microscopy to conduct a time‐course analysis. These experiments revealed that by 1 h USP7i elicited changes in CDK1 activity (MPM2), DNA replication (EdU), and DNA damage (γH2AX) before any increase in H3S10 phosphorylation was observed (Fig 5A). This delay might reflect that H3S10 phosphorylation is subsequent to CDK1 activation during the cell cycle, as it is deposited by AURKB and removed by PP1 (Hsu et al, 2000), further supporting that increasing CDK1 activity is one of the primary effects of USP7 inhibition. As mentioned above, a premature activation of CDK1 in interphase cells has been shown to induce DNA damage and cell death (Aarts et al, 2012; Duda et al, 2016; Deng et al, 2019; Szmyd et al, 2019). Thus, we asked whether the DNA damage induced by USP7i (Lecona et al, 2016) is related to the premature activation of CDK1. Consistent with this view, a flow cytometry‐based time course showed that USP7i‐induced γH2AX occurred in cells that had previously activated CDK1 as identified by MPM‐2 reactivity (Fig 5B). By 8 h of treatment with USP7i, virtually all of the increase in γH2AX was restricted to cells presenting very high levels of H3S10P and MPM‐2 (Fig 5C). Moreover, flow cytometry and WB experiments revealed that the levels of γH2AX induced by USP7 inhibition were significantly reduced by the concomitant inhibition of CDK1 (Fig 5D and E). In addition to reducing USP7‐induced DNA damage, CDK1 inhibition partially alleviated the decrease in EdU incorporation that is triggered by USP7i (Fig EV5), which could be related to the fact that CDK1 activity in S‐phase promotes premature replisome disassembly (Deng et al, 2019). Together, these experiments demonstrate that an increase in CDK1 activity is responsible for the genotoxic effects of USP7 inhibitors.
Figure 5. USP7 suppresses CDK1‐dependent DNA damage.
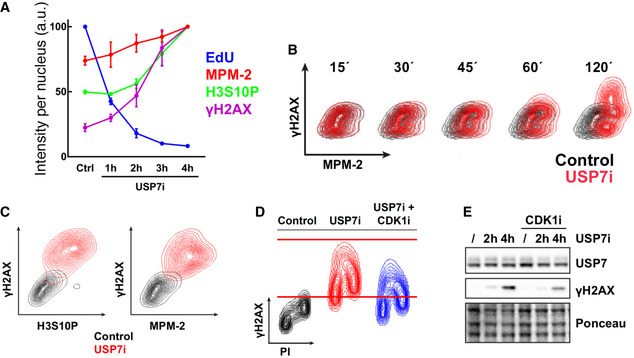
- HTM‐dependent quantification of EdU, γH2AX, H3S10P, and MPM‐2 levels per individual nucleus in U2OS cells treated with 50 μM P22077 (USP7i) for the indicated times or with DMSO as a control. Quantification data derived from three independent experiments. Data represent mean values ± SEM. N > 2,000 cells analyzed per condition.
- Flow cytometry profiles illustrating the levels of γH2AX and MPM‐2 in U2OS cells in control conditions (control, black) and after treatment with 50 μM P22077 for the indicated times (USP7i, red). Experiments were repeated three times, and one representative result is shown.
- Flow cytometry profiles representing the correlation between γH2AX and MPM‐2 or histone H3S10P signals in HCT‐116 cells treated with DMSO (control) or 50 μM P22077 for 8 h (USP7i).
- Flow cytometry profiles representing the levels of γH2AX in HCT‐116 cells in control conditions or after treatment with 50 μM P22077 (USP7i) for 4 h alone or in combination with 10 μM RO3306 (USP7i + CDK1i) for 4 h. DNA content was measured with propidium iodide (PI).
Figure EV5. CDK1 inhibition alleviates the effects of USP7i on DNA replication.
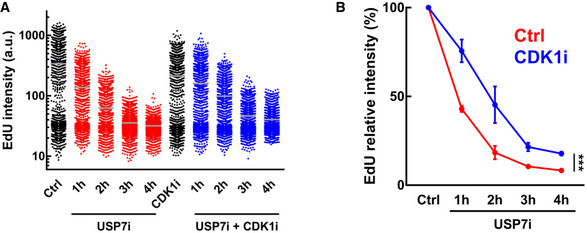
- HTM‐mediated quantification of the levels of EdU incorporation per cell in U2OS cells treated with USP7i (50 μM) alone or in combination with 10 μM of the CDK1‐selective inhibitor RO3306 (CDK1i).
- Representation of the median data obtained in (A). Data represent mean values ± SEM (***P < 0.05; ANOVA).
Limiting CDK1 activity suppresses the toxicity of USP7 inhibitors
Finally, we evaluated whether the rise in CDK1 activity plays a role in the toxicity of USP7 inhibitors, which as mentioned are being developed as anticancer agents based on their capacity to increase P53 levels (Li et al, 2002). Supporting this view, CDC25A‐deficient mouse embryonic stem cells, which have constitutively lower levels of CDK1 activity (Ruiz et al, 2016), were significantly resistant to USP7i‐induced cell death (Fig 6A). Moreover, chemical CDK1 inhibition or PP2A activation significantly reduced the percentage of apoptotic cells induced by USP7i in RPE cells, which was further reduced when both strategies were combined (Fig 6B). Importantly, CDK1 inhibition significantly reduced the toxicity of different USP7 inhibitors with unrelated chemical nature (Fig 6C). In summary, and regardless of the effect that USP7 inhibitors have on P53 levels, our data show that the toxicity of these compounds is due, at least in part, to a premature activation of CDK1.
Figure 6. USP7 inhibitors induce CDK1‐dependent cell death.
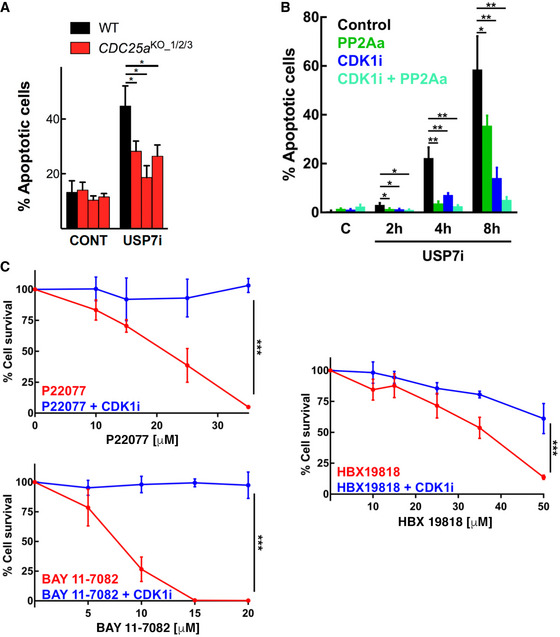
- Percentage of apoptotic cells in WT and CDC25a KO mESC after treatment with DMSO (CONT) and 25 μM P22077 (USP7i) for 16 h. This experiment was repeated four times using three different CDC25A clones (*P < 0.05; t‐test). Bars represent mean values ± SEM.
- Quantification of apoptotic induction was measured by flow cytometry in RPE cells after treatment with DMSO as a control, 25 μM P22077 (USP7i), 10 μM RO3306 (CDK1i), or 10 μM DT‐061 (PP2Aa), and their combinations for the indicated times. DNA content was followed with Hoechst, and the mitochondrial membrane potential was measured by TMRE. The percentage of apoptotic cells (TMRE negative) is indicated for each condition. This experiment was repeated three times (*P < 0.05 and **P < 0.01; t‐test). Bars represent mean values ± SEM.
- GLO viability assay in cells treated with three independent USP7 inhibitors (P22077, BAY 11‐7082, or HBX 19818) alone or in combination with a 24‐h treatment of 10 μM RO3306 (CDK1i). This experiment was repeated three times. Data represent mean values ± SEM (***P < 0.05; ANOVA).
Discussion
Classic cell fusion experiments from the 1970's already suggested that the presence of mitotic factors in interphase cells could promote the breakage of replicating DNA (Johnson & Rao, 1970). In fact, a long‐standing debate in the cell cycle field is whether a checkpoint exists that prevents mitotic entry before DNA replication is completed (Hartwell & Weinert, 1989; Enoch & Nurse, 1991; Elledge, 1996). Interestingly, recent works from the Lindqvist laboratory have revealed that the DNA replication machinery plays an active role in restricting the activation of mitotic kinases. First, the group revealed that the activation of mitotic kinases is coincident with the disappearance of PCNA foci (Akopyan et al, 2014). Later, the same group showed that the DNA replication machinery limits CDK1 activity and prevents CDK1‐dependent DNA damage (Lemmens et al, 2018). Additional work done in Xenopus extracts or human cells has further substantiated that premature CDK1 activation generates DNA damage by triggering the breakage of replication forks (preprint: Deng et al, 2019; Brison et al, 2020). In this regard, identifying mechanisms that limit CDK1 activity in interphase is relevant to understand genome maintenance. We here put forward USP7 as one of such brakes that restricts CDK1 activity throughout the cell cycle by controlling the action of the PP2A phosphatase. Noteworthy, previous work had also identified the mitotic E3 ubiquitin ligase CHFR as a USP7 target (Giovinazzi et al, 2013), which, together with the deregulation of PP2A activity identified here, could further contribute to the activation of mitotic kinases when USP7 is inhibited.
Beyond its relevance for our understanding of the cell cycle, our work has also important implications for the development of USP7 inhibitors as anticancer agents (Zhang & Sidhu, 2018). Based on early work that revealed that USP7 depletion stabilizes P53 through the degradation of MDM2 (Li et al, 2002; Li et al, 2004), it was proposed that USP7 inhibitors kill cells primarily through P53‐dependent apoptosis (Tavana & Gu, 2017). However, P53 deficiency is unable to rescue the viability of embryos lacking USP7 even when USP7 deletion was restricted to neural tissues (Kon et al, 2010; Kon et al, 2011). Several additional targets of USP7 such as N‐MYC (Tavana et al, 2018), retinoblastoma‐associated protein (Rb) (Bhattacharya & Ghosh, 2014), or various DNA replication factors (Jagannathan et al, 2014; Lecona et al, 2016; Hernandez‐Perez et al, 2017) have been identified and could contribute to the toxicity of USP7 inhibitors. We here reveal another mechanism that explains the toxicity of USP7 inhibitors by triggering a widespread activation of CDK1 throughout the cell cycle, which leads to DNA damage in replicating cells. The data presented should be incorporated into the rationale for using USP7 inhibitors in cancer. First, because it further indicates that p53‐deficient cancer cells will also respond to these compounds and, second, since it suggests that USP7 inhibitors will synergize with agents that promote CDK1 activity such as ATR, CHK1, or WEE1 inhibitors. In contrast, therapies that lower CDK activity (e.g., CDK inhibitors or PP2A activators) should reduce the efficacy of USP7 inhibitors. Interestingly, the genotoxic effects of USP7 inhibitors might be partly counteracted by their effects on P53, as this would reduce CDK activity by promoting the expression of P53‐targets such as P21. On the other hand, P21 has been shown to associate with and sequester inactive CCNB1‐CDK1 complexes in the nucleus, although this phenomenon is unlikely to explain the rapid translocation of CCNB1 that occurs upon USP7 inhibition (Charrier‐Savournin et al, 2004). To what extent compounds that preferentially target the role of USP7 in limiting CDK activity without affecting P53 levels can be developed emerges as an interesting possibility that could increase the efficacy of USP7 inhibitors. In summary, the work presented here identifies a new role for USP7 in the restriction of CDK1 activity throughout the cell cycle that is important for the preservation of genome stability and helps to clarify the mechanism of action of USP7 inhibitors as anticancer agents.
Materials and Methods
Cell lines
HCT‐116, U2OS, RPE, and NIH/3T3 cells (ATCC) were grown in DMEM with 10% FBS, penicillin (100 IU/ml), streptomycin (100 µg/ml), and glutamine (300 mg/ml). MEFs were grown in 15% FBS, penicillin (100 IU/ml), streptomycin (100 µg/ml), and glutamine (300 mg/ml). mESCs were grown on a feeder layer of inactivated MEF with DMEM (high glucose) supplemented with 15% knockout serum replacement (Invitrogen), LIF (1,000 U/ml), 0.1 mM non‐essential amino acids, 1% glutamax, and 55 μM β‐mercaptoethanol.
Treatments
USP7 inhibitors P22077 (Merck), BAY 11‐7082 (Santa Cruz), HBX 19818 (MedChemExpress), FT671 (Forma Therapeutics), and GNE‐6640 (Genentech, Inc.); CDK inhibitors RO3306 (Sigma), roscovitine (Selleckchem), and palbociclib (MedChemExpress); the PP2A activator DT‐061 (ProbeChem); and the phosphatase inhibitor calyculin A (Merck) were dissolved in DMSO. The PP2A inhibitor OA (Merck) was dissolved in water. Cells were incubated for the indicated times in the presence of the inhibitor or an equivalent amount of DMSO.
Cell viability assays
Cells were seeded at 7,000 cells per well in a 96‐well tissue culture plate and treated with the indicated concentrations of CDK1i and USP7i or left untreated. Twenty‐four hours after the last treatment, cell viability was measured using a luminescent system (CellTiter‐Glo, Promega), according to the manufacturer's protocols. Viability is plotted as percentage of viability compared to untreated control.
Protein extracts and cell fractionation
Whole cell extracts were prepared by lysing cells in 50 mM Tris, pH 7.5, 8 M urea, and 1% CHAPS. Nuclear extracts were prepared as described (Lecona et al, 2008). Cells were scraped in cold PBS and washed twice with PBS. Cells pellets were resuspended in ice‐cold hypotonic lysis buffer (10 mM HEPES, pH 7.9, 10 mM KCl, and 0.1 mM EDTA containing protease and phosphatase inhibitors) and incubated on ice for 10 min, and then, Nonidet P‐40 was added to a final concentration of 0.1%. After 3 min at room temperature, cells were vortexed and the cytosolic fraction was obtained by centrifugation at 2,500 g for 5 min. Nuclei were washed once in hypotonic lysis buffer and then extracted in 50 mM Tris, pH 7.5, 8 M urea, and 1% CHAPS, shaking at 4ºC for 30 min. Total nuclear fraction was obtained after centrifugation for 5 min at 16,000 g. Protein concentration was determined using the Bio‐Rad Protein Assay.
RNA interference
Transfection of HCT‐116 and RPE cells with control (Qiagen; Cat#1027281) or USP7, PP1AC, and PPP2R2A targeting siRNAs (USP7 siRNA #1 (Qiagen; Cat# SI00052283) and #2 (Qiagen; Cat# SI00052290), PP1AC siRNA (Dharmacon; Cat# L‐008927‐00‐0005), PPP2R2A (Dharmacon; Cat# L‐004824‐00‐0005)) was carried out using Lipofectamine RNAimax (Invitrogen) according to the manufacturer's instructions.
RNA extraction and RT–PCR
RNA was extracted from RPE cells using the Absolutely RNA Miniprep Kit (Agilent) according to the manufacturer's instructions. RT–PCR was carried out using the SuperScript® III Platinum® SYBR® Green One‐Step qRT‐PCR Kit (Thermo Fisher) in MicroAmp© Optical 384‐well plates (Applied Biosystems) in the QuantStudio™ 6 Flex Real‐Time PCR System (Thermo Fisher) using standard protocols. The sequences of the primers used are as follows: GAPDH‐F (TTCACCACCATGGAGAAGGC), GAPDH‐R (CCCTTTTGGCTCCACCCT), PP1AC‐F (CTGTGGCGAGTTTGACAATG), PP1AC‐R (CCACTGAACTGCCCGTACTT), PPP2R2A‐F (TGTTGTTGGAATGGATCTGA), and PPP2R2A‐R (TGCGAGGCTTATTGTTTTCC).
Flow cytometry
For the analysis of mitotic and DNA damage markers during the cell cycle, cells were trypsinized, washed with cold PBS once, and fixed in suspension by the addition of cold 70% ethanol. Cells were incubated for 30 min on ice and maintained at −20°C or processed immediately after fixation. Cells were centrifuged at 1,500 g for 5 min and then incubated with the specific antibodies in PBS/0.05% Tween‐20/3% BSA for 2 h at RT. Cells were washed in PBS/0.05% Tween‐20 and incubated with secondary antibodies in PBS/0.05% Tween‐20/3% BSA for 1 h at RT. Finally, cells were washed with PBS/0.05% Tween‐20 and resuspended in PBS containing 100 μg/ml RNase. DNA content was visualized incubating the cells with 100 μg/ml PI. For the analysis of apoptosis, cells were trypsinized, centrifuged, and resuspended at 106 cells/ml in cell culture medium containing 10 μg/ml Hoechst and 40 nM TMRE. Then, cells were incubated for 30 min at 37°C. All samples were analyzed in a BD LSRFortessa cell analyzer. The results were analyzed using the FlowJo software (FlowJo, LLC). All flow cytometry data shown in the manuscript are on a logarithmic scale.
High‐throughput microscopy
Cells were seeded on μClear® bottom 96‐well plates (Greiner Bio‐One) pre‐treated with 0.1% gelatin. After the indicated treatments, cells were fixed with 4% PFA in PBS at room temperature for 10 min and subsequently permeabilized with 0.1% Triton X‐100 in PBS at room temperature for 15 min. Following steps were performed using standard procedures. For analysis of DNA replication by 5‐ethynyl‐2′‐deoxyuridine (EdU) incorporation, cells were treated with 10 µM EdU for 30 min. After fixation and permeabilization, EdU staining was done using Click‐iT EdU Cell Proliferation Assay Kit (Invitrogen) following the manufacturer's instructions to stain the incorporated nucleoside. In all cases, images were automatically acquired from each well using an Opera High‐Content Screening System (HCS OPERA, PerkinElmer). A 20× or 40× water magnification lens were used, and images were taken at non‐saturating conditions. Images were segmented using DAPI signals to generate masks matching cell nuclei from which the mean signals for the rest of the staining were calculated.
Immunofluorescence
For immunofluorescence, cells were seeded on plates pre‐treated with 0.1% gelatin. Cells were fixed with 4% paraformaldehyde (PFA) in PBS for 10 min at room temperature and then permeabilized with 0.5% Triton X‐100 for 15 min. Following steps were performed using standard procedures. Images were taken at non‐saturating conditions with 20×–40× magnification lenses.
Immunoprecipitation
RPE cells were lysed with a high‐salt‐concentration extraction buffer (20 mM HEPES, pH 7.9, 0.6 M NaCl, and 1 mM EDTA containing protease and phosphatase inhibitors). Whole nuclear cell extracts were diluted in 25 mM Tris/pH 7.8/0.5 mM EDTA/200 mM NaCl and then incubated in Protein G Dynabeads (Invitrogen) with the antibodies, o.n., at 4°C. The beads were washed with 25 mM Tris/pH 7.8/0.5 mM EDTA/200 mM NaCl/0.5% Nonidet P‐40 and eluted with loading buffer.
Phosphatase assays
RPE cells were lysed with RIPA (150 mM NaCl, 25 mM Tris–Hcl, 1 mM EDTA, 0.5 mM EGTA, 1% Triton X‐100, and 0.1% SDS and protease inhibitors), and 100 mg of protein was used for each condition. PP2A Immunoprecipitation Phosphatase Assay Kit (Merck) was used for determining phosphatase activity following manufactured instructions. The dephosphorylation of a KRpTIRR peptide activity was measured by absorbance of Malachite green.
Mass spectrometry
Digestion
Cells were lysed during 10 min at 95°C in 5% SDS and 50 mM TEAB pH 7.55. After cooling, DNA was sheared by 10 min of sonication. Protein concentration was determined by micro BCA using BSA as standard. Then, 200 µg of each samples were digested by means of the ProtiFi™ S‐Trap™ Mini Spin Column Digestion Protocol. Briefly, proteins were reduced and alkylated (15 mM TCEP, 30 mM CAA) 1 h at 45°C in the dark. SDS was removed from samples in the S‐Trap column using 90% methanol in 100 mM TEAB and proteins were digested with 125 µl of trypsin in 50 mM TEAB pH 7.55 (promega, protein:enzyme ratio 1:100, 1 h at 47°C). Resulting peptides were eluted from S‐Trap columns and speed‐vac dried.
TMT labeling
Samples (200 µg) were labeled using TMT® reagent 11‐plex following the manufacturer's instructions. Labeling scheme was as follows: Control BioRep1 (126), Control BioRep2 (127N), Control BioRep3 (127C), USP7i 2 h treatment BioRep1 (128N), USP7i 2 h treatment BioRep2 (128C), USP7i 2 h treatment BioRep3 (129N), USP7i 4 h treatment BioRep1 (129C), USP7i 4 h treatment BioRep2 (130N), PP2Ai 2 h treatment BioRep1 (130C), PP2Ai 2 h treatment BioRep2 (131), and PP2Ai 2 h treatment BioRep3 (131C). Samples were mixed in 1:1 ratios based on total peptide amount, which was determined from an aliquot by comparing overall signal intensities on a regular LC‐MS/MS run. The final mixture was finally desalted using a Sep‐Pak C18 cartridge (Waters) and dried prior high pH reverse phase HPLC pre‐fractionation.
High pH reverse phase chromatography
Peptides were pre‐fractionated offline by means of high pH reverse phase chromatography using an Ultimate 3000 HPLC system equipped with a sample collector. Briefly, peptides were dissolved in 100 µl of phase A (10 mM NH4OH) and loaded onto a XBridge BEH130 C18 column (3.5 µm, 2.1 mm × 150 mm) (Waters). Phase B was 10 mM NH4OH in 90% CH3CN. The following gradient (flow rate of 200 µl/min) was used: 5–55 min 3–45% B and 55–65 min 45–65% B. Sixty fractions were collected and concatenated into eight fractions.
Phosphopeptide enrichment
Phosphopeptides were enriched using home‐made TiO2 micro‐columns. Briefly, peptides were resuspended in 6% TFA and 80% CH3CN and incubated for 20 min with TiO2 beads (10 µm particle size; GL‐Science) using a sample:TiO2 ratio of 1:2. Prior to incubation, TiO2 beads were pre‐condition with a solution of 20 mg/ml DHB in 80% CH3CN 6% TFA for 20 min. Then, beads were sequentially washed with 100 µl of 6% TFA and 10% CH3CN, 100 µl of 6% TFA and 100 µl of 40% CH3CN and 6% TFA and 60% CH3CN. Finally, phosphopeptides were eluted first with 20 µl of 5% NH4OH and then with 20 µl 5% NH4OH in 10% CH3CN in the same vial.
LC‐MS/MS
LC‐MS/MS was done by coupling an UltiMate 3000 RSLCnano LC system to a Q Exactive Plus mass spectrometer (Thermo Fisher Scientific). Peptides were loaded into a trap column (Acclaim™ PepMap™ 100 C18 LC Columns 5 µm, 20 mm length) for 3 min at a flow rate of 10 µl/min in 0.1% FA. Then, peptides were transferred to an EASY‐Spray PepMap RSLC C18 column (Thermo) (2 µm, 75 µm × 50 cm) operated at 45°C and separated using a 60 min effective gradient (buffer A: 0.1% FA; buffer B: 100% ACN, 0.1% FA) at a flow rate of 250 nl/min. The gradient used was from 2 to 6% of buffer B in 2 min, from 6 to 33% B in 58 min, and from 33 to 45% in 2 min, plus 10 additional minutes at 98% B. Peptides were sprayed at 1.8 kV into the mass spectrometer via the EASY‐Spray source, and the capillary temperature was set to 300°C. The mass spectrometer was operated in a data‐dependent mode, with an automatic switch between MS and MS/MS scans using a top 15 method. (intensity threshold ≥ 3.3e4, dynamic exclusion of 25 s and excluding charges unassigned, +1 and ≥ +6). MS spectra were acquired from 350 to 1,500 m/z with a resolution of 70,000 (200 m/z). Ion peptides were isolated using a 1.4 Th window and fragmented using higher‐energy collisional dissociation (HCD) with a normalized collision energy of 33. MS/MS spectra were acquired with a fixed first mass of 100 m/z and a resolution of 35,000 (200 m/z). The ion target values were 3e6 for MS (maximum IT of 25 ms) and 1e5 for MS/MS (maximum IT of 90 ms).
Data analysis
Raw files were processed with MaxQuant (v 1.5.0.2) using the standard settings against a human protein database (UniProtKB/Swiss‐Prot, 20,373 sequences) supplemented with contaminants. Reporter ion MS2‐based quantification was enabled for TMT 11‐plex. Carbamidomethylation of cysteines was set as a fixed modification, whereas oxidation of methionines, protein N‐term acetylation, and phosphorylation of serines, threonines, and tyrosines as variable modifications. Minimal peptide length was set to seven amino acids, and a maximum of two tryptic missed cleavages were allowed. Results were filtered at 1% FDR (peptide and protein level). Afterward, the “Phospho (STY)Sites.txt” file was loaded in Prostar (Wieczorek et al, 2017) using the reporter intensity values for further statistical analysis. Differential analysis was done using the empirical Bayes statistics Limma. Sites with a P‐value < 0.05 and a log2 ratio > 0.3 or < −0.3 were defined as regulated. The FDR was estimated to be below 5%. Phosphorylation networks arising from proteomic experiments were analyzed with Reactome (Fabregat et al, 2017).
Antibodies
The following antibodies were used in this study: H3S10P (Merck Millipore, 06‐570), H3 (Abcam, ab10799), MPM‐2 (Merck Millipore, 05‐368), USP7 (Bethyl, A300‐033A; Santa Cruz, sc‐137001), β‐Actin (Sigma Aldrich, A5441), CDK1‐Y15P (Santa Cruz, sc‐7989), CDK1 (Merck Millipore, 06‐923), CCNB1 (Santa Cruz, sc‐245), CCNB1‐S126P (Abcam, ab55184), AKT‐S473P (Cell Signaling, 9271S), AKT (Cell Signaling, 9272), PRC1‐T481P (Abcam, ab62366), KAP‐S824P (Bethyl, A300‐767A), KAP (BD Transduction Laboratories, 610680), MAPKAPK‐2‐T433P (Cell Signaling, 3007S), 4e‐BP1‐S65P (Cell Signaling, 9451), 4e‐BP1 (Cell Signaling, 9644), STAT3‐S727P (Cell Signaling, 9134), STAT3 (BD Transduction Laboratories, 610189), PP2A‐A (Cell Signaling, 2041), PP2A‐B (Santa Cruz, sc‐81606), PP2A‐C (Abcam, ab32141; Merck Millipore, 05‐421), γH2AX (Merck Millipore, 05‐636; Cell Signaling, 9718), Phospho‐CDK Substrate Motif [(K/H)pSP] (Cell Signaling, 9477), goat anti‐rabbit IgG (H + L)‐HRP (Thermo Fisher, 31460), goat anti‐mouse IgG (H + L)‐HRP (Thermo Fisher, 31430), Alexa Fluor 488 anti‐mouse (Thermo Fisher, A11001), Alexa Fluor 488 anti‐rabbit (Thermo Fisher, A21441), Alexa Fluor 594 anti‐mouse (Thermo Fisher, A11005), and Alexa Fluor 647 anti‐rabbit (Thermo Fisher, A21443).
Data analysis
Data were represented with the use of the Prism software (GraphPad Software). The statistical analysis was also carried out with Prism, using the specified statistical comparison where indicated in the figure legends.
Author contributions
AG and EL designed and participated in most of the experiments of this study. PV and PU‐C helped with experiments from Fig 1. VL helped with immunofluorescence analyses. EZ and JM carried out the proteomics experiments and their initial analysis. MM contributed to phosphoproteomic analyses. OF‐C and EL coordinated the study and wrote the MS.
Conflict of interest
The authors declare that they have no conflict of interest.
Supporting information
Expanded View Figures PDF
Review Process File
Acknowledgements
The authors want to thank Javier Muñoz and Eduardo Zarzuela from the Proteomics Facility at CNIO for their help with phosphoproteomic experiments. Research was funded by grants from the Spanish Ministry of Science, Innovation and Universities (RTI2018‐102204‐B‐I00, co‐financed with European FEDER funds) and the European Research Council (ERC‐617840) to OF; a grant from the Spanish Ministry of Science, Innovation and Universities (RTI2018‐095582‐B‐I00, co‐financed with European FEDER funds) to MM; a grant from MINECO (BFU2014‐55168‐JIN) that is co‐funded by European Regional Development Funds (FEDER) to EL; and a PhD fellowship from MINECO to AG (BES‐2015‐075758). The authors declare no competing financial interests.
The EMBO Journal (2021) 40: e99692.
See also: M Chow‐Castro et al (2021)
Contributor Information
Emilio Lecona, Email: elecona@cbm.csic.es.
Oscar Fernandez‐Capetillo, Email: ofernandez@cnio.es.
Data availability
Mass spectrometry proteomics data associated with this work have been deposited to the ProteomeXchange Consortium via the PRIDE (Vizcaino et al, 2016) partner repository (https://www.ebi.ac.uk/pride) with the dataset identifier PXD016623.
References
- Aarts M, Sharpe R, Garcia‐Murillas I, Gevensleben H, Hurd MS, Shumway SD, Toniatti C, Ashworth A, Turner NC (2012) Forced mitotic entry of S‐phase cells as a therapeutic strategy induced by inhibition of WEE1. Cancer Discov 2: 524–539 [DOI] [PubMed] [Google Scholar]
- Ajiro K, Yoda K, Utsumi K, Nishikawa Y (1996) Alteration of cell cycle‐dependent histone phosphorylations by okadaic acid. Induction of mitosis‐specific H3 phosphorylation and chromatin condensation in mammalian interphase cells. J Biol Chem 271: 13197–13201 [DOI] [PubMed] [Google Scholar]
- Akopyan K, Silva Cascales H, Hukasova E, Saurin AT, Mullers E, Jaiswal H, Hollman DA, Kops GJ, Medema RH, Lindqvist A (2014) Assessing kinetics from fixed cells reveals activation of the mitotic entry network at the S/G2 transition. Mol Cell 53: 843–853 [DOI] [PubMed] [Google Scholar]
- Alvarez‐Fernandez M, Malumbres M (2014) Preparing a cell for nuclear envelope breakdown: spatio‐temporal control of phosphorylation during mitotic entry. BioEssays 36: 757–765 [DOI] [PubMed] [Google Scholar]
- Amanchy R, Periaswamy B, Mathivanan S, Reddy R, Tattikota SG, Pandey A (2007) A curated compendium of phosphorylation motifs. Nat Biotechnol 25: 285–286 [DOI] [PubMed] [Google Scholar]
- Bhattacharya S, Ghosh MK (2014) HAUSP, a novel deubiquitinase for Rb ‐ MDM2 the critical regulator. FEBS J 281: 3061–3078 [DOI] [PMC free article] [PubMed] [Google Scholar]
- Brison O, Gnan S, Azar D, Schmidt M, Koundrioukoff S, El‐Hilali S, Jaszczyszyn Y, Lachages A‐M, Thermes C, Chen C‐L et al (2020) Unscheduled origin building in S‐phase upon tight CDK1 inhibition suppresses CFS instability. bioRxiv 10.1101/2020.11.19.390054 [PREPRINT] [DOI] [Google Scholar]
- Charrier‐Savournin FB, Chateau MT, Gire V, Sedivy J, Piette J, Dulic V (2004) p21‐Mediated nuclear retention of cyclin B1‐Cdk1 in response to genotoxic stress. Mol Biol Cell 15: 3965–3976 [DOI] [PMC free article] [PubMed] [Google Scholar]
- Cicenas J, Kalyan K, Sorokinas A, Stankunas E, Levy J, Meskinyte I, Stankevicius V, Kaupinis A, Valius M (2015) Roscovitine in cancer and other diseases. Ann Transl Med 3: 135 [DOI] [PMC free article] [PubMed] [Google Scholar]
- Davis FM, Tsao TY, Fowler SK, Rao PN (1983) Monoclonal antibodies to mitotic cells. Proc Natl Acad Sci USA 80: 2926–2930 [DOI] [PMC free article] [PubMed] [Google Scholar]
- Deng L, Wu RA, Sonneville R, Kochenova OV, Labib K, Pellman D, Walter JC (2019) Mitotic CDK promotes replisome disassembly, fork breakage, and complex DNA rearrangements. Mol Cell 73: 915–929.e6 [DOI] [PMC free article] [PubMed] [Google Scholar]
- Duda H, Arter M, Gloggnitzer J, Teloni F, Wild P, Blanco MG, Altmeyer M, Matos J (2016) A mechanism for controlled breakage of under‐replicated chromosomes during mitosis. Dev Cell 39: 740–755 [DOI] [PubMed] [Google Scholar]
- Elledge SJ (1996) Cell cycle checkpoints: preventing an identity crisis. Science 274: 1664–1672 [DOI] [PubMed] [Google Scholar]
- Enoch T, Nurse P (1991) Coupling M phase and S phase: controls maintaining the dependence of mitosis on chromosome replication. Cell 65: 921–923 [DOI] [PubMed] [Google Scholar]
- Fabregat A, Sidiropoulos K, Viteri G, Forner O, Marin‐Garcia P, Arnau V, D'Eustachio P, Stein L, Hermjakob H (2017) Reactome pathway analysis: a high‐performance in‐memory approach. BMC Bioinformatics 18: 142 [DOI] [PMC free article] [PubMed] [Google Scholar]
- Giovinazzi S, Morozov VM, Summers MK, Reinhold WC, Ishov AM (2013) USP7 and Daxx regulate mitosis progression and taxane sensitivity by affecting stability of Aurora‐A kinase. Cell Death Differ 20: 721–731 [DOI] [PMC free article] [PubMed] [Google Scholar]
- Hartwell LH, Weinert TA (1989) Checkpoints: controls that ensure the order of cell cycle events. Science 246: 629–634 [DOI] [PubMed] [Google Scholar]
- Hernandez‐Perez S, Cabrera E, Salido E, Lim M, Reid L, Lakhani SR, Khanna KK, Saunus JM, Freire R (2017) DUB3 and USP7 de‐ubiquitinating enzymes control replication inhibitor Geminin: molecular characterization and associations with breast cancer. Oncogene 36: 4802–4809 [DOI] [PubMed] [Google Scholar]
- Hsu JY, Sun ZW, Li X, Reuben M, Tatchell K, Bishop DK, Grushcow JM, Brame CJ, Caldwell JA, Hunt DF et al (2000) Mitotic phosphorylation of histone H3 is governed by Ipl1/aurora kinase and Glc7/PP1 phosphatase in budding yeast and nematodes. Cell 102: 279–291 [DOI] [PubMed] [Google Scholar]
- Hunt T (2013) On the regulation of protein phosphatase 2A and its role in controlling entry into and exit from mitosis. Adv Biol Regul 53: 173–178 [DOI] [PubMed] [Google Scholar]
- Jagannathan M, Nguyen T, Gallo D, Luthra N, Brown GW, Saridakis V, Frappier L (2014) A role for USP7 in DNA replication. Mol Cell Biol 34: 132–145 [DOI] [PMC free article] [PubMed] [Google Scholar]
- Johnson RT, Rao PN (1970) Mammalian cell fusion: induction of premature chromosome condensation in interphase nuclei. Nature 226: 717–722 [DOI] [PubMed] [Google Scholar]
- Kon N, Kobayashi Y, Li M, Brooks CL, Ludwig T, Gu W (2010) Inactivation of HAUSP in vivo modulates p53 function. Oncogene 29: 1270–1279 [DOI] [PMC free article] [PubMed] [Google Scholar]
- Kon N, Zhong J, Kobayashi Y, Li M, Szabolcs M, Ludwig T, Canoll PD, Gu W (2011) Roles of HAUSP‐mediated p53 regulation in central nervous system development. Cell Death Differ 18: 1366–1375 [DOI] [PMC free article] [PubMed] [Google Scholar]
- Lecona E, Barrasa JI, Olmo N, Llorente B, Turnay J, Lizarbe MA (2008) Upregulation of annexin A1 expression by butyrate in human colon adenocarcinoma cells: role of p53, NF‐Y, and p38 mitogen‐activated protein kinase. Mol Cell Biol 28: 4665–4674 [DOI] [PMC free article] [PubMed] [Google Scholar]
- Lecona E, Rodriguez‐Acebes S, Specks J, Lopez‐Contreras AJ, Ruppen I, Murga M, Munoz J, Mendez J, Fernandez‐Capetillo O (2016) USP7 is a SUMO deubiquitinase essential for DNA replication. Nat Struct Mol Biol 23: 270–277 [DOI] [PMC free article] [PubMed] [Google Scholar]
- Lemmens B, Hegarat N, Akopyan K, Sala‐Gaston J, Bartek J, Hochegger H, Lindqvist A (2018) DNA replication determines timing of mitosis by restricting CDK1 and PLK1 activation. Mol Cell 71: 117–128.e3 [DOI] [PMC free article] [PubMed] [Google Scholar]
- Li J, Meyer AN, Donoghue DJ (1997) Nuclear localization of cyclin B1 mediates its biological activity and is regulated by phosphorylation. Proc Natl Acad Sci USA 94: 502–507 [DOI] [PMC free article] [PubMed] [Google Scholar]
- Li M, Chen D, Shiloh A, Luo J, Nikolaev AY, Qin J, Gu W (2002) Deubiquitination of p53 by HAUSP is an important pathway for p53 stabilization. Nature 416: 648–653 [DOI] [PubMed] [Google Scholar]
- Li M, Brooks CL, Kon N, Gu W (2004) A dynamic role of HAUSP in the p53‐Mdm2 pathway. Mol Cell 13: 879–886 [DOI] [PubMed] [Google Scholar]
- Li F, Kozono D, Deraska P, Branigan T, Dunn C, Zheng XF, Parmar K, Nguyen H, DeCaprio J, Shapiro GI et al (2020) CHK1 inhibitor blocks phosphorylation of FAM122A and promotes replication stress. Mol Cell 80: 410–422.e6 [DOI] [PMC free article] [PubMed] [Google Scholar]
- Mayor‐Ruiz C, Dominguez O, Fernandez‐Capetillo O (2017) Trap(Seq): an RNA sequencing‐based pipeline for the identification of gene‐trap insertions in mammalian cells. J Mol Biol 429: 2780–2789 [DOI] [PMC free article] [PubMed] [Google Scholar]
- Mochida S, Ikeo S, Gannon J, Hunt T (2009) Regulated activity of PP2A‐B55 delta is crucial for controlling entry into and exit from mitosis in Xenopus egg extracts. EMBO J 28: 2777–2785 [DOI] [PMC free article] [PubMed] [Google Scholar]
- Morgan DO (2007) The cell cycle, principles of control. New Science Press, London, UK [Google Scholar]
- Rhind N, Russell P (2012) Signaling pathways that regulate cell division. Cold Spring Harb Perspect Biol 4: a005942 [DOI] [PMC free article] [PubMed] [Google Scholar]
- Ruiz S, Mayor‐Ruiz C, Lafarga V, Murga M, Vega‐Sendino M, Ortega S, Fernandez‐Capetillo O (2016) A genome‐wide CRISPR screen identifies CDC25A as a determinant of sensitivity to ATR inhibitors. Mol Cell 62: 307–313 [DOI] [PMC free article] [PubMed] [Google Scholar]
- Russell P, Nurse P (1987) Negative regulation of mitosis by wee1+, a gene encoding a protein kinase homolog. Cell 49: 559–567 [DOI] [PubMed] [Google Scholar]
- Sangodkar J, Perl A, Tohme R, Kiselar J, Kastrinsky DB, Zaware N, Izadmehr S, Mazhar S, Wiredja DD, O’Connor CM et al (2017) Activation of tumor suppressor protein PP2A inhibits KRAS‐driven tumor growth. J Clin Invest 127: 2081–2090 [DOI] [PMC free article] [PubMed] [Google Scholar]
- Santamaria D, Barriere C, Cerqueira A, Hunt S, Tardy C, Newton K, Caceres JF, Dubus P, Malumbres M, Barbacid M (2007) Cdk1 is sufficient to drive the mammalian cell cycle. Nature 448: 811–815 [DOI] [PubMed] [Google Scholar]
- Schmitz MH, Held M, Janssens V, Hutchins JR, Hudecz O, Ivanova E, Goris J, Trinkle‐Mulcahy L, Lamond AI, Poser I et al (2010) Live‐cell imaging RNAi screen identifies PP2A‐B55alpha and importin‐beta1 as key mitotic exit regulators in human cells. Nat Cell Biol 12: 886–893 [DOI] [PMC free article] [PubMed] [Google Scholar]
- Szmyd R, Niska‐Blakie J, Diril MK, Renck Nunes P, Tzelepis K, Lacroix A, van Hul N, Deng LW, Matos J, Dreesen O et al (2019) Premature activation of Cdk1 leads to mitotic events in S phase and embryonic lethality. Oncogene 38: 998–1018 [DOI] [PMC free article] [PubMed] [Google Scholar]
- Tavana O, Gu W (2017) Modulation of the p53/MDM2 interplay by HAUSP inhibitors. J Mol Cell Biol 9: 45–52 [DOI] [PMC free article] [PubMed] [Google Scholar]
- Tavana O, Sun H, Gu W (2018) Targeting HAUSP in both p53 wildtype and p53‐mutant tumors. Cell Cycle 17: 823–828 [DOI] [PMC free article] [PubMed] [Google Scholar]
- Toogood PL, Harvey PJ, Repine JT, Sheehan DJ, VanderWel SN, Zhou H, Keller PR, McNamara DJ, Sherry D, Zhu T et al (2005) Discovery of a potent and selective inhibitor of cyclin‐dependent kinase 4/6. J Med Chem 48: 2388–2406 [DOI] [PubMed] [Google Scholar]
- Turnbull AP, Ioannidis S, Krajewski WW, Pinto‐Fernandez A, Heride C, Martin ACL, Tonkin LM, Townsend EC, Buker SM, Lancia DR et al (2017) Molecular basis of USP7 inhibition by selective small‐molecule inhibitors. Nature 550: 481–486 [DOI] [PMC free article] [PubMed] [Google Scholar]
- Vassilev LT, Tovar C, Chen S, Knezevic D, Zhao X, Sun H, Heimbrook DC, Chen L (2006) Selective small‐molecule inhibitor reveals critical mitotic functions of human CDK1. Proc Natl Acad Sci USA 103: 10660–10665 [DOI] [PMC free article] [PubMed] [Google Scholar]
- Vizcaino JA, Csordas A, Del‐Toro N, Dianes JA, Griss J, Lavidas I, Mayer G, Perez‐Riverol Y, Reisinger F, Ternent T et al (2016) 2016 update of the PRIDE database and its related tools. Nucleic Acids Res 44: 11033 [DOI] [PMC free article] [PubMed] [Google Scholar]
- Wei Y, Yu L, Bowen J, Gorovsky MA, Allis CD (1999) Phosphorylation of histone H3 is required for proper chromosome condensation and segregation. Cell 97: 99–109 [DOI] [PubMed] [Google Scholar]
- Wieczorek S, Combes F, Lazar C, Giai Gianetto Q, Gatto L, Dorffer A, Hesse AM, Coute Y, Ferro M, Bruley C et al (2017) DAPAR & ProStaR: software to perform statistical analyses in quantitative discovery proteomics. Bioinformatics 33: 135–136 [DOI] [PMC free article] [PubMed] [Google Scholar]
- Zhang W, Sidhu SS (2018) Drug development: allosteric inhibitors hit USP7 hard. Nat Chem Biol 14: 110–111 [DOI] [PubMed] [Google Scholar]
Associated Data
This section collects any data citations, data availability statements, or supplementary materials included in this article.
Supplementary Materials
Expanded View Figures PDF
Review Process File
Data Availability Statement
Mass spectrometry proteomics data associated with this work have been deposited to the ProteomeXchange Consortium via the PRIDE (Vizcaino et al, 2016) partner repository (https://www.ebi.ac.uk/pride) with the dataset identifier PXD016623.


