

Abstract
To examine global changes in breast heterogeneity across different states, we determined the single‐cell transcriptomes of > 340,000 cells encompassing normal breast, preneoplastic BRCA1 +/– tissue, the major breast cancer subtypes, and pairs of tumors and involved lymph nodes. Elucidation of the normal breast microenvironment revealed striking changes in the stroma of post‐menopausal women. Single‐cell profiling of 34 treatment‐naive primary tumors, including estrogen receptor (ER)+, HER2+, and triple‐negative breast cancers, revealed comparable diversity among cancer cells and a discrete subset of cycling cells. The transcriptomes of preneoplastic BRCA1 +/– tissue versus tumors highlighted global changes in the immune microenvironment. Within the tumor immune landscape, proliferative CD8+ T cells characterized triple‐negative and HER2+ cancers but not ER+ tumors, while all subtypes comprised cycling tumor‐associated macrophages, thus invoking potentially different immunotherapy targets. Copy number analysis of paired ER+ tumors and lymph nodes indicated seeding by genetically distinct clones or mass migration of primary tumor cells into axillary lymph nodes. This large‐scale integration of patient samples provides a high‐resolution map of cell diversity in normal and cancerous human breast.
Keywords: BRCA1 carriers, breast cancer, LN metastasis, microenvironment, single‐cell RNA‐seq
Subject Categories: Cancer, Immunology, Methods & Resources
A large‐scale gene expression resource integrates diverse tissue samples and reveals unexpected heterogeneity of breast cancer subtypes.

Introduction
The incidence of breast cancer is influenced by multiple factors that include age, genetics, and reproductive history. An understanding of normal tissue biology and its inherent heterogeneity is an important step toward dissecting mechanisms that lead to oncogenesis. Normal breast tissue comprises a complex epithelial ductal system embedded in a stromal matrix that is composed of fibroblasts, adipocytes, endothelial, and immune cells. In human breast, puberty‐induced branching results in a complex branched ductal system in which the ducts terminate in a cluster of acini termed a terminal duct lobular unit (TDLU) (Fu et al, 2020). The dynamic changes occurring in the breast epithelium during puberty, pregnancy, and lactation are driven by the concerted action of systemic hormones and growth factors, among which the ovarian hormones estrogen and progesterone play a key role (Brisken & O'Malley, 2010). Over the lifetime of a woman, sustained exposure to ovarian steroid hormones is a well‐established risk factor for breast cancer, with a clear correlation between the number of menstrual cycles and breast cancer risk (Clemons & Goss, 2001; Hankinson et al, 2004). Indeed, early ovarian ablation is protective against breast cancer (Parker et al, 2009a).
Breast cancer comprises a diverse set of diseases characterized by heterogeneity that influences treatment response and patient outcome. This heterogeneity cannot be precisely defined through the classic parameters of histopathology, tumor grade, and nodal involvement. Expression profiling has proven pivotal in defining the intrinsic subtypes of breast cancer: luminal A and luminal B, triple‐negative (often used interchangeably with basal‐like), HER2‐overexpressing, and claudin‐low (Perou et al, 2000; Sorlie et al, 2001). These likely reflect distinct “cells of origin”, unique differentiation blockades, and different repertoires of mutations. More recent genome sequencing efforts have defined recurrent “driver” genes and copy number changes among the different breast tumor subtypes (Cancer Genome Atlas, 2012; Alexandrov et al, 2013; Nik‐Zainal et al, 2016). The advent of single‐cell technologies has enabled an understanding of cellular heterogeneity at an unprecedented level. This is particularly relevant to tumors, which exist as ecosystems composed of malignant cells interspersed with stromal and immune cells. Emerging data from single‐cell genomics indicate significant tumor heterogeneity, while single‐cell transcriptomic profiling of breast tumors indicates diverse immune cell populations (Chung et al, 2017; Azizi et al, 2018; Karaayvaz et al, 2018; Kim et al, 2018; Savas et al, 2018; Qian et al, 2020). In addition, recent evaluation of the proteomes of a large number of tumors for up to 70 proteins (Wagner et al, 2019) yielded insights into the immune compartments of tumors and potential cellular cross‐talk. Cellular diversity among the different breast cancer subtypes, however, has not been evaluated systematically. In the context of normal breast tissue, single‐cell profiling of epithelial cells has confirmed the presence of three primary epithelial populations and predicted cell trajectories (Nguyen et al, 2018) but the normal milieu of the ductal network awaits further investigation.
Here we sought to further probe cellular heterogeneity within normal and neoplastic breast tissue (and involved LNs) through single‐cell transcriptome analysis. We posed the following questions: What is the complexity within the normal breast ductal microenvironment and does hormonal or BRCA1 mutation status influence molecular diversity? What is the degree of heterogeneity within the cancer cell compartment and its microenvironment across tumor subtypes? What is the relationship between primary breast tumors and malignant cells that seed lymph nodes? Single‐cell profiling was performed on tissue specimens from normal or preneoplastic BRCA1 +/− tissue (28 specimens), and tumors (34 specimens) representing estrogen receptor (ER)+, HER2+, and triple‐negative (TNBC) breast cancers, including male tumors and seven matched pairs of ER+ tumors and involved lymph nodes. Not surprisingly, extensive changes in the immune/stromal landscape were found between the preneoplastic versus neoplastic states in BRCA1 mutation carriers. While all tumor subtypes exhibited intra‐tumoral heterogeneity, distinct changes occurred within the microenvironment of different cancer subtypes. Moreover, we observed either clonal migration of genomically distinct ER+ breast cancer cells into the axillary lymph nodes or mass migration of tumor cells. Together, this large‐scale integration of patient samples encompassing the transcriptomes of > 340,000 cells provides a framework for deciphering the clinical relevance of heterogeneity within normal tissue and breast tumors.
Results
Large‐scale integration of scRNA‐seq profiles from multiple patients maps cell diversity in tumors and normal breast tissue at high resolution
We used the droplet‐based 10x Genomics Chromium platform to create single‐cell RNA‐seq (scRNA‐seq) libraries for 69 distinct surgical tissue specimens from 55 patients, yielding expression profiles for nearly 430,000 individual cells (Fig 1A, Tables EV1–EV4). After quality filtering to ensure cells with good gene coverage, a consistent range of read counts and low numbers of mitochondrial reads, nearly 342,000 cells, remained for subsequent analysis. The number of genes detected in each specimen varied from 13,000 to 20,000 with a median of 17,711 (Fig EV1A, Table EV4). Our downstream analyses proceeded from normal and preneoplastic mammary tissue to characterization of tumor subtypes, including matched infiltrated lymph nodes. For each tissue type, we used recently developed integration methods implemented in the Seurat 3 toolkit (Butler et al, 2018) to align the single‐cell profiles from different patients and to identify shared cell populations. These integrated analyses allowed us to characterize cellular diversity with high resolution and precision. Where possible, we also sought to display patient‐to‐patient variation in expression profiles for the cell populations identified, using a pseudo‐bulk approach to contrast the expression profiles for each population between conditions. This in silico approach mimics bulk RNA‐seq for the cell populations, allowing us to assess cell population markers and expression signatures relative to the biological variation between individual patients or individual tumors (McCarthy et al, 2012).
Figure 1. Workflow for the breast atlas and scRNA‐seq profiling of normal breast epithelium.

- Schematic diagram showing workflow for scRNA‐seq of human specimens: normal and preneoplastic breast tissue, breast tumors (TNBC, ER+, HER2+, male breast tumors), and matching pairs of tumor and lymph node (LN) samples.
- Flow cytometry based on CD49f and EpCAM staining separates lineage‐negative breast tissue cells into stromal (CD49f–EpCAM–) and epithelial cells, which includes basal (CD49f+EpCAMlo/–), luminal progenitor (LP) (CD49f+EpCAM+), and mature luminal (ML) (CD49f–EpCAM+) cells.
- t‐SNE plot of the integrated scRNA‐seq profiles of epithelial cells from 11 reduction mammoplasties. Cell colors correspond to tissue specimens.
- Same t‐SNE plot as (C) but separated by hormonal status of the donor (8 premenopausal and 3 post‐menopausal).
- Same t‐SNE plot as (C) but colored by cell clusters (with Seurat cluster resolution set to 0.015).
- Ternary plot positioning each cell according to the proportion of basal, LP, or ML signature genes expressed by that cell. The three vertices of the plot correspond to cells expressing basal genes only, LP genes only, or ML genes only. Cells expressing equal numbers of basal, LP, and ML genes are in the center of the plot. The plot shows the same cells and cell colors as for (E), thus identifying green as basal, blue as LP, and orange as ML populations, respectively.
- Diffusion map of the epithelial cells.
- t‐SNE plot as in (E) colored by the expression level of a selection of basal, LP, and ML marker genes. Red=high expression, gray=not‐detected.
- The basal cell cluster shows a “tail” of atypical cells (highlighted in pink). These tail cells are in the center of the diffusion plot, downstream of the other basal cells in pseudo‐time and intermediate between the basal and two luminal lineages.
Figure EV1. scRNA‐seq coverage and transcriptional profiling of normal breast epithelium.

- Scatterplot showing the number of cells and the number of genes expressed after quality checking and filtering for each of the 79 samples and 10x runs listed in Table EV4.
- Flow cytometric analysis of pre‐ and post‐menopausal tissue using CD49f and EpCAM to fractionate lineage‐negative breast cells into epithelial and stromal cells. Cell clusters corresponding to stromal, basal, LP, and ML cell populations were visible for each tissue specimen, but the percentage of cells in each population varied between samples (pre‐ vs post‐menopausal).
- t‐SNE plot of the integrated scRNA‐seq profiles of epithelial cells from 11 reduction mammoplasties colored by tissue specimen (left) or by cell cluster (right, with Seurat cluster resolution set to 0.015). Cluster 4 (red) corresponds to stromal cells.
- Box plots of lineage‐specific expression signatures by epithelial cell cluster. Each epithelial cell was interrogated with the expression signatures for the human basal, LP, ML, and stromal cell types. Each panel shows the same cells and cell colors as in Fig 1E. Labels 1–4 correspond to clusters in Fig 1E. The four panels show basal, LP, ML, and stromal expression signatures, respectively. Vertical axis shows average expression of cell population signature genes as log2 counts per million. Box plots show quartiles, minimum, and maximum.
- Heat map of pseudo‐bulk samples showing marker genes for each epithelial cluster. The top 20 marker genes were identified for each cluster by differential expression analysis of the pseudo‐bulk read counts. Color bars at the top of the plot indicate the cluster and patient sample.
- Same t‐SNE plot as Fig 2A and B showing combined profiles of total tissue cells from reduction mammoplasties but colored by epithelial lineage expression scores. Expression levels confirm the green, blue, and red clusters as basal, LP, and ML, respectively.
- As for (F) but colored by expression of EMT marker genes (ZEB1/2, SNAI1).
Normal breast epithelia comprise three major populations plus transient intermediates
To explore diversity in normal breast cells, reduction mammoplasties were obtained from 18 women with no family history of breast cancer (Table EV1). For 11 of these mammoplasties, epithelial cells were sorted based on CD49f and CD326 (EpCAM) expression (Figs 1B and EV1B) and then profiled by scRNA‐seq. Cell sorting has previously revealed three definitive epithelial cell clusters that correspond to basal, luminal progenitor (LP), and mature luminal (ML) cells (Eirew et al, 2008; Lim et al, 2009). scRNA‐seq expression profiles were obtained for 53,716 epithelial cells after quality filtering (Table EV4). The single‐cell profiles of epithelial cells were integrated using Seurat to remove baseline differences between samples. Visualization of the combined profiles by t‐distributed stochastic neighbor embedding (t‐SNE) dimension reduction showed effective alignment of the patient profiles (Fig EV1C). Some variation in the abundance of cell subpopulations was evident between individuals, similar to that seen in the FACS profiles (Fig EV1B), and most likely reflects variation in the anatomical locations of the tissue specimens.
Cell clustering confirmed three major epithelial cell populations and one small stromal cluster (Fig EV1C). Lineage identity was determined by using bulk RNA‐seq signatures for sorted epithelial and stromal subpopulations (see Methods) to compute quantitative expression scores for each cell in each cluster (Fig EV1D). We next removed the stromal subset and reintegrated the remaining cells from the 11 patients (Fig 1C). Comparison of premenopausal (n = 8) versus post‐menopausal (n = 3) women showed a similar cluster distribution according to hormonal status (Fig 1D). Reclustering confirmed three major cell clusters plus a very small intermediate cluster (Fig 1E). Lineage identity of the major clusters was established using an expression signature method that we have demonstrated previously (Pal et al, 2017). Expression signatures were identified for the basal, LP, and ML cell populations using cell sorting and bulk RNA‐seq, and then, each single cell was positioned on a ternary plot according to the proportion of basal, LP, or ML signature genes expressed by that cell. The cluster colors from the t‐SNE plot were then overlaid onto the ternary plot, identifying the basal, LP, and ML populations (Fig 1F). A diffusion map of potential lineage trajectories placed the basal cells as potential precursors for the luminal lineages in diffusion pseudo‐time (Fig 1G). Expression of typical mammary lineage marker genes (Lim et al, 2010) for basal (e.g., KRT5, ACTA2, MYLK, SNAI2), luminal progenitor (TNFRSF11A (RANK), KIT), and mature luminal cells (ESR1, PGR, FOXA1) corroborated the identity of the three major cell clusters (Fig 1H). The top differentially expressed (DE) genes in each of the major clusters are shown in Fig EV1E. The cluster expression profiles were consistent across hormonal status, with no genes found to be DE between post‐ vs pre‐menopause for any of the clusters (pseudo‐bulk quasi F‐tests, FDR > 0.4).
Interestingly, the basal cell cluster on the t‐SNE plot shows an apparent “tail” consisting of cells that are visibly distinct from the rest of the cluster (Fig 1I). These “tail” cells can be seen to express LP and ML marker genes as well as basal genes and therefore may be lineage‐primed (Fig 1H). The diffusion map places the “tail” cells downstream of the other basal cells in pseudo‐time and between the basal and luminal lineages, suggesting that they represent transient intermediates prior to luminal lineage commitment (Fig 1I). These data are compatible with studies of X chromosome inactivation as well as clonal tracking of cells deficient in Cytochrome C oxidase, both of which have indicated the presence of bipotent precursor cells (Tsai et al, 1996; Cereser et al, 2018).
Elucidation of the normal breast microenvironment and changes accompanying hormonal status
We next investigated the immune and stromal microenvironment of normal breast tissue by profiling total tissue cells isolated from the reduction mammoplasties of pre‐ (n = 8) and post‐menopausal (n = 5) women. scRNA‐seq analysis produced expression profiles for 54,332 cells after quality filtering (Table EV4). Integration and clustering of the single‐cell expression profiles yielded eight major cell clusters (Fig 2A and B). A ternary epithelial signature map revealed the green, blue, and red epithelial clusters to be basal, LP, and MP cells, respectively (Fig 2C). EPCAM expression showed three of the clusters to be epithelial (Fig 2D). These identities were confirmed by coloring cells according to their basal, LP, and MP expression signatures, respectively (Fig EV1F). Expression of the epithelial‐mesenchymal transition (EMT) transcription factors, SNAI1, ZEB1, and ZEB2 was by contrast dramatically higher in stromal cells (Fig EV1G).
Figure 2. Transcriptional changes in the microenvironment of post‐menopausal breast tissue.

- t‐SNE map of combined scRNA‐seq transcriptomes of total tissue cells from 13 reduction mammoplasties. Cell colors correspond to tissue specimens.
- Same t‐SNE map as (A) but colored by cell cluster (with cluster resolution 0.05).
- Ternary plot positioning each cell according to the proportion of basal, LP, or ML signature genes expressed by that cell. The plot shows the same cells and cell colors as for (B).
- Reclustered EPCAM‐negative non‐epithelial cells revealed seven clusters (resolution 0.05) representing immune and stromal cell lineages.
- Multidimensional scaling plot showing expression profile distances between the pseudo‐bulk samples. Each dot corresponds to aggregated expression for a cell cluster for one patient. Cluster colors are overlaid from (D, right panel). Distances on the plot correspond to leading log2‐fold change, defined as the average log2‐fold change for the 500 most differential genes between each pair of profiles.
- Heat map of pseudo‐bulk samples showing marker genes for each non‐epithelial cluster. The top 20 marker genes were identified for each cluster by differential expression analysis of the pseudo‐bulk read counts. Color bars at the top of the plot indicate the cluster and menopausal status (blue/yellow for pre/post‐menopause) of each sample.
- Same t‐SNE map of non‐epithelial cells as in (D) but colored by menopausal status. Barplot shows relative cluster sizes (percentage of total cells) for each status condition. Clusters 1 and 2 have significantly different sizes in post‐menopause samples after allowing for inter‐patient variability (P = 0.040 and P = 0.032 by quasi‐binomial F‐test). Sizes are not significantly different for other clusters (P > 0.15).
- Relative cluster sizes as for (G) but by individual patients. Cluster colors correspond to (D) by cluster. A quasi‐multinomial F‐test was used to test for differences in cluster frequencies between pre‐ and post‐menopausal samples (P = 0.007).
- Bar plots showing percentage of cells expressing selected immune and endothelial cell markers for pre‐ and post‐menopausal samples and the cell clusters identified in Fig 2D.
To further probe the identity of cells within the ductal microenvironment, the EPCAM + epithelial cell clusters were removed and the remaining cells reclustered, thus yielding seven non‐epithelial clusters (Fig 2D). For identification of cellular constituents, we aggregated cells from the same individual and same cluster to form pseudo‐bulk sample expression profiles. Displaying transcriptional distances between the samples showed clusters 4 (red) and 5 (purple) to be well‐separated from the other clusters in terms of expression profiles (Fig 2E). Clusters 2 and 7 formed a subgroup as did clusters 1, 3, and 6 (Fig 2E). Unlike the t‐SNE plot, distances on the MDS plot are linear in terms of log‐expression changes. Differential expression analysis of the pseudo‐bulk samples selected marker genes for each cluster, identifying the non‐epithelial clusters as fibroblasts, endothelial cells (vascular and lymphatic), pericytes (perivascular cells), myeloid, and lymphoid cells (Fig 2F). Consistent with the fibrous and vascular nature of human breast, fibroblasts (cluster 1), endothelial cells (clusters 2 and 7), and pericytes (cluster 3) constituted major fractions (Fig 2D). Cluster 5 (lymphoid) showed expression of canonical markers of B, T, and Natural Killer (NK) cells, while cluster 4 (myeloid) was composed of monocytes/macrophages and likely dendritic cells (Fig 2F). Hierarchical clustering based on previously published gene expression profiles for immune and stromal cell lineages (Jeffrey et al, 2006; Novershtern et al, 2011) confirmed the cellular annotations (Fig EV1H).
Tissue‐resident cells in the microenvironment of pre‐ versus post‐menopausal tissue showed some differences. Lower and higher proportions of fibroblasts (cluster 1) and vascular endothelial cells (cluster 2), respectively, were evident in post‐menopausal tissue (Fig 2G). Differences in cell type composition between pre‐ and post‐menopausal microenvironments were statistically significant despite inter‐patient variability (Fig 2H). The expression of multiple cell‐specific genes for either pre‐ or post‐menopausal patients was examined: pan‐hematopoietic (PTPRC/CD45), B cells (CD79A), T cells (CD4, CD8a), NK cells (HAVR2C), myeloid/macrophages (ITGAX/CD11c, ITGAM/CD11b, CD68, CD14), pericytes (RGS5), and endothelial cells (VWF, CD36) (Fig 2I). The expression of several definitive cell markers was similar between pre‐ and post‐menopausal tissue for the majority of immune subsets, apart for certain myeloid markers. Moreover, close inspection of the fibroblast population (cluster 1) indicated that a lower proportion of cells expressed key marker genes such as PDGFRA, PDGFRB, CD34, and the matrix‐associated genes POSTN and COL3A1 (also SPARC, COL5A2, COL14A1) in post‐menopausal tissue (Fig 3A). High‐resolution confocal imaging of breast tissue to address expression and spatial distribution indicated a marked decrease in PDGFRβ+ fibroblasts in post‐menopausal tissue (Fig 3B), including the interlobular fibroblasts (Morsing et al, 2020). Some variation between post‐menopausal tissue sections was apparent, in part reflecting the regression of TDLUs. Nonetheless, reduced PDGFRβ+ staining was apparent in eight out of 10 post‐menopausal specimens, in contrast to intense staining seen across premenopausal samples (n = 13). Furthermore, 3D imaging revealed that PDGFRβ+ fibroblasts were in close proximity to the epithelium, exemplified by the TDLU in Fig 3B(v). Although some pericytes that line the blood vasculature may express less PDGFRβ in post‐menopausal tissue, capillaries appeared intact. The apparent diminution in expression of several extracellular matrix‐associated genes in resident fibroblasts of post‐menopausal tissue would be predicted to alter the extracellular matrix (ECM) that juxtaposes the ductal network.
Figure 3. Changes in epithelial‐associated fibroblasts in post‐menopausal breast tissue.

- Microenvironment t‐SNE map as in Fig 2D and G but separated by menopausal status and colored by expression (red=high expression, gray=undetectable) of selected fibroblast markers (upper panel). The dotted lines indicate the pericyte subsets. Bottom panel of bar plots shows percentage of cells expressing the markers for the cell clusters identified in Fig 2D.
- Co‐immunofluorescence staining of pre‐ versus post‐menopausal tissue for E‐cadherin (cyan), PDGFRβ (yellow), and F‐actin (pink). DAPI is shown in gray. The arrowheads in (v) depict fibroblasts in direct contact with the myoepithelial layer. For 2D and 3D confocal imaging: n = 13 premenopausal and n = 10 post‐menopausal specimens. Scale bars: wholemount and optical sections: 100 μm (panels i‐iv); enlargements, 30 μm (panel v).
- t‐SNE plot of the integrated scRNA‐seq profiles of fibroblasts from pre‐ and post‐menopausal tissue (reclustered cells from cluster 1 in Fig 2D). Cell colors correspond to tissue specimens.
- Same t‐SNE plot as in (C) showing 5 distinct clusters (clusters 3 and 5 were specific to one patient).
- KEGG pathways enriched in cluster 1 versus 2 from (D) above (Fisher’s exact test).
- Heat map of same cells as in (D) showing expression of the top 20 marker genes in each cluster. Color bars at the top of the plot show cluster membership (colors as in (D)) and pre‐ or post‐menopausal status (blue and yellow, respectively).
Given the predominance of the fibroblast population, we reclustered these cells from pre‐ and post‐menopausal women to further probe cellular heterogeneity. Of the five clusters, three (1, 2, and 4) were common to all specimens in both hormonal milieu, the first two of which were substantial clusters (Fig 3C and D). Interestingly, KEGG pathway analysis revealed that cluster 1 was enriched for immunomodulatory signaling pathways including TNF, IL‐17, NOD‐like receptor, and NF‐κB as well as cytokine‐cytokine receptor interactions (Fig 3E). Analysis of top marker gene expression indicated abundant expression of matrix metalloproteinases (MMP3, MMP10, MMP12) and chemokines such as CXCL1 and CXCL8 in cluster 1 (Fig 3F). Cluster 2 was characterized by the expression of transcription factors associated with the immediate‐early response (FOS, JUN, EGR, KLF4, ATF3) and DNA damage genes (GADD45, HSP1A1, DNAJB). The precise roles of these two molecular groups of fibroblasts are yet to be elucidated.
Analysis of precancerous tissue from BRCA1 mutation carriers
To examine cellular changes in precancerous tissue, tissue was obtained from prophylactic mastectomies (pathologically normal) of four BRCA1 mutation carriers (Table EV1). scRNA‐seq profiling of total cells from these specimens produced expression profiles for 23,240 cells after quality filtering (Table EV4). These profiles were integrated with the eight normal (WT) premenopausal profiles from Fig 2A to produce a combined t‐SNE map of 59,766 breast cells (Fig 4A and B). No new clusters were detected in BRCA1 mutation carriers (Appendix Fig S1A), nor was expansion of the LP population detected, contrasting with flow cytometric data (Lim et al, 2009). This finding likely reflects the less quantitative nature of cell capture. Overall, the proportions of the different clusters were similar between normal and precancerous tissue (P = 0.14), with the expected patient‐wise variability also indicated (Appendix Fig S1A and B). Reclustering of stromal and immune cells was then performed to probe these cell populations in more depth (Fig 4C). Differential expression analysis of the pseudo‐bulk samples against the top genes expressed in each cluster did not reveal striking differences between the stromal and immune subsets in WT vs BRCA1 +/– preneoplastic tissue (Appendix Fig S1C). Hierarchical clustering highlighted the molecular relationships among the fibroblast clusters and between pericytes and the two endothelial clusters. Although no profound differences were found between these tissues, gene expression changes may be uncovered through higher resolution methods.
Figure 4. Comparison of the single‐cell transcriptomes of normal tissue, BRCA1+/‐ preneoplastic tissue, and BRCA1‐associated tumors.

- t‐SNE map of combined scRNA‐seq profiles of total cells isolated from pathologically normal preneoplastic tissue from BRCA1 mutation carriers (BRCA1; n = 4) and non‐BRCA premenopausal women (n = 8) with no family history of breast cancer. Cell colors represent individual samples.
- Same t‐SNE map as in (A) but colored by cluster (cluster resolution 0.12).
- Epithelial clusters were identified by EPCAM expression, and the non‐epithelial cells were reclustered to reveal immune and stromal cell populations (cluster resolution 0.08). Lineage identity was determined by hierarchical clustering according to top marker genes (Appendix Fig S1C).
- t‐SNE plot showing the combined single‐cell transcriptomes of total tissue cells from BRCA1 preneoplastic tissue and TNBCs (n = 4 for each), colored according to individual patients (B1 = preneoplastic BRCA1+/‐ tissue; TN‐B1= BRCA1‐associated TNBCs).
- Same t‐SNE map as (D) but colored by cluster (cluster resolution 0.15).
- Expression of epithelial markers indicated on the combined t‐SNE plot as in (D, E) for BRCA1 preneoplastic and BRCA1‐associated tumor cells.
- Epithelial clusters were identified by EPCAM expression, and non‐epithelial cells are indicated by the dotted line.
- Same t‐SNE map as in (D, E) but colored according to cancerous state: preneoplastic tissue (blue) and BRCA1‐associated TNBCs (yellow).
- Box plots of signature expression scores for the 13 cell clusters in (D, E) according to human breast epithelial and stromal gene signatures. Cluster 1 corresponds to tumor cells, while clusters 6, 9, and 10 represent adjacent normal LP, basal, and ML cells, respectively. Box plots show quartiles, minimum, and maximum.
Marked changes in the immune compartment of preneoplastic tissue versus tumors from BRCA1 mutation carriers
To define global molecular changes accompanying the transition from preneoplasia to malignancy in BRCA1 mutation carriers, we determined the single‐cell transcriptomes of total cells from four patients with BRCA1‐mutated TNBC tumors and then integrated the expression profiles of these 34,388 cells (Tables EV2 and EV4) with the previously determined preneoplastic profiles (Fig 4D). Clustering found 13 subsets (Fig 4E). The large epithelial cell compartment marked by EPCAM, KRT5, KRT8, ESR1, and/or EGFR comprised four clusters (1, 6, 9, 10) (Fig 4F and G). Coloring the t‐SNE plots according to patient type, either preneoplastic or tumor‐bearing (Fig 4H), together with interrogation of the different clusters with the known signatures of the human basal, LP, ML, and stromal populations revealed that clusters 6, 9, and 10 corresponded to normal epithelial populations within preneoplastic tissue, while cluster 1 encompassed malignant epithelial cells (Fig 4I). The expression profile of EPCAM+ TNBC cells in cluster 1 was most closely aligned with that of LP cells in cluster 6, concordant with previous findings (Lim et al, 2009).
Following removal of normal and tumor epithelial clusters, cells within the microenvironment were reclustered, yielding nine cellular clusters (Fig 5A). Substantive changes were apparent in the microenvironment of tumors versus preneoplastic tissue, with the clusters unequally distributed between the two patient groups (Fig 5B). Cell types were annotated based on expression analysis of the top marker genes in each cluster and published gene signatures, with expression of cardinal genes of T and B lymphoid cells, monocytes/macrophages, and fibroblasts overlaid on t‐SNE maps as well as quantified in bar plots (Fig 5C and D). Lymphoid (clusters 2, 5, 7) and myeloid (clusters 4, 8) cells formed a much larger proportion of the tumor microenvironment (Fig 5E), consistent with prior observations (Azizi et al, 2018). By contrast, stromal and vascular cells formed a smaller proportion (Figs 4H and 5A, B, E), likely reflecting the shift toward tumor‐infiltrating immune cells. The considerable variation in cluster proportions between individual patients is shown in Fig 5F. The large TIL population evident in BRCA1‐associated tumors is in agreement with findings for TNBCs (Savas et al, 2016). CD4+FOXP3+ T regulatory (Treg) cells (Josefowicz et al, 2012) were prominent in tumors, while undetectable in preneoplastic tissue. These cells expressed inhibitory markers and genes associated with functional exhaustion (e.g., CTLA4, TIGIT, HAVCR2/TIM‐3) (Fig 5D). Other immune populations readily identified in tumors included NK, B, and plasma cells (discussed further below).
Figure 5. The altered microenvironment in BRCA1+/‐ preneoplastic tissue versus tumors.
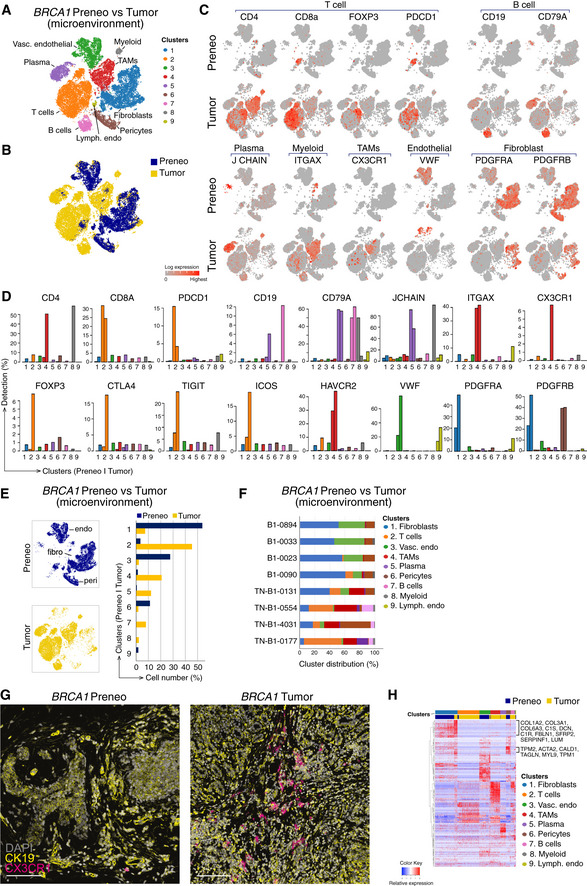
- Reclustered EPCAM‐negative cells (excluding clusters 1, 6, 9, and 10 from Fig 4E) revealed immune/stromal cells in the microenvironment, identified using lineage markers.
- Combined t‐SNE plot as in (A) of the single‐cell transcriptomes of immune/stromal cells from preneoplastic tissue of BRCA1 mutation carriers (blue; preneo) and BRCA1‐associated TNBCs (yellow; tumor).
- t‐SNE plots showing relative expression of cardinal markers of immune and stromal cells in each cell.
- Bar plots showing the percentage of cells expressing typical immune cell (including Treg) genes for clusters in (A) by preneoplastic vs tumor.
- Left panel, same t‐SNE map as in (A) but separated into cells from preneoplastic (blue) and tumor specimens (yellow). Endothelial cell (endo), fibroblast cell (fibro), and pericytes (peri) clusters are marked. Right panel, proportion of clusters as in (A) according to tissue type.
- Relative cluster sizes as in (E) but by individual patient.
- Co‐immunofluorescence of tissue stained for the epithelial marker (cytokeratin 19; yellow) and the tumor‐associated macrophage marker CX3CR1 (magenta). DAPI is shown in white (n = 2 preneoplastic samples; n = 2 tumors). Scale bar, 100 μm.
- Heat map of top differentially expressed genes in the major immune/stromal cell clusters, identified in (A). BRCA1+/‐ preneoplastic cells, blue; BRCA1‐associated tumor cells, yellow.
Interestingly, CX3CR1‐expressing cells that resembled tumor‐associated macrophages (TAMs) were restricted to BRCA1‐associated tumors (Fig 5G). This chemokine receptor has been previously reported on breast tumor‐associated immune cells (Broz et al, 2014). Co‐immunofluorescence staining of preneoplastic BRCA1 tissue and tumors for CX3CR1 confirmed expression of this marker on tumor‐resident immune cells, where they were intermingled with cytokeratin (CK)19+ malignant epithelial cells. In contrast, exceedingly rare expression of this receptor was noted in preneoplastic tissue (Fig 5G).
Further examination of cancer‐associated fibroblasts (CAFs) in BRCA1‐mutant tumors indicated increased levels of the collagen genes COL1A2 and COL3A1, the WNT inhibitor SFRP2, and the calmodulin‐ and actin‐binding protein CALD1, which mediates the contractile function of myofibroblasts (Fig 5H). The substantial variation observed in the stromal and immune composition of different patient samples not only reflects inherent tissue diversity but other parameters including the location of the pathology specimen within the whole tumor/tissue, the timing between tissue collection and processing, and the precise digestion protocol used to isolate the diverse cell types (Lim et al, 2020).
Intra‐tumoral heterogeneity across different tumor subtypes
To further explore molecular heterogeneity within the tumor populations of the major subtypes of breast cancer and their microenvironment, we profiled total cells extracted from tumors representing 8 TN (including four BRCA1 tumors from Fig 4D), 6 HER2‐amplified (HER2+), and 13 ER+ cancers (Tables EV2–EV4), with representative tumor histopathology indicated (Fig EV2A). All tumors were obtained from treatment‐naïve patients. Integration of the single‐cell transcriptomes of tumors of the same subtype revealed extensive inter‐patient heterogeneity across all cancer subtypes (Fig EV2, EV3, EV4, EV5). EPCAM (and other markers) identified a number of epithelial clusters for each cancer subtype (Fig 6A–C). Moreover, lineage‐specific expression signatures were used to compute quantitative expression scores for each cell in each cluster, identifying two LP‐like clusters in TNBCs and multiple clusters in the other subtypes (Fig EV3A). Inferred DNA copy number analysis (Patel et al, 2014), which was used to distinguish normal from malignant epithelial cells, led to the detection of normal epithelial clusters in HER2+ and ER+ specimens (Fig 6D). Each tumor subtype was found to comprise two prominent EPCAM+ carcinoma clusters.
Figure EV2. Immunohistochemistry and inter‐patient variability among breast tumors.

-
AImmunostaining of representative ER+, TNBC, and HER2+ primary tumors for expression of ER, PR, HER2, and pan‐cytokeratin. H&E sections are shown in the left panels. Scale bar, 200 μm.
-
B–DSame t‐SNE plots as in Fig 6A–C showing the integrated profiles of total cells from 8 TNBC (4 non‐BRCA1, 4 BRCA1‐mutated), 6 HER2+, and 13 ER+ tumors, respectively. Cells are colored by tissue sample (top panels) or cell cluster (bottom panels). Cluster resolutions: 0.1, 0.07, and 0.1 for TNBC, HER2+, and ER+, respectively.
Figure EV3. Characterization of the expression profiles of breast cancer cells in different subtypes.

- Box plots showing transcriptional correlations between epithelial subsets (basal, LP, and ML) and cell clusters present in TNBC, HER2+, and ER+ tumors. LP = Luminal progenitor, ML= Mature luminal cells. Cell numbers are given in Fig EV2B–D. Box plots show quartiles, minimum, and maximum.
- t‐SNE plots of epithelial cells from TNBC and HER2+ tumors, respectively (EPCAM+ cells in Fig 6B and C). Left panels show reclustering (resolutions 0.1 and 0.05). Right panel shows MKI67 expression.
- Same t‐SNE plots as in (B) and Fig 6E, depicting distribution of cells expressing epithelial markers (KRT5 and KRT8), hormone receptors (ESR1, PGR), ERBB2 receptor, EMT signature genes (ZEB1, ZEB2, SNAI1, SNAI2, VIM, and TWIST1) and BCL2.
- Enrichment of KEGG pathways in clusters identified from (B) (Fisher’s exact test). For TBNC, cluster 2 vs 1; HER2+, cluster 3 vs the rest.
- Box plots of breast cancer subtype signatures from the TCGA by epithelial cell cluster for the combined ER+ tumor dataset. Each panel shows the same cells and cell colors as for the combined dataset in Fig 6E. Vertical axis shows average expression of cell population signature genes as log2 counts per million. Box plots show quartiles, minimum, and maximum.
Figure EV4. Unique T‐cell subsets mark the tumor microenvironments of the three breast cancer subtypes.

- t‐SNE plots showing T cells (clusters 1 and 5 for TNBC; clusters 2 and 7 for HER2+; cluster 1 for ER+ tumors) identified in Fig 7A–C. Reclustering revealed at least five T‐cell subsets in TNBC and HER2+ tumors, and four T‐cell populations in ER+ tumors (cluster resolutions: 0.2, 0.7, and 0.2, respectively).
- Same t‐SNE plots as in (A) but colored by expression of T‐cell markers and of MKI67 to identify proliferating T‐cell clusters.
- Heat maps showing pseudo‐bulk expression of top DE genes within the T‐cell subsets identified in the t‐SNE plots shown in (A). TEM = Effector memory T cells; Treg = Regulatory T cells; TRM = Tissue‐resident memory T cells; NK = Natural Killer cells.
Figure EV5. scRNA‐seq profiles of male breast tumors and matching tumor‐LN pairs.

- Combined t‐SNE transcriptome profiles of two ER+ male tumors; mER‐0068‐T (blue) and mER‐0178T (yellow). Bottom panel shows the corresponding t‐SNE cell clusters, as shown in the top panel, but colored by cell clusters.
- t‐SNE plots showing gene expression of epithelial markers and steroid hormone receptors.
- Box plots of lineage‐specific expression signatures by epithelial cell cluster. Each epithelial cell was interrogated with the expression signatures for the human basal, LP, ML, and stromal cell types. Each panel shows the same cells and cell colors as in (A). Vertical axis shows average expression of cell population signature genes as log2 counts per million. Box plots show quartiles, minimum, and maximum.
- Tumor‐LN pairs: interrogation of cell clusters identified in Fig 9A for expression of canonical immune (CD68, CD19, CD4) and stromal (COL1A2, S100A4, PDGFRA) genes.
- Maps of inferred copy number variation (CNV) for the combined tumor‐LN scRNA‐seq expression data for the clusters indicated in Fig 9A. Tumor cells can be distinguished from normal (N) by abundance of CNVs.
Figure 6. Tumor heterogeneity among the major breast cancer subtypes.

-
A–Ct‐SNE plots of combined scRNA‐seq profiles of total cells from 8 TNBC tumors, 6 HER2+ tumors, and 13 ER+ tumors, respectively. Integration and cluster sizes for the same cells are shown in Fig EV2, EV3, EV4, EV5. Cells colored by cluster (top left panels), EPCAM expression (top right), cancer subtype marker (bottom left), or MKI67 expression (bottom right). Dotted lines delineate epithelial cells (top panels) and cycling epithelial cells (bottom panels). Normal epithelial subsets (normal) are also demarcated by dotted lines in the upper‐right panels of (B) and (C).
-
DInferCNV plots to map inferred copy number variation (CNV) for the combined tumor scRNA‐seq expression data for the epithelial clusters indicated in panels A‐C. scRNA‐seq data from normal breast epithelial cells (N‐1105‐epi) served as a reference for normalization. Each row represents a gene and each column cells from a cluster in a single tumor. The tumor clusters are color‐coded as in (A‐C). Amplifications (red) and deletions (blue) are inferred from the gene expression. Tumor cells were distinguished from normal (N) cells by abundance of CNV.
-
Et‐SNE plot of EPCAM + epithelial cells from ER+ tumors (C). Top panel shows reclustering (resolution 0.05), bottom panel shows expression of MKI67.
-
FHeat map of cells from clusters in (E) using genes from the PAM50 cancer subtype classifier.
-
GEnrichment of KEGG pathways in EPCAM + clusters 1 to 3 in (E) for ER+ tumors (Fisher’s exact test).
-
HCombined t‐SNE transcriptome profiles of two distinct ER+ tumors isolated from the same breast of a patient: ER‐0029‐7C (blue) and ER‐0029‐9C (yellow). The corresponding t‐SNE cell clusters are shown in the middle panel, and expression of EPCAM is shown in the right‐hand panel.
To further examine cancer cell heterogeneity, the tumor epithelial subsets were separated and reclustered (Figs 6E and EV3B). Gene expression analysis showed that malignant cells in TNBCs expressed abundant KRT5 but not ESR1, PGR, or ERBB2, thus recapitulating the basal‐like subtype of TNBC (Fig EV3C). Both cancer cell clusters displayed a strong expression signature characteristic of normal LP cells, while HER2+ tumors showed a broad distribution of cancer cells with substantial molecular homology to normal breast ML cells, in parallel with earlier findings (Lim et al, 2009) (Fig EV3A). Cancer cells within ER+ tumors also formed a broad cluster plus two satellites (Fig 6E). As anticipated, all cell clusters expressed ESR1, PGR, luminal keratin genes, and the ER target BCL2, with close concordance to the ML gene expression signature (Fig EV3A and C).
Variable expression of canonical EMT genes was evident across the different cancer subtypes. Moreover, discrete subclusters of EMT‐expressing tumor cells were not observed but instead cells were interspersed throughout the broad cancer clusters. TNBC expressed abundant VIM and SNAI12, while ER+ tumor cells predominantly displayed VIM and SNAI1 expression, and HER2+ tumor cells expressed low levels of these EMT genes (Fig EV3C). Other EMT genes such as ZEB1, ZEB2, and TWIST were expressed at relatively low levels across all subtypes.
Presence of a discrete population of cycling tumor cells in all subtypes
All subtypes contained a discrete cluster of cycling MKI67 + tumor cells (Fig 6A–C), but this was most prevalent in TNBCs. Notably, copy number changes were comparable between the cycling cell cluster and the larger tumor cluster in all three subtypes (Fig 6D). As expected, the MKI67+ subset in TNBCs was negative for ESR1 and PGR, and in HER2+ tumors, both clusters expressed ERBB2+ and ESR1 (Fig EV3C). Further interrogation of the ER+ tumor population only (Fig 6E) using the PAM50 classifier of molecular subtype (Parker et al, 2009b) with pseudo‐bulk signatures confirmed that cluster 2 expressed higher levels of multiple genes associated with proliferation, whereas cluster 1 showed high expression of ML genes including the ER network (FOXA1, BCL2, PGR) (Fig 6F). In accordance, KEGG pathway analysis of ER+ tumors revealed enrichment of the estrogen and steroid signaling pathways in cluster 1, and DNA replication and repair pathways in cluster 2 (Fig 6G). The smaller cluster 3 expressed a plethora of signaling pathways including cAMP, PI3K/AKT, and MAPK. Analysis of cancer cells in TNBC and HER2+ tumors indicated enrichment of cell cycle and DNA repair pathways in the MKi67 + cluster, similar to that for ER+ tumors (Fig EV3D). Further interrogation of the three ER+ epithelial clusters with the TCGA breast cancer signatures showed that the dominant cluster 1 was closely aligned with the luminal A signature while the highly proliferative cluster 2 was far less concordant with this cancer subtype (Fig EV3E).
Interestingly, analysis of two spatially discrete ER+ tumors isolated from the same breast of patient ER‐0029 revealed disparate tumors (Fig 6H). Interrogation of the transcriptomes of the combined tumors together with inferCNV analysis of the epithelial clusters indicated that the four cancer cell clusters (1, 2, 4, 6) were genomically similar (Appendix Fig S2A and B). The carcinoma cell subsets exhibited abundant expression of genes that typify ER+ cancers, including ESR1, PGR, KRT19, and AR (Appendix Fig S2C), while cluster 6 was enriched for MKI67+ cycling cells derived from both tumors. These findings are consistent with a common ancestral origin for these spatially distinct, synchronous breast tumors.
Distinct tumor subtypes exhibit different immune landscapes
To survey the microenvironment of the different subtypes, EPCAM+ tumor and normal epithelial clusters were removed from the combined datasets and stromal/immune cells reclustered (Fig 7A–C). Interrogation of the expression of top marker genes per major cluster using pseudo‐bulk gene signatures identified the different cellular constituents within the microenvironment (Fig 7A–C). Canonical markers of T (CD4, CD8, FOXP3) and myeloid/TAMs (CD68, CD14) indicated that these cells formed prominent clusters in all subtypes (Fig 7A–D). Similar to BRCA1‐associated tumors, a marked infiltration of immune cells and concomitant decrease in fibroblast and pericyte populations was evident. The expression of typical markers of fibroblasts (PDGFRA), pericytes (MCAM), NK (NKG7), B (CD19), plasma (IgLC7, IgHA1), and endothelial cells (VWF, CD34) is depicted in Appendix Fig S3. Interestingly, 50% of patients harboring TNBC or HER2+ tumors comprised obvious plasma cell clusters (Fig 7A and B), but the role of these cells within tumors remains unclear. Numerous tumor‐infiltrating myeloid cells expressed abundant MRC1, TREM1, CD68, and SIGLEC1 (Fig 7A–D), thus sharing features with the breast TAMs recently described through flow cytometry (Cassetta et al, 2019). Conversely, dendritic cells (DCs) appeared to constitute a minor proportion of myeloid cells but could be delineated in TNBCs (Fig 7A).
Figure 7. Deconvolution of the microenvironment in different breast tumor subtypes.

-
A–Ct‐SNE maps of reclustered EPCAM‐negative non‐epithelial cells identified in Fig 6 (A‐C). Cluster resolutions 0.136, 0.1, and 0.1, respectively. The major cell clusters within the microenvironment were identified based on expression of lineage‐specific genes. Heat maps of pseudo‐bulk samples show marker genes for each cluster. The top 30 marker genes were identified for each cluster by differential expression analysis of the pseudo‐bulk read counts. Cluster 9 in HER2+ tumors (B) expressed myeloid and luminal epithelial markers, suggesting phagocytosis of the latter by macrophages. Color bars at the top of the heat map indicate the cluster of each sample; top genes that mark each cluster are indicated.
-
Dt‐SNE plots showing the expression of T lymphoid and myeloid markers as shown in (A‐C). Right panels: t‐SNE plots showing the expression of the proliferation marker MKI67 for the same clusters. Dotted lines highlight T and myeloid cells that express MKI67.
To further explore diversity within the T‐cell compartment, we reclustered T cells (CD3+) and performed DE gene analysis using the pseudo‐bulk approach (Fig EV4, EV5). This identified Tregs, CD8+ effector cells encompassing effector memory T (TEM) cells, cells resembling resting/naïve T cells, and NK cells in all cancer subtypes. Cells resembling tissue‐resident memory T (TRM) cells (Schenkel & Masopust, 2014) were apparent in TNBC and HER2+ but not in ER+ cancers (Fig EV4A). TNBCs comprised the largest cluster of CD8+ cells, comprising effector cells and cells reminiscent of TEM and TRM cells. The expression of immune checkpoint molecules and markers of functional exhaustion in the CD4+FOXP3 + Treg subset (e.g., CTLA4, BATF, TIGIT, TNFRSF4/18, TIM3, LAG3) renders them potential targets of immune checkpoint blockade (Schreiber et al, 2011) (Fig EV4C). Notably, the immune repertoires apparent in TNBC and HER2+ breast cancers were most similar, each comprising a proliferative CD8+ T‐cell cluster (TRM‐like in HER2+, and TRM‐ and TEMRA‐like in TNBC) that expressed an extensive module of cell cycle‐associated genes (e.g., MKI67, PCNA, HMGB2, TOP2A, CCNB2, AURKB, CDK1, CENPF, MCM7) (Figs 7A and B, and EV4B). The repertoire of T‐cell subsets, including mitotic TRM‐like cells, is consistent with a previous analysis of T cells in TNBCs by scRNA‐seq (Savas et al, 2018). Overall, immune cell profiling at the single‐cell level points to heterogeneous CD8+ and CD4+ T‐cell populations within the microenvironment of all breast cancer subtypes. Many genes were common across multiple T‐cell subtypes, implying a continuum of T‐cell states rather than discrete states, as previously noted (Azizi et al, 2018). It remains to be determined whether this continuum exists at the protein level.
In contrast to TNBC and HER2+ tumors, ER+ cancers did not harbor a discrete, highly proliferative T‐cell subset (Fig EV4B). Rather, ER+ cancers featured an actively cycling TAM population (Fig 7C and D; cluster 7), which expressed genes including CD14, FCGR1A, CD11b, MHCII genes, CD68, SIGLEC1, CD74, APOC1, TYROBP, C1QC, FCER1G/3A, and multiple cell cycle genes. HER2‐amplified cancers and TNBCs also comprised very small subsets of cycling TAMs. To confirm the immunophenotype of these cells at the protein level and assess their spatial distribution in the tumor infiltrate versus stromal environment, we performed co‐immunofluorescence staining and image quantification on tumor sections. Quantification of tumor and stromal immune infiltrates verified the paucity of Ki67+CD8+ double‐positive cells in ER+ tumors relative to TNBCs (Fig 8A and B), particularly within the tumor region itself. By contrast, Ki67+CD68+ cells were readily detectable within the tumor and stroma in both subtypes (Fig 8A and B), despite fewer cycling CD68+ cells detectable in TNBCs at the scRNA level. Representative confocal images of cycling CD8+ T cells and CD68+ TAMs in triple‐negative and ER+ tumors are shown in Fig 8C–F. Interestingly, HER2+ cancers appeared most similar to TNBCs in the context of Ki67+CD8+ T cells (Fig 8A). The presence of a definitive cycling CD8 T‐cell population in TNBC/HER2+ but not ER+ tumors may contribute in part to the efficacy of T‐cell‐based immunotherapies in TNBC/HER2+ versus ER+ breast cancers.
Figure 8. Presence of distinct proliferating immune cell subsets in TNBC and ER+ tumors.

-
A, BImage quantification showing number of CD8+Ki67+ cells (A) or CD68+Ki67+ cells (B) per mm2 of tissue from TNBC, HER2+, and ER+ tumors, either within the tumor region (K8/18+) or the stroma (defined as > 5 μm from tumor border). Error bars represent s.e.m. CD8/Ki67: n = 11 for TNBC, n = 12 for ER+, n = 5 for HER2+. CD68/Ki67: n = 6 for TNBC, n = 8 for ER+, n = 5 for HER2+.
-
C–FRepresentative confocal images of ER+ (ER‐0032) and triple‐negative tumors (TN‐0066) immunolabeled for K8/18 (yellow), CD68 (green) and Ki67 (red) (C, E) or K8/18 (yellow), CD8 (green) and Ki67 (red) (D, F). DAPI is shown in blue. Arrows depict proliferative T cells (CD8+Ki67+) or macrophages (CD68+Ki67+). Enlargements on shown in the right‐hand panels. Scale bars, 200 µm for large tilescans; 50 µm for enlargements and smaller tilescans.
Heterogeneity in male breast cancers
Interrogation of two male ER+ breast cancers (mER‐0068 and mER‐0178) showed little overlap between the major tumor cell clusters in each patient (Fig EV5A). These tumors appeared to be very dense histologically, with an abundance of tumor cells (Fig EV2A). Similar to female breast cancers, these tumors retained abundant expression of luminal keratins and GATA3, as well as a discrete MKI67 + subset, but these tumors expressed relatively low levels of ESR1, PGR, and BCL2 (Fig EV5B). Furthermore, unlike female breast cancers that are highly enriched for a ML signature, both clusters 1 and 2 in the male tumors harbored an expression profile intermediate between the LP and ML epithelial signatures (Fig EV5C).
Clonal versus mass migration revealed through profiling of matched primary tumor‐lymph node specimens
To explore early changes within the tumor cell population that may accompany migration and seeding of axillary lymph nodes (LN), the single‐cell transcriptomes of primary tumors and involved lymph nodes isolated from seven patients at the time of surgery were determined for six female patients and one male patient with ER+ disease (Table EV3). These were clinically aggressive tumors, based on tumor grade (Grade 3 for 5 tumors; Grade 2 for 2 tumors), nodal involvement (all 7 tumors), extranodal extension (6 of 7 tumors), and a high proliferative index (18–60% Ki67+ cells in 6 of 7 tumors). The profiles of the combined specimen pairs are shown in Fig 9A, with primary tumor cells marked in blue and LN‐derived cells in yellow. The expression of key marker genes among the cell clusters confirmed their identity as stromal, immune, or epithelial cells (Figs 9A and EV5D).
Figure 9. Analysis of the single‐cell transcriptomes of primary tumors and infiltrated lymph nodes identifies clonal propagation of tumor cells.

- Combined t‐SNE plots of matching tumor and lymph node samples from seven patients (6 female and 1 male) with ER+ disease. Patient 1: ER‐0040‐T and ER‐0040‐LN; Patient 2: ER‐0056‐T and ER‐0056‐LN; Patient 3: ER‐0043‐T and ER‐0043‐LN; Patient 4: ER‐0064‐T and ER‐0064‐LN; Patient 5: ER‐0167‐T and ER‐0167‐LN; Patient 6: ER‐0173‐T and ER‐0173‐LN and Patient 7: mER‐0068‐T and mER‐0068‐LN. The top panels show the combined cells marked according to primary tumor (blue) or involved LN cells (yellow). The middle panels show expression of the epithelial marker EPCAM and proliferation marker MKI67. The bottom panels indicate the major cell clusters and their identity based on expression analyses for lineage‐specific markers.
- InferCNV plots were generated from the combined transcriptomes (A) to map copy number variation (CNV) in each chromosome. Tumor cells can be distinguished from normal (N) cells by abundance of CNV.
- Immunostaining of tumor and LN from patient ER‐0064 for expression of ER, PR, and pan‐cytokeratin. Insets show sections stained with control isotype antibodies. PR, progesterone receptor. Scale bar, 100 μm.
InferCNV analysis was used to examine the relationship between primary tumor cells and those in axillary LNs, in addition to differentiating tumor cells from normal epithelium. This approach revealed that patients ER‐0043, ER‐0064, and ER‐0173 harbored a single diffuse primary tumor cluster (EPCAM+) while patients ER‐0040, ER‐0056, ER‐0167, and mER‐0068 comprised at least two tumor clusters (Figs 9B and EV5E). Normal ductal epithelial cells carrying no apparent copy number variations were detectable in four of the seven surgical breast specimens. Most LN biopsies comprised dense tumor cell infiltrates (Fig 9C) but varying immune cell populations were detectable among the specimens including a large B‐cell population in ER‐0064, a myeloid population in ER‐0043 and both T‐cell and myeloid clusters in ER‐0173 (Fig EV5D).
Metastatic LN samples from patients ER‐0040, ER‐0167, and ER‐0173 contained a large, dispersed population of tumor cells that overlapped with primary tumor cells, indicative of mass cell migration from the primary tumor to the LN. Some alterations in chromosomal loci were evident for ER‐0167 upon comparison of primary tumor versus LN cells in cluster 1 (Fig EV5E). In contrast to ER‐0040, ER‐0167 and ER‐0173, the expression profiles of malignant cells in ER‐0056 and mER‐0068 appeared largely distinct from their involved LNs despite overall similarity between the inferred CNV signatures of the primary tumor and LN lesion. Indeed, the majority of tumor cells in the LNs exhibited a marked shift in gene expression relative to the primary tumor, suggesting global dysregulation of gene expression in the LN tumor cell infiltrate. Interestingly, only a subset of cells in tumors ER‐0043 and ER‐0064 seeded the axillary LNs (Fig 9A). Furthermore, the LN tumor cells in these patients harbored distinct copy number alterations relative to the primary tumor, implying that one or more clones had undergone further genomic alterations during migration or seeding of the LN, commensurate with clonal selection.
Discussion
This atlas represents a comprehensive resource for breast tissue in different states. Single‐cell transcriptomic analysis of normal breast tissue in different hormonal milieu did not reveal substantive compositional or gene expression changes within the epithelial compartment. Profiling of both sorted breast epithelial cells and total tissue confirmed the presence of three main populations and no change in cell clustering between pre‐ and post‐menopausal women. The transcriptional landscape of the ductal microenvironment in normal breast was found to comprise at least seven primary clusters: fibroblasts, pericytes/perivascular cells, endothelial cells, monocytes, macrophages, T and B lymphoid cells. Menopausal status was found to predominantly influence tissue‐resident fibroblasts. Lower gene expression of typical fibroblast markers such as PDGFRA, PDGFRB, POSTN, and COL genes was apparent, while confocal imaging confirmed the decrease in PDGFRβ‐expressing cells in post‐menopausal tissue at the protein level. The molecularly altered fibroblasts may result in a modified matrix composition in the post‐menopausal state. As the majority of premenopausal women in our cohort were nulliparous and most post‐menopausal samples derived from multiparous individuals, deciphering the effect of parity on cellular heterogeneity will require the analysis of numerous nulliparous and multiparous specimens from premenopausal women.
Marked intra‐ and inter‐patient heterogeneity in cell composition was apparent across each tumor subtype (ER+, HER2+, TNBC) upon interrogation of > 30 treatment‐naïve tumors. The EPCAM + cancer population in each subtype comprised a distinct cycling subset in addition to a larger cluster. TNBCs were noted to have the largest proliferative subset, in parallel with their more aggressive behavior. No discrete clusters or satellites corresponding to putative cancer stem cells or cells with EMT properties were observed. Rather, cells expressing EMT signature genes were scattered throughout the larger tumor population, particularly within TNBC and ER+ cancers.
Comparison of preneoplastic tissue versus tumors from BRCA1 mutation carriers highlighted the remarkable changes that occur within the breast tumor microenvironment. Large infiltrates of lymphocytes and myeloid cells were notable in tumors and little overlap was seen between these populations and tissue‐resident cells in preneoplastic tissue. A similar expansion of T lineage and myeloid cells was seen in other TNBCs, HER2+, and ER+ tumors. In contrast, populations enriched for tissue‐resident fibroblasts, pericytes, and endothelial cells within BRCA1‐associated tumors showed more overlap with their normal tissue counterparts. CAFs within BRCA1‐associated and other tumors tended to present as a single broad cluster. Recent scRNA‐seq data, however, have identified distinct cell states among CAFs in TNBCs including an immunomodulatory subset (Wu et al, 2020). There is mounting evidence that CAFs are an integral part of the breast tumor microenvironment, playing roles in immunosuppression and mediating response to therapy (Brechbuhl et al, 2017; Cazet et al, 2018; Costa et al, 2018). It remains unclear whether the CAF populations described here are pro‐ or anti‐tumorigenic (Ozdemir et al, 2014).
The tumor immune landscape in different patient specimens showed a large degree of variation for both innate and adaptive cells, consistent with emerging single‐cell RNA and protein data in the field (Chung et al, 2017; Azizi et al, 2018; Karaayvaz et al, 2018; Kim et al, 2018; Wagner et al, 2019). A number of T cell types were evident based on canonical marker expression and gene signatures. These included CD8+ effector cells, Tregs, resting/naïve T cells, and cells resembling TEM, TRM, and TEMRA (terminally differentiated) cells. T lymphoid cells were particularly notable in TNBCs. In these cancers, a substantial proportion of TRM cells was recently reported and their expression profile was predictive of better prognosis (Savas et al, 2018). These cells have been implicated in cancer immunosurveillance (Ganesan et al, 2017; Malik et al, 2017; Nizard et al, 2017), whereas Tregs execute a central role in immune suppression (Josefowicz et al, 2012). The myeloid compartment was also diverse, with at least one TAM cluster visible in the different subtypes. It was not possible to sub‐stratify the T and myeloid cell compartments in these breast cancers to the same degree as via mass cytometry (Wagner et al, 2019) or flow cytometric analysis (Cassetta et al, 2019). However, a number of T and myeloid cell states were detected in breast tumors based on single‐cell analysis, with increased phenotypic diversity seen in tumors compared to normal tissue (Azizi et al, 2018).
Both TNBC and HER2 featured a proliferative CD8+ T‐cell cluster, most likely corresponding to TRM‐like cells (Savas et al, 2018). By contrast, ER+ tumors primarily comprised cycling TAMs that expressed markers such as CD163, MARCH1, MRC1, and CX3CR1, among others. Interestingly, CX3CR1 was recently shown to mark a unique population of tissue‐resident ductal macrophages and TAMs in the mouse mammary gland (Dawson et al, 2020), though it is not expressed by normal breast tissue macrophages. Immune cell infiltrates can profoundly affect tumor progression and the proportion of lymphocytic infiltrate has been shown to hold predictive value for patients with TNBC but not ER+ disease (Savas et al, 2016). Moreover, higher TAM infiltrates correlate with more invasive disease (Qian & Pollard, 2010; DeNardo & Ruffell, 2019). Based on our findings, it is tempting to speculate that endocrine therapy combined with suppression of TAMs may potentially benefit patients with ER+ disease, in contrast to TNBC and HER2+ cancers, where T‐cell‐based therapies have proven more effective (Savas et al, 2016; Denkert et al, 2018).
It is well‐recognized that the presence of tumor‐infiltrated LNs in breast cancer patients correlates with poor prognosis (Moffat, 2014). scRNA‐seq and CNV analyses of paired specimens from ER+ breast cancer patients uncovered different mechanisms of LN metastasis. In two patients, genomically distinct clones seeded the axillary LN, indicative of clonal selection and expansion. In other cases, mass migration of cells from the primary tumor to the LN was observed, resulting in marked overlap among the transcriptomes of tumor and LN cells. Interestingly, a large shift in gene expression was noted in LN tumor cells of two patients in the absence of genomic alterations, thus implicating epigenetic mechanisms. Genomic analyses have indicated both monoclonal and polyclonal metastatic seeding in patients (Navin et al, 2011; Leung et al, 2017), as well as collective cell migration from the invasive edge of tumors via the penetration of the basement membrane (Aceto et al, 2014; Casasent et al, 2018). Curiously, in patient ER‐0064, the involved LN had apparently lower levels of genetic heterogeneity compared to the primary tumor, also recently observed (Siegel et al, 2018; Fasterius et al, 2019).
The large‐scale RNA expression data presented here provide a global view of heterogeneity within normal breast tissue, tumors, and their surrounding microenvironment. Other complementary single‐cell techniques such as mass cytometry, spatial‐seq, and high content imaging will be required to correlate single‐cell phenotypes with the spatial organization of cells within tumors. Emerging findings in this area have indicated that tumor ecosystems comprise distinct microenvironments and have begun to shed light on potential intercellular relationships (Ali et al, 2020; Jackson et al, 2020). Moving forward, it will be necessary to integrate multiple different "omics" platforms to fully understand breast cancer heterogeneity and its clinical significance.
Materials and Methods
Human samples
Human breast tissues (normal tissue, tumors, and lymph nodes) were obtained from consenting patients through the Royal Melbourne Hospital Tissue Bank, the Victorian Cancer Biobank and kConFab with relevant institutional review board approval. Human Ethics approval was obtained from the Walter and Eliza Hall Institute (WEHI) Human Research Ethics Committee.
Single‐cell preparation
Single‐cell suspensions from reduction mammoplasties and prophylactic mastectomies were prepared from fresh surgical specimens, as previously described (Lim et al, 2009). For preparation of tumor cell suspensions, patient‐direct tumors were minced to a homogeneous slurry using scapel blades and then digested with 150 U/ml collagenase (Sigma) and 50 U/ml hyaluronidase (Sigma) in MEC media (DMEM/F12 containing 5 mg/ml insulin (Roche), 250 ng/ml hydrocortisone (Sigma), and 10 ng/ml epidermal growth factor (Sigma), supplemented with 5% bovine calf serum in the presence of 100 U/ml deoxyribonuclease (Worthington) at 37°C with agitation. The digestion time varied up to 60 min depending on tumor size. Normal tissues were digested for 8–9 h. The resulting suspension was digested with 0.25% trypsin (Gibco)/1 mM EGTA (Sigma) for 1–3 min at 37°C. A single‐cell suspension was obtained by filtration (40 μm). If necessary, red blood cells were removed by lysis.
Flow cytometry
To assess epithelial cell marker expression on normal tissue, single cells were blocked in phosphate‐buffered saline (PBS) containing 2% FCS, 10% DNase, rat immunoglobulin (Jackson Immunolabs), and antibodies to CD16 and CD32 Fcγ II and III receptors (WEHI Monoclonal Antibody Facility) for 10 min at 4°C. Cells were then incubated with the following antibodies for 25 min at 4°C: PE‐conjugated anti‐human CD31 (BD Pharmingen; clone WM59; 1/40), PE‐conjugated anti‐human CD45 (BD Pharmingen; clone H130; 1/120), PE‐conjugated anti‐human CD235a (BD Pharmingen; clone GA‐R2; 1/120), FITC‐conjugated anti‐human CD236 (EpCAM; Stem Cell Technologies; clone VU‐1D9; 1/40), and APC‐Cy7‐conjugated anti‐human CD49f (integrin a6; clone GoH3; 1/120). Cells were then washed with PBS/2% FCS and resuspended in 7‐AAD (0.2 mg/ml) for live‐cell discrimination. Cells were sorted on a FACSAria flow cytometer (Becton Dickinson). For normal tissue, lineage‐negative (depleted for CD45, CD31, CD235a lineage‐positive cells), epithelial cells (EpCAM+CD49f– + EpCAM+CD49f+ + EpCAMCD49f+) were sorted.
Immunohistochemistry and immunofluorescence staining
Human tissues were fixed in 10% neutral‐buffered formalin before embedding in paraffin. Sections were subjected to antigen retrieval using pH9 antigen retrieval buffer (DAKO Cat# S2375) at 95°C for 20 min. For immunohistochemistry, sections were incubated with antibodies against ER (Novocastra, Clone 6F11), PR (Novocastra, Clone 16), HER2 (Clone SP3, Spring Bioscience), pan‐cytokeratin (Clone AE1/AE3, DAKO) at 4°C overnight, followed by biotinylated anti‐IgG secondary antibodies (Vector Labs). Signal detection was performed using ABC Elite (Vector Labs) for 30 min and 3,3′‐diaminobenzidine (DAKO) for 5 min at room temperature. For immunofluorescence, sections were incubated with primary antibodies against CX3CR1 (BioLegend, Cat# 824001; 1:50 dilution), CK19 (Abcam, Cat# ab195872; 1:500 dilution), CD8 (Invitrogen, Clone SP16, 1:500 dilution), CD68 (DAKO, Clone PG‐M1; 1:200 dilution), Ki67 (BD Pharmingen, Clone B56; 1:100 dilution), Ki67 (Abcam, Cat# ab15580; 1:200 dilution), K8/18 (DSHB, Clone Troma1; 1:400 dilution), rabbit monoclonal platelet‐derived growth factor receptor ß (Cell Signaling, Clone 28E1, Cat# 3169; 1:100 dilution), pan‐cytokeratin (DAKO, Clone AE1/AE3, 1:500 dilution), CD31 (DAKO, Cat# M0823, 1:50 dilution) at 4°C overnight, followed by incubation of fluorophore‐conjugated secondary antibodies and DAPI (Invitrogen, Cat# D1306; 1:500 dilution).
3D confocal imaging of breast tissue
For 3D confocal imaging, breast tissue was prepared and imaged as previously described (Rios et al, 2019). Briefly, fresh tissue from reduction mammoplasty surgeries (pathologically normal) was fixed in 4% paraformaldehyde in PBS for 2 h, and then, samples were washed prior to immunolabeling overnight with the following primary antibodies: rat monoclonal E‐cadherin (Thermo Fisher Scientific, Clone ECCD‐2, Cat#13‐1900; 1:250 dilution) and rabbit monoclonal platelet‐derived growth factor receptor ß (Cell Signaling, Clone 28E1, Cat# 3169; 1:100 dilution). After washing steps, samples were then incubated overnight with fluorescently conjugated secondary antibodies: donkey anti‐rat (H + L) Alexa Fluor 488 (Thermo Fisher Scientific, Cat# A‐21208) and donkey anti‐rabbit IgG (H + L) (Thermo Fisher Scientific, Cat# A‐31573) Alexa Fluor 647 together with Phalloidin Alexa Fluor 555 (Thermo Fisher Scientific, Cat# A‐34055) and DAPI (Thermo Fisher Scientific, Cat# 62248). Immunolabeled samples were subsequently cleared using FUnGI prior to dissection and mounting. Confocal imaging was performed using a Zeiss LSM 880 or 980 inverted microscope using a 40×, 1.3 N.A. oil objective. Image processing and visualization was performed in Zen (Zeiss) and Imaris (Bitplane) software.
10x Genomics Chromium library construction and sequencing
A 10x Genomics Chromium machine was used for > 5,000 single‐cell capture and cDNA preparations according to the Single Cell 3’ Protocol recommended by the manufacturer. The silane magnetic beads and solid‐phase reversible immobilization (SPRI) beads were used to clean up the GEM reaction mixture, and the barcoded cDNA was then amplified in a PCR step. The P7 and R2 primers were added during the GEM incubation and the P5, and R1 during library construction via end repair, A‐tailing, adaptor ligation, and PCR. The final libraries contain the P5 and P7 primers used in Illumina bridge amplification. Sequencing was carried out on an Illumina Nextseq 500.
scRNA‐seq bioinformatics
Illumina output from 10× Genomics Chromium sequencing was processed using Cell Ranger 3.0.2. Genewise read counts for cells with a least 500 reads were exported from Cell Ranger to Matrix Market format files and read into R with edgeR's read10X function. An average of > 33 million reads and > 6,200 cells were obtained for each sample (Table EV4). Each 10x library was individually quality checked, and cells were filtered to ensure good gene coverage, a consistent range of read counts and low numbers of mitochondrial reads. At least 500 detected genes were generally required for each cell, although the lower limit was reduced to 400 or 300 for some libraries. No more than 20% mitochondrial reads were generally allowed per cell, although the upper limit was increased as high as 40% for a small number of libraries. Cells with exceptionally high numbers of reads or genes detected were also filtered to minimize the occurrence of doublets. An average of 5000 cells per sample remained after this quality filtering (Fig EV1A, Table EV4). Statistical analyses of the 10x data were conducted using the Seurat (V3.1.1) (Stuart et al, 2019) and edgeR (V3.26.8) (McCarthy et al, 2012) software packages for R. Gene symbols from Cell Ranger were converted to current HUGO symbols and Entrez Gene IDs using limma's alias2SymbolUsingNCBI function and NCBI gene annotation dated 18 Aug 2018. Genes that did not map to official symbols were filtered as were genes expressed in < 1% cells for any individual sample. If two or more Cell Ranger genes mapped to the same official symbol, then the one with largest read count was kept for each sample.
Where appropriate, multiple samples were combined using the anchor‐based integration method implemented in Seurat (Stuart et al, 2019). Cell clusters were identified using the default Louvain clustering algorithm implemented in Seurat. Default Seurat function settings were used except that clustering resolutions were set to lower than default values in order to ensure conservative and reproducible clusters, and principal component dimensions 1:30 were used for all dimension reduction and integration steps. The cluster resolutions were set to 0.1 unless otherwise stated. The RunTSNE random seed was set to 1918 to ensure reproducibility. Marker genes for cell clusters were identified using Seurat's FindMarkers function with default settings for Figs EV2E and EV4F. Elsewhere, a pseudo‐bulk approach was taken for differential expression analyses in order to fully account for biological variation between the human patients. Read counts from cells with the same patient‐cluster combination were summed together to form a pseudo‐bulk sample. Marker genes of each cluster were identified using edgeR's quasi‐likelihood pipeline on the pseudo‐bulk samples (Chen et al, 2016). A linear model was fitted adjusting for baseline differences between patients. Contrasts between each cluster and the average of the other clusters identified marker genes. Gene ontology (GO) and KEGG pathway analyses were conducted using limma's goana and kegga functions.
Ternary plots position cells according to the proportion of basal, LP‐ or ML‐positive signature genes expressed by that cell and were generated using the vcd package. MDS plots were created with edgeR's plotMDS function. Log2‐CPM values for each gene across cells were calculated using edgeR’s cpm function with a prior count of 1. Heat maps were generated using the pheatmap package. Log2‐CPM values were standardized to have mean 0 and standard deviation 1 for each gene before producing the heat maps, after which genes and cells were clustered by the Ward’s minimum variance method. Diffusion plots were generated using the destiny package.
DNA copy number variations were detected using inferCNV of the Trinity CTAT Project. https://github.com/broadinstitute/inferCNV.
Signature genes for epithelial cell lineages
Signature genes for basal, luminal progenitor (LP), mature luminal (ML), and stromal cell types were obtained from bulk RNA‐seq data for sorted cells. Total RNA was extracted from sorted basal, luminal progenitor (Lin–CD29loCD24+), mature luminal (Lin–CD29hiCD24+), and stromal cells from pathologically normal human breast samples. Basal, LP, and ML populations were sorted from eight independent samples and stroma from 6 samples. Total RNA (100 ng) was used to generate libraries for whole transcriptome analysis following the Illumina’s TruSeq RNA v2 sample preparation protocol. Libraries were sequenced on an Illumina NextSeq 500. At least 20 million 75 bp paired‐end reads were obtained for each sample.
Read were aligned to the hg39 genome using Rsubread (Liao et al, 2019) and summarized by Entrez Gene ID using featureCounts and Rsubread's built‐in annotation (Liao et al, 2014). Low expressed genes were filtered by edgeR's filterByExpr function, and library sizes were normalized by the TMM method. Differential expression analysis was performed using limma‐voom and TREAT with a fold change threshold of 1.5 (McCarthy & Smyth, 2009; Law et al, 2014). Genes were considered cell type‐specific if they were upregulated in one cell type vs both other types. An FDR cut‐off of 0.05 was applied for each comparison. This yielded 515, 323, 765, and 1094 signature genes for basal, LP, ML, and stroma, respectively, which were used to construct ternary plot signature scores. Quantitative signature scores for individual samples shown in boxplots were computed as the average log2‐CPM (count per million) for the signature genes in that sample.
Statistical analysis
Quasi‐multinomial and quasi‐binomial generalized linear models were used to assess differences in cell cluster frequencies between patient groups. Quasi‐multinomial F‐tests were used to test for overall interaction between cell cluster frequencies and group membership, while quasi‐binomial F‐tests were used to test for differences in cell frequencies for individual clusters.
Image quantification
Cell detection and counting was performed in a semi‐automated manner using QuPath (Bankhead et al, 2017). Cells were detected with Stardist (Schmidt et al, 2018). Positive cells were considered outliers, and cells with mean intensity more than 3 standard deviations above the mean were scored as positive. For the area measurement, 10 regions per tissue area (tumor or stroma) were manually annotated for the training. Tumor‐associated areas were set with a 5 μm margin around the K8/K18‐positive tumor cell areas.
Author contributions
BP, JEV, and GJL designed the study; BP, FV, RJ, BDC, XS, and SW performed experiments; GBM provided specimens and advice; NTR performed image quantification; YC, JSP, LDS, ATP, and GKS performed bioinformatic analyses; VB carried out data interpretation; kConFab provided tissue samples; JEV, GKS, BP, and YC carried out interpretation of data and manuscript writing.
Conflict of interest
The authors declare that they have no conflict of interest.
Supporting information
Appendix
Expanded View Figures PDF
Table EV1
Table EV2
Table EV3
Table EV4
Review Process File
Acknowledgements
We are grateful to S Nutt, D Gray, and L Whitehead for discussions, H.K. Liu and E Surgenor for expert assistance, the Imaging and FACS facilities at WEHI, Leanne Taylor and colleagues from the Royal Melbourne Hospital Tissue Bank and the Victorian Cancer Biobank, Heather Thorne and all contributors to the Kathleen Cuningham Foundation Consortium for research into Familial Breast cancer (kConFab). This work was supported by the National Breast Cancer Foundation (NBCF, IIRS‐20‐022), Australian National Health and Medical Research Council (NHMRC) grants (#1054618, 1100807, 1113133, 1153049); NHMRC IRIISS; the Victorian State Government Operational Infrastructure Support; the Australian Cancer Research Foundation and the Ian Potter Foundation. G.J.L., G.K.S. and J.E.V. were supported by NHMRC Fellowships (G.J.L. #1078730 and 1175960; G.K.S. #1058892; J.E.V. #1037230 and 1102742).
The EMBO Journal (2021) 40: e107333.
Contributor Information
Gordon K Smyth, Email: smyth@wehi.edu.au.
Jane E Visvader, Email: visvader@wehi.edu.au.
Data availability
Processed scRNA‐seq and bulk RNA‐seq data generated for this study are available as GEO series GSE161529 and GSE161892, respectively. Raw data are available on request, subject to approval by our institutional Data Access Committee (dataaccess@wehi.edu.au) to ensure preservation of patient confidentiality.
References
- Aceto N, Bardia A, Miyamoto DT, Donaldson MC, Wittner BS, Spencer JA, Yu M, Pely A, Engstrom A, Zhu H et al (2014) Circulating tumor cell clusters are oligoclonal precursors of breast cancer metastasis. Cell 158: 1110–1122 [DOI] [PMC free article] [PubMed] [Google Scholar]
- Alexandrov LB, Nik‐Zainal S, Wedge DC, Aparicio SAJR, Behjati S, Biankin AV, Bignell GR, Bolli N, Borg A, Børresen‐Dale A‐L et al (2013) Signatures of mutational processes in human cancer. Nature 500: 415–421 [DOI] [PMC free article] [PubMed] [Google Scholar]
- Ali HR, Jackson HW, Zanotelli VRT, Danenberg E, Fischer JR, Bardwell H, Provenzano E, Team CIGC , Rueda OM, Chin SF et al (2020) Imaging mass cytometry and multiplatform genomics define the phenogenomic landscape of breast cancer. Nature Cancer 1: 163–175 [DOI] [PubMed] [Google Scholar]
- Azizi E, Carr AJ, Plitas G, Cornish AE, Konopacki C, Prabhakaran S, Nainys J, Wu K, Kiseliovas V, Setty M et al (2018) Single‐cell map of diverse immune phenotypes in the breast tumor microenvironment. Cell 174: 1293–1308 [DOI] [PMC free article] [PubMed] [Google Scholar]
- Bankhead P, Loughrey MB, Fernandez JA, Dombrowski Y, McArt DG, Dunne PD, McQuaid S, Gray RT, Murray LJ, Coleman HG et al (2017) QuPath: Open source software for digital pathology image analysis. Sci Rep 7: 16878 [DOI] [PMC free article] [PubMed] [Google Scholar]
- Brechbuhl HM, Finlay‐Schultz J, Yamamoto TM, Gillen AE, Cittelly DM, Tan AC, Sams SB, Pillai MM, Elias AD, Robinson WA et al (2017) Fibroblast subtypes regulate responsiveness of luminal breast cancer to estrogen. Clin Cancer Res 23: 1710–1721 [DOI] [PMC free article] [PubMed] [Google Scholar]
- Brisken C, O'Malley B (2010) Hormone action in the mammary gland. Cold Spring Harb Perspect Biol 2: a003178 [DOI] [PMC free article] [PubMed] [Google Scholar]
- Broz ML, Binnewies M, Boldajipour B, Nelson AE, Pollack JL, Erle DJ, Barczak A, Rosenblum MD, Daud A, Barber DL et al (2014) Dissecting the tumor myeloid compartment reveals rare activating antigen‐presenting cells critical for T cell immunity. Cancer Cell 26: 638–652 [DOI] [PMC free article] [PubMed] [Google Scholar]
- Butler A, Hoffman P, Smibert P, Papalexi E, Satija R (2018) Integrating single‐cell transcriptomic data across different conditions, technologies, and species. Nat Biotechnol 36: 411–420 [DOI] [PMC free article] [PubMed] [Google Scholar]
- Cancer Genome Atlas N (2012) Comprehensive molecular portraits of human breast tumours. Nature 490: 61–70 [DOI] [PMC free article] [PubMed] [Google Scholar]
- Casasent AK, Schalck A, Gao R, Sei E, Long A, Pangburn W, Casasent T, Meric‐Bernstam F, Edgerton ME, Navin NE (2018) Multiclonal invasion in breast tumors identified by topographic single cell sequencing. Cell 172: 205–217 [DOI] [PMC free article] [PubMed] [Google Scholar]
- Cassetta L, Fragkogianni S, Sims AH, Swierczak A, Forrester LM, Zhang H, Soong DYH, Cotechini T, Anur P, Lin EY et al (2019) Human tumor‐associated macrophage and monocyte transcriptional landscapes reveal cancer‐specific reprogramming, biomarkers, and therapeutic targets. Cancer Cell 35: 588–602 [DOI] [PMC free article] [PubMed] [Google Scholar]
- Cazet AS, Hui MN, Elsworth BL, Wu SZ, Roden D, Chan C‐L, Skhinas JN, Collot R, Yang J, Harvey K et al (2018) Targeting stromal remodeling and cancer stem cell plasticity overcomes chemoresistance in triple negative breast cancer. Nat Commun 9: 2897 [DOI] [PMC free article] [PubMed] [Google Scholar]
- Cereser B, Jansen M, Austin E, Elia G, McFarlane T, van Deurzen CH, Sieuwerts AM, Daidone MG, Tadrous PJ, Wright NA et al (2018) Analysis of clonal expansions through the normal and premalignant human breast epithelium reveals the presence of luminal stem cells. J Pathol 244: 61–70 [DOI] [PMC free article] [PubMed] [Google Scholar]
- Chen Y, Lun AT, Smyth GK (2016) From reads to genes to pathways: differential expression analysis of RNA‐Seq experiments using Rsubread and the edgeR quasi‐likelihood pipeline. F1000Res 5: 1438 [DOI] [PMC free article] [PubMed] [Google Scholar]
- Chung W, Eum HH, Lee HO, Lee KM, Lee HB, Kim KT, Ryu HS, Kim S, Lee JE, Park YH et al (2017) Single‐cell RNA‐seq enables comprehensive tumour and immune cell profiling in primary breast cancer. Nat Commun 8: 15081 [DOI] [PMC free article] [PubMed] [Google Scholar]
- Clemons M, Goss P (2001) Estrogen and the risk of breast cancer. N Engl J Med 344: 276–285 [DOI] [PubMed] [Google Scholar]
- Costa A, Kieffer Y, Scholer‐Dahirel A, Pelon F, Bourachot B, Cardon M, Sirven P, Magagna I, Fuhrmann L, Bernard C et al (2018) Fibroblast heterogeneity and immunosuppressive environment in human breast cancer. Cancer Cell 33: 463–479 [DOI] [PubMed] [Google Scholar]
- Dawson CA, Pal B, Vaillant F, Gandolfo LC, Liu Z, Bleriot C, Ginhoux F, Smyth GK, Lindeman GJ, Mueller SN et al (2020) Tissue‐resident ductal macrophages survey the mammary epithelium and facilitate tissue remodelling. Nat Cell Biol 22: 546–558 [DOI] [PubMed] [Google Scholar]
- DeNardo DG, Ruffell B (2019) Macrophages as regulators of tumour immunity and immunotherapy. Nat Rev Immunol 19: 369–382 [DOI] [PMC free article] [PubMed] [Google Scholar]
- Denkert C, von Minckwitz G, Darb‐Esfahani S, Lederer B, Heppner BI, Weber KE, Budczies J, Huober J, Klauschen F, Furlanetto J et al (2018) Tumour‐infiltrating lymphocytes and prognosis in different subtypes of breast cancer: a pooled analysis of 3771 patients treated with neoadjuvant therapy. Lancet Oncol 19: 40–50 [DOI] [PubMed] [Google Scholar]
- Eirew P, Stingl J, Raouf A, Turashvili G, Aparicio S, Emerman JT, Eaves CJ (2008) A method for quantifying normal human mammary epithelial stem cells with in vivo regenerative ability. Nat Med 14: 1384–1389 [DOI] [PubMed] [Google Scholar]
- Fasterius E, Uhlen M, Al‐Khalili Szigyarto C (2019) Single‐cell RNA‐seq variant analysis for exploration of genetic heterogeneity in cancer. Sci Rep 9: 9524 [DOI] [PMC free article] [PubMed] [Google Scholar]
- Fu NY, Nolan E, Lindeman GJ, Visvader JE (2020) Stem cells and the differentiation hierarchy in mammary gland development. Physiol Rev 100: 489–523 [DOI] [PubMed] [Google Scholar]
- Ganesan AP, Clarke J, Wood O, Garrido‐Martin EM, Chee SJ, Mellows T, Samaniego‐Castruita D, Singh D, Seumois G, Alzetani A et al (2017) Tissue‐resident memory features are linked to the magnitude of cytotoxic T cell responses in human lung cancer. Nat Immunol 18: 940–950 [DOI] [PMC free article] [PubMed] [Google Scholar]
- Hankinson SE, Colditz GA, Willett WC (2004) Towards an integrated model for breast cancer etiology: the lifelong interplay of genes, lifestyle, and hormones. Breast Cancer Res 6: 213–218 [DOI] [PMC free article] [PubMed] [Google Scholar]
- Jackson HW, Fischer JR, Zanotelli VRT, Ali HR, Mechera R, Soysal SD, Moch H, Muenst S, Varga Z, Weber WP et al (2020) The single‐cell pathology landscape of breast cancer. Nature 578: 615–620 [DOI] [PubMed] [Google Scholar]
- Jeffrey KL, Brummer T, Rolph MS, Liu SM, Callejas NA, Grumont RJ, Gillieron C, Mackay F, Grey S, Camps M et al (2006) Positive regulation of immune cell function and inflammatory responses by phosphatase PAC‐1. Nat Immunol 7: 274–283 [DOI] [PubMed] [Google Scholar]
- Josefowicz SZ, Lu LF, Rudensky AY (2012) Regulatory T cells: mechanisms of differentiation and function. Annu Rev Immunol 30: 531–564 [DOI] [PMC free article] [PubMed] [Google Scholar]
- Karaayvaz M, Cristea S, Gillespie SM, Patel AP, Mylvaganam R, Luo CC, Specht MC, Bernstein BE, Michor F, Ellisen LW (2018) Unravelling subclonal heterogeneity and aggressive disease states in TNBC through single‐cell RNA‐seq. Nat Commun 9: 3588 [DOI] [PMC free article] [PubMed] [Google Scholar]
- Kim C, Gao R, Sei E, Brandt R, Hartman J, Hatschek T, Crosetto N, Foukakis T, Navin NE (2018) Chemoresistance evolution in triple‐negative breast cancer delineated by single‐cell sequencing. Cell 173: 879–893 [DOI] [PMC free article] [PubMed] [Google Scholar]
- Law CW, Chen Y, Shi W, Smyth GK (2014) voom: Precision weights unlock linear model analysis tools for RNA‐seq read counts. Genome Biol 15: R29 [DOI] [PMC free article] [PubMed] [Google Scholar]
- Leung ML, Davis A, Gao R, Casasent A, Wang Y, Sei E, Vilar E, Maru D, Kopetz S, Navin NE (2017) Single‐cell DNA sequencing reveals a late‐dissemination model in metastatic colorectal cancer. Genome Res 27: 1287–1299 [DOI] [PMC free article] [PubMed] [Google Scholar]
- Liao Y, Smyth GK, Shi W (2014) featureCounts: an efficient general purpose program for assigning sequence reads to genomic features. Bioinformatics 30: 923–930 [DOI] [PubMed] [Google Scholar]
- Liao Y, Smyth GK, Shi W (2019) The R package Rsubread is easier, faster, cheaper and better for alignment and quantification of RNA sequencing reads. Nucleic Acids Res 47: e47 [DOI] [PMC free article] [PubMed] [Google Scholar]
- Lim B, Lin Y, Navin N (2020) Advancing cancer research and medicine with single‐cell genomics. Cancer Cell 37: 456–470 [DOI] [PMC free article] [PubMed] [Google Scholar]
- Lim E, Vaillant F, Wu Di, Forrest NC, Pal B, Hart AH, Asselin‐Labat M‐L, Gyorki DE, Ward T, Partanen A et al (2009) Aberrant luminal progenitors as the candidate target population for basal tumor development in BRCA1 mutation carriers. Nat Med 15: 907–913 [DOI] [PubMed] [Google Scholar]
- Lim E, Wu D, Pal B, Bouras T, Asselin‐Labat ML, Vaillant F, Yagita H, Lindeman GJ, Smyth GK, Visvader JE (2010) Transcriptome analyses of mouse and human mammary cell subpopulations reveal multiple conserved genes and pathways. Breast Cancer Res 12: R21 [DOI] [PMC free article] [PubMed] [Google Scholar]
- Malik BT, Byrne KT, Vella JL, Zhang P, Shabaneh TB, Steinberg SM, Molodtsov AK, Bowers JS, Angeles CV, Paulos CM et al (2017) Resident memory T cells in the skin mediate durable immunity to melanoma. Sci Immunol 2: eaam6346 [DOI] [PMC free article] [PubMed] [Google Scholar]
- McCarthy DJ, Chen Y, Smyth GK (2012) Differential expression analysis of multifactor RNA‐Seq experiments with respect to biological variation. Nucleic Acids Res 40: 4288–4297 [DOI] [PMC free article] [PubMed] [Google Scholar]
- McCarthy DJ, Smyth GK (2009) Testing significance relative to a fold‐change threshold is a TREAT. Bioinformatics 25: 765–771 [DOI] [PMC free article] [PubMed] [Google Scholar]
- Moffat FL (2014) Clinical and pathologic prognostic and predictive factors. In Diseases of the Breast: Fifth Edition, Harris JR, Lippman ME, Morrow M, Osborne CK (eds), pp 439–451. Philadelphia, PA: Lippincott Williams & Wilkins; [Google Scholar]
- Morsing M, Kim J, Villadsen R, Goldhammer N, Jafari A, Kassem M, Petersen OW, Ronnov‐Jessen L (2020) Fibroblasts direct differentiation of human breast epithelial progenitors. Breast Cancer Res 22: 102 [DOI] [PMC free article] [PubMed] [Google Scholar]
- Navin N, Kendall J, Troge J, Andrews P, Rodgers L, McIndoo J, Cook K, Stepansky A, Levy D, Esposito D et al (2011) Tumour evolution inferred by single‐cell sequencing. Nature 472: 90–94 [DOI] [PMC free article] [PubMed] [Google Scholar]
- Nguyen QH, Pervolarakis N, Blake K, Ma D, Davis RT, James N, Phung AT, Willey E, Kumar R, Jabart E et al (2018) Profiling human breast epithelial cells using single cell RNA sequencing identifies cell diversity. Nat Commun 9: 2028 [DOI] [PMC free article] [PubMed] [Google Scholar]
- Nik‐Zainal S, Davies H, Staaf J, Ramakrishna M, Glodzik D, Zou X, Martincorena I, Alexandrov LB, Martin S, Wedge DC et al (2016) Landscape of somatic mutations in 560 breast cancer whole‐genome sequences. Nature 534: 47–54 [DOI] [PMC free article] [PubMed] [Google Scholar]
- Nizard M, Roussel H, Diniz MO, Karaki S, Tran T, Voron T, Dransart E, Sandoval F, Riquet M, Rance B et al (2017) Induction of resident memory T cells enhances the efficacy of cancer vaccine. Nat Commun 8: 15221 [DOI] [PMC free article] [PubMed] [Google Scholar]
- Novershtern N, Subramanian A, Lawton LN, Mak RH, Haining WN, McConkey ME, Habib N, Yosef N, Chang CY, Shay T et al (2011) Densely interconnected transcriptional circuits control cell states in human hematopoiesis. Cell 144: 296–309 [DOI] [PMC free article] [PubMed] [Google Scholar]
- Özdemir B, Pentcheva‐Hoang T, Carstens J, Zheng X, Wu C‐C, Simpson T, Laklai H, Sugimoto H, Kahlert C, Novitskiy S et al (2014) Depletion of carcinoma‐associated fibroblasts and fibrosis induces immunosuppression and accelerates pancreas cancer with reduced survival. Cancer Cell 25: 719–734 [DOI] [PMC free article] [PubMed] [Google Scholar]
- Pal B, Chen Y, Vaillant F, Jamieson P, Gordon L, Rios AC, Wilcox S, Fu N, Liu KH, Jackling FC et al (2017) Construction of developmental lineage relationships in the mouse mammary gland by single‐cell RNA profiling. Nat Commun 8: 1627 [DOI] [PMC free article] [PubMed] [Google Scholar]
- Parker JS, Mullins M, Cheang MC, Leung S, Voduc D, Vickery T, Davies S, Fauron C, He X, Hu Z et al (2009) Supervised risk predictor of breast cancer based on intrinsic subtypes. J Clin Oncol 27: 1160–1167 [DOI] [PMC free article] [PubMed] [Google Scholar]
- Parker WH, Broder MS, Chang E, Feskanich D, Farquhar C, Liu Z, Shoupe D, Berek JS, Hankinson S, Manson JE (2009) Ovarian conservation at the time of hysterectomy and long‐term health outcomes in the nurses' health study. Obstet Gynecol 113: 1027–1037 [DOI] [PMC free article] [PubMed] [Google Scholar]
- Patel AP, Tirosh I, Trombetta JJ, Shalek AK, Gillespie SM, Wakimoto H, Cahill DP, Nahed BV, Curry WT, Martuza RL et al (2014) Single‐cell RNA‐seq highlights intratumoral heterogeneity in primary glioblastoma. Science 344: 1396–1401 [DOI] [PMC free article] [PubMed] [Google Scholar]
- Perou CM, Sorlie T, Eisen MB, van de Rijn M, Jeffrey SS, Rees CA, Pollack JR, Ross DT, Johnsen H, Akslen LA et al (2000) Molecular portraits of human breast tumours. Nature 406: 747–752 [DOI] [PubMed] [Google Scholar]
- Qian BZ, Pollard JW (2010) Macrophage diversity enhances tumor progression and metastasis. Cell 141: 39–51 [DOI] [PMC free article] [PubMed] [Google Scholar]
- Qian J, Olbrecht S, Boeckx B, Vos H, Laoui D, Etlioglu E, Wauters E, Pomella V, Verbandt S, Busschaert P et al (2020) A pan‐cancer blueprint of the heterogeneous tumor microenvironment revealed by single‐cell profiling. Cell Res 30: 745–762 [DOI] [PMC free article] [PubMed] [Google Scholar]
- Rios AC, Capaldo BD, Vaillant F, Pal B, van Ineveld R , Dawson CA, Chen Y, Nolan E, Fu NY, 3DTCLSM Group et al (2019) Intraclonal plasticity in mammary tumors revealed through large‐scale single‐cell resolution 3D imaging. Cancer Cell 35: 618–632 [DOI] [PubMed] [Google Scholar]
- Savas P, Salgado R, Denkert C, Sotiriou C, Darcy PK, Smyth MJ, Loi S (2016) Clinical relevance of host immunity in breast cancer: from TILs to the clinic. Nat Rev Clin Oncol 13: 228–241 [DOI] [PubMed] [Google Scholar]
- Savas P, Virassamy B, Ye C, Salim A, Mintoff CP, Caramia F, Salgado R, Byrne DJ, Teo ZL, Dushyanthen S et al (2018) Single‐cell profiling of breast cancer T cells reveals a tissue‐resident memory subset associated with improved prognosis. Nat Med 24: 986–993 [DOI] [PubMed] [Google Scholar]
- Schenkel JM, Masopust D (2014) Tissue‐resident memory T cells. Immunity 41: 886–897 [DOI] [PMC free article] [PubMed] [Google Scholar]
- Schmidt U, Weigert M, Broaddus C, Myers G (2018) Cell detection with star‐convex polygons. In International Conference on Medical Image Computing and Computer‐Assisted Intervention (MICCAI), pp 265–273. Granada, Spain: Springer International Publishing; [Google Scholar]
- Schreiber RD, Old LJ, Smyth MJ (2011) Cancer immunoediting: integrating immunity's roles in cancer suppression and promotion. Science 331: 1565–1570 [DOI] [PubMed] [Google Scholar]
- Siegel MB, He X, Hoadley KA, Hoyle A, Pearce JB, Garrett AL, Kumar S, Moylan VJ, Brady CM, Van Swearingen AED et al (2018) Integrated RNA and DNA sequencing reveals early drivers of metastatic breast cancer. J Clin Invest 128: 1371–1383 [DOI] [PMC free article] [PubMed] [Google Scholar]
- Sorlie T, Perou CM, Tibshirani R, Aas T, Geisler S, Johnsen H, Hastie T, Eisen MB, van de Rijn M, Jeffrey SS et al (2001) Gene expression patterns of breast carcinomas distinguish tumor subclasses with clinical implications. Proc Natl Acad Sci USA 98: 10869–10874 [DOI] [PMC free article] [PubMed] [Google Scholar]
- Stuart T, Butler A, Hoffman P, Hafemeister C, Papalexi E, Mauck WM 3rd, Hao Y, Stoeckius M, Smibert P, Satija R (2019) Comprehensive integration of single‐cell data. Cell 177: 1888–1902 [DOI] [PMC free article] [PubMed] [Google Scholar]
- Tsai YC, Lu Y, Nichols PW, Zlotnikov G, Jones PA, Smith HS (1996) Contiguous patches of normal human mammary epithelium derived from a single stem cell: implications for breast carcinogenesis. Cancer Res 56: 402–404 [PubMed] [Google Scholar]
- Wagner J, Rapsomaniki MA, Chevrier S, Anzeneder T, Langwieder C, Dykgers A, Rees M, Ramaswamy A, Muenst S, Soysal SD et al (2019) A single‐cell atlas of the tumor and immune ecosystem of human breast cancer. Cell 177: 1330–1345 [DOI] [PMC free article] [PubMed] [Google Scholar]
- Wu SZ, Roden DL, Wang C, Holliday H, Harvey K, Cazet AS, Murphy KJ, Pereira B, Al‐Eryani G, Bartonicek N et al (2020) Stromal cell diversity associated with immune evasion in human triple‐negative breast cancer. EMBO J 39: e104063 [DOI] [PMC free article] [PubMed] [Google Scholar]
Associated Data
This section collects any data citations, data availability statements, or supplementary materials included in this article.
Supplementary Materials
Appendix
Expanded View Figures PDF
Table EV1
Table EV2
Table EV3
Table EV4
Review Process File
Data Availability Statement
Processed scRNA‐seq and bulk RNA‐seq data generated for this study are available as GEO series GSE161529 and GSE161892, respectively. Raw data are available on request, subject to approval by our institutional Data Access Committee (dataaccess@wehi.edu.au) to ensure preservation of patient confidentiality.