

Abstract
Non-alcoholic steatohepatitis (NASH) is a common liver disease in the western world. The mechanisms behind NASH formation are poorly understood, but there may be multiple targets considering the disease’s multifactorial nature. To explore the genes related to the pathogenesis of NASH, we downloaded clinical data and gene expression of NASH patients from the Gene Expression Omnibus database (GEO). We identified 281 genes with a common expression in two NASH-related datasets (GSE89632 and GSE83452), suggesting that they may be related to NASH. Further study showed that Angptl4, Foxo1, and Ttc39B might be essential for NASH progression, and these have been poorly studied. Therefore, we explored their roles in NASH. Our data show that these genes participate in the development of NASH through lipid metabolism. This suggests that the three genes can be used as therapeutic targets in NASH.
Keywords: Non-alcoholic steatohepatitis, Angptl4, Foxo1, Ttc39B
Introduction
Non-alcoholic fatty liver disease (NAFLD) is one of the most common liver diseases globally; with a rising incidence, the attention to the disease increases [1]. It comprises non-alcoholic fatty liver (NAFL) and non-alcoholic steatohepatitis (NASH), and NASH has been recognized as a chronic liver disease in the western world. At present, the diagnosis of NASH mainly relies on imaging and biopsy. There are insufficient molecular diagnostic criteria and no effective therapies available. However, NASH is closely associated with lipid metabolism [2], and lipotoxicity drives progressive hepatic inflammation and fibrosis in patients with NAFLD [3]. NASH is more severe than NAFLD and can progress to liver cirrhosis and cancer [4-6]. Although NASH’s pathogenesis is unclear, lipid accumulation may play an important role [7,8].
Genome-wide studies have recently opened a new era for NASH research, and some molecular mechanisms have been investigated via bioinformatics to assess the pathogenesis and discover therapeutic targets [9]. Nevertheless, it is still a hot spot that the studies are about the pathogenesis and treatment strategy of NASH.
In this study, we identify 281 NASH-related genes by bioinformatic analysis of the NASH database in the Gene Expression Omnibus database (GEO) [10]. We show that Angptl4, Foxo1, and Ttc39B are predicted to participate in the regulation of lipid metabolism, and deficiencies in these genes may play an essential role in mitigating NASH. Finally, we demonstrate these three genes can serve as reliable biomarkers for the clinical management of patients with NASH.
Materials and methods
Identification of differentially expressed genes (DEGs) in NASH
The gene data from the GSE89632 and GSE83452 datasets were extracted from the GEO website (http://www.ncbi.nlm.nih.gov/geo). Geo2R (https://www.ncbi.nlm.nih.gov/geo/geo2r/) was used to identify the DEGs between the NASH and the control group.
Volcano Plots were constructed using NetworkAnalyst (https://www.networkanalyst.ca/). The selection criteria for NASH datasets were to compare the NASH group with the normal group P < 0.05. After the screening, we identified two sets of DEGs. Venn (http://bioinformatics.psb.ugent.be/webtools/Venn/) was used to acquire the co-expressed genes between the two datasets. Then, these genes were used for further analysis.
Functional enrichment analyses
Gene Ontology (GO) [11] classification was performed for the co-expressed genes using the online analysis tool Metascape (http://metascape.org/). P-values < 0.05 were defined as significant.
Construction of protein-protein interaction (PPI) network
STRING 11.0 (http://string-db.org/) was used to construct a PPI network and explore the interaction between common genes. The minimum required interaction score was considered high confidence (0.500) as the criteria for statistical significance.
Cell culture and treatment
AML12 cells were provided by the Stem Cell Bank of the Chinese Academy of Sciences. Cells were cultured in DMEM/F12 containing 10% fetal bovine serum, 1% Insulin-Transferrin-Selenium (ITS), 0.1 μM dexamethasone solution, and 1% penicillin/streptomycin. The AML12 cells were transfected with small interfering RNA (siRNA) coding for Angptl4, Foxo1, and Ttc39B (RiboBio, Guangzhou, China) using Lipofectamine 2000 (Thermo Fisher Scientific, Waltham, MA, USA) following the manufacturer’s instructions. The si-RNAs were synthesized by RiboBio (Guangzhou, China), and the sequences are listed in Table 1. After transfection for 24 hours, the cells were treated with a palmitic acid (PA: 0.1 mM; Sigma-Aldrich) and oleic acid (OA: 0.2 mM; Sigma-Aldrich) mixture for 24 hours to establish an in vitro model of lipid accumulation in AML12 cells. The lipid accumulation in cells was observed by Oil Red O staining. Images were taken with a microscope (IX-71; Olympus, Tokyo, Japan). The cells were cultured at 37°C and 5% CO2.
Table 1.
Primers used in this study
| Gene | Forward primers | Reverse primers |
|---|---|---|
| ppara | AGAGCCCCATCTGTCCTCTC | ACTGGTAGTCTGCAAAACCAAA |
| fasn | GCCGTGTCCTTCTACCACAA | GGATCGGAGCATCTCTGGTG |
| srebp1c | CGGGACAGCTTAGCCTCTAC | TCCATTGCTGGTACCGTGAG |
| acc | TGAGGAGGACCGCATTTATC | GAAGCTTCCTTTGTGACCAG |
| si-Angptl4 | GCACCUAGACAAUGGAGUATT | UACUCCAUUGUCUAGGUGCTT |
| si-Tct39B | AGUAAAUGGUCCAAGGCAATT | UUGCCUUGGACCAUUUACUTT |
| si-Foxo1 | GCACCGACUUUAUGAGCAATT | UUGCUCAUAAAGUCGGUGCTT |
| Ttc39b | AGCACTCACATTTGTGCAGGA | CTGCTTCCTGATGCGCCTTC |
| Angptl4 | CAACGCCACCCACTTACACAG | AATTGGCTTCCTCGGTTCCCT |
| Foxo1 | CCGAGAAGAGGCTCACCCTG | ATTGAATTCTTCCAGCCCGCCG |
| GAPDH | TGACTTCAACAGCGACACCCA | CACCCTGTTGCTGTAGCCAAA |
| Cpt1 | GGAGGACCCTGAGGCATCTA | ACTGTAGCCTGGTGGGTTTG |
Animals and treatment
Male adult ob/ob (leptin-deficient) mice were purchased from the Model Animal Research Center of Nanjing University, and C57BL/6J mice (8 weeks) from the Hunan SJA Laboratory Animal Co, Ltd. Mice were housed at the Animal Facilities of Guangxi Medical University. Ten C57BL/6J mice were split into two weight-matched groups and were fed a normal diet (ND) or a high-fat diet (HFD). A NASH model was established using the C57BL/6J mice by feeding them with HFD (protein, 20%; fat, 60%; carbohydrates, 20%; TP23400, Trophic, Nantong, Jiangsu, China) for 24 weeks. Those fed with ND (protein, 18%; fat, 10%; carbohydrates, 72%; TP23402, Trophic, Nantong, Jiangsu, China) served as controls. The ob/ob and wild-type (WT, C57BL/6) mice were fed with ND for 24 weeks, and each group had free access to water and food. Mice were kept at 21-23°C in 12 hours of light-dark cycles. After 24 weeks, the mice were sacrificed, and tissue samples were collected. All samples were stored at -80°C. The animal experiments were approved by the Animal Care and Use Committee of Guangxi Medical University, China.
Quantitative real-time PCR
TRIzol (15596026, Invitrogen, USA) was used to isolate total RNA from liver tissue. RNA was reverse-transcribed into cDNA with the RevertAid First Strand cDNA Synthesis kit (Thermo Fisher Scientific, Waltham, MA, USA) according to the manufacturer’s instructions. RT-PCR was performed using SYBR Green mix (Bio-Rad, California, USA) on a CFX96 Touch Real-Time system (Bio-Rad, California, USA). All primers used in this study are listed in Table 1. GAPDH was used as an internal control.
Histopathologic and biochemical analyses
The liver tissues were treated with 10% neutral formalin for 24 h, after which the tissues were dehydrated and embedded in paraffin. 4 μm thick tissue sections were prepared, and hematoxylin and eosin (H&E) staining was performed. Fresh liver tissues were frozen, cut into 8 μm slides, and stained with Oil Red O. The frozen sections were fixed with 10% Formaldehyde calcium, rinsed with water, and soak in isopropanol for 10 seconds. Next, Oil Red O was added for minimally 10 min, after which slides were washed with water and counterstained with hematoxylin. Histopathologic alterations in the liver tissues were observed using a NanoZoomer S60 C13210 series (S60 C13210, Hamamatsu Photonics K.K., Japan). The levels of alanine aminotransferase (ALT) and aspartate transaminase (AST) were measured with an autoanalyzer (Antech Diagnostics, CA, USA).
Measurement of triglyceride levels in AML12 cell and liver homogenates
The triglyceride (TG) levels in cell and liver tissue homogenates were measured using standard kits Triglyceride assay kit (Nanjing Jiancheng Bioengineering Institute, A110-1, Nanjing, China) following the manufacturer’s protocols.
Serum cytokine
TNF-α and IL-6 levels in serum were measured using commercially available ELISA kits (Cusabio, Wuhan, China) per the manufacturer’s instructions.
Metabolic assays
After the mice were fasted for 6 h, the fasting blood glucose (FBG) was examined using a glucometer (One Touch Ultra Easy, Life Scan, Wayne, USA), and fasting insulin (FINS) levels were measured using ELISA (10-1247-01, Mercodia, Sweden). Homeostatic Model Assessment of Insulin Resistance (HOMA-IR) was calculated as follows: FBG (mmol/L) × FINS (mIU/L)/22.5. A glucose tolerance test (GTT) was performed by intraperitoneal injection of 1 g/kg glucose (Kelun, Sichuan, China) in mice. Mice were injected with 0.75 U/kg of insulin (I8830, Solarbio, Beijing, China) for an insulin tolerance test (ITT). Six time points (0, 15, 30, 60, 90, and 120 min) were selected to determine the blood glucose level after intraperitoneal injections.
Constructing the competing endogenous RNA (ceRNA) network
The theoretical basis of the lncRNA-miRNA-mRNA ceRNA network was that lncRNAs could regulate mRNA activity through direct interactions with miRNAs [12]. MiRbase [13] (http://www.mirbase.org/) was used to identify the miRNA-targeted mRNAs. The ability of lncRNAs to sequester and bind miRNAs was predicted using LncBase Predicted v.2 [14]. (http://carolina.imis.athena-innovation.gr/diana_tools/web/index.php?r=lncbasev2). The ceRNA network was plotted with Cytoscape v3.6.0 [15].
Constructing a transcription factor-related ceRNA network
We chose 2 kbp upstream and 100 bp downstream of the transcription start site to screen for potential transcription factors of the three selected genes by applying Animal TFDB3.0 (https://bigd.big.ac.cn/databasecommons/database/id/8) and predicting the upstream transcription factors of mRNAs besides the ceRNA network [16]. Scores above 25 and P values < 0.01 were used to select significant transcription factors.
Statistical analysis
The results were presented as the mean ± SD. GraphPad Prism 7 software (GraphPad Software) was used to conduct data analysis. For multiple comparisons, statistical evaluation was conducted using ANOVA, followed by posthoc Tukey comparison. The two-tailed Student’s t-test was used to compare two variables. The threshold for a significant difference was P < 0.05.
Results
Bioinformatic analysis of two NASH-related datasets
The mRNA expression levels of target genes involved in NASH were analyzed by mining the GEO database. Two NASH-related datasets (GSE89632 and GSE83452) were selected (Figure 1A, 1B). A total of 4,357 and 986 DEGs achieved P < 0.05. Using the Venn diagram online tool, 281 intersecting common genes of the two NASH-related datasets were obtained (Figure 1C). A PPI network was constructed to distinguish the target genes from common genes. The proteins are represented as nodes, and the interactions between the proteins as lines in the PPI network. Most of these common genes were related to lipid metabolism, as shown in Figure 1D and 1E. Lipid metabolism plays a critical role in NASH. Some of these lipid metabolism-related genes were previously studied and published [17,18]. The GO enrichment analyses of 281 common genes showed that these common genes were specifically enriched in the liver tissue and adipocytes (Figure 1F). The visualization of the top 20 clusters was shown in Figure 1G. Differences in the GO enrichment analyses were notably focused on the enrichment of lipid metabolism (e.g., steroid metabolic processes, plasma lipoprotein assembly, remodeling and clearance, regulation of lipase activity, fatty acid derivative biosynthetic processes, regulation of fat cell differentiation, and triacylglycerol biosynthesis). Differences were also observed in inflammatory and other signaling pathways. We detected Foxo1, Angptl4, and Ttc39B as three important genes involved in lipid metabolism among these genes, whose function in NASH remains unknown. These were selected in the present study for further investigation.
Figure 1.

Bioinformatic analysis of two NASH-related datasets. A, B. Volcano Plot indicating the DEGs (red, upregulated genes; blue, downregulated genes) in the Normal and NASH groups. C. Venn diagram of the intersection of common genes identified by DEGs from the two NAFLD datasets. DEGs defined from the pairwise comparisons were required to satisfy two selection criteria: a fold change of >1.5 and a corresponding adjusted p-value < 0.05. D. A PPI network was constructed with the common 281 genes. E. Three relative genes (Angptl4, Foxo1, and Ttc39B) were in the PPI network. F. These common genes were specifically enriched in liver tissue and adipocytes. G. GO analysis of common genes were shown in Metascape, which only visualized the top 20 clusters.
Upregulation of the mRNA expression of three genes in NASH in the ob/ob mouse model
To verify these NASH-related genes, a classical ob/ob mouse model of NASH was constructed. We confirmed, using H&E and Oil Red O staining, that the liver of ob/ob mouse had severe lipid deposition and experienced NASH. On the contrary, wild-type mice had normal livers (Figure 2A). The serum and liver TG levels in ob/ob mice increased after 24 weeks of ND (normal diet) induction (Figure 2B and 2C). The mRNA expression of Angptl4, Foxo1, and Ttc39B in the ob/ob mice was higher than that in the WT mice (Figure 2D), implying that the expression of the three genes might be correlated with NASH.
Figure 2.
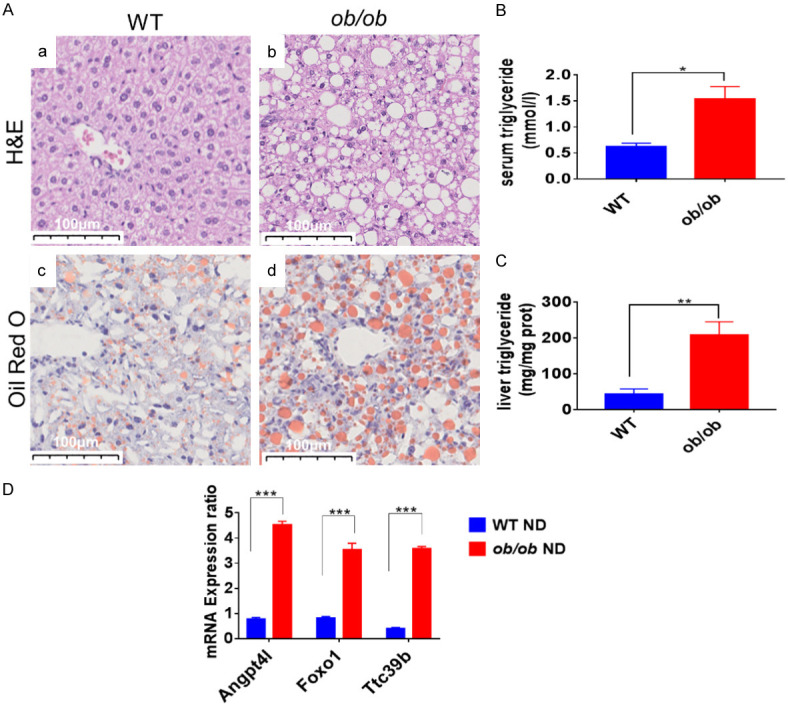
The mRNA expression levels of the relative genes in NASH were upregulated in the ob/ob mouse model. A. H&E stained (a, b) and Oil Red O stained (c, d) images of liver sections from WT (a, c) and ob/ob (b, d) mice after normal diet for 24 weeks. Scale bar: 100 μm. B, C. Triglycerides (TG) levels in the liver and serum samples of WT and ob/ob mice at 24 week after High fat diet (HFD) administration; D. Relative mRNA levels of Angptl4, Foxo1, and Ttc39B detected in WT and ob/ob mice. *P < 0.05; **P < 0.01, ***P < 0.001.
Angptl4, Foxo1, and Ttc39B are correlated with NASH in the C57BL/6J mouse model of NASH
The NASH model of wild type mice was generated by subjecting mice to an HFD for 24 weeks to explore further the differences among the three genes in NASH in vivo. ITT and GTT confirmed the glucose metabolism of these mice. Compared with the ND-treated group, the HFD-treated group showed a markedly increased area under the curve obtained from GTT and ITT assays (Figure 3A and 3B). The HFD-induced mice showed higher fasting glucose serum levels (Figure 3C), insulin levels (Figure 3D), and HOMA-IR (Figure 3E) than the ND-induced mice, suggestive of insulin resistance in the HFD-induced mice.
Figure 3.
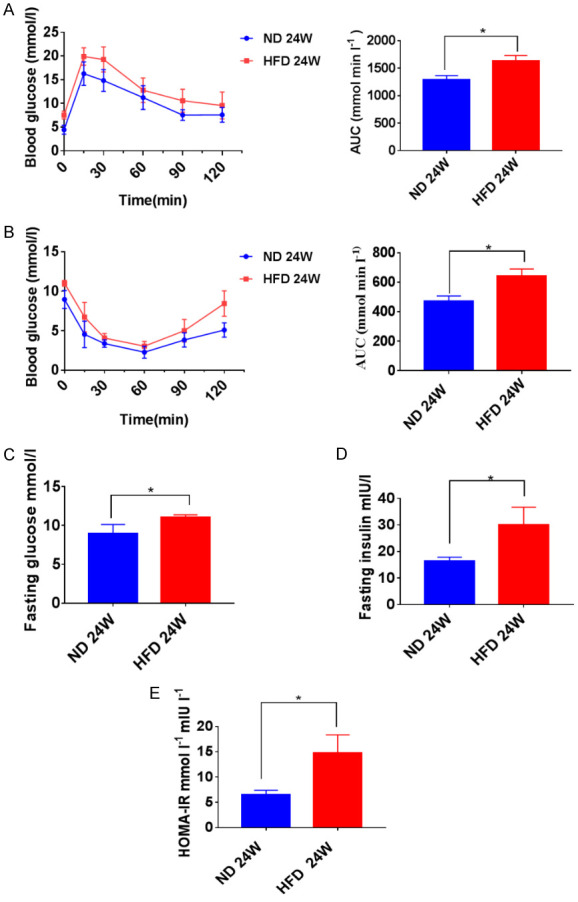
High-fat diet (HFD)-induced NASH and insulin resistance. A, B. After 24 weeks of HFD and Normal diet (ND) treatment, insulin sensitivity was determined by a glucose tolerance test and insulin tolerance test, and the area under the glucose level curve (AUC) was measured. C-E. Fasting blood glucose (FBG). fasting insulin (FINS), and homeostatic model assessment of insulin resistance (HOMA-IR) levels in mice at 24 weeks post-HFD or post-ND treatment. *P < 0.05, **P < 0.01, ***P < 0.001.
After 24 weeks of HFD consumption, the degree of lipid accumulation was more severe in the HFD-induced group than in the ND-induced group, as evidenced by H&E (Figure 4Aa, 4Ab) and Oil Red O staining (Figure 4Ac, 4Ad). As shown in Figure 4B and 4C, the TG content in the serum (P < 0.001) and liver (P < 0.001) of the ND-induced mice were significantly lower than those in the HFD-induced mice. The liver function in the HFD group exhibited markedly higher serum ALT (P < 0.05) and AST (P < 0.05) levels than those in the ND group as shown in Figure 4D and 4E. The IL-6 (P < 0.05) and TNF-α (P < 0.05) levels were higher in the HFD-induced mice than in the ND-induced mice, indicating more severe inflammation in the HFD-induced mice as shown in Figure 4F and 4G. Thus, HFD induction for 24 weeks created the characteristics of NASH. The expression of Angptl4, Foxo1, and Ttc39B was examined in this NASH model. As shown in Figure 4H, the mRNA expression of these three genes was higher in the HFD-induced mice than in the ND-induced mice (Angptl4: P < 0.01; FOXO1: P < 0.05; Ttc39B: P < 0.05).
Figure 4.
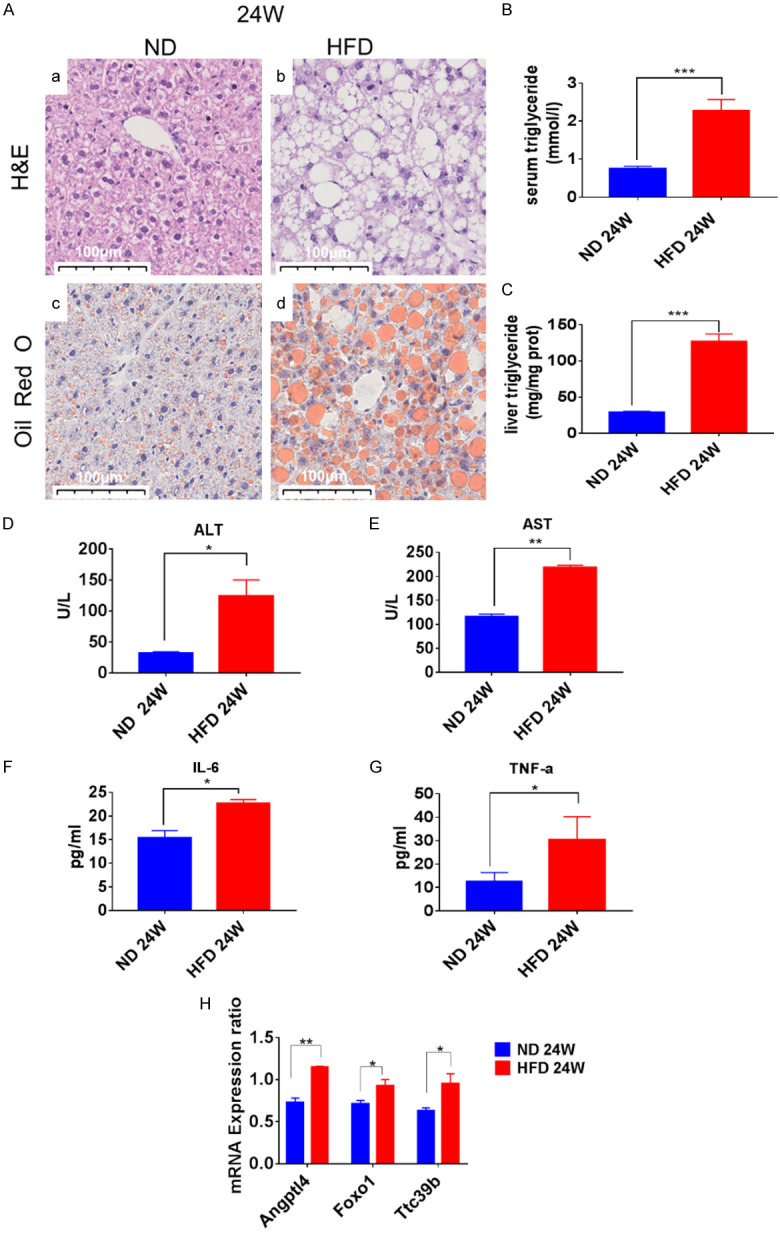
Hepatic steatosis, inflammation, and the mRNA expression of Angptl4, Foxo1 and Ttc39B in C57BL/6J mice. A. Microscopic views of livers from the normal diet (ND) or high-fat diet (HFD) mice at 24 weeks of the diet. Representative liver sections stained with H&E (a, b) and Oil Red O (c, d) are shown. Original magnification, Scale bar: 100 μm. B, C. Triglycerides (TG) levels in the liver and serum samples of C57BL/6J mice at 24 weeks after HFD treatment. D-G. Serum ALT, AST, IL-6, and TNF-α levels in mice in each group were measured by ELISA (n=5). H. Relative mRNA levels of Angptl4, Foxo1, and Ttc39B were detected in C57BL/6J mice (fed for 24 weeks). *P < 0.05; **P < 0.01, ***P < 0.001.
Angptl4, Foxo1, and Ttc39B are involved in NASH by affecting lipid metabolism
An in vitro model of lipid accumulation in AML12 cells was established to investigate the function of the genes Angptl4, Foxo1, and Ttc39B. A palmitic acid (PA) and oleic acid (OA) mixture was added to the AML12 cells for 24 hours. The expression levels of these genes were higher than those in the control group (Figure 5A). Knockdown of the three genes in AML12 cells supplemented with PA and OA mixture mitigated the lipid accumulation compared with the control group. The intracellular TGs content was consistent with that of the Oil Red O staining (Figure 5B-D). The expression levels of genes related to fatty acid synthesis and elimination were detected by quantitative RT-PCR. The expression of genes related to SREBP-1c, FASN, and ACC were significantly inhibited when the three genes were knocked down, whereas the expression of genes responsible for PPAR-α and CPT-1 was much higher in siRNA-treated cells than in the si-NC cells after PA and OA treatment for 24 hours (Figure 5E and 5F).
Figure 5.
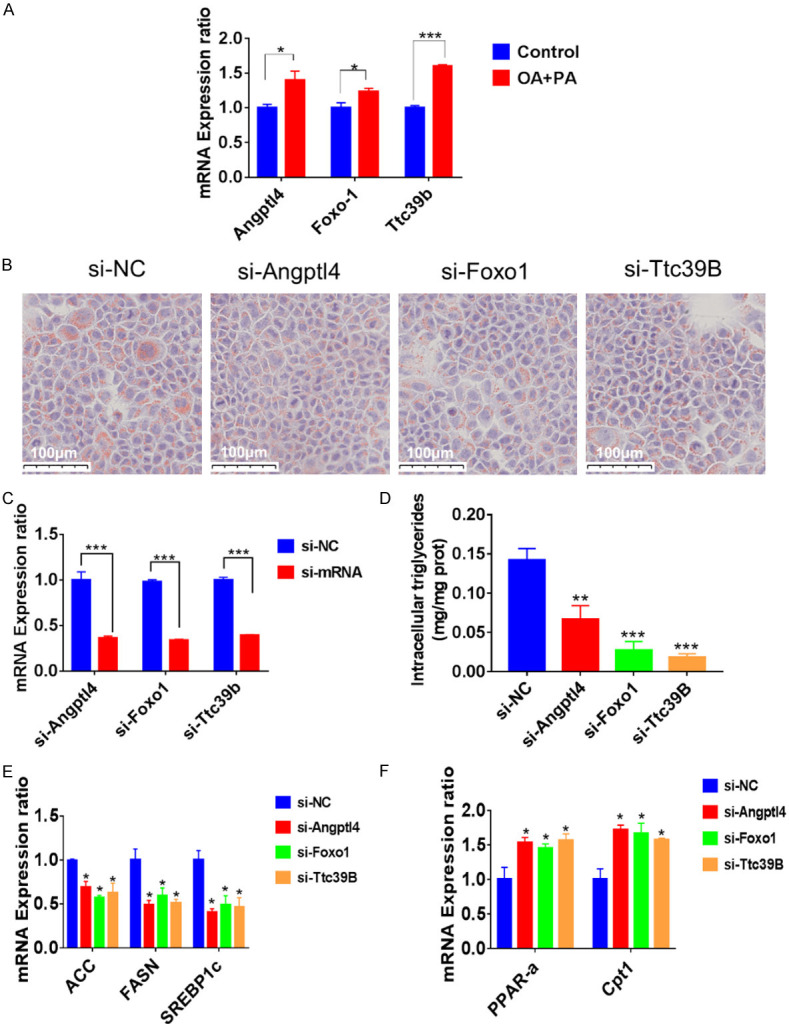
The expression and function of Angptl4, Foxo1, and Ttc39B in vitro. A. The expression of Angptl4, Foxo1, and Ttc39B was higher than the control group after PA OA treatment for 24 hours. B. The results of Oil Red O staining on the AML12 cells transfected with siRNA of Angptl4, Foxo1, or Ttc39B after 24 hours and P-AOA stimulation for 24 hours. Scale bar: 100 μm. C. The expressions of Angptl4, Foxo1, and Ttc39B after being transfected with representative siRNA after 24 hours. D. AML12 cells were transfected with representative siRNA after 24 hours, with added palmitic acid (PA) and oleic acid (OA) treatment for 24 hours, and intracellular triglycerides were examined. E, F. mRNA expression of genes associated with fatty acid metabolism in the AML12 cells after siRNA transfection and PA and OA treatment.
These in vitro data suggest that the decreased expression of the three genes may play a protective role in NASH pathogenesis and may serve as targets for treating NASH.
The ceRNA network
A ceRNA network was constructed to predict the upstream miRNAs and LncRNAs of the three target genes. This study was constructed based on the miRNA, lncRNA, and mRNA expression profiles of NASH patients to improve the reliability of the ceRNA network. Three target mRNAs, 20 miRNAs, and 124 LncRNAs were applied to define the ceRNA network (Figure 6). The key molecules in the network should be considered the next key research goals, as these may serve as diagnostic and therapeutic targets.
Figure 6.

The constructed LncRNA-miRNA-mRNA CeRNA network. The green hexagons represent LncRNAs, the blue ellipses represent miRNAs, and the red diamonds represent mRNAs.
Transcription factor-related network construction and analysis
A network of interactions was constructed to predict the upstream transcription factors of the three selected target genes (Figure 7). IRF5, GTF3C2, and GLYR1 were the common transcription factors of Ttc39B and Angptl4 in the network. Angptl4 and Foxo1 had common transcription factors, which were FOXA2, MYC, and HDAC2. Angptl4, Foxo1 and Ttc39B may have similar roles in biological function. They may influence lipid metabolism and NASH by regulating these three genes.
Figure 7.
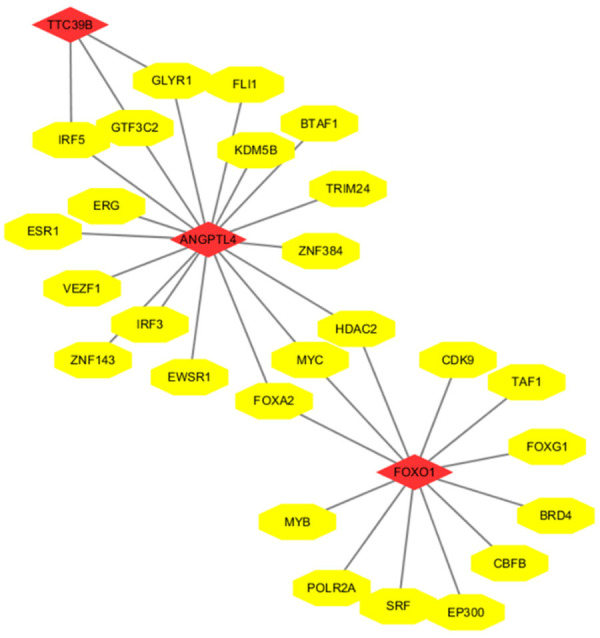
The transcription factor-related RNA network. The yellow ellipses represent transcription factors, and the red diamonds represent mRNAs.
Discussion
NASH is a global problem with no available effective therapies. NAFLD is characterized by excessive lipid accumulation in hepatocytes, and NASH is the liver manifestation of metabolic syndrome [19,20]. Excess accumulated lipid results in lipotoxicity and causes liver inflammation [6,21,22]. Therefore, exploring and targeting lipid metabolism mechanisms might serve as an effective way to prevent and treat this disease [23].
In the present study, 281 common DEGs were found in two datasets of NASH from the GEO database. Lipid metabolism-related biological functions were obtained through GO enrichment analyses. Three genes, Angptl4, Foxo1, and Ttc39B, which functions remain unclear but are related to lipid metabolism, were selected to further verify the practicability and reliability of the datasets. Angptl4, Foxo1, and Ttc39B were identified to have high expression in NASH-induced mice and OA and PA-treated cells. In the cell experiments, these three genes were knocked down by siRNA and lipid accumulation was alleviated, and similar results were found in the in vivo studies. Therefore, our data suggest that these genes have essential roles in NASH.
Our results are consistent with other studies that showed that these genes influence lipid metabolism. Angptl4 is primarily expressed in liver and adipose tissue and is also a secreted protein and adipokine. Lipoprotein lipase (LPL) can increase the metabolism of triglycerides in muscle and fat. Angptl4 regulates LPL in adipose tissue by promoting the lysis of LPL in adipocytes [24]. Angptl4 is necessary to induce hypertriglyceridemia and is a major target gene for glucocorticoid receptors in hepatocytes [25]. In addition, the expression of Angptl4 was higher in HFD-fed mouse models and were associated with the insulin resistance [26]. Furthermore, other studies have shown that Angptl4 can directly act on adipocytes to stimulate their degradation [27,28].
The Forkhead box O transcription factors (FOXOs) play a vital role in regulating metabolism by integrating hormonal and nutritional signaling [29]. FOXO1 belongs to the FOXOs family and is involved in lipid metabolism and the progression of NAFLD. In a recent study, the expression of Foxo1 was increased in mice treated with an HFD compared to ND [30]. Multiple studies have reported that Foxo1 is a key node in regulating lipid metabolism in the liver. The AKT/FOXO1 pathway is a classical pathway involved in liver lipid and glucose balance [31-34]. Zhang et al. reported that SIRT1 mediates the synthesis of TGs in NAFLD mice, which was associated with the PPARα/Foxo1 signaling pathway [35]. In addition, many drugs that treat non-alcoholic fatty liver disease also work by modulating Foxo1 [36,37].
Ttc39B is a protein-coding gene involved in a variety of pathophysiologic functions, as it affects serum high-density lipoprotein cholesterol levels and is associated with susceptibility to coronary heart disease, ischemic stroke, and gallbladder disease [38-41]. Ttc39B regulates HDL metabolism, which may be associated with the promotion of ubiquitination and degradation of the oxysterol receptor LXR [42]. Hsieh et al. established a NAFLD mouse model and found that Ttc39B regulates lipid deposition in vivo [43]. In summary, these data suggest that Ttc39B is one of the genes associated with lipoprotein metabolism.
In addition, we predicted the upstream miRNAs and LncRNAs of the three genes of interest. The interaction between the RNA molecules in the network may play an important regulatory role in the function of the three genes and even affect lipid metabolism and NASH processes. We predicted the upstream transcription factors of these three genes and showed that some common transcription factors could regulate the function of the genes. Thus, these RNAs and transcription factors may be therapeutic targets.
Conclusions
In summary, we identified the genes (281) that play critical roles in the process of NASH. We validated three genes to play an important role in NASH. Our data suggest that these three genes can be used as targets for the diagnosis or treatment of NASH.
Acknowledgements
This work was supported in part by National Natural Science Foundation of China (81771674 and 91949122, to Songqing He); The 111 Projects (D17011, to Songqing He).
Disclosure of conflict of interest
None.
References
- 1.Younossi ZM, Koenig AB, Abdelatif D, Fazel Y, Henry L, Wymer M. Global epidemiology of nonalcoholic fatty liver disease-Meta-analytic assessment of prevalence, incidence, and outcomes. Hepatology. 2016;64:73–84. doi: 10.1002/hep.28431. [DOI] [PubMed] [Google Scholar]
- 2.Suzuki A, Diehl AM. Nonalcoholic steatohepatitis. Annu Rev Med. 2017;68:85–98. doi: 10.1146/annurev-med-051215-031109. [DOI] [PubMed] [Google Scholar]
- 3.Ioannou GN. The role of cholesterol in the pathogenesis of NASH. Trends Endocrinol Metab. 2016;27:84–95. doi: 10.1016/j.tem.2015.11.008. [DOI] [PubMed] [Google Scholar]
- 4.Yu J, Shen J, Sun TT, Zhang X, Wong N. Obesity, insulin resistance, NASH and hepatocellular carcinoma. Semin Cancer Biol. 2013;23:483–491. doi: 10.1016/j.semcancer.2013.07.003. [DOI] [PubMed] [Google Scholar]
- 5.Guri Y, Colombi M, Dazert E, Hindupur SK, Roszik J, Moes S, Jenoe P, Heim MH, Riezman I, Riezman H, Hall MN. mTORC2 promotes tumorigenesis via lipid synthesis. Cancer Cell. 2017;32:807–823. e812. doi: 10.1016/j.ccell.2017.11.011. [DOI] [PubMed] [Google Scholar]
- 6.Machado MV, Diehl AM. Pathogenesis of nonalcoholic steatohepatitis. Gastroenterology. 2016;150:1769–1777. doi: 10.1053/j.gastro.2016.02.066. [DOI] [PMC free article] [PubMed] [Google Scholar]
- 7.Marra F, Svegliati-Baroni G. Lipotoxicity and the gut-liver axis in NASH pathogenesis. J Hepatol. 2018;68:280–295. doi: 10.1016/j.jhep.2017.11.014. [DOI] [PubMed] [Google Scholar]
- 8.Manne V, Handa P, Kowdley KV. Pathophysiology of nonalcoholic fatty liver disease/nonalcoholic steatohepatitis. Clin Liver Dis. 2018;22:23–37. doi: 10.1016/j.cld.2017.08.007. [DOI] [PubMed] [Google Scholar]
- 9.Speliotes EK, Yerges-Armstrong LM, Wu J, Hernaez R, Kim LJ, Palmer CD, Gudnason V, Eiriksdottir G, Garcia ME, Launer LJ, Nalls MA, Clark JM, Mitchell BD, Shuldiner AR, Butler JL, Tomas M, Hoffmann U, Hwang SJ, Massaro JM, O’Donnell CJ, Sahani DV, Salomaa V, Schadt EE, Schwartz SM, Siscovick DS, Voight BF, Carr JJ, Feitosa MF, Harris TB, Fox CS, Smith AV, Kao WH, Hirschhorn JN, Borecki IB. Genome-wide association analysis identifies variants associated with nonalcoholic fatty liver disease that have distinct effects on metabolic traits. PLoS Genet. 2011;7:e1001324. doi: 10.1371/journal.pgen.1001324. [DOI] [PMC free article] [PubMed] [Google Scholar]
- 10.Wang XK, Liao XW, Yang CK, Yu TD, Liu ZQ, Gong YZ, Huang KT, Zeng XM, Han CY, Zhu GZ, Qin W, Peng T. Diagnostic and prognostic biomarkers of Human Leukocyte Antigen complex for hepatitis B virus-related hepatocellular carcinoma. J Cancer. 2019;10:5173–5190. doi: 10.7150/jca.29655. [DOI] [PMC free article] [PubMed] [Google Scholar]
- 11.Gene Ontology Consortium. The gene ontology project in 2008. Nucleic Acids Res. 2008;36:D440–444. doi: 10.1093/nar/gkm883. [DOI] [PMC free article] [PubMed] [Google Scholar]
- 12.Guo LL, Song CH, Wang P, Dai LP, Zhang JY, Wang KJ. Competing endogenous RNA networks and gastric cancer. World J Gastroenterol. 2015;21:11680–7. doi: 10.3748/wjg.v21.i41.11680. [DOI] [PMC free article] [PubMed] [Google Scholar]
- 13.Kozomara A, Birgaoanu M, Griffiths-Jones S. miRBase: from microRNA sequences to function. Nucleic Acids Res. 2019;47:D155–D162. doi: 10.1093/nar/gky1141. [DOI] [PMC free article] [PubMed] [Google Scholar]
- 14.Paraskevopoulou MD, Vlachos IS, Karagkouni D, Georgakilas G, Kanellos I, Vergoulis T, Zagganas K, Tsanakas P, Floros E, Dalamagas T, Hatzigeorgiou AG. DIANA-LncBase v2: indexing microRNA targets on non-coding transcripts. Nucleic Acids Res. 2016;44:D231–238. doi: 10.1093/nar/gkv1270. [DOI] [PMC free article] [PubMed] [Google Scholar]
- 15.Smoot ME, Ono K, Ruscheinski J, Wang PL, Ideker T. Cytoscape 2.8: new features for data integration and network visualization. Bioinformatics. 2010;27:431–432. doi: 10.1093/bioinformatics/btq675. [DOI] [PMC free article] [PubMed] [Google Scholar]
- 16.Hu H, Miao YR, Jia LH, Yu QY, Zhang Q, Guo AY. AnimalTFDB 3.0: a comprehensive resource for annotation and prediction of animal transcription factors. Nucleic Acids Res. 2019;47:D33–D38. doi: 10.1093/nar/gky822. [DOI] [PMC free article] [PubMed] [Google Scholar]
- 17.Teslovich TM, Musunuru K, Smith AV, Edmondson AC, Stylianou IM, Koseki M, Pirruccello JP, Ripatti S, Chasman DI, Willer CJ, Johansen CT, Fouchier SW, Isaacs A, Peloso GM, Barbalic M, Ricketts SL, Bis JC, Aulchenko YS, Thorleifsson G, Feitosa MF, Chambers J, Orho-Melander M, Melander O, Johnson T, Li X, Guo X, Li M, Shin Cho Y, Jin Go M, Jin Kim Y, Lee JY, Park T, Kim K, Sim X, Twee-Hee Ong R, Croteau-Chonka DC, Lange LA, Smith JD, Song K, Hua Zhao J, Yuan X, Luan J, Lamina C, Ziegler A, Zhang W, Zee RY, Wright AF, Witteman JC, Wilson JF, Willemsen G, Wichmann HE, Whitfield JB, Waterworth DM, Wareham NJ, Waeber G, Vollenweider P, Voight BF, Vitart V, Uitterlinden AG, Uda M, Tuomilehto J, Thompson JR, Tanaka T, Surakka I, Stringham HM, Spector TD, Soranzo N, Smit JH, Sinisalo J, Silander K, Sijbrands EJ, Scuteri A, Scott J, Schlessinger D, Sanna S, Salomaa V, Saharinen J, Sabatti C, Ruokonen A, Rudan I, Rose LM, Roberts R, Rieder M, Psaty BM, Pramstaller PP, Pichler I, Perola M, Penninx BW, Pedersen NL, Pattaro C, Parker AN, Pare G, Oostra BA, O’Donnell CJ, Nieminen MS, Nickerson DA, Montgomery GW, Meitinger T, McPherson R, McCarthy MI, McArdle W, Masson D, Martin NG, Marroni F, Mangino M, Magnusson PK, Lucas G, Luben R, Loos RJ, Lokki ML, Lettre G, Langenberg C, Launer LJ, Lakatta EG, Laaksonen R, Kyvik KO, Kronenberg F, König IR, Khaw KT, Kaprio J, Kaplan LM, Johansson A, Jarvelin MR, Janssens AC, Ingelsson E, Igl W, Kees Hovingh G, Hottenga JJ, Hofman A, Hicks AA, Hengstenberg C, Heid IM, Hayward C, Havulinna AS, Hastie ND, Harris TB, Haritunians T, Hall AS, Gyllensten U, Guiducci C, Groop LC, Gonzalez E, Gieger C, Freimer NB, Ferrucci L, Erdmann J, Elliott P, Ejebe KG, Döring A, Dominiczak AF, Demissie S, Deloukas P, de Geus EJ, de Faire U, Crawford G, Collins FS, Chen YD, Caulfield MJ, Campbell H, Burtt NP, Bonnycastle LL, Boomsma DI, Boekholdt SM, Bergman RN, Barroso I, Bandinelli S, Ballantyne CM, Assimes TL, Quertermous T, Altshuler D, Seielstad M, Wong TY, Tai ES, Feranil AB, Kuzawa CW, Adair LS, Taylor HA Jr, Borecki IB, Gabriel SB, Wilson JG, Holm H, Thorsteinsdottir U, Gudnason V, Krauss RM, Mohlke KL, Ordovas JM, Munroe PB, Kooner JS, Tall AR, Hegele RA, Kastelein JJ, Schadt EE, Rotter JI, Boerwinkle E, Strachan DP, Mooser V, Stefansson K, Reilly MP, Samani NJ, Schunkert H, Cupples LA, Sandhu MS, Ridker PM, Rader DJ, van Duijn CM, Peltonen L, Abecasis GR, Boehnke M, Kathiresan S. Biological, clinical and population relevance of 95 loci for blood lipids. Nature. 2010;466:707–713. doi: 10.1038/nature09270. [DOI] [PMC free article] [PubMed] [Google Scholar]
- 18.Kathiresan S, Willer CJ, Peloso GM, Demissie S, Musunuru K, Schadt EE, Kaplan L, Bennett D, Li Y, Tanaka T, Voight BF, Bonnycastle LL, Jackson AU, Crawford G, Surti A, Guiducci C, Burtt NP, Parish S, Clarke R, Zelenika D, Kubalanza KA, Morken MA, Scott LJ, Stringham HM, Galan P, Swift AJ, Kuusisto J, Bergman RN, Sundvall J, Laakso M, Ferrucci L, Scheet P, Sanna S, Uda M, Yang Q, Lunetta KL, Dupuis J, de Bakker PIW, O’Donnell CJ, Chambers JC, Kooner JS, Hercberg S, Meneton P, Lakatta EG, Scuteri A, Schlessinger D, Tuomilehto J, Collins FS, Groop L, Altshuler D, Collins R, Lathrop GM, Melander O, Salomaa V, Peltonen L, Orho-Melander M, Ordovas JM, Boehnke M, Abecasis GR, Mohlke KL, Cupples LA. Common variants at 30 loci contribute to polygenic dyslipidemia. Nature Genetics. 2008;41:56–65. doi: 10.1038/ng.291. [DOI] [PMC free article] [PubMed] [Google Scholar]
- 19.Friedman SL, Neuschwander-Tetri BA, Rinella M, Sanyal AJ. Mechanisms of NAFLD development and therapeutic strategies. Nat Med. 2018;24:908–922. doi: 10.1038/s41591-018-0104-9. [DOI] [PMC free article] [PubMed] [Google Scholar]
- 20.Erkan G, Yilmaz G, Konca Degertekin C, Akyol G, Ozenirler S. Presence and extent of estrogen receptor-alpha expression in patients with simple steatosis and NASH. Pathol Res Pract. 2013;209:429–432. doi: 10.1016/j.prp.2013.04.010. [DOI] [PubMed] [Google Scholar]
- 21.Musso G, Cassader M, Paschetta E, Gambino R. Bioactive lipid species and metabolic pathways in progression and resolution of nonalcoholic steatohepatitis. Gastroenterology. 2018;155:282–302. e288. doi: 10.1053/j.gastro.2018.06.031. [DOI] [PubMed] [Google Scholar]
- 22.Svegliati-Baroni G, Pierantonelli I, Torquato P, Marinelli R, Ferreri C, Chatgilialoglu C, Bartolini D, Galli F. Lipidomic biomarkers and mechanisms of lipotoxicity in non-alcoholic fatty liver disease. Free Radic Biol Med. 2019;144:293–309. doi: 10.1016/j.freeradbiomed.2019.05.029. [DOI] [PubMed] [Google Scholar]
- 23.Younossi ZM. Non-alcoholic fatty liver disease - A global public health perspective. J Hepatol. 2019;70:531–544. doi: 10.1016/j.jhep.2018.10.033. [DOI] [PubMed] [Google Scholar]
- 24.Dijk W, Ruppert PMM, Oost LJ, Kersten S. Angiopoietin-like 4 promotes the intracellular cleavage of lipoprotein lipase by PCSK3/furin in adipocytes. J Biol Chem. 2018;293:14134–14145. doi: 10.1074/jbc.RA118.002426. [DOI] [PMC free article] [PubMed] [Google Scholar]
- 25.Chen TC, Lee RA, Tsai SL, Kanamaluru D, Gray NE, Yiv N, Cheang RT, Tan JH, Lee JY, Fitch MD, Hellerstein MK, Wang JC. An ANGPTL4-ceramide-protein kinase Czeta axis mediates chronic glucocorticoid exposure-induced hepatic steatosis and hypertriglyceridemia in mice. J Biol Chem. 2019;294:9213–9224. doi: 10.1074/jbc.RA118.006259. [DOI] [PMC free article] [PubMed] [Google Scholar]
- 26.Wang Y, Liu LM, Wei L, Ye WW, Meng XY, Chen F, Xiao Q, Chen JY, Zhou Y. Angiopoietin-like protein 4 improves glucose tolerance and insulin resistance but induces liver steatosis in high-fat-diet mice. Mol Med Rep. 2016;14:3293–3300. doi: 10.3892/mmr.2016.5637. [DOI] [PubMed] [Google Scholar]
- 27.Dijk W, Schutte S, Aarts EO, Janssen IMC, Afman L, Kersten S. Regulation of angiopoietin-like 4 and lipoprotein lipase in human adipose tissue. J Clin Lipidol. 2018;12:773–783. doi: 10.1016/j.jacl.2018.02.006. [DOI] [PubMed] [Google Scholar]
- 28.Altun O, Dikker O, Arman Y, Ugurlukisi B, Kutlu O, Ozgun Cil E, Aydin Yoldemir S, Akarsu M, Ozcan M, Kalyon S, Ozsoy N, Tukek T. Serum Angiopoietin-like peptide 4 levels in patients with hepatic steatosis. Cytokine. 2018;111:496–499. doi: 10.1016/j.cyto.2018.05.030. [DOI] [PubMed] [Google Scholar]
- 29.Pan X, Zhang Y, Kim HG, Liangpunsakul S, Dong XC. FOXO transcription factors protect against the diet-induced fatty liver disease. Sci Rep. 2017;7:44597. doi: 10.1038/srep44597. [DOI] [PMC free article] [PubMed] [Google Scholar]
- 30.Ding HR, Tang ZT, Tang N, Zhu ZY, Liu HY, Pan CY, Hu AY, Lin YZ, Gou P, Yuan XW, Cai JH, Dong CL, Wang JL, Ren HZ. Protective properties of FOXO1 inhibition in a murine model of non-alcoholic fatty liver disease are associated with attenuation of ER stress and necroptosis. Front Physiol. 2020;11:177. doi: 10.3389/fphys.2020.00177. [DOI] [PMC free article] [PubMed] [Google Scholar]
- 31.Wang PX, Zhang XJ, Luo P, Jiang X, Zhang P, Guo J, Zhao GN, Zhu X, Zhang Y, Yang S, Li H. Hepatocyte TRAF3 promotes liver steatosis and systemic insulin resistance through targeting TAK1-dependent signalling. Nat Commun. 2016;7:10592. doi: 10.1038/ncomms10592. [DOI] [PMC free article] [PubMed] [Google Scholar]
- 32.Wang PX, Ji YX, Zhang XJ, Zhao LP, Yan ZZ, Zhang P, Shen LJ, Yang X, Fang J, Tian S, Zhu XY, Gong J, Zhang X, Wei QF, Wang Y, Li J, Wan L, Xie Q, She ZG, Wang Z, Huang Z, Li H. Targeting CASP8 and FADD-like apoptosis regulator ameliorates nonalcoholic steatohepatitis in mice and nonhuman primates. Nat Med. 2017;23:439–449. doi: 10.1038/nm.4290. [DOI] [PubMed] [Google Scholar]
- 33.Liu XL, Pan Q, Cao HX, Xin FZ, Zhao ZH, Yang RX, Zeng J, Zhou H, Fan JG. Lipotoxic hepatocyte-derived exosomal microRNA 192-5p activates macrophages through rictor/akt/forkhead box transcription factor O1 signaling in nonalcoholic fatty liver disease. Hepatology. 2020;72:454–469. doi: 10.1002/hep.31050. [DOI] [PMC free article] [PubMed] [Google Scholar]
- 34.Li J, Chi Y, Wang C, Wu J, Yang H, Zhang D, Zhu Y, Wang N, Yang J, Guan Y. Pancreatic-derived factor promotes lipogenesis in the mouse liver: role of the Forkhead box 1 signaling pathway. Hepatology. 2011;53:1906–1916. doi: 10.1002/hep.24295. [DOI] [PubMed] [Google Scholar]
- 35.Zhang W, Sun Y, Liu W, Dong J, Chen J. SIRT1 mediates the role of RNA-binding protein QKI 5 in the synthesis of triglycerides in non-alcoholic fatty liver disease mice via the PPARalpha/FoxO1 signaling pathway. Int J Mol Med. 2019;43:1271–1280. doi: 10.3892/ijmm.2019.4059. [DOI] [PMC free article] [PubMed] [Google Scholar]
- 36.Qi R, Jiang R, Xiao H, Wang Z, He S, Wang L, Wang Y. Ginsenoside Rg1 protects against d-galactose induced fatty liver disease in a mouse model via FOXO1 transcriptional factor. Life Sci. 2020;254:117776. doi: 10.1016/j.lfs.2020.117776. [DOI] [PubMed] [Google Scholar]
- 37.Pandey A, Raj P, Goru SK, Kadakol A, Malek V, Sharma N, Gaikwad AB. Esculetin ameliorates hepatic fibrosis in high fat diet induced non-alcoholic fatty liver disease by regulation of FoxO1 mediated pathway. Pharmacol Rep. 2017;69:666–672. doi: 10.1016/j.pharep.2017.02.005. [DOI] [PubMed] [Google Scholar]
- 38.Wang W, Zhang ZZ, Wu Y, Wang RQ, Chen JW, Chen J, Zhang Y, Chen YJ, Geng M, Xu ZD, Dai M, Li JH, Pan LL. (-)-epigallocatechin-3-gallate ameliorates atherosclerosis and modulates hepatic lipid metabolic gene expression in apolipoprotein e knockout mice: involvement of TTC39B. Front Pharmacol. 2018;9:195. doi: 10.3389/fphar.2018.00195. [DOI] [PMC free article] [PubMed] [Google Scholar]
- 39.Li H, Yin RX, Huang JH, Huang F, Chen WX, Cao XL. TTC39B rs1407977 SNP is associated with the risk of coronary heart disease and ischemic stroke. Int J Clin Exp Pathol. 2018;11:5044–5053. [PMC free article] [PubMed] [Google Scholar]
- 40.Huang JH, Yin RX, Li WJ, Huang F, Chen WX, Cao XL, Chen YM. Association of the TTC39B rs581080 SNP and serum lipid levels and the risk of coronary artery disease and ischemic stroke. Int J Clin Exp Pathol. 2017;10:11195–11205. [PMC free article] [PubMed] [Google Scholar]
- 41.Rodriguez S, Gaunt TR, Guo Y, Zheng J, Barnes MR, Tang W, Danish F, Johnson A, Castillo BA, Li YR, Hakonarson H, Buxbaum SG, Palmer T, Tsai MY, Lange LA, Ebrahim S, Davey Smith G, Lawlor DA, Folsom AR, Hoogeveen R, Reiner A, Keating B, Day IN. Lipids, obesity and gallbladder disease in women: insights from genetic studies using the cardiovascular gene-centric 50K SNP array. Eur J Hum Genet. 2016;24:106–112. doi: 10.1038/ejhg.2015.63. [DOI] [PMC free article] [PubMed] [Google Scholar]
- 42.Vitali C, Khetarpal SA, Rader DJ. HDL cholesterol metabolism and the risk of CHD: new insights from human genetics. Curr Cardiol Rep. 2017;19:132. doi: 10.1007/s11886-017-0940-0. [DOI] [PubMed] [Google Scholar]
- 43.Hsieh J, Koseki M, Molusky MM, Yakushiji E, Ichi I, Westerterp M, Iqbal J, Chan RB, Abramowicz S, Tascau L, Takiguchi S, Yamashita S, Welch CL, Di Paolo G, Hussain MM, Lefkowitch JH, Rader DJ, Tall AR. TTC39B deficiency stabilizes LXR reducing both atherosclerosis and steatohepatitis. Nature. 2016;535:303–307. doi: 10.1038/nature18628. [DOI] [PMC free article] [PubMed] [Google Scholar]