

Abstract
Alterations of the cell cycle checkpoints lead to uncontrolled cell growth and result in tumorigenesis. One of the genes essential for cell proliferation and cell cycle regulation is CDK1. This makes it a potential target in cancer therapy. In our previous study we have shown upregulation of this gene in laryngeal squamous cell carcinoma (LSCC). Here we analyze the impact of siRNA-mediated CDK1 knockdown on cell proliferation and viability, measured with cell growth monitoring and colorimetric test (CCK8 assay), respectively. We proved that a reduction of CDK1 expression by more than 50% has no effect on these cellular processes in LSCC cell lines (n=2). Moreover, using microarrays, we analyzed global gene expression deregulation in these cell lines after CDK1 knockdown. We searched for enriched ontologies in the group of identified 137 differentially expressed genes (>2-fold change). Within this group we found 3 enriched pathways: protein binding (GO:0005515), mitotic nuclear division (GO:0007067) and transmembrane receptor protein tyrosine kinase signaling pathway (GO:0007169) and a group of 11 genes encoding proteins for which interaction with CDK1 was indicated with the use of bioinformatic tools. Among these genes we propose three: CDK6, CALD1 and FYN as potentially dependent on CDK1.
Keywords: CDK1, laryngeal squamous cell carcinoma (LSCC), gene silencing, cell cycle checkpoint
Introduction
Cell cycle deregulation, leading to enhanced cell proliferation, is one of the most common mechanisms of cancer development. These abnormalities are related to defects in activity of genes encoding main group of proteins responsible for cell cycle control: kinases and cyclin dependent kinases (CDKs) [1]. Inactivation of CDKs is a validated approach in cancer therapy: inhibition of two CDKs involved in cell cycle regulation - CDK4 and CDK6 with Palbociclib (IBRANCE®, Pfizer) is an approved treatment in breast cancer [2].
In our previous study we have shown recurrent overexpression of CDK1 (cyclin dependent kinase 1, EC 2.7.11.22) in laryngeal squamous cell carcinoma (LSCC) [3]. The gene encodes a member of the Ser/Thr protein kinase family which is a catalytic subunit of the conserved protein kinase complex: M-phase promoting factor (MPF). This complex is essential for G1/S and G2/M phase transitions, making CDK1 a crucial protein for the control of eukaryotic cell cycle. It was proven, that CDK1 is essential for the cell to enter mitosis [4]. The key role of CDK1 in cell proliferation was shown by Drill et al. The authors demonstrated, that in knock out mice loss of Cdk1 leads to arrest of embryonic development at the blastocyst stage, while in mice with conditional gene knock out in murine liver, affected hepatocytes are unable to exit the G2 phase of the cell cycle [5]. Inhibition of CDK1 with siRNA or CDK1 small-molecule inhibitor (RO-3306) resulted in increased apoptosis and lower viability of breast cancer cell lines [6,7]. Gene knockdown by siRNA in HeLa cell line provoked accumulation of cells stopped in G2/M phase of cell cycle, without impact on cell apoptosis [8].
The cited literature data indicate, that differences in the consequences of CDK1 silencing in breast cancer and HeLa cell lines are, to some extent, tissue dependent. Here we analyze the outcome of CDK1 silencing in laryngeal squamous cell carcinoma cell lines. Our study was focused on the analysis of cell proliferation and viability in CDK1-silenced cell lines. Moreover, we studied global changes in gene expression after CDK1 silencing, selected differentially expressed genes (DEGs) and identified molecular processes in which these genes are involved.
Material and methods
Cell lines and cell culturing
Two cell lines: UT-SCC-34 and UT-SCC-107, established from laryngeal squamous cell carcinomas were used. Characteristic of tumors and patients from which the cell lines were derived is presented in Table 1 and elsewhere [3,9]. Cell lines were established at the Turku University, Central Hospital, Finland and were kindly provided by prof. Reidar Grenman from the University in Turku in Finland. The Ethical Review Board of K. Marcinkowski Poznan University of Medical Sciences approved using cell lines for the study (number 505A/15).
Table 1.
Clinico-histological characteristics of the analyzed cell lines
| Cell line number | Sex | Age (years) | Primary tumor location | TNM | Specimen site | Type of lesion | Grade |
|---|---|---|---|---|---|---|---|
| UT-SCC-34 | M | 63 | supraglottic larynx | T4N0M0 | supraglottic larynx | pri | G1 |
| UT-SCC-107 | M | 46 | SCC laryngis supraglottidis | T4N2CM0 | larynx | pri | G2 |
Cell lines were obtained from the University of Turku (Finland). M: male; TNM: TNM classification (T - tumor; N - lymph nodes involvement; M - distance metastases); pri: cell line derived from primary tumor; G: tumor grade.
The cell lines were selected in reference to CDK1 relative gene expression level in LSCC compared to non-cancer controls from head and neck region as described in our previous study [3]. In the selected cell lines CDK1 expression was increased 38-fold (UT-SCC-107) and 16-fold (UT-SCC-34) as compared to controls. In the cited study no alterations of gene copy number or DNA sequence variants were observed.
Cells lines were cultured in DMEM (Dulbecco’s Modified Eagle Medium) medium, supplemented with 10% FBS. Cultures were kept in 37°C, in atmosphere enriched with 5% CO2. 3×10⁴-5×10⁴ cells per well (depending on the cell line) were seeded on 48-well plate to obtain 50-60% confluence on the day of transfection.
CDK1 gene silencing
CDK1 was knocked down with 27-mer siRNA duplexes (CDK1 Human siRNA Oligo Duplex, Locus ID 983, OriGene). The universal scrambled negative siRNA duplex (OriGene) was used as a control. JetPRIME (Polyplus Transfection) was used as transfection reagent to deliver siRNA into cells. Transfection was performed according to manufacturer instructions with 10 nM of siRNA final concentration. Out of three provided CDK1 siRNA duplexes, the one with the best silencing effect (as measured by RT-qPCR and Western blot) was chosen for further study. The reduction of gene expression and protein abundance by 50% was regarded as an effective gene knockdown.
Verification of CDK1 gene knockdown
Gene silencing was analyzed both on mRNA and protein level. RNA was isolated 48 hours after transfection according to Chomczynski’s method [10] and reverse transcribed using Maxima First Strand cDNA Synthesis Kit for RT-qPCR, with dsDNase (Thermo Scientific). The quantitative reverse transcription PCR (RT-qPCR) reaction was performed with HOT FIREPol® EvaGreen® qPCR Mix Plus (Solis BioDyne, Estonia) and analyzed as presented previously [3,11]. GAPDH and ACTB genes were used to normalize gene expression. Primers were designed with Beacon Designer™ 7.5 (PRIMER Biosoft International) and their specificity was confirmed with Primer-BLAST tool (https://www.ncbi.nlm.nih.gov/tools/primer-blast/). Primer sequences, together with annealing temperatures, amplicon lengths and PCR reaction efficiency are listed in Table 2. Each sample was run in three replicates.
Table 2.
Primer sequences and reaction conditions for RT-qPCR
| Gene name | Primer sequences (5’-3’) | Amplicon lenght [bp] | Annealing temperature [°C] | PCR efficiency [%] |
|---|---|---|---|---|
| ACTB | F: CACCACACCTTCTACAATG | 162 | 55 | 100 |
| NM_001101 | R: TAGCACAGCCTGGATAG | |||
| CALD1 | F: CCTCGGGAAGAAGTTTCAGA | 127 | 58 | 100 |
| NM_004342 | R: TGATGTCTGGACAGGTCAGC | |||
| CDC42 | F: GTGGATAACTCAGCGGTCGT | 191 | 58 | 90 |
| NM_044472 | R: CGATGGTGCTGTTGGTAAAA | |||
| CDK1 | F: CAGACTAGAAAGTGAAGAGGAAGG | 191 | 55 | 100 |
| NM_001170406 | R: ACTGACCAGGAGGGATAGAATC | |||
| CDK6 | F: TGGTTTCTCTGTCTGTTCGTG | 118 | 58 | 100 |
| NM_001259 | R: ATGCCGCTCTCCACCAT | |||
| FYN | F: GGCCCGATTGATAGAAGACA | 107 | 58 | 100 |
| NM_153047 | R: ACTTGATTGTGAACCTCCCG | |||
| GAPDH | F: GTCGGAGTCAACGGATT | 220 | 55 | 96 |
| NM_002046 | R: CCTGGAAGATGGTGATGG | |||
| HIST1H1C | F: ACACCGAAGAAAGCGAAGAA | 117 | 58 | 99 |
| NM_005319 | R: AGCCTTAGCAGCACTTTTGG | |||
| MYBL2 | F: TGGATGAGCTGCACTACCAG | 132 | 58 | 99 |
| NM_002466 | R: AGTCCTGCTGTCCAAACTGC | |||
| RUNX1 | F: CACTGCCTTTAACCCTCAGC | 107 | 58 | 100 |
| NM_001001890 | R: CAATGGATCCCAGGTATTGG | |||
| SMARCA4 | F: ACTCCTCGATGTGCTGGAAC | 242 | 58 | 95 |
| XM_017027168 | R: CCGACGACTCAAGAAGGAAG | |||
| SMC1A | F: CTTGGTCCTCCTTCAGTTGG | 160 | 58 | 99 |
| NM_001281463 | R: TTTTGTCGGGAGATTGGTGT | |||
| TMEM67 | F: AGACTGGCTGTTGGCATCTT | 202 | 58 | 94 |
| XM_011517363 | R: TCTAACTCGGCGCATTTTCT | |||
| TSC2 | F: GGCAAGAGAGTAGAGAGGGACG | 116 | 58 | 100 |
| XM_017023618 | R: AAGAAGGGGGAATGGTAGAGC |
Primer pairs were designed to amplify sequence overlapping at least one intron/exon junction.
For Western blot analysis, cells were lysed 48 hours after transfection in NP40 buffer (150 mM NaCl, 1.0% NP-40, 50 mM Tris-Cl pH 8.0) with protease inhibitor cocktail (LabEmpire, Poland). Western blot was performed and analyzed as described previously [3,11] with GAPDH used as a loading control. The rabbit polyclonal anti-CDK1-C-terminal antibody (Abcam Cat# ab7953, dilution 1:1000) and rabbit anti-GAPDH (Abcam Cat# ab9485, 1:2500) antibody, followed by goat anti-Rabbit secondary antibody (Abcam Cat# ab97051, 1:38500) were used (Abcam, UK, all). The reaction was performed in duplicate. The images were scanned and analyzed with the ChemiDoc XRS+ System (Image Lab Software, BioRad). To estimate the relative quantity of CDK1 protein (RQ), the “quantity tool” implemented in ImageLab 6.0 software was used with GAPDH as a reference. The level of silencing of the protein expression was calculated according to the formula:
CDK1 gene silencing = 100% - (CDK1 SQ in sample with CDK1 knockdown/CDK1 SQ in control samples) * 100%
Analysis of cell proliferation - cell growth monitoring
After transfection, cells were monitored using bright field cell history recorder: Juli BR (NanoEnTek). The cultures were maintained for 72 hours and cells confluence in each well was measured every 12 hours. The monitoring of cells transfected with CDK1 silencing siRNA and control siRNA was carried out simultaneously. Next, the rate of cell proliferation was calculated as the difference in cell confluence in the analyzed well measured 72 hours after transfection in relation to the confluence observed at the time of transfection (0 hour). Changes in proliferation rates caused by gene silencing were determined based on the differences between proliferation rate of cells transfected with control siRNA duplex and CDK1 silencing siRNA. The analysis was performed in triplicate and results were analyzed as the arithmetic mean with standard deviation. Statistical significance was estimated using unpaired T test. The results were considered significant when P<0.05. Thereafter cells were lysed, proteins were isolated and Western blot was performed in order to confirm the silencing of the CDK1.
Cell viability assay
The viability of two LSCC cell lines after CDK1 silencing was analyzed with the colorimetric method, using Cell Counting Kit-8 (CCK-8, Dojindo). Cells were seeded and transfected as described above. The CCK-8 solution was added to culture medium and incubated for 2 hours in 37°C. After incubation the cell culture medium was transferred to 96-well plate and its absorbance was measured as recommended in the manufacturer’s protocol. Cells were washed twice with PBS and fresh culture medium was added to each well. This procedure was repeated three times, every 24 hours. After last measurement, cells were lysed in protein isolation buffer for subsequent Western blot analysis.
The assay was performed in triplicate for each cell line used in the study and results were analyzed as the arithmetic mean with standard deviation. The viability of cells was calculated based on the absorbance values of cell culture medium according to the following equation:
viability [%] = (absorbance of cell culture medium with CDK1 knockdown/absorbance of cell culture medium transfected with control siRNA) * 100%
Statistical significance was estimated using unpaired T test. The results were considered significant when P<0.05.
Global analysis of CDK1 knockdown effect - selection of differentially expressed genes based on microarray gene expression analysis
After CDK1 gene knockdown, global gene expression deregulation was analyzed with the application of GeneChip Human Genome U133 Plus 2.0 Array (Affymetrix). The microarrays were hybridized and analyzed as described elsewhere [3,12,13]. For each of the analyzed cell lines total RNA extracted from cells with CDK1 gene knockdown was analyzed in reference to total RNA isolated from control cells (transfected with scrambled siRNA duplexes).
To identify genes which are potentially dependent on CDK1, a two-step selection was performed. Only genes that fulfill following criteria were chosen for further analysis: 1. Probe set detection p-value below 0.05, 2. At least 2-fold change in signal value for particular probe set in cell line in which CDK1 was knocked down as compared to control cell line. The change of expression level must be observed in both analyzed cell lines.
To identify molecular function and biological processes in which the appointed genes are involved, functional enrichment analysis was performed. Differentially expressed genes (DEGs) from abovementioned filtering were analyzed using the following bioinformatic tools: 1. GO Consortium-GO Enrichment Analysis; PANTHER Overrepresentation Test, released 20190417, GO Ontology database Released 2019-02-02 [14], 2. GOrilla-Gene Ontology enRIchment anaLysis and visuaLizAtion tool, (updated on Apr 20, 2019) [15,16], 3. DAVID Bioinformatics Database-The Database for Annotation, Visualization and Integrated Discovery (DAVID) v6.8 [17,18], 4. Protein-Protein Interaction Networks Functional Enrichment Analysis STRING.db (STRING, ver. 10.5) [19,20]. In order to improve the obtained network, functional partners (nodes) have been added using an implemented tool. The score of selected additional candidates was calculated based on parameters such as neighborhood, gene fusion, co-occurrence, coexpression, experiments, databases, textmining and homology provided in this tool.
Upregulated and downregulated genes in CDK1-silenced cell lines were analyzed separately. The total human gene set was used as a reference. Identified enrichments were considered significant when pathway False Discovery Rate (FDR) <0.05.
Additionally, interactions between proteins encoded by differentially expressed genes were analyzed using STRING database and genes encoding proteins for which a direct interaction with CDK1 was established were chosen for further analysis with RT-qPCR.
Verification of changes in the expression level of potential CDK1-dependent genes
The relative expression level of selected genes was analyzed with RT-qPCR in the same total RNA samples as used in the microarray analysis. The primer design and reaction conditions were identical to the presented above. Primer sequences, annealing temperatures, amplicon lengths and PCR reaction efficiency are listed in Table 2. At least 1.5-fold change in gene expression of the tested candidates in CDK1-silenced cell line as compared to control was assumed as a significant deregulation of their expression.
Software
All T-test calculations were performed using GraphPad online calculator www.graphpad.com/quickcalcs. Graphs presented in Figures 1, 2, 3, 5 and 6 were created using Microsoft Office Excel chart tool.
Figure 1.

siRNA mediated knockdown of CDK1 expression in LSCC cell lines (UT-SCC-34 and UT-SCC-107). Upper panel: relative gene expression measured with RT-qPCR; lower panel: CDK1 protein abundance analyzed with Western blot, GAPDH was used as a loading control. CDK1 knockdown: cell line transfected with the CDK1 silencing siRNA complex, Control siRNA: cell line transfected with scrambled siRNA duplexes.
Figure 2.
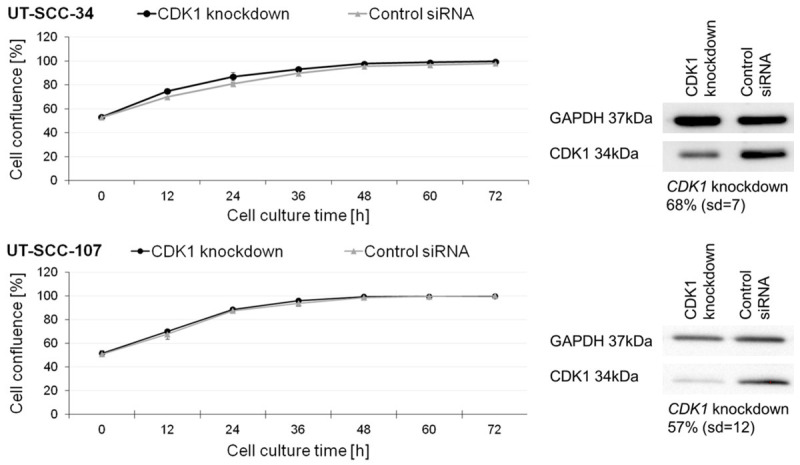
Proliferation of UT-SCC-34 and UT-SCC-107 cell lines transfected with CDK1 silencing siRNA (CDK1 knockdown) or control siRNA. Cell confluence in each well was measured every 12 hours. Right panel presents Western blot analysis indicating the decrease in CDK1 abundance in cells used for the analysis. GAPDH was used as a loading control.
Figure 3.

Cell viability of the UT-SCC-34 and UT-SCC-107 cell lines measured with the colorimetric assay - CCK8. Cells were transfected with CDK1 silencing siRNA (CDK1 knockdown) or control siRNA and cultured for 72 hours. Right panel: Western blot presenting the decrease in CDK1 abundance in cells used for the analysis. GAPDH was used as a loading control.
Figure 5.

Interactions among DEGs for which at least 2-fold change in gene expression was indicated in LSCC cell line with CDK1 knockdown. Protein network was downloaded from STRING (string-db.org). Disconnected nodes in the network were hidden, network edges show molecular action, minimum required interaction score: 0.400.
Figure 6.

Relative expression of genes chosen for RT-qPCR analysis, selected from genes with at least 2-fold change in relative expression level after CDK1 knockdown based on microarray gene expression analysis. UT-SCC-34 CDK1 knockdown, UT-SCC-107 CDK1 knockdown: cell lines transfected with CDK1-silencing siRNA; UT-SCC-34 Control siRNA, UT-SCC-107 Control siRNA: cell lines transfected with control siRNA.
Results
CDK1 expression is efficiently silenced with siRNA duplexes
The efficiency of CDK1 knockdown in samples used for microarray-based expression analysis was 82% in UT-SCC-34 and 64% UT-SCC-107 cell lines, as analyzed with RT-qPCR. The melting curve analysis confirmed the specificity of analyzed amplicon. The CDK1 protein level was decreased by 66% (sd=3) in UT-SCC-34 and 57% (sd=4) in UT-SCC-107 LSCC cell line (Figure 1). For both CDK1 and GAPDH proteins one band of the expected size was observed.
CDK1 silencing has no effect on cell proliferation and viability of LSCC cell lines
We observed lack of changes in the cell proliferation rate after CDK1 knockdown in both cell lines. In detail: mean proliferation rate of the UT-SCC-34 LSCC cell line with downregulated CDK1 was 41 (sd=9) and in the control cell line 43 (sd=3), whereas for the UT-SCC-107 cell line, the proliferation rate of cells transfected with CDK1 silencing siRNA was 51 (sd=1) and 47 (sd=2) for the control cells. These changes were not statistically significant. Both cell lines were re-analyzed to check whether the significant reduction in protein accumulation observed initially is retained. We confirmed that CDK1 was decreased by 68% (sd=7) in UT-SCC-34 and by 57% (sd=12) in UT-SCC-107 cell line, respectively (Figure 2).
Similarly, the cell viability assay showed lack of statistically significant differences between cells with CDK1 knockdown and the control. Mean viability of the UT-SCC-34 cell line determined 24, 48 and 72 hours after transfection was as follows: 86% (sd=13), 88% (sd=13) and 92% (sd=7). For UT-SCC-107 cell line the following values were obtained at the same time points: 91% (sd=3), 96% (sd=7), 102% (sd=13) (Figure 3). The re-analysis of the CDK1 level using Western blot showed a 75% (sd=11) reduction for UT-SCC-34 and 63% (sd=2) reduction for UT-SCC-107, respectively.
CDK1 silencing results in deregulation of expression of 137 genes
The observed lack of changes in cells viability and proliferation in CDK1-knockdown cell lines triggered us to further elucidate this finding. We made an attempt to point out genes that may be crucial for sustaining those cells physiologies.
We used microarray-based gene expression analysis to identify genes which are differentially expressed in CDK1-silenced cell lines. Among 54657 probe sets represented on the microarray, 22081 were significantly altered (probe set detection p-value <0.05). At least 2-fold change in signal value for particular probe set in CDK1-knockdown cell line as compared to control cell line was observed for 160 probe sets annotated to 137 genes (DEGs - differentially expressed genes). In case of 96 of these genes, the expression level was downregulated and in other 41 upregulated in CDK1-silenced cell line (Figure 4, detailed data available on request).
Figure 4.

Differentially expressed genes (>2-fold change) in CDK1-silenced cell lines, identified with microarray-based gene expression analysis. Expression of 96 genes was downregulated (green arrow) and 41 was upregulated (red arrow) in CDK1-silenced cell line as compared to control cell line.
CDK1 knockdown results in transcriptional deregulation of genes involved in two biological processes
After identification of DEGs potentially dependent on CDK1 we performed a functional enrichment analyzes to point out molecular function and biological processes in which those genes are involved. Using 96 downregulated DEGs as an input, we identified one pathway classified as a molecular function: protein binding (GO:0005515) using DAVID database (FDR 0.0044) and one biological process: mitotic nuclear division (GO:0007067) (STRING, FDR 0.0296). For GO Consortium and GOrilla databases lack of functional enrichments was indicated. Analysis of 41 genes upregulated in CDK1-silenced cell lines revealed only one biological process: transmembrane receptor protein tyrosine kinase signaling pathway (GO:0007169) (STRING, FDR 0.0061). For other three databases, no significant enrichments were found. Genes involved in all identified pathways are listed in Table 3. Those delineated pathways, especially the one involving the upregulated genes, potentially dependent on CDK1, may support maintaining unchanged cell viability and proliferation level after CDK1 depletion.
Table 3.
Functional enrichment analysis
| Pathway ID | Pathway description | FDR | Matching proteins/genes | Category | Database |
|---|---|---|---|---|---|
| GO:0007067 | Mitotic nuclear division | 0.0296 | CCNA2, CCNB1, CCNB2, CDK1, CHMP6, MYBL2, SAC3D1, SMARCA4, SMC1A, TADA3 | BP | STRING |
| GO:0007169 | Transmembrane receptor protein tyrosine kinase signaling pathway | 0.0061 | ATP6V1B1, ATP6V1C2, ATP6V1E2, CALM2, CDC42, CHN1, DOCK1, FGF12, FYN, NOG | BP | STRING |
| GO:0005515 | Protein binding | 0.0044 | RARRES3, FOSL2, CHMP6, WASF2, SHB, LONP2, ZNF397, PQBP1, CDK10, GLE1, DNAJC4, IFT27, CDK1, STX5, ZCCHC10, HIST1H1C, POLH, FLOT2, TRIM41, TLE2, NAPRT, TMEM67, ZNF747, WRAP53, NAB2, CTSD, GSTP1, SMARCA4, TADA3, ERBB2, SNX17, PPIL2, RNH1, NFYC, PRRC2A, NAGK, SESN2, MYBL2, CIC, ALDH3A1, GMPPB, OAZ3, PTK2, SAC3D1, RUNX1, MYO1C, L3MBTL2, LGALS1, HIST1H2BG, PPP1R11, ABHD14B, ID1, POLDIP3, RAB34, TSC2, SMC1A, HIST1H2AM, PHYKPL | MF | DAVID |
Biological processes (BP) and molecular function (MF) identified with the application of bioinformatic tools (DAVID, STRING). FDR: False Discovery Rate. Underscored genes were predicted by STRING algorithm as potential functional partners for the current network.
Expression of CALD1, CDK6 and FYN is potentially dependent on CDK1
To investigate associations of CDK1 with deregulated genes, all the 137 DEGs were used as an input for the analysis of protein-protein interaction network based on STRING. This approach revealed 11 genes: CALD1, CDC42, CDK6, FYN, HIST1H1C, MYBL2, RUNX1, SMARCA4, SMC1A, TMEM67, TSC2 encoding proteins for which direct interactions with CDK1 are known (Figure 5). We decided to re-analyze the expression level of genes encoding those proteins using RT-qPCR. This group consisted of 4 genes: CALD1, CDC42, CDK6, FYN with increased and 7 genes: HIST1H1C, MYBL2, RUNX1, SMARCA4, SMC1A, TMEM67 and TSC2 with decreased expression level in LSCC cell lines after CDK1 silencing (Figure 6).
Observed gene expression deregulation was confirmed with RT-qPCR only for CALD1, CDK6 and FYN. For these genes, over 1.5-fold higher expression level were observed in CDK1-knockdown cell line as compared to control cell line, and was as follows: for CALD1: 1.8-fold in UT-SCC-107 and 3.2-fold in UT-SCC-34, for CDK6: 1.7-fold in UT-SCC-107 and 2.6-fold in UT-SCC-34, for FYN: 1.7-fold in UT-SCC-107 and 2.6-fold in UT-SCC-34 cell lines. We did not confirm the microarray results for the other 8 genes (Figure 7). This suggests that increased expression of CALD1, CDK6 and FYN may act to compensate for the reduced expression of CDK1.
Figure 7.

Relative gene expression fold change (RT-qPCR) in two LSCC cell lines (UT-SCC-34 and UT-SCC-107) after CDK1 knockdown. Horizontal lines show the values equal to 1.5-fold change of expression. Gene expression fold change exceeding the dotted line indicates increase of its expression, while gene expression fold change below the dashed line indicates its decreased expression level after CDK1 silencing.
Discussion
CDK1 was shown to be overexpressed in different types of cancer, including oral squamous cell carcinoma, breast cancer and epithelial ovarian cancer [21-23]. In our previous publication we presented data showing its upregulation in laryngeal squamous cell carcinoma [3,11]. Here, we expand the scope of research on the role of CDK1 in LSCC by performing gene knockdown experiments.
The first part of our study was focused on the analysis of cell proliferation and viability after CDK1 silencing. We showed that despite significant downregulation of gene expression on both, mRNA and protein levels, no effect on cancer cells growth was observed. This surprising finding has several potential explanations. It might suggest that even significantly decreased level of CDK1 is sufficient to sustain an unchanged cell proliferation rate in cancer cells. It must be however noticed that the cell lines used in the functional assays harbor several alterations that might contribute to the observed independence from CDK1 and other cell cycle regulating proteins. For example, these include deletions of RB1 (UT-SCC-34) and CDKN2A (p16) (UT-SCC-107) - potent negative regulators of the cell cycle [12].
By using a functional enrichment analyzes we showed that genes downregulated after CDK1 silencing are involved in mitotic nuclear division pathway (GO:0007067). However, the obtained results indicate, that this change of gene expression is insufficient to limit cell proliferation and viability. Furthermore, the same analysis revealed that genes upregulated in CDK1-silenced cell lines are engaged in transmembrane receptor protein tyrosine kinase signaling pathway (GO:0007169). Receptor protein kinases (RTKs) are key role players in cellular processes like growth, motility and differentiation. Genomic amplification and resulting overexpression is one of the principal mechanisms leading to constitutive RTKs activation and induce oncogenesis [24,25]. Overexpression of several RTKs was shown in a variety of most abundant cancers, for example HER2/ErbB2 in breast cancer [26], MET in gastric cancer [27] or EGFR in esophageal [28]. Thus, a change in expression of downregulated and upregulated genes involved in the identified pathways may have mutually counteracting effect.
Another potential explanation involves the CDK6 kinase, the FYN oncogene and to some extend the CALD1 gene upregulated in consequence of CDK1 silencing that might exhibit a yet poorly understood compensative function. CDK6 (Cell division protein kinase 6) and FYN (FYN Proto-Oncogene, Src Family Tyrosine Kinase) encode kinase proteins. CDK6, together with cyclin-D, forms a protein complex important for cell cycle G1 phase progression and G1/S transition. The main role of this complex involves the phosphorylation of tumor suppressor protein RB1 leading to its inactivation. As a result, the cell may enter the S phase of the cell cycle [29,30]. CDK6 overexpression was demonstrated in solid tumors including head and neck cancer, where it may be associated with advanced tumor stage [31,32]. It was also shown to promote resistance to estrogen receptor and CDK4/6 inhibitors in breast cancer [33]. FYN protein - a membrane-associated tyrosine kinase - is located in the meiotic and mitotic spindle microtubules and facilitates mitotic spindle formation through the increase of microtubule polymerization. As a result, the M-phase progression accelerates [34]. It was shown, that during mitosis, FYN binds to active CDK1 [35], thus confirming the direct protein-protein interaction. This protein was demonstrated to control several cancer related cell processes, like: growth, proliferation, migration, invasion and adhesion [36,37]. Overexpression of this gene was shown in prostate cancer [38] and in breast cancer cell lines, where it has been further linked with decreased tamoxifen sensitivity [39]. In turn, the function of CALD1 (Caldesmon 1) is related to cell motility and proliferation via reorganization of the actin cytoskeleton [40]. Overexpression of the gene in OSCC cell lines promotes cellular migration and invasion, and positively correlates with tumor progression and metastasis in OSCC patients [41]. Moreover, high expression of CALD1 protein was associated with faster disease progression after tamoxifen treatment and with poor outcome of patients with recurrent estrogen receptor (ER) positive breast cancer [42].
We have overlooked the role of other genes involved in abovementioned pathways in crucial vital functions of a cell. We focused on potential role of these genes in HNSCC growth, metastasis and angiogenesis. Among nine analyzed genes we found two, for which involvement in HNSCC development was previously described. CDC42 (a small GTPase of the Rho-subfamily) regulates signaling pathways, e.g. cell morphology, migration, endocytosis and cell cycle progression. In HNSCC the gene is engaged in migration and invasion of cells via CCR7-PI3K pathway, triggered by CCRL7 ligand: CCL19 [43]. A potential tumor suppressor gene TSC2 is a negative regulator of PI3K/AKT pathway: TSC1-TSC2 complex acts to limit cellular proliferation and growth. Its ERK-mediated phosphorylation leads to gene inactivation resulting in enhanced mTORC1 activity and promotes HNSCC cell proliferation and survival [44].
The remaining genes have not been connected with HNSCC development so far. However, most of them are involved in the basic processes that take place in the cells, including cell proliferation. Two genes are engaged in chromatin remodeling. HIST1H1C encodes a replication-dependent histone that is a member of the histone H1 family, responsible for folding the polynucleosome chain into interphase chromosomes [45], while SMARCA4 plays a role in transcriptional activation and repression of selected genes what result from its helicase and ATPase activity [46]. Other gene, SMC1A is a part of cohesin multiprotein complex, forming a functional kinetochores, enabling proper pairing of the two sister chromatids and segregation of chromosomes during cell division [47]. Genes encoding transcription factors - RUNX1 and MYBL2 - were also found in the analyzed group.
Taking together, in the current study we have analyzed the role of CDK1 in laryngeal cancer. We have demonstrated that the analyzed LSCC cell lines are remarkably tolerant towards siRNA mediated CDK1 knockdown, as no effect on LSCC cell line proliferation and viability was observed upon silencing. Moreover, we pointed out genes which expression may depend on CDK1 abundance and hypothesize that CDK6, CALD1 and FYN may compensate for CDK1 deficiency and maintain unchanged proliferation rate and viability of the LSCC cancer cells. Therefore, CDK1 should not be recommended as a potential target gene in LSCC therapy.
Acknowledgements
This study was supported by the Polish National Science Center grant: 2013/11/N/NZ2/02483 to Kinga Bednarek.
Disclosure of conflict of interest
None.
References
- 1.Malumbres M, Barbacid M. Cell cycle, CDKs and cancer: a changing paradigm. Nat Rev Cancer. 2009;9:153–166. doi: 10.1038/nrc2602. [DOI] [PubMed] [Google Scholar]
- 2.Eggersmann TK, Degenhardt T, Gluz O, Wuerstlein R, Harbeck N. CDK4/6 inhibitors expand the therapeutic options in breast cancer: palbociclib, ribociclib and abemaciclib. BioDrugs. 2019;33:125–135. doi: 10.1007/s40259-019-00337-6. [DOI] [PubMed] [Google Scholar]
- 3.Bednarek K, Kiwerska K, Szaumkessel M, Bodnar M, Kostrzewska-Poczekaj M, Marszalek A, Janiszewska J, Bartochowska A, Jackowska J, Wierzbicka M, Grenman R, Szyfter K, Giefing M, Jarmuz-Szymczak M. Recurrent CDK1 overexpression in laryngeal squamous cell carcinoma. Tumour Biol. 2016;37:11115–11126. doi: 10.1007/s13277-016-4991-4. [DOI] [PMC free article] [PubMed] [Google Scholar]
- 4.Santamaría D, Barrière C, Cerqueira A, Hunt S, Tardy C, Newton K, Cáceres JF, Dubus P, Malumbres M, Barbacid M. Cdk1 is sufficient to drive the mammalian cell cycle. Nature. 2007;448:811–815. doi: 10.1038/nature06046. [DOI] [PubMed] [Google Scholar]
- 5.Diril MK, Ratnacaram CK, Padmakumar VC, Du T, Wasser M, Coppola V, Tessarollo L, Kaldis P. Cyclin-dependent kinase 1 (Cdk1) is essential for cell division and suppression of DNA re-replication but not for liver regeneration. Proc Natl Acad Sci U S A. 2012;109:3826–3831. doi: 10.1073/pnas.1115201109. [DOI] [PMC free article] [PubMed] [Google Scholar]
- 6.Kang J, Sergio CM, Sutherland RL, Musgrove EA. Targeting cyclin-dependent kinase 1 (CDK1) but not CDK4/6 or CDK2 is selectively lethal to MYC-dependent human breast cancer cells. BMC Cancer. 2014;14:32. doi: 10.1186/1471-2407-14-32. [DOI] [PMC free article] [PubMed] [Google Scholar]
- 7.Liu Y, Zhu YH, Mao CQ, Dou S, Shen S, Tan ZB, Wang J. Triple negative breast cancer therapy with CDK1 siRNA delivered by cationic lipid assisted PEG-PLA nanoparticles. J Control Release. 2014;192:114–121. doi: 10.1016/j.jconrel.2014.07.001. [DOI] [PubMed] [Google Scholar]
- 8.Xiao H, Tian M, Ge J, Wei X, Li Z, Li X, Tao D, Hu J, Gong J. The role of CDK1 siRNA interference in cell cycle and cell apoptosis. Front Med China. 2009;3:384. [Google Scholar]
- 9.Jarmuz M, Grenman R, Golusinski W, Szyfter K. Aberrations of 11q13 in laryngeal squamous cell lines and their prognostic significance. Cancer Genet Cytogenet. 2005;160:82–88. doi: 10.1016/j.cancergencyto.2004.12.006. [DOI] [PubMed] [Google Scholar]
- 10.Chomczynski P, Sacchi N. The single-step method of RNA isolation by acid guanidinium thiocyanate-phenol-chloroform extraction: twenty-something years on. Nat Protoc. 2006;1:581–585. doi: 10.1038/nprot.2006.83. [DOI] [PubMed] [Google Scholar]
- 11.Bednarek K. The contribution of selected genes in laryngeal squamous cell carcinoma (LSCC) pathogenesis, regarding their oncogenic or suppressive potential. Dissertation. Instytut Genetyki Człowieka PAN; 2018. [Google Scholar]
- 12.Giefing M, Zemke N, Brauze D, Kostrzewska-Poczekaj M, Luczak M, Szaumkessel M, Pelinska K, Kiwerska K, Tönnies H, Grenman R, Figlerowicz M, Siebert R, Szyfter K, Jarmuz M. High resolution ArrayCGH and expression profiling identifies PTPRD and PCDH17/PCH68 as tumor suppressor gene candidates in laryngeal squamous cell carcinoma. Genes Chromosomes Cancer. 2011;50:154–66. doi: 10.1002/gcc.20840. [DOI] [PubMed] [Google Scholar]
- 13.Jarmuz-Szymczak M, Pelinska K, Kostrzewska-Poczekaj M, Bembnista E, Giefing M, Brauze D, Szaumkessel M, Marszalek A, Janiszewska J, Kiwerska K, Bartochowska A, Grenman R, Szyfter W, Szyfter K. Heterogeneity of 11q13 region rearrangements in laryngeal squamous cell carcinoma analyzed by microarray platforms and fluorescence in situ hybridization. Mol Biol Rep. 2013;40:4161–4171. doi: 10.1007/s11033-013-2496-4. [DOI] [PubMed] [Google Scholar]
- 14.Ashburner M, Ball CA, Blake JA, Botstein D, Butler H, Cherry JM, Davis AP, Dolinski K, Dwight SS, Eppig JT, Harris MA, Hill DP, Issel-Tarver L, Kasarskis A, Lewis S, Matese JC, Richardson JE, Ringwald M, Rubin GM, Sherlock G. Gene ontology: tool for the unification of biology. Nat Genet. 2000;25:25–29. doi: 10.1038/75556. [DOI] [PMC free article] [PubMed] [Google Scholar]
- 15.Eden E, Lipson D, Yogev S, Yakhini Z. Discovering motifs in ranked lists of DNA sequences. PLoS Comput Biol. 2007;3:e39. doi: 10.1371/journal.pcbi.0030039. [DOI] [PMC free article] [PubMed] [Google Scholar]
- 16.Eden E, Navon R, Steinfeld I, Lipson D, Yakhini Z. GOrilla: a tool for discovery and visualization of enriched GO terms in ranked gene lists. BMC Bioinformatics. 2009;10:48. doi: 10.1186/1471-2105-10-48. [DOI] [PMC free article] [PubMed] [Google Scholar]
- 17.Huang DW, Sherman BT, Lempicki RA. Systematic and integrative analysis of large gene lists using DAVID bioinformatics resources. Nat Protoc. 2009;4:44–57. doi: 10.1038/nprot.2008.211. [DOI] [PubMed] [Google Scholar]
- 18.Huang DW, Sherman BT, Lempicki RA. Bioinformatics enrichment tools: paths toward the comprehensive functional analysis of large gene lists. Nucleic Acids Res. 2009;37:1–13. doi: 10.1093/nar/gkn923. [DOI] [PMC free article] [PubMed] [Google Scholar]
- 19.Szklarczyk D, Franceschini A, Kuhn M, Simonovic M, Roth A, Minguez P, Doerks T, Stark M, Muller J, Bork P, Jensen LJ, von Mering C. The STRING database in 2011: functional interaction networks of proteins, globally integrated and scored. Nucleic Acids Res. 2011;39:D561–568. doi: 10.1093/nar/gkq973. [DOI] [PMC free article] [PubMed] [Google Scholar]
- 20.Szklarczyk D, Franceschini A, Wyder S, Forslund K, Heller D, Huerta-Cepas J, Simonovic M, Roth A, Santos A, Tsafou KP, Kuhn M, Bork P, Jensen LJ, von Mering C. STRING v10: protein-protein interaction networks, integrated over the tree of life. Nucleic Acids Res. 2015;43:D447–452. doi: 10.1093/nar/gku1003. [DOI] [PMC free article] [PubMed] [Google Scholar]
- 21.Chang JT, Wang HM, Chang KW, Chen WH, Wen MC, Hsu YM, Yung BY, Chen IH, Liao CT, Hsieh LL, Cheng AJ. Identification of differentially expressed genes in oral squamous cell carcinoma (OSCC): overexpression of NPM, CDK1 and NDRG1 and underexpression of CHES1. Int J Cancer. 2005;114:942–949. doi: 10.1002/ijc.20663. [DOI] [PubMed] [Google Scholar]
- 22.Chae SW, Sohn JH, Kim DH, Choi YJ, Park YL, Kim K, Cho YH, Pyo JS, Kim JH. Overexpressions of Cyclin B1, cdc2, p16 and p53 in human breast cancer: the clinicopathologic correlations and prognostic implications. Yonsei Med J. 2011;52:445–453. doi: 10.3349/ymj.2011.52.3.445. [DOI] [PMC free article] [PubMed] [Google Scholar]
- 23.Xi Q, Huang M, Wang Y, Zhong J, Liu R, Xu G, Jiang L, Wang J, Fang Z, Yang S. The expression of CDK1 is associated with proliferation and can be a prognostic factor in epithelial ovarian cancer. Tumor Biol. 2015;36:4939–4948. doi: 10.1007/s13277-015-3141-8. [DOI] [PubMed] [Google Scholar]
- 24.McDonell LM, Kernohan KD, Boycott KM, Sawyer SL. Receptor tyrosine kinase mutations in developmental syndromes and cancer: two sides of the same coin. Hum Mol Genet. 2015;24:R60–66. doi: 10.1093/hmg/ddv254. [DOI] [PMC free article] [PubMed] [Google Scholar]
- 25.Du Z, Lovly CM. Mechanisms of receptor tyrosine kinase activation in cancer. Mol Cancer. 2018;17:58. doi: 10.1186/s12943-018-0782-4. [DOI] [PMC free article] [PubMed] [Google Scholar]
- 26.Yaziji H, Goldstein LC, Barry TS, Werling R, Hwang H, Ellis GK, Gralow JR, Livingston RB, Gown AM. HER-2 testing in breast cancer using parallel tissue-based methods. JAMA. 2004;291:1972–1977. doi: 10.1001/jama.291.16.1972. [DOI] [PubMed] [Google Scholar]
- 27.Xu L, Nilsson MB, Saintigny P, Cascone T, Herynk MH, Du Z, Nikolinakos PG, Yang Y, Prudkin L, Liu D, Lee JJ, Johnson FM, Wong KK, Girard L, Gazdar AF, Minna JD, Kurie JM, Wistuba II, Heymach JV. Epidermal growth factor receptor regulates MET levels and invasiveness through hypoxia-inducible factor-1alpha in non-small cell lung cancer cells. Oncogene. 2010;29:2616–2627. doi: 10.1038/onc.2010.16. [DOI] [PMC free article] [PubMed] [Google Scholar]
- 28.Hanawa M, Suzuki S, Dobashi Y, Yamane T, Kono K, Enomoto N, Ooi A. EGFR protein overexpression and gene amplification in squamous cell carcinomas of the esophagus. Int J Cancer. 2006;118:1173–1180. doi: 10.1002/ijc.21454. [DOI] [PubMed] [Google Scholar]
- 29.Narasimha AM, Kaulich M, Shapiro GS, Choi YJ, Sicinski P, Dowdy SF. Cyclin D activates the Rb tumor suppressor by mono-phosphorylation. ELife. 2014;3:e02872. doi: 10.7554/eLife.02872. [DOI] [PMC free article] [PubMed] [Google Scholar]
- 30.Sherr CJ, Beach D, Shapiro GI. Targeting CDK4 and CDK6: from discovery to therapy. Cancer Discov. 2016;6:353–367. doi: 10.1158/2159-8290.CD-15-0894. [DOI] [PMC free article] [PubMed] [Google Scholar]
- 31.Poomsawat S, Sanguansin S, Punyasingh J, Vejchapipat P, Punyarit P. Expression of cdk6 in head and neck squamous cell carcinoma. Clin Oral Invest. 2016;20:57–63. doi: 10.1007/s00784-015-1482-8. [DOI] [PubMed] [Google Scholar]
- 32.Andisheh-Tadbir A, Ashraf MJ, Jeiroodi N. Expression of CDK6 in oral squamous cell carcinomas. Asian Pac J Cancer Prev. 2018;19:1013–1016. doi: 10.22034/APJCP.2018.19.4.1013. [DOI] [PMC free article] [PubMed] [Google Scholar]
- 33.Yang C, Li Z, Bhatt T, Dickler M, Giri D, Scaltriti M, Baselga J, Rosen N, Chandarlapaty S. Acquired CDK6 amplification promotes breast cancer resistance to CDK4/6 inhibitors and loss of ER signaling and dependence. Oncogene. 2017;36:2255–2264. doi: 10.1038/onc.2016.379. [DOI] [PMC free article] [PubMed] [Google Scholar]
- 34.Okamoto M, Nakayama Y, Kakihana A, Yuki R, Yamaguchi N, Yamaguchi N. Fyn accelerates M phase progression by promoting the assembly of mitotic spindle microtubules. J Cell Biochem. 2016;117:894–903. doi: 10.1002/jcb.25373. [DOI] [PubMed] [Google Scholar]
- 35.Pathan NI, Geahlen RL, Harrison ML. The Protein-tyrosine kinase Lck Associates with and is phosphorylated by Cdc2*. J Biol Chem. 1996;271:27517–27523. doi: 10.1074/jbc.271.44.27517. [DOI] [PubMed] [Google Scholar]
- 36.Brown MT, Cooper JA. Regulation, substrates and functions of src. Biochimica Et Biophysica Acta. 1996;1287:121–149. doi: 10.1016/0304-419x(96)00003-0. [DOI] [PubMed] [Google Scholar]
- 37.Sen B, Johnson FM. Regulation of SRC family kinases in human cancers. J Signal Transduct. 2011;2011:865819. doi: 10.1155/2011/865819. [DOI] [PMC free article] [PubMed] [Google Scholar]
- 38.Posadas EM, Al-Ahmadie H, Robinson VL, Jagadeeswaran R, Otto K, Kasza KE, Tretiakov M, Siddiqui J, Pienta KJ, Stadler WM, Rinker-Schaeffer C, Salgia R. FYN is overexpressed in human prostate cancer. BJU Int. 2009;103:171–177. doi: 10.1111/j.1464-410X.2008.08009.x. [DOI] [PMC free article] [PubMed] [Google Scholar]
- 39.Elias D, Vever H, Lænkholm AV, Gjerstorff MF, Yde CW, Lykkesfeldt AE, Ditzel HJ. Gene expression profiling identifies FYN as an important molecule in tamoxifen resistance and a predictor of early recurrence in patients treated with endocrine therapy. Oncogene. 2015;34:1919–1927. doi: 10.1038/onc.2014.138. [DOI] [PubMed] [Google Scholar]
- 40.Mayanagi T, Sobue K. Diversification of caldesmon-linked actin cytoskeleton in cell motility. Cell Adh Migr. 2011;5:150–159. doi: 10.4161/cam.5.2.14398. [DOI] [PMC free article] [PubMed] [Google Scholar]
- 41.Chang KP, Wang CL, Kao HK, Liang Y, Liu SC, Huang LL, Hseuh C, Hsieh YJ, Chien KY, Chang YS, Yu JS, Chi LM. Overexpression of caldesmon is associated with lymph node metastasis and poorer prognosis in patients with oral cavity squamous cell carcinoma. Cancer. 2013;119:4003–4011. doi: 10.1002/cncr.28300. [DOI] [PubMed] [Google Scholar]
- 42.De Marchi T, Timmermans AM, Smid M, Look MP, Stingl C, Opdam M, Linn SC, Sweep FCGJ, Span PN, Kliffen M, van Deurzen CHM, Luider TM, Foekens JA, Martens JW, Umar A. Annexin-A1 and caldesmon are associated with resistance to tamoxifen in estrogen receptor positive recurrent breast cancer. Oncotarget. 2015;7:3098–3110. doi: 10.18632/oncotarget.6521. [DOI] [PMC free article] [PubMed] [Google Scholar]
- 43.Zhao ZJ, Liu FY, Li P, Ding X, Zong ZH, Sun CF. CCL19-induced chemokine receptor 7 activates the phosphoinositide-3 kinase-mediated invasive pathway through Cdc42 in metastatic squamous cell carcinoma of the head and neck. Oncol Rep. 2011;25:729–737. doi: 10.3892/or.2010.1109. [DOI] [PubMed] [Google Scholar]
- 44.Ruicci KM, Pinto N, Khan MI, Yoo J, Fung K, MacNeil D, Mymryk JS, Barrett JW, Nichols AC. ERK-TSC2 signalling in constitutively-active HRAS mutant HNSCC cells promotes resistance to PI3K inhibition. Oral Oncol. 2018;84:95–103. doi: 10.1016/j.oraloncology.2018.07.010. [DOI] [PubMed] [Google Scholar]
- 45.Th’ng JPH, Sung R, Ye M, Hendzel MJ. H1 family histones in the nucleus. Control of binding and localization by the C-terminal domain. J Biol Chem. 2005;280:27809–27814. doi: 10.1074/jbc.M501627200. [DOI] [PubMed] [Google Scholar]
- 46.Peterson CL. Chromatin remodeling: nucleosomes bulging at the seams. Curr Biol. 2002;12:R245–247. doi: 10.1016/s0960-9822(02)00782-0. [DOI] [PubMed] [Google Scholar]
- 47.Gregson HC, Van Hooser AA, Ball AR, Brinkley BR, Yokomori K. Localization of human SMC1 protein at kinetochores. Chromosome Res. 2002;10:267–277. doi: 10.1023/a:1016563523208. [DOI] [PubMed] [Google Scholar]