

SUMMARY
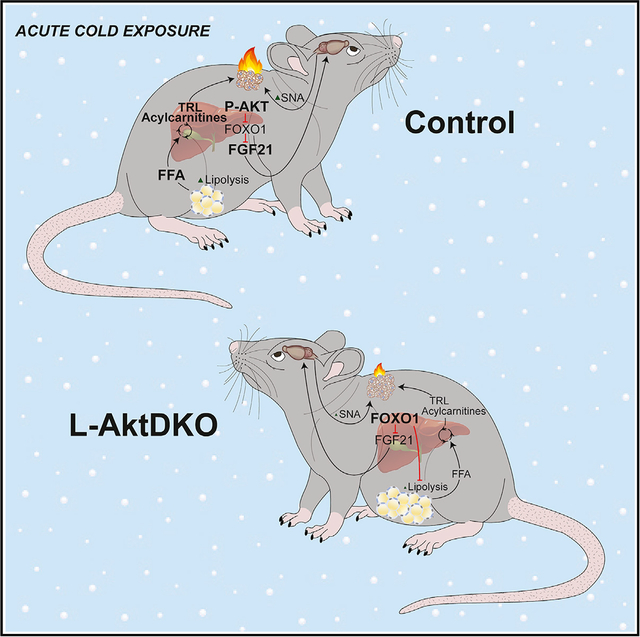
Organismal stressors such as cold exposure require a systemic response to maintain body temperature. Brown adipose tissue (BAT) is a key thermogenic tissue in mammals that protects against hypothermia in response to cold exposure. Defining the complex interplay of multiple organ systems in this response is fundamental to our understanding of adipose tissue thermogenesis. In this study, we identify a role for hepatic insulin signaling via AKT in the adaptive response to cold stress and show that liver AKT is an essential cell-nonautonomous regulator of adipocyte lipolysis and BAT function. Mechanistically, inhibition of forkhead box O1 (FOXO1) by AKT controls BAT thermogenesis by enhancing catecholamine-induced lipolysis in the white adipose tissue (WAT) and increasing circulating fibroblast growth factor 21 (FGF21). Our data identify a role for hepatic insulin signaling via the AKT-FOXO1 axis in regulating WAT lipolysis, promoting BAT thermogenic capacity, and ensuring a proper thermogenic response to acute cold exposure.
Graphical abstract
In brief
Maintaining body temperature upon cold stress is necessary for mammalian survival. Sostre-Colón et al. show that hepatic insulin action via AKT-FOXO1 regulates the thermogenic response, providing fundamental knowledge of the liver’s response to cold exposure and to our understanding of the inter-organ communication that mobilizes energy for heat production.
INTRODUCTION
The ability to maintain body temperature is essential for mammalian survival. Upon an organismal stressor such as cold exposure, mammals increase heat production by both shivering and non-shivering thermogenesis, where the brown adipose tissue (BAT) serves as the major site for cold-induced non-shivering thermogenesis (Cannon and Nedergaard, 2004). BAT uses multiple substrates to convert chemical energy to heat via the highly enriched mitochondrial uncoupling protein 1 (UCP1), a hallmark of brown adipocytes. UCP1 resides within the mitochondrial inner membrane of brown adipocytes, and, when activated, UCP1 dissipates the proton gradient generated, increasing electron transport chain activity and heat production (Jacobsson et al., 1985).
Upon cold exposure, the sympathetic nervous system (SNS) triggers the release of the catecholamine norepinephrine (NE), which acts on β-adrenergic receptors on adipocytes to stimulate the production of cyclic adenosine monophosphate (cAMP) and activation of protein kinase A (PKA) (Bartness et al., 2010; Morrison et al., 2012). Once activated, PKA coordinates a host of metabolic actions, including glucose and lipid uptake in BAT to promote non-shivering thermogenesis (Smith and Horwitz, 1969; Himms-Hagen, 1976; Cannon and Nedergaard, 2004; Heine et al., 2018). Moreover, PKA signaling induces lipolysis in the white adipose tissue (WAT) by stimulating the cAMP/PKA-dependent phosphorylation of hormone-sensitive lipase (HSL) and perilipin (Egan et al., 1992; Zechner et al., 2012). Even though cold exposure increases intra-BAT lipolysis (Cannon and Nedergaard, 2004), this process is not required for the thermogenic response. Rather, WAT lipolysis is necessary to provide free fatty acids (FFAs) to fuel the thermogenic response upon cold exposure when exogenous nutrients are limiting (Schreiber et al., 2017; Shin et al., 2017).
In addition to the cell-autonomous control of adipocyte function and activity, the liver is an important systemic regulator of carbohydrate and lipid homeostasis. Central to liver metabolic function is the insulin-dependent activation of protein kinase B, also known as AKT. Three AKT isoforms exist in mammalian systems (AKT1, AKT2, and AKT3); however, AKT1 and AKT2 are the dominant functional isoforms in insulin-responsive metabolic tissues such as muscle, adipose tissue, and liver, while AKT3 is mainly expressed in the brain and testis (Walker et al., 1998; Cho et al., 2001; Easton et al., 2005; Lu et al., 2012; Shearin et al., 2016; Jaiswal et al., 2019). Upon insulin stimulation, AKT is activated in a phosphatidylinositol 3-kinase (PI3K)-dependent manner (Burgering and Coffer, 1995; Manning and Toker, 2017). One of the major downstream targets of AKT is the family of forkhead box O (FOXO) transcription factors, in which phosphorylation by AKT causes acute translocation of FOXO proteins from the nucleus into the cytoplasm, thus inhibiting the FOXO transcriptional program (Brunet et al., 1999; Kops et al., 1999). This AKT-dependent inhibition of FOXO is central to the control of hepatic lipid synthesis and glucose production (Titchenell et al., 2017). Moreover, insulin inactivation of FOXO1, the main isoform of the FOXO family in the liver, is necessary for cell-nonautonomous control of hepatic glucose production via enhancing insulin sensitivity in the WAT (O-Sullivan et al., 2015; Perry et al., 2015; Titchenell et al., 2015, 2016; Tao et al., 2018).
In addition to cell-intrinsic signaling mechanisms, hepatokines, in particular, fibroblast growth factor 21 (FGF21), are important regulators of peripheral metabolism (BonDurant and Potthoff, 2018). FGF21 signals through the cell-surface FGF receptor 1c (FGFR1c) isoform and its co-receptor β-klotho, a single-pass transmembrane protein (Ogawa et al., 2007; Kharitonenkov et al., 2008; Suzuki et al., 2008; Ding et al., 2012). FGF21 activation of the FGFR1c/β-klotho complex leads to several signaling events, including the phosphorylation of FGFR substrate 2α and phosphorylation of the Raf-1 and extra-cellular signal-regulated kinases (ERK1/2) (Kharitonenkov et al., 2005; Ogawa et al., 2007). In rodents, cold exposure induces Fgf21 gene expression in BAT, iWAT, and liver, while in humans, cold exposure increases circulating FGF21 levels (Lee et al., 2013; Huang et al., 2017; Ameka et al., 2019; Hollstein et al., 2020). Recent studies suggest that hepatic FGF21 also stimulates BAT activity via central brain action, which in turn increases sympathetic nerve activity (SNA) in BAT (Ameka et al., 2019).
Recent work demonstrates that during acute cold exposure, FFAs are liberated from the WAT and lead to the generation of liver-derived acylcarnitines and triglyceride-rich lipoproteins (TRL) that are important stimulators of the BAT thermogenic response (Simcox et al., 2017; Heine et al., 2018). However, significant gaps remain in our understanding of how the generation of these circulating substrates are coordinated and to what extent the liver is involved in orchestrating this response. New evidence indicates that insulin levels rise during acute cold exposure (Heine et al., 2018), leading us to hypothesize that hepatic insulin action is an important integrator of the systemic response to cold. In this study, we uncover a role for hepatic insulin signaling via the AKT-FOXO1 axis in regulating WAT lipolysis, maintaining BAT thermogenic capacity, and ensuring a proper thermogenic response to prolonged fasting and acute cold exposure.
RESULTS
Hepatic AKT regulates BAT thermogenic capacity
Insulin rises 2-fold and is required for the thermogenic response to acute cold exposure (Heine et al., 2018). Given that hepatic insulin signaling is central to the systemic effects of insulin, we assessed liver insulin signaling by measuring AKT activation in response to acute cold exposure in mice. Phosphorylation of AKT at Ser473/474 was significantly increased within 30 min of cold exposure (Figure 1A). In addition, a single injection of CL-316,243 (CL) (1 mg/kg), a selective β3-adrenergic receptor agonist known to pharmacologically mimic cold exposure (Bloom et al., 1992; Cannon and Nedergaard, 2004), stimulated robust AKT phosphorylation in liver (Figure 1A). Notably, this activation of AKT led to a functional increase in AKT signaling as shown by increased phosphorylation of the downstream marker ribosomal protein S6 at Ser240/244 (Figure 1A).
Figure 1. The loss of liver AKT reduces BAT thermogenic capacity.
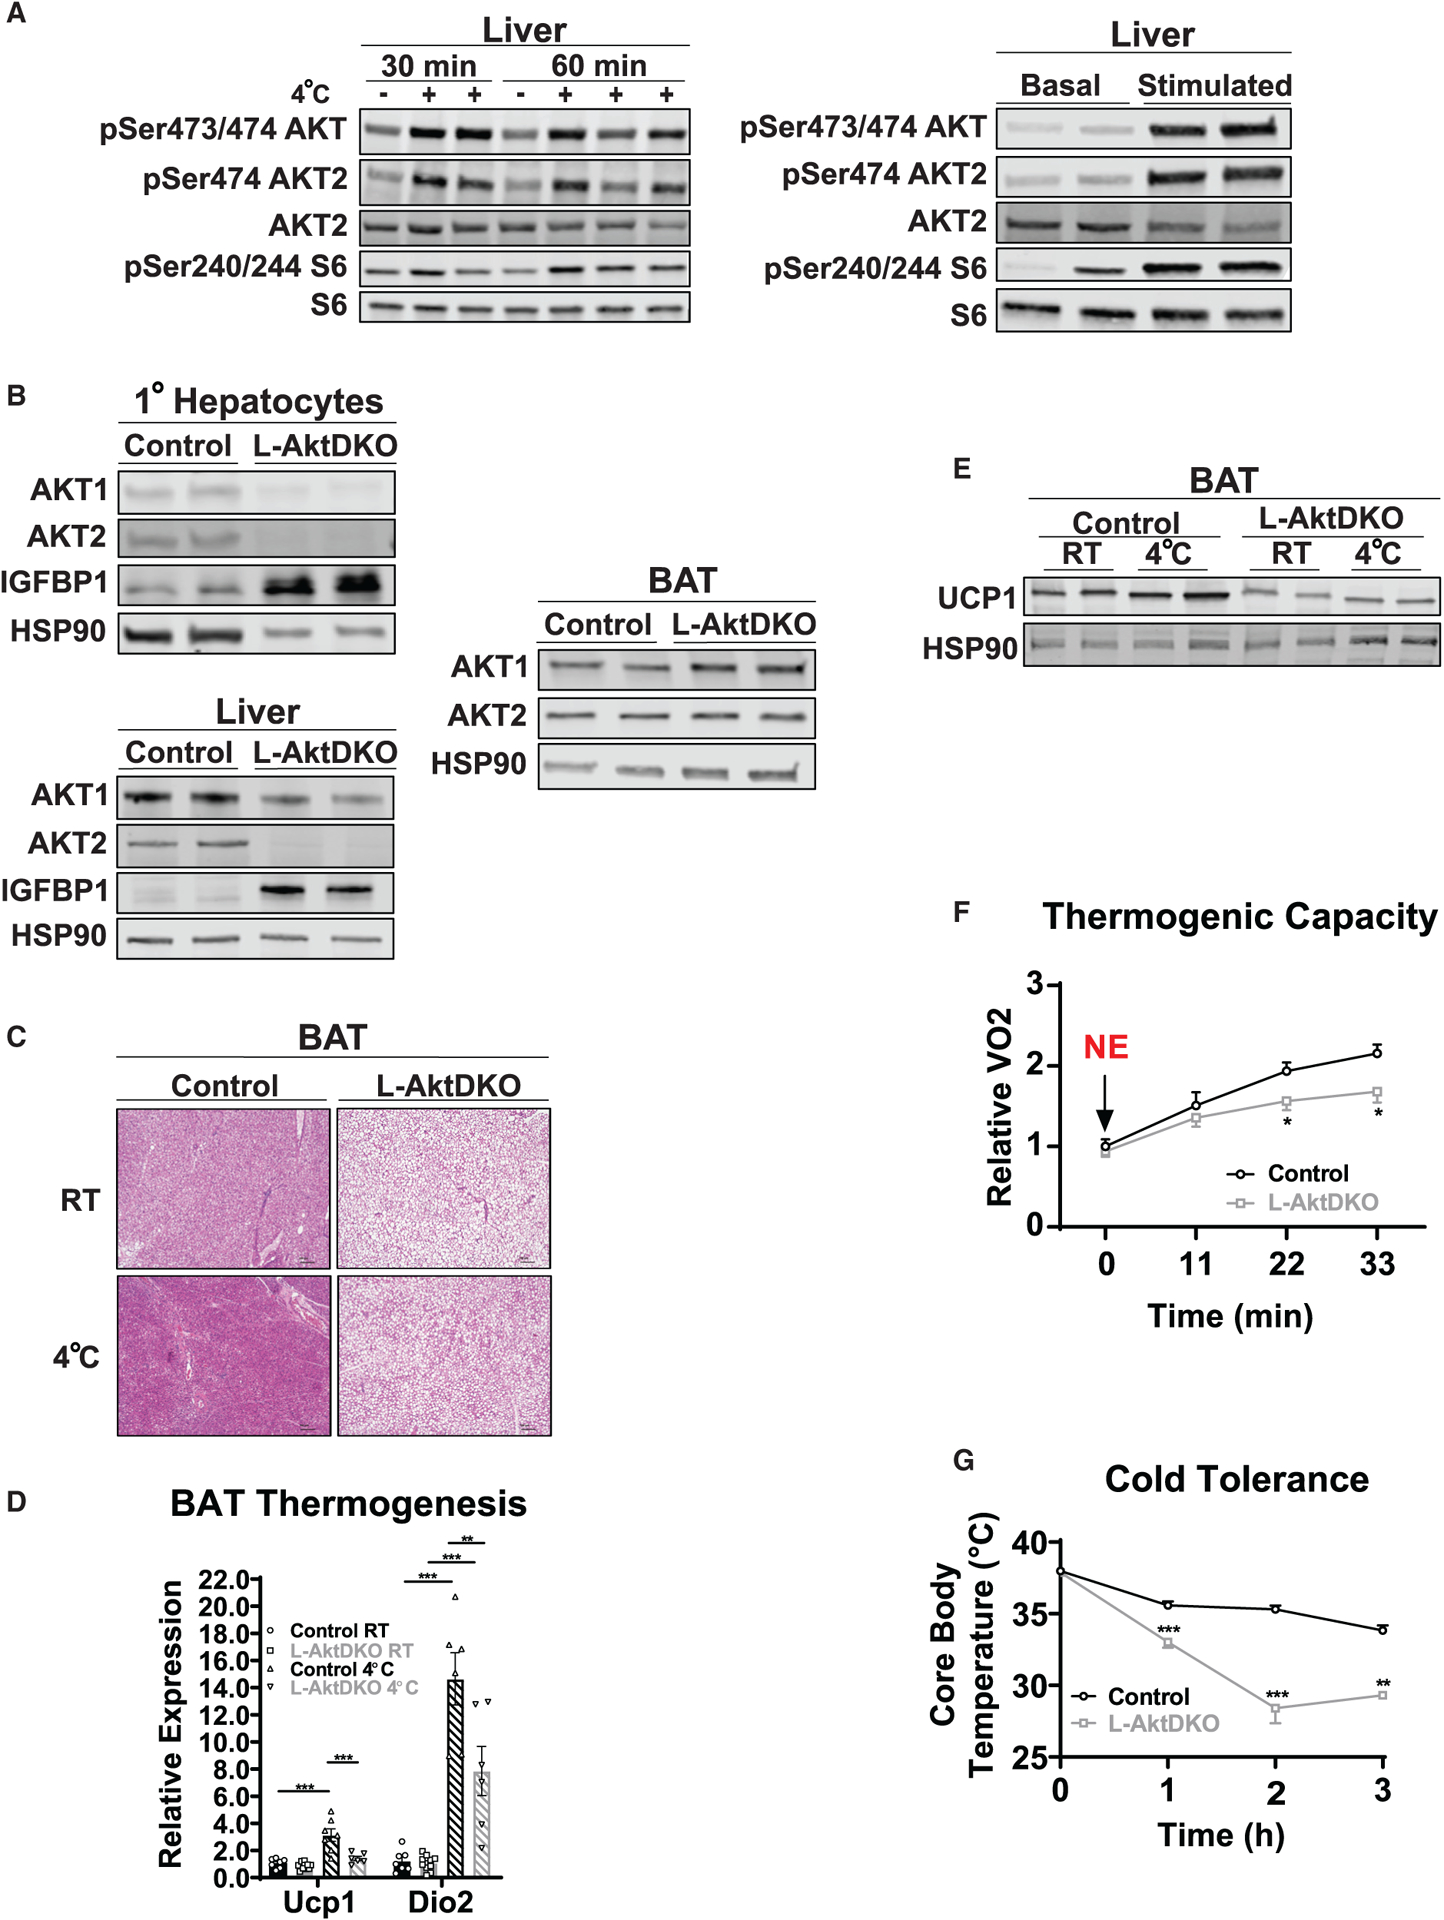
(A) Western blot analysis of phosphorylated (p-)AKT (Ser473/474), p-Akt (Ser474), and p-S6 (Ser240/244) of liver from control mice housed at RT or 4°C for 30 or 60 min and before and after 30 min of CL i.p. injection.
(B) Western blot analysis of AKT1, AKT2, and IGFBP1 from primary hepatocytes and liver, and AKT1 and AKT2 of BAT from control and L-AktDKO mice 2 weeks after AAV8 injection housed at RT.
(C) Hematoxylin and eosin staining of BAT from control and L-AktDKO mice housed at RT or 4°C for 3 h. Scale bars, 100 μm.
(D) Relative mRNA levels of Ucp1 and Dio2 in BAT from control and L-AktDKO mice housed at RT or 4°C for 3 h (n = 6–10 mice per group).
(E) Western blot analysis of UCP1 of BAT from control and L-AktDKO mice housed at RT or 4°C for 3 h.
(F) Rate of oxygen consumption (VO2) of control and L-AktDKO mice housed at 25°C after 1 mg/kg norepinephrine (NE) i.p. injection (n = 6 for control mice and n = 5 for L-AktDKO mice).
(G) Core body temperature of control and L-AktDKO mice during a fasting acute cold tolerance test for 3 h (RT→4°C) (n = 8 for control mice and n = 9 for L-AktDKO mice).
Data are presented as means ± SEM. *p < 0.05, **p < 0.01, ***p < 0.001.
See also Figures S1 and S2.
To evaluate the physiological significance of hepatic AKT stimulation, we generated an inducible knockout of both AKT isoforms (L-AktDKO) specifically in adult mouse liver. In this study, we injected 6- to 14-week-old adult Akt1loxp/loxp;Akt2loxp/loxp mice with an adeno-associated virus (AAV) expressing Cre recombinase under the control of the thyroxine-binding globulin (Tbg) promoter for liver specificity (AAV8-TBG-CRE) to generate L-AktDKO mice (Lu et al., 2012). Floxed littermates were injected with AAV8-TBG-GFP and served as control mice (control). All experiments were performed 2 weeks post-injection to mitigate any potential compensatory mechanisms. We confirmed liver-specific knockout by measuring protein levels of AKT1 and AKT2 in primary hepatocytes as well as in whole liver tissue (Figure 1B). Residual of AKT1 protein was observed in liver tissue from L-AktDKO mice; however, primary hepatocytes isolated from L-AktDKO mice displayed negligible amounts of both AKT1 and AKT2 protein, indicating that residual AKT1 expression is due to non-hepatocyte cells present in tissue liver lysates (Lu et al., 2012; Titchenell et al., 2016). As expected, both AKT1 and AKT2 protein levels were unaffected in BAT of L-AktDKO mice, confirming the liver selective effect of the AAV8-TBG approach (Figure 1B). Furthermore, recent data using single-cell RNA sequencing (RNA-seq) of mice injected with AAV8-CRE to induce knockout has further validated this viral approach for inducible and hepatocyte-specific knockouts in mice (Guan et al., 2020).
Due to the role of BAT in thermogenesis and cold tolerance, we first assessed how loss of liver AKT signaling affected BAT morphology and activity. BAT harvested from ad libitum fed L-AktDKO mice at room temperature (RT) was paler (data not shown) and showed a dramatic increase in lipid droplet deposition (Figure 1C), which correlated with increased expression of genes involved in fatty acid synthesis (Figures S1A–S1C). To assess the physiological relevance of these changes in BAT, we performed an acute cold tolerance test (CTT), which consisted of moving mice from RT to 4°C for up to 5 h without food. L-AktDKO mice failed to increase Ucp1 and Dio2 gene expression upon an acute CTT (Figure 1D). This expression correlated with a significant decrease in UCP1 protein levels in the BAT of cold-exposed L-AktDKO mice (Figure 1E). To determine whether these changes in BAT morphology and UCP1 levels affected the thermogenic capacity of L-AktDKO mice, we used metabolic cages to measure oxygen consumption (VO2) upon NE injection (1 mg/kg). Control mice increased VO2 ~2-fold, and this response was markedly blunted in L-AktDKO mice (Figure 1F). Lastly, L-AktDKO mice displayed a dramatic increase in cold sensitivity, losing body temperature rapidly, as compared to control mice following acute cold exposure (Figure 1G).
Previous studies have documented significant systemic and adipose tissue insulin resistance in L-AktDKO mice (Lu et al., 2012; Titchenell et al., 2016). Therefore, we next determined whether these changes in the BAT of L-AktDKO mice are driven by insulin resistance in fat tissue. To directly assess the contribution of adipose tissue insulin signaling, we generated mice lacking Akt2 specifically in fat cells (F-AKT2KO) and subjected these mice to the same cold-induced thermogenic challenges. Similar to other models of reduced adipose tissue insulin signaling (Tang et al., 2016), these mice failed to increase insulin signaling in epididymal WAT (eWAT) following insulin stimulation (Figure S2A). However, neither cold sensitivity nor UCP1 protein levels were affected in F-AKT2KO mice, demonstrating that reduced insulin signaling in fat cells per se is not sufficient to alter the thermogenic response, BAT lipid content, or adipose tissue lipolysis during cold challenge (Figures S2B–S2F). Overall, these data demonstrate that hepatic AKT signaling regulates the BAT thermogenic response and maximal thermogenic capacity, independent of AKT signaling directly in fat cells.
Hepatic AKT signaling regulates fat mass by increasing food intake
Given the dysfunction of BAT in L-AktDKO mice, we measured the effects on body mass and body composition. Ad libitum fed L-AktDKO mice 2 weeks after AAV8 injection showed a significant increase in total body mass, mainly reflected in increased fat mass (Figure 2A). This increase in fat mass correlated to an ~0.1-g increase in eWAT and iWAT mass as well as an ~0.05-g increase in BAT mass when compared to control mice (Figure 2B). Next, we determined whether the increased body mass of L-AktDKO mice was due to increased energy consumption or a reduction in energy expenditure. We placed control and L-AktDKO mice in metabolic cages to measure the rate of VO2 consumption and the rate of carbon dioxide production (VCO2). L-AktDKO mice had modestly elevated VO2, VCO2, and respiratory exchange ratio (RER) during the light cycle, consistent with elevated body mass (Figures 2C–2E). Next, we measured food intake prior to AAV8 injection and 2 weeks post-injection. Akt1loxp/loxp;Akt2loxp/loxp mice showed no difference in food intake before AAV8 delivery; however, 2 weeks post-injection L-AktDKO mice displayed a significant increase in cumulative food intake (Figure 2F). Collectively, these data indicate that inhibition of hepatic AKT increases body weight by increasing food intake, rather than decreasing energy expenditure.
Figure 2. Inhibition of hepatic AKT increases fat mass via increased energy intake.
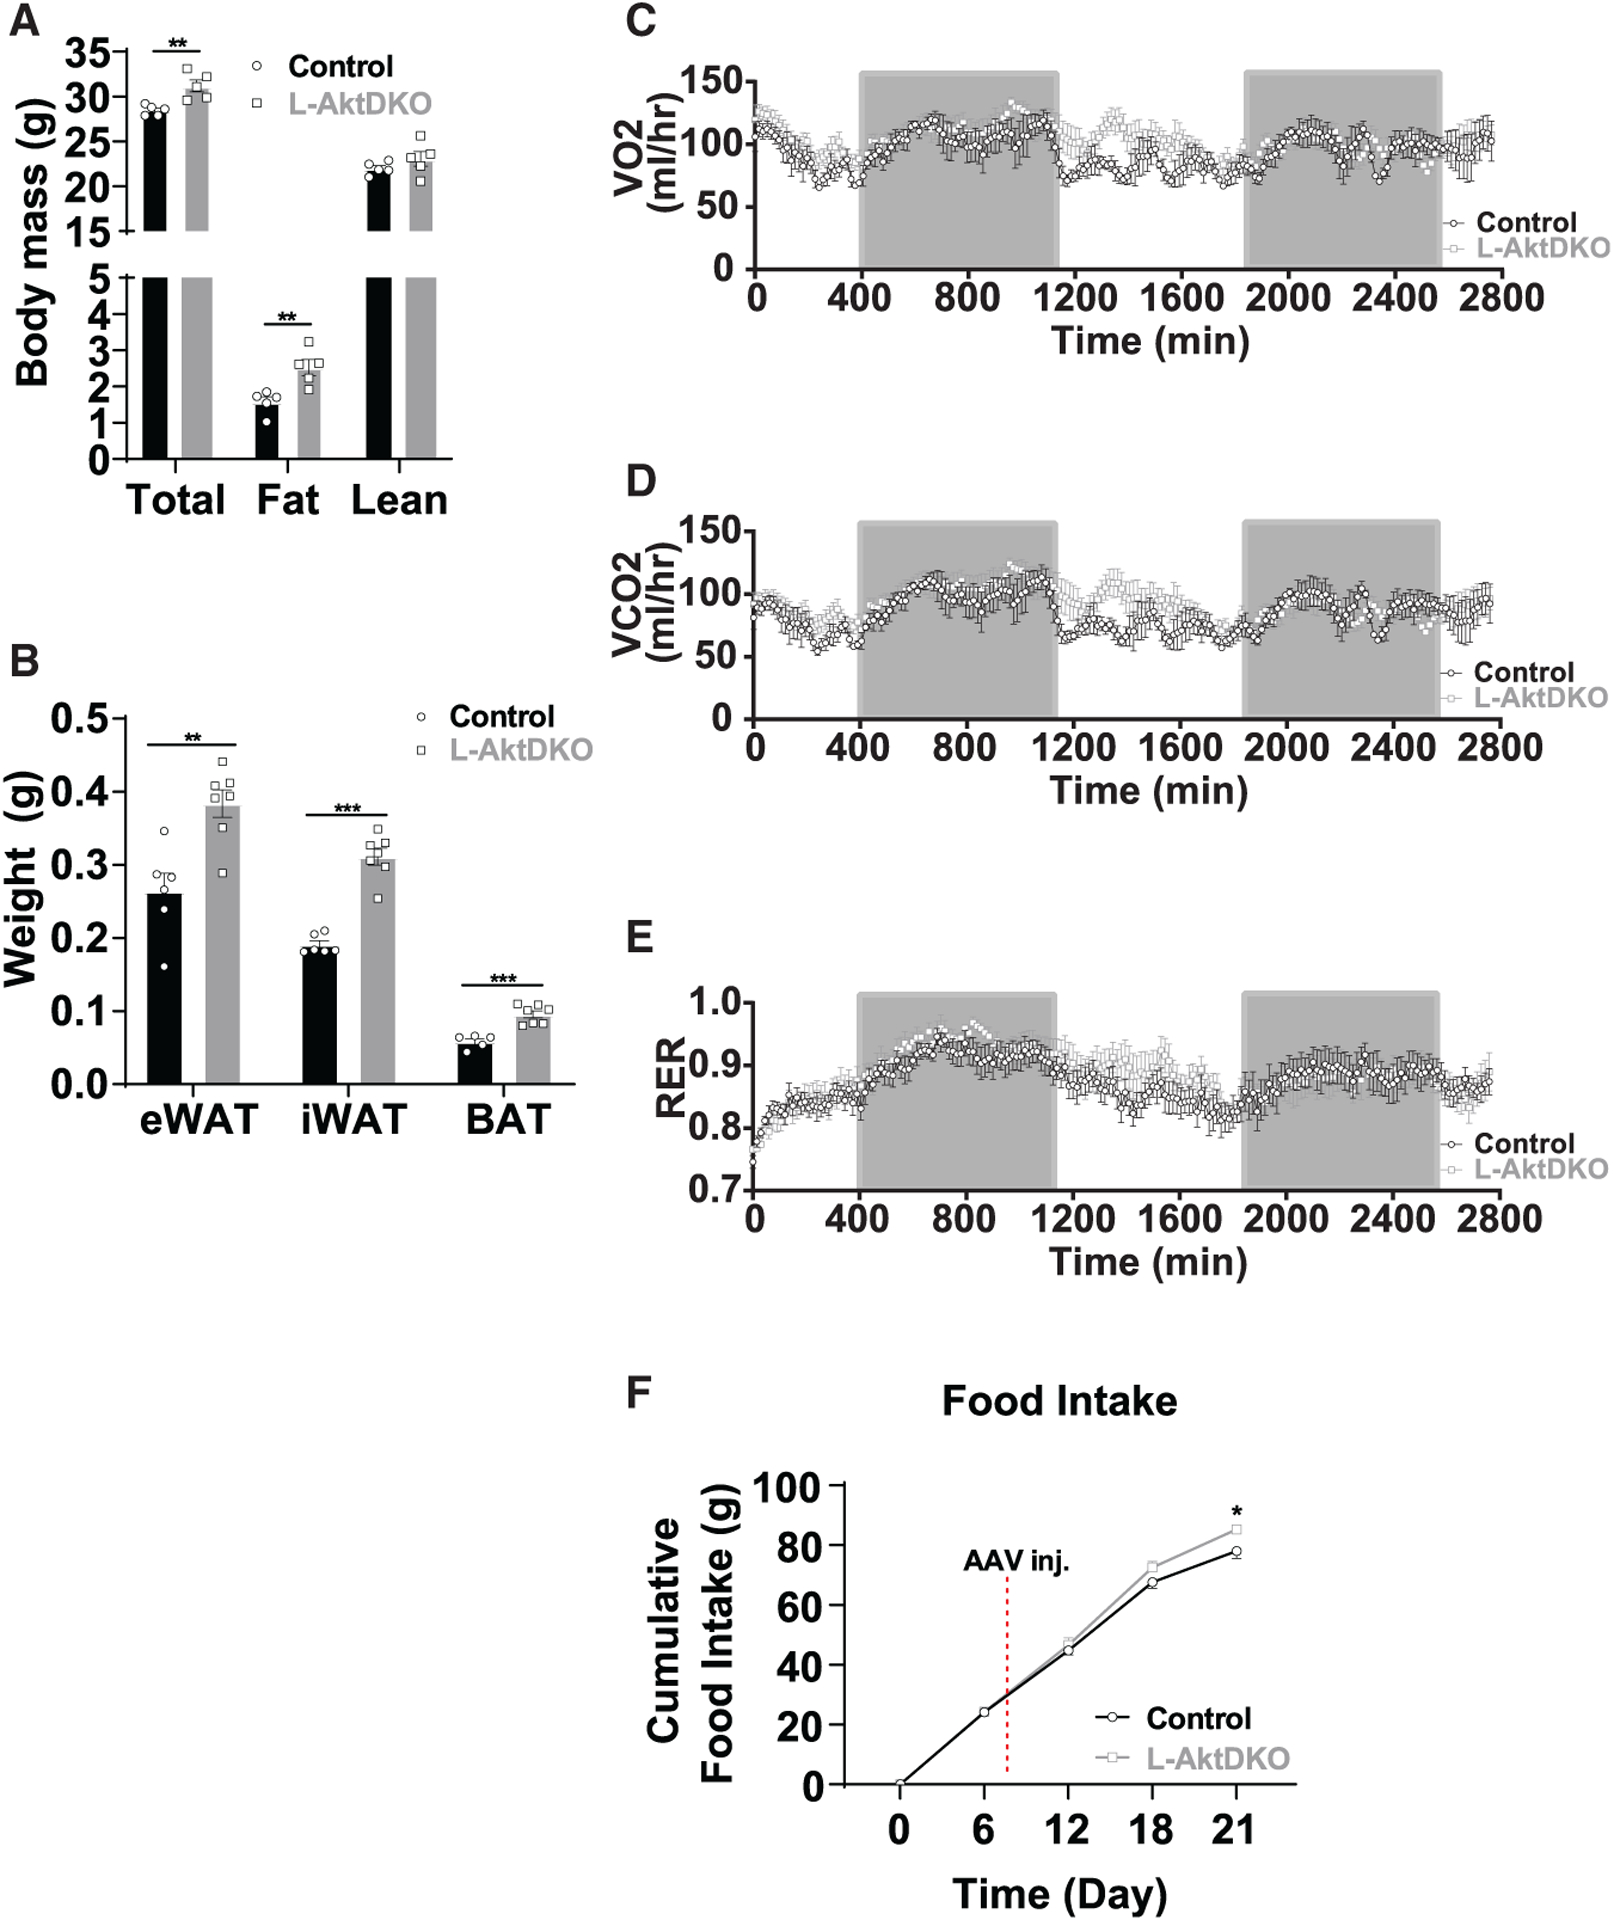
(A) Body composition of control and L-AktDKO mice housed at RT (n = 5 per group).
(B) Epididymal (eWAT), inguinal (iWAT), and brown (BAT) fat pad weights of control and L-AktDKO mice housed at RT (n = 5–7 per group).
(C) Rate of VO2 consumption of control and L-AktDKO mice housed at 25°C (n = 7 per group).
(D) Rate of carbon dioxide production (VCO2) of control and L-AktDKO mice housed at 25°C (n = 7 per group).
(E) Respiratory exchange ratio (RER) of control and L-AktDKO mice housed at 25°C (n = 7 per group).
(F) Cumulative food intake of control and L-AktDKO mice housed at RT before and after 2 weeks post-AAV8 injection (n = 6 for control mice and n = 7 for L-AktDKO mice).
Data are presented as means ± SEM. *p < 0.05, **p < 0.01, ***p < 0.001.
Inhibition of hepatic FOXO1 by AKT is required for proper BAT thermogenic capacity
AKT signals through many downstream signaling pathways to regulate systemic metabolism. In liver, the phosphorylation and inhibition of the FOXO transcription factors are important determinants of glucose and lipid homeostasis (Titchenell et al., 2017). FOXO1, the main isoform of the FOXO family in hepatocytes, is known to be active in insulin-resistant mouse models (Aoyama et al., 2006; Titchenell et al., 2016). Consistent with previous reports, L-AktDKO mice have increased IGFBP1 levels, a direct transcriptional target of FOXO1 (Figure 1B). To determine whether increased hepatic FOXO1 in L-AktDKO mice was responsible for the decreased thermogenic response, we injected AAV8-TBG-CRE into Akt1loxp/loxp;Akt2loxp/loxp; FoxO1loxp/loxp mice to generate L-AktFoxo1TKO (Lu et al., 2012) and AAV8-TBG-GFP to littermate mice to serve as controls. Following AAV8-TBG-CRE injection, AKT1, AKT2, and FOXO1 protein levels were ablated in isolated primary hepatocytes from L-AktFoxo1TKO mice; however, there was no change in expression of these proteins in the BAT (Figure 3A). Two weeks post-injection, both control and L-AktFoxo1TKO mice displayed identical body and adipose tissue mass (eWAT and iWAT), and only a modest increase in BAT mass, which is in stark contrast to the previously described L-AktDKO mice (Figures 2B, 3B, and 3C). Unlike L-AktDKO mice, BAT from L-AktFoxo1TKO mice appeared histologically normal and expressed normal levels of UCP1 protein at both RT and 4°C (Figures 3D and 3E). Moreover, L-AktFoxo1TKO mice had a normal increase in the oxygen consumption response upon NE injection and were able to defend their body temperature during an acute CTT (Figures 3F and 3G). These data indicate that AKT inhibition of hepatic FOXO1 is required for regulation of body mass, BAT thermogenic capacity, and acute cold tolerance.
Figure 3. The loss of hepatic FOXO1 is sufficient to rescue thermogenic capacity in L-AktDKO mice.
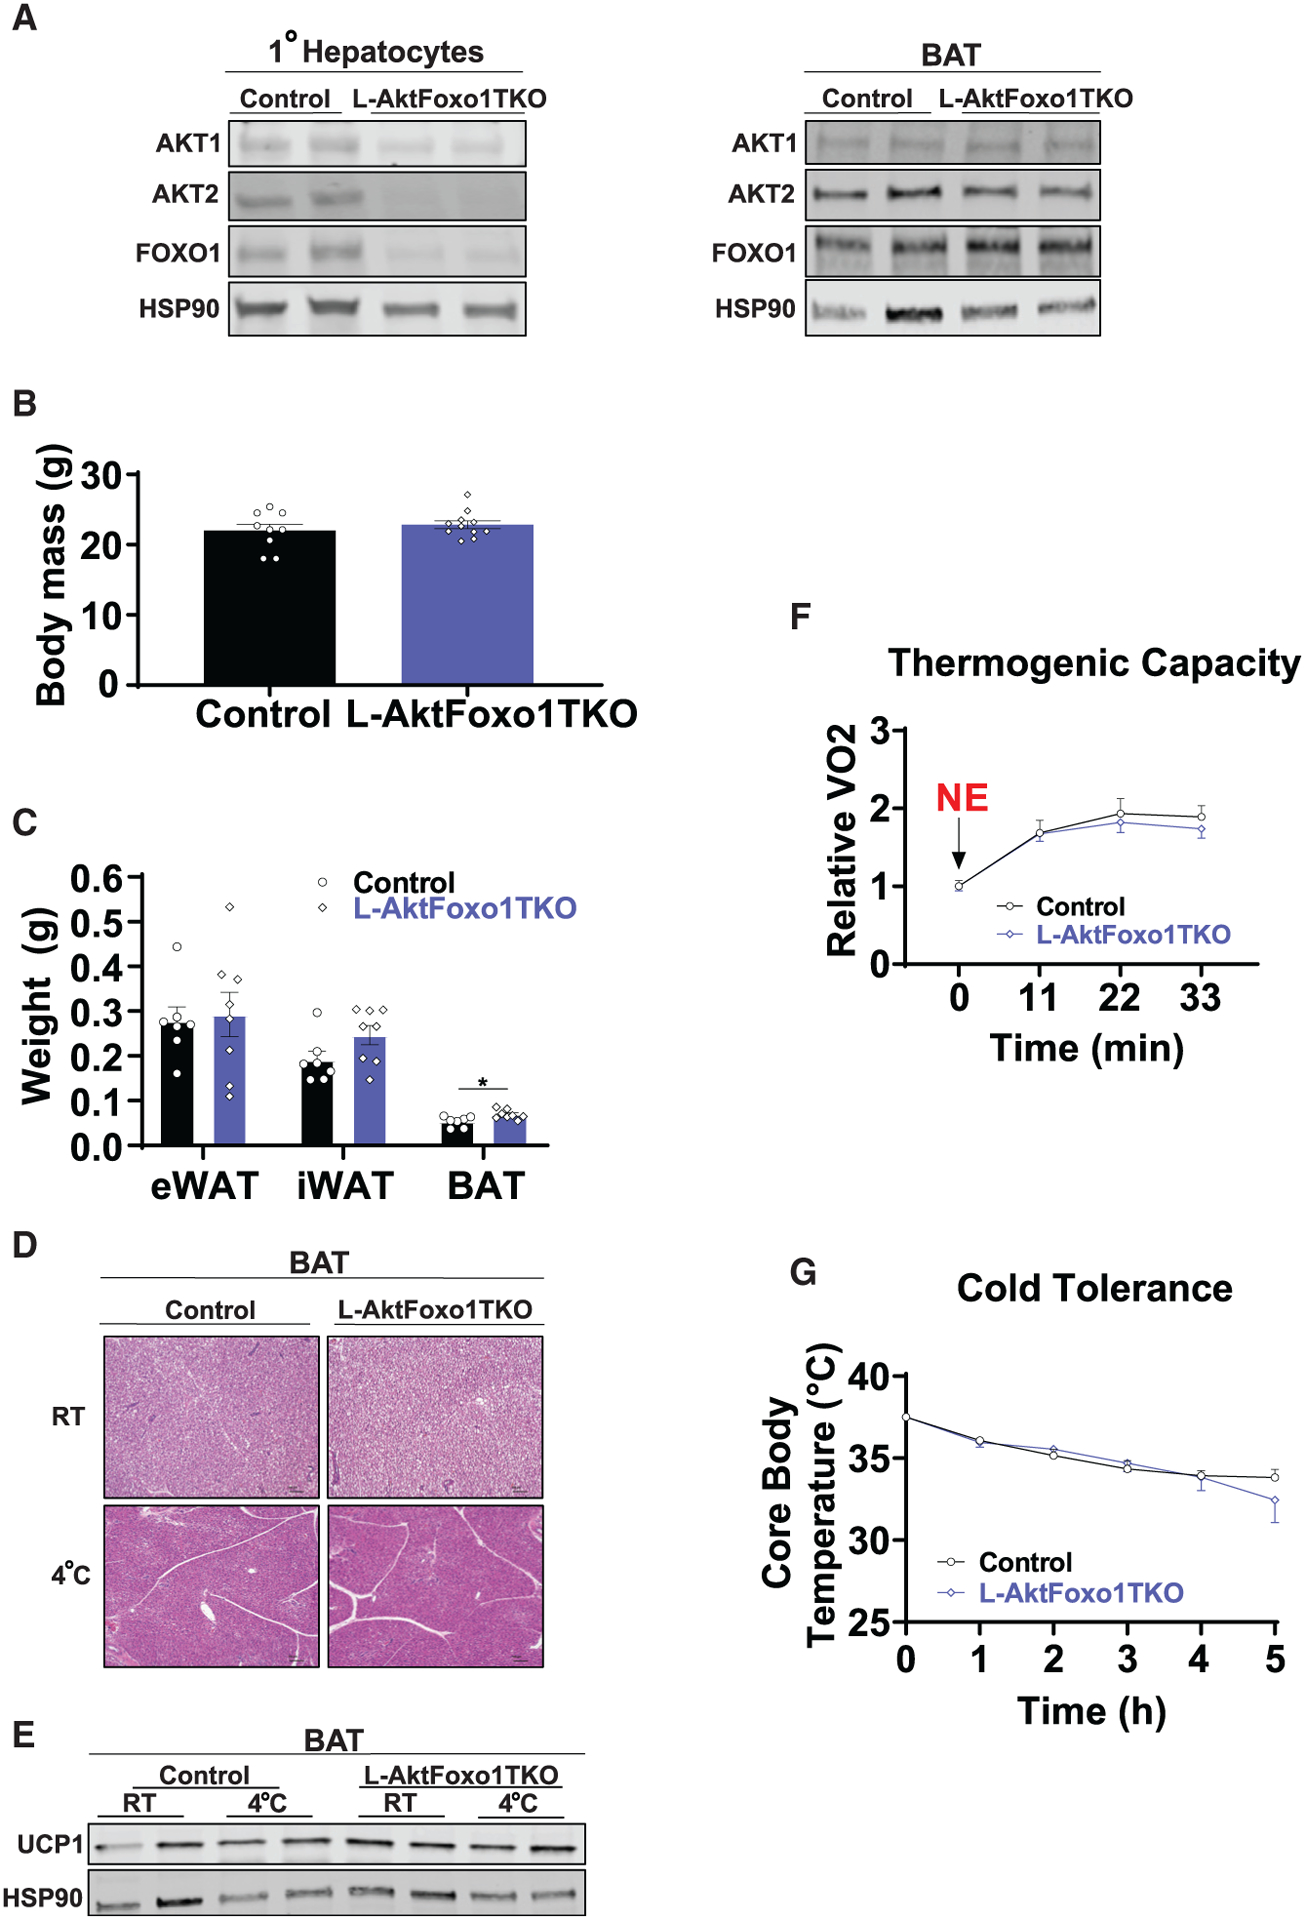
(A) Western blot analysis of AKT1, AKT2, and FOXO1 from primary hepatocytes and BAT from control and L-AktFoxo1TKO mice 2 weeks after AAV8 injection housed at RT.
(B) Body mass of control and L-AktFoxo1TKO mice housed at RT (n = 9 for control mice and n = 11 for L-AktFoxo1TKO mice).
(C) Epididymal (eWAT), inguinal (iWAT), and brown (BAT) fat pad weights of control and L-AktFoxo1TKO mice housed at RT (n = 7 for control mice and n = 8 for L-AktFoxo1TKO mice).
(D) Hematoxylin and eosin staining of BAT from control and L-AktFoxo1TKO mice housed at RT or 4°C for 5 h. Scale bars, 100 μm.
(E) Western blot analysis of UCP1 of BAT from control and L-AktFoxo1TKO mice housed at RT or 4°C for 5 h.
(F) Rate of VO2 of control and L-AktFoxo1TKO mice housed at 25°C after 1 mg/kg NE i.p. injection (n = 4 for control mice and n = 7 for L-Akt-Foxo1TKO mice).
(G) Core body temperature of control and L-AktFoxo1TKO mice during a fasting acute cold tolerance test for 5 h (RT→4°C) (n = 7 for control mice and n = 9 for L-AktFoxo1TKO mice).
Data are presented as means ± SEM. *p < 0.05. See also Figure S3.
Next, we sought to determine whether increased hepatic FOXO1 was sufficient to impair adipose tissue thermogenesis. We injected Foxo1AAAloxp/loxp mice (Ouyang et al., 2012) with AAV8-TBG-CRE/GFP to generate mice with acute, liver-specific activation of FOXO1 (L-Foxo1AAA) or control mice, respectively. L-Foxo1AAA mice lack the AKT-dependent inhibition by having its regulatory phosphorylation sites mutated to alanine leading to constitutive activity. We confirmed increased liver FOXO1 activity and specificity by observing only increased liver gene expression and protein levels of IGFBP1, a direct FOXO1 transcriptional target, and not in BAT (Figures S3A–S3C). Two weeks post-injection, L-Foxo1AAA mice displayed impaired glucose tolerance and fasting hyperinsulinemia (Figure S3D and S3E), indicating an insulin-resistant phenotype as previously described by Terry Unterman’s group using a congenital liver-specific Foxo1AAA mouse model (Zhang et al., 2006). Consistent with our findings in L-AktDKO mice, L-Foxo1AAA mice showed impaired cold tolerance and decreased UCP1 protein levels in BAT (Figures S3F and S3G). This reduction in cold tolerance correlated with a significant reduction in FFA serum levels (Figure S3H), further supporting the important role for hepatic FOXO1 signaling downstream of AKT in the regulation of thermogenesis.
Liver AKT signaling regulates catecholamine-induced lipolysis
In addition to intrinsic BAT mechanisms, WAT lipolysis is required to maintain body temperature during cold exposure, as mice with adipocyte-specific loss of the lipolysis regulators adipocyte triglyceride lipase (ATGL) or CGI-58 exhibit profound cold sensitivity (Schreiber et al., 2017; Shin et al., 2017). Given the similarities with the L-AktDKO mouse phenotype, we hypothesized that catecholamine-induced lipolysis may be impaired in L-AktDKO mice. To test this hypothesis, we measured serum FFA and glycerol levels in response to an intraperitoneal (i.p.) injection of CL (1 mg/kg). L-AktDKO mice displayed a blunted rise in FFA levels in response to CL, as compared to control and L-AktFoxo1TKO mice (Figure 4A). Similar to CL administration, L-AktDKO mice exposed to an acute CTT showed a significant reduction in serum FFAs when compared to control and L-AktFoxo1TKO mice; this correlated with a decrease in hepatic triglyceride content, suggesting reductions in WAT lipolysis and liver fatty acid re-esterification (Figures 4B and 4C). Consistent with defective WAT lipolysis in L-AktDKO mice, phosphorylation of PKA substrates, phosphorylation of HSL at Ser660 and phosphorylation of perilipin at Ser522 were decreased in eWAT of L-AktDKO mice following acute cold exposure (Figures 4D and 4E). Villanueva’s group showed that cold-induced activation of WAT lipolysis is required to increase acylcarnitines for BAT thermogenesis (Simcox et al., 2017). Concordant with the impaired lipolysis observed in L-AktDKO mice, the serum levels of numerous acylcarnitines were downregulated upon acute cold exposure in L-AktDKO mice compared to control mice (Figure S4A).
Figure 4. L-AktDKO mice fail to respond to catecholamine-induced lipolysis in WAT.
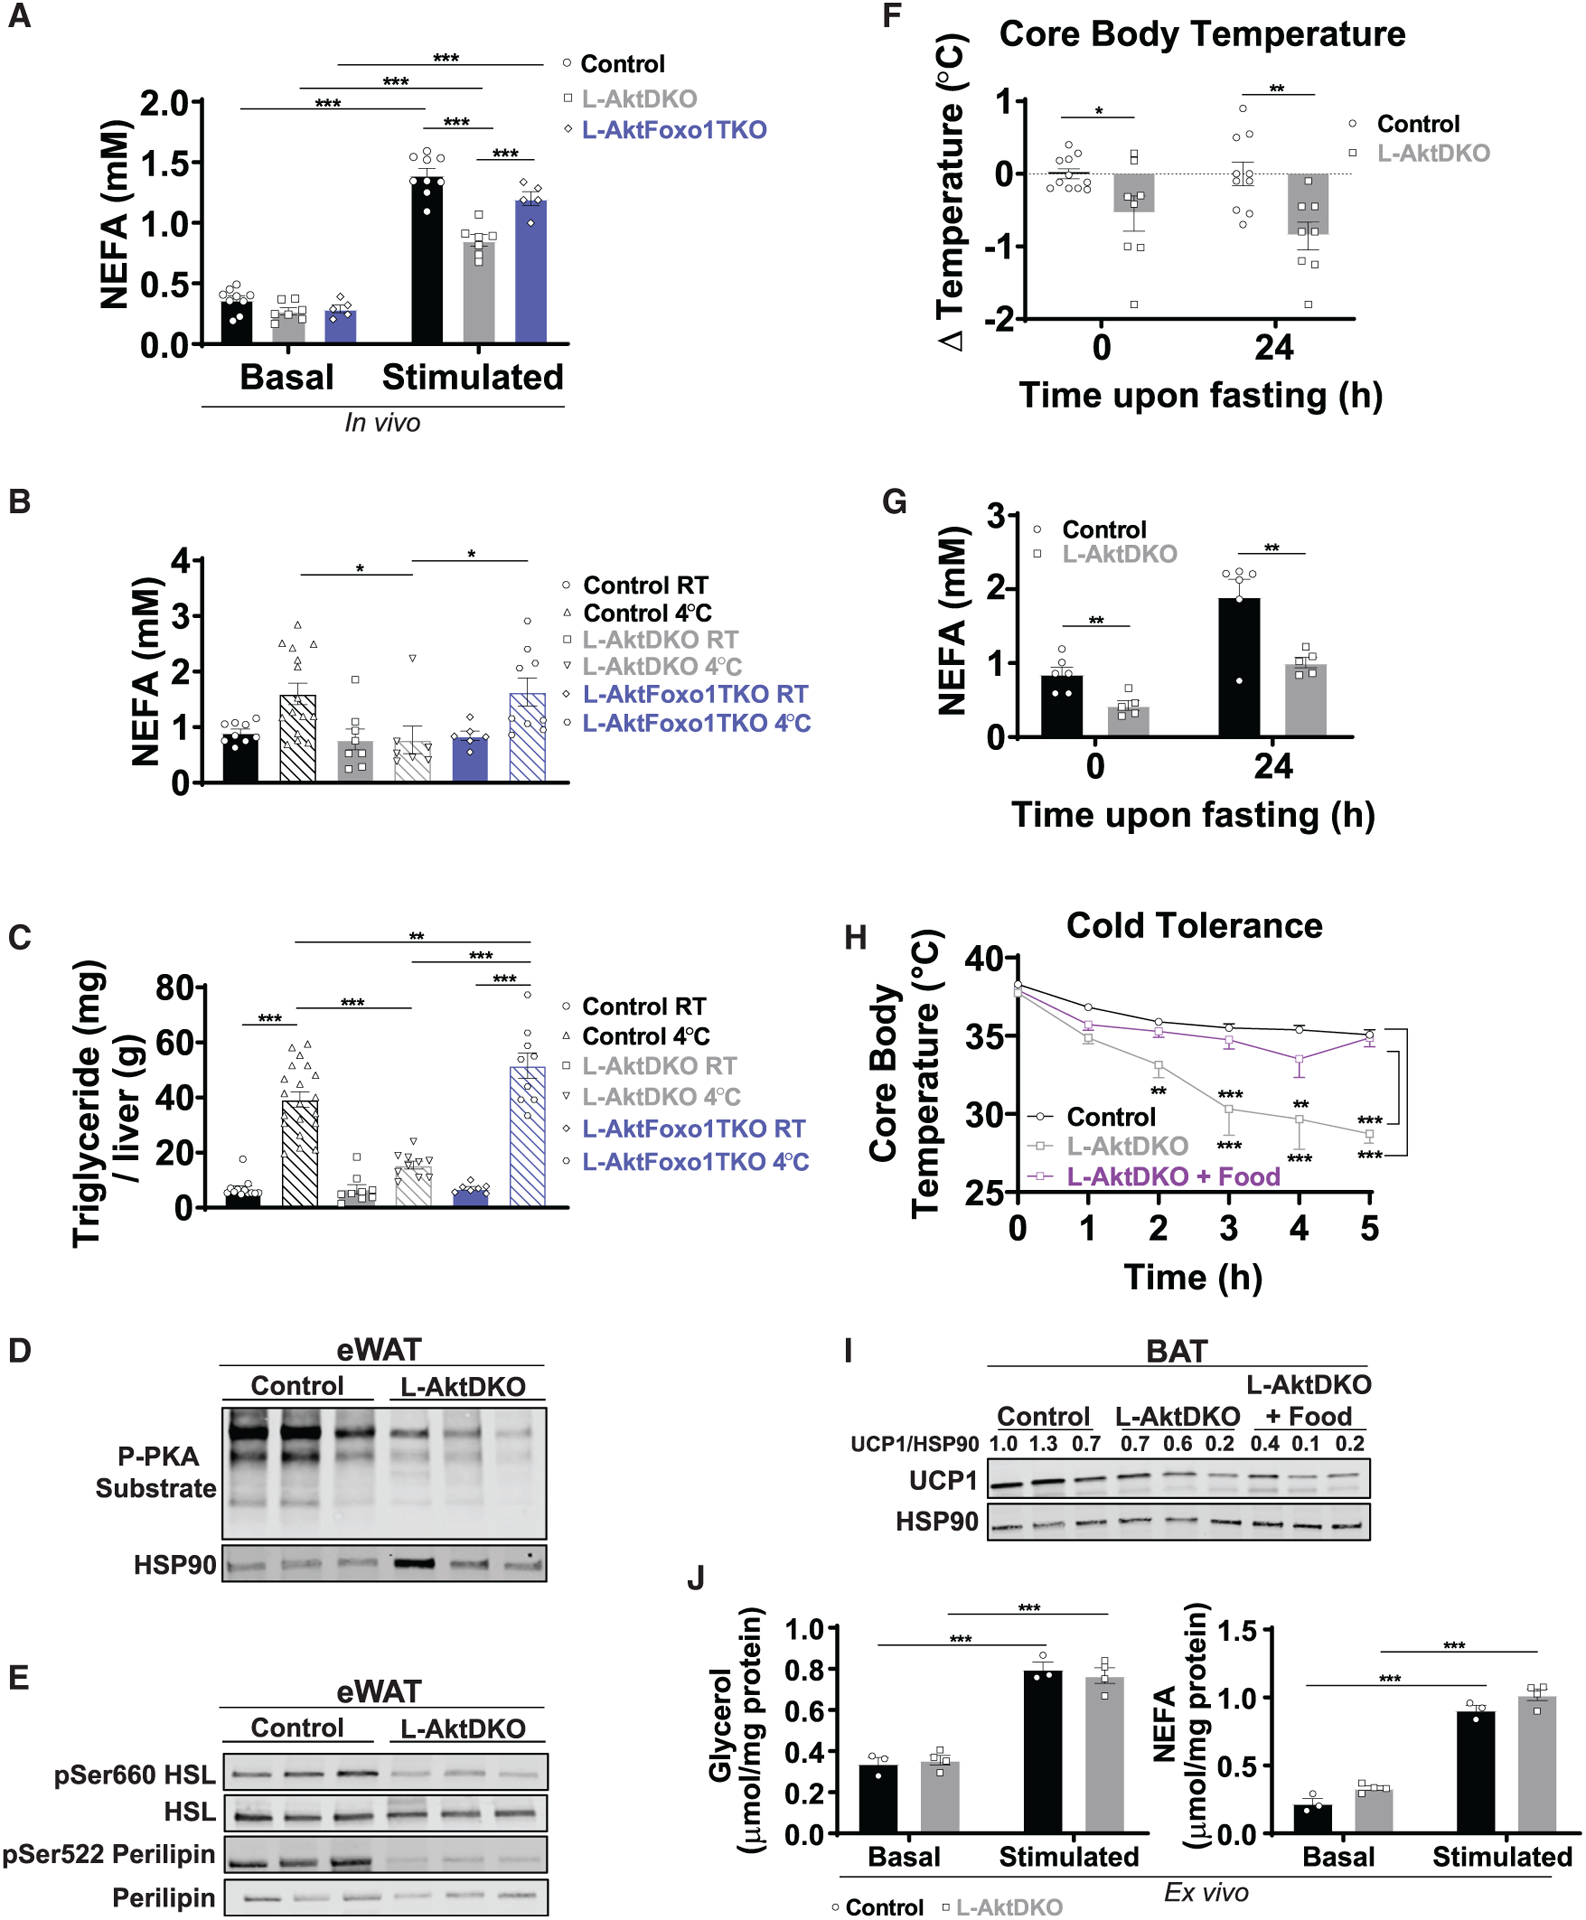
(A) NEFA serum levels of control, L-AktDKO, and L-AktFoxo1TKO mice housed at RT before and after 30 min of CL i.p. injection (n = 5–9 per group).
(B) NEFA serum levels of control, L-AktDKO, and L-AktFoxo1TKO mice after a fasting acute cold tolerance test for 5 h (RT→4°C) (n = 6–15 per group).
(C) Hepatic triglyceride content of control, L-AktDKO, and L-AktFoxo1TKO mice after a fasting acute cold tolerance test for 5 h (RT→4°C) (n = 7–20 per group).
(D) Western blot analysis of p-PKA substrate of eWAT from control and L-AktDKO mice after a fasting acute cold tolerance test for 5 h (RT→4°C).
(E) Western blot analysis of p-HSL (Ser660), and p-perilipin (Ser522) of eWAT from control and L-AktDKO mice after a fasting acute cold tolerance test for 5 h (RT→4°C).
(F) Core body temperature change of control and L-AktDKO mice housed at RT before and 24 h after fasting (n = 11 for control mice and n = 8 for L-AktDKO mice).
(G) NEFA serum levels of control and L-AktDKO mice housed at RT before and 24 h after fasting (n = 6 for control mice and n = 5 for L-AktDKO mice).
(H) Core body temperature of control and L-AktDKO mice during a fasting acute cold tolerance and L-AktDKO mice during ad libitum fed acute cold tolerance test for 5 h (RT→4°C) (n = 8 for control mice and n = 7 for L-AktDKO mice per condition).
(I) Western blot analysis of UCP1 of BAT from control and L-AktDKO mice after a fasting acute cold tolerance and L-AktDKO mice after ad libitum fed acute cold tolerance test for 5 h.
(J) Glycerol and NEFA media levels of control and L-AktDKO mice eWAT fat pads before and after 100 μM CL treatment (n = 3 for control mice and n = 4 for L-AktDKO mice).
Data are presented as means ± SEM. *p < 0.05, **p < 0.01, ***p < 0.001.
See also Figures S4, S5, S7, and S8.
Surprisingly, glycerol levels of L-AktDKO mice did not track with changes in serum FFAs (Figure S5A). Since the liver is a large consumer of glycerol, and hepatic insulin signaling is known to be involved in glycerol metabolism, we determined whether L-AktDKO mice have defective glycerol clearance. In support of this notion, L-AktDKO mice were glycerol intolerant when subjected to a glycerol tolerance test (Figure S5B), and this correlated with decreased hepatic gene expression of Gk, Gpd1, and Gpd2 (Figure S5C). Therefore, serum glycerol measurements are a poor indicator of adipose tissue lipolysis in mice lacking hepatic AKT signaling due to abnormalities in glycerol clearance. Taken together, these data indicate that loss of hepatic AKT signaling impairs catecholamine-stimulated lipolysis, an effect that is dependent on intact liver FOXO1 signaling.
To determine whether impaired catecholamine-induced lipolysis in L-AktDKO mice lowers core body temperature under other physiological conditions such as prolonged fasting, we starved control and L-AktDKO mice for 24 h and measured core body temperature and FFAs immediately upon food removal and 24 hours later. L-AktDKO mice showed a significant decrease of ~0.5°C of core body temperature when compared to control mice at baseline and a further decrease of ~1°C after 24 h of fasting (Figure 4F). The decreased core body temperature tracked with lowered FFA levels both at 0 and 24 h of fasting (Figure 4G). Taken together, these data indicate that L-AktDKO mice have impaired catecholamine-induced lipolysis that is associated with reduced core body temperature.
Next, we wanted to address whether providing exogenous nutrients would be sufficient to rescue the cold sensitivity observed in L-AktDKO mice. Therefore, we performed an acute CTT in which L-AktDKO mice were either fasting for the duration of the experiment or ad libitum fed. As previously observed in Figure 1G, food deprived L-AktDKO mice were cold sensitive. However, cold tolerance was rescued in ad libitum fed L-AktDKO mice (Figure 4H), suggesting that the cold sensitivity developed by L-AktDKO mice upon acute cold exposure is associated with depletion of circulating energy substrates. This rescue in cold tolerance by food was independent of changes of UCP1 protein levels (Figure 4I). Lastly, we addressed whether the impairment in catecholamine-induced lipolysis observed in WAT of L-AktDKO mice was due to a tissue-autonomous or -nonautonomous mechanism. We performed a lipolysis ex vivo assay in which glycerol and FFA levels were measured in the media of eWAT explants upon CL treatment. Explants of eWAT from L-AktDKO mice induced glycerol and FFA levels to a similar extent as control mice (Figure 4J), suggesting that the impaired catecholamine-induced lipolysis is due to a tissue-extrinsic mechanism.
Induction of FGF21 by hepatic insulin signaling plays a key role in acute cold sensitivity
Collectively, our data show that the hepatic AKT-FOXO1 axis regulates BAT thermogenic capacity and catecholamine-stimulated lipolysis. Therefore, we focused on candidate hepatokines that may be involved in thermoregulation as well as lipolysis. Endogenous FGF21 increases upon acute cold exposure (Lee et al., 2013; Ameka et al., 2019) and signals to the central nervous system to regulate core body temperature (Ameka et al., 2019). Previous work suggests that FGF21 expression and secretion are regulated by AKT (Izumiya et al., 2008) and, combined with our data, indicates a potential link between hepatic AKT-FOXO1 signaling and FGF21 production to regulate adipose tissue thermogenesis and lipolysis. Consistent with this notion, L-AktDKO mice showed a significant reduction in liver Fgf21 gene expression compared to control and L-AktFoxo1TKO mice at RT (Figure 5A). Moreover, L-AktDKO mice failed to stimulate Fgf21 gene expression in response to acute cold exposure (Figure 5A). This reduction in Fgf21 gene expression correlated to a ~75% reduction in FGF21 serum levels in L-AktDKO mice (Figure 5B). Strikingly, both hepatic gene expression and circulating levels of FGF21 were normal in L-AktFoxo1TKO mice (Figures 5A and 5B). Additionally, L-AktDKO mice tended to have decreased Fgf21 gene expression in WAT and BAT when compared to control mice; however, it did not reach statistical significance (Figures S6A–S6C), indicating that the main effect of hepatic insulin signaling is on liver-derived FGF21.
Figure 5. Hepatic AKT-FOXO1 regulates liver-derived FGF21 and plays a key role in cold sensitivity.
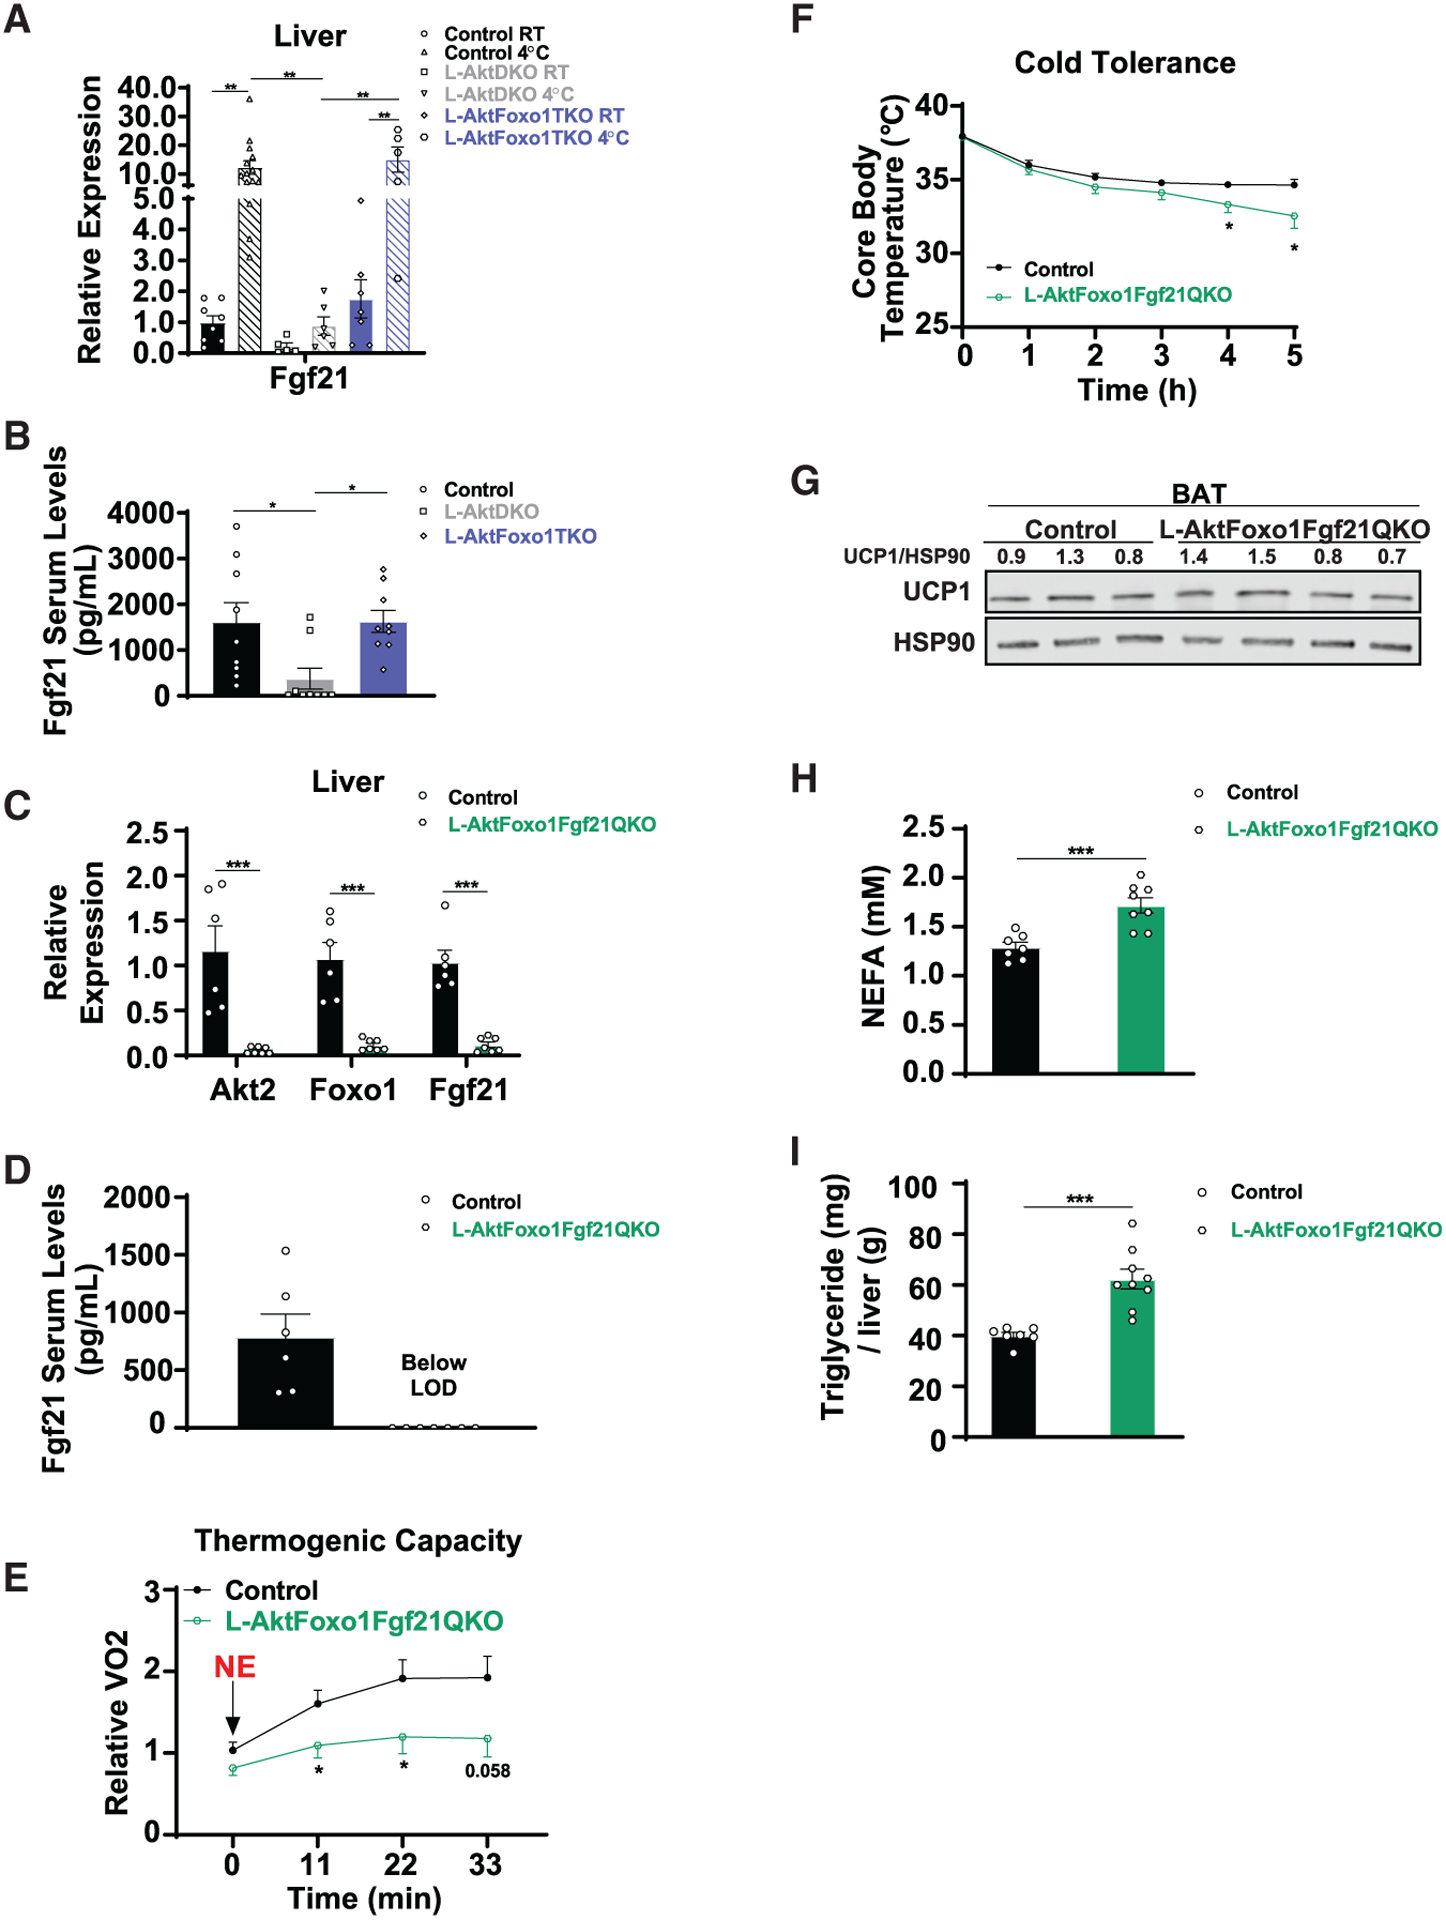
(A) Relative mRNA levels of Fgf21 in liver from control, L-AktDKO, and L-AktFoxo1TKO mice housed at RT or after a fasting acute cold tolerance test for 5 h (RT→4°C) (n = 5–14 per group).
(B) FGF21 serum levels of control, L-AktDKO, and L-AktFoxo1TKO mice after a fasting acute cold tolerance test for 5 h (RT→4°C) (n = 9 per group).
(C) Relative mRNA levels of Akt2, Foxo1, and Fgf21 in liver from control and L-AktFoxo1Fgf21QKO mice after a fasting acute cold tolerance test for 5 h (RT→4°C) (n = 6 for control mice and n = 7 for L-AktFoxo1Fgf21QKO mice).
(D) FGF21 serum levels of control and L-AktFoxo1Fgf21QKO mice after a fasting acute cold tolerance test for 5 h (RT→4°C) (n = 6 for control mice and n = 7 for L-AktFoxo1Fgf21QKO mice).
(E) Rate of VO2 of control and L-AktFoxo1Fgf21QKO mice housed at 25°C after 1 mg/kg NE i.p. injection (n = 7 for control mice and n = 6 for L-AktFoxo1Fgf21QKO mice).
(F) Core body temperature of control and L-AktFoxo1Fgf21QKO mice during a fasting acute cold tolerance test for 5 h (RT→4°C) (n = 8 per group).
(G) Western blot analysis of UCP1 of BAT from control and L-AktFoxo1Fgf21QKO mice after a fasting acute cold tolerance test for 5 h (RT→4°C).
(H) NEFA serum levels of control and L-AktFoxo1Fgf21QKO mice after a fasting acute cold tolerance test for 5 h (RT→4°C) (n = 7 for control mice and n = 8 for L-AktFoxo1Fgf21QKO mice).
(I) Hepatic triglyceride content of control and L-AktFoxo1Fgf21QKO mice after a fasting acute cold tolerance test for 5 h (RT→4°C) (n = 7 for control mice and n = 9 for L-AktFoxo1Fgf21QKO mice).
Data are presented as means ± SEM. *p < 0.05, **p < 0.01, ***p < 0.001.
See also Figure S6.
Due to the discrepancy between the pharmacological and physiological role of FGF21 in both thermogenesis and lipolysis, we focused on the physiological role of FGF21 and determined whether hepatic AKT-FOXO1 controls thermogenesis and catecholamine-induced lipolysis via liver-derived FGF21. To address this question, we used a genetic approach and crossed Akt1loxp/loxp;Akt2loxp/loxp;FoxO1loxp/loxp mice with Fgf21loxp/loxp mice to generate Akt1loxp/loxp;Akt2loxp/loxp;FoxO1loxp/loxp; Fgf21loxp/loxp mice. These mice were injected with AAV8-TBG-CRE to generate mice lacking AKT1, AKT2, FOXO1, and FGF21 in the liver (L-AktFoxo1Fgf21QKO), and floxed littermates were injected with AAV8-TBG-GFP to serve as control mice (Figures 5C and 5D). First, we addressed the thermogenic capacity of L-AktFoxo1Fgf21QKO mice by measuring VO2 consumption in response to NE injection. L-AktFoxo1Fgf21QKO mice displayed a significant reduction in VO2 consumption upon NE compared to control mice, suggesting an impairment in BAT thermogenic capacity (Figure 5E). When subjected to an acute CTT, L-AktFoxo1Fgf21QKO mice displayed mildly impaired cold tolerance compared to control mice (Figure 5F). This cold sensitivity did not correlate with decreased UCP1 protein levels in BAT (Figure 5G), but it was consistent with previous work demonstrating that FGF21 regulates BAT thermogenesis through sympathetic nerve activity (Ameka et al., 2019). Non-esterified fatty acid (NEFA) serum levels and hepatic triglyceride content of L-AktFoxo1Fgf21QKO mice were significantly increased compared to control mice despite cold intolerance (Figures 5H and 5I). Notably, the increase in hepatic triglycerides in L-AktFoxo1Fgf21QKO mice could also be attributed to FOXO1 inhibition, as L-AktFoxo1TKO mice have increased levels of liver triglycerides during cold exposure without increased FFAs as compared to control mice (Figures 4B and 4C). Nevertheless, these results align with studies indicating an inhibitory role for FGF21 on lipolysis (Arner et al., 2008; Li et al., 2009; Geng et al., 2019) andindicate that a FGF21-independent mechanism must exist for liver AKT to regulate adipocyte lipolysis cell-non-autonomously. Collectively, our data show that hepatic liver insulin signaling regulates thermogenesis during thermal challenge via FGF21-upregulation of BAT activity and by a FGF21-independent signal that controls adipocyte lipolysis. This demonstrates an essential role for the hepatic insulin-AKT-FOXO1 axis in the control of mammalian thermogenesis.
DISCUSSION
BAT confers an evolutionary advantage to mammals by playing an important and well-established role in non-shivering thermogenesis (Cannon and Nedergaard, 2004). While BAT in humans was long thought to be present exclusively in infants, recent work revealed that it is also present in adults (Cypess et al., 2009; Lee et al., 2010). Human studies show that BAT thermogenesis after cold training is associated with increased oxidative capacity, insulin sensitivity, and decreased body fat mass (Yoneshiro et al., 2013; Blondin et al., 2014; Lee et al., 2014). The ability of the BAT to increase energy expenditure has made it a potential target to combat obesity and associated diseases (Seale and Lazar, 2009). However, major gaps remain in our understanding of BAT regulation, including how other metabolic organs, such as the liver, coordinate the supply of hepatokines and energy substrates to activate and fuel BAT thermogenesis. Elucidating these mechanisms will provide relevant and missing fundamental knowledge to the liver’s response to acute cold exposure, in addition to providing an understanding of the inter-tissue communication system that mobilizes energy for heat production.
In this study, we tested the direct role of hepatic insulin signaling via AKT in the regulation of adipose tissue biology during acute cold exposure. Consistent with increased insulin levels upon acute cold exposure (Heine et al., 2018), our data reveal that liver AKT signaling is activated by cold and intact insulin signaling in liver is required for adipose tissue thermogenesis. In this study, we show a role for liver AKT-FOXO1 signaling in coordinating the response to cold exposure by two independent mechanisms: by regulating availability of energy substrates from the WAT and by producing the hepatokine FGF21 to enhance BAT function.
In response to cold exposure, the BAT uses different substrates to convert chemical energy to heat (Heine et al., 2018). Recent studies have challenged the popular idea that lipolysis and lipid droplets in brown adipocytes are required for BAT thermogenesis. There is increasing evidence that WAT lipolysis is required to fuel non-shivering thermogenesis during fasting conditions (Schreiber et al., 2017; Shin et al., 2017; Chitraju et al., 2020). Consistent with this notion, our data indicate that liver AKT-FOXO1 signaling is required for proper catecholamine-induced lipolysis and defense of body temperature during an acute cold challenge. This cell-nonautonomous regulation of liver insulin signaling on WAT is consistent with FOXO1-dependent regulation on WAT previously reported (Perry et al., 2015; Titchenell et al., 2016; Tao et al., 2018). Given the robust regulation of FGF21 gene expression by liver AKT-FOXO1 signaling, we hypothesized that liver-derived FGF21 was a key hepatokine involved in this response. Significant controversy exists regarding the role of FGF21 in lipolysis, with some studies suggesting a lipolysis-promoting effect (Inagaki et al., 2007; Badman et al., 2009), while other studies indicate an inhibitory role (Arner et al., 2008; Li et al., 2009; Geng et al., 2019).
To address this directly, we generated a liver-specific knockout of AKT1/2, FOXO1, and FGF21 to examine whether FOXO1 regulation of liver FGF21 directly affects WAT lipolysis. Surprisingly, our data showed that loss of FGF21 increases WAT lipolysis, as measured by circulating FFA levels in response to a cold challenge. These results are in agreement with an inhibitory role of liver FGF21 on WAT lipolysis and suggest that FGF21-independent mechanisms mediate the improvements of the catecholamine response following deletion of FOXO1 in L-AktDKO mice. Another possible explanation for the impaired catecholamine response observed in L-AktDKO mice is decreased expression of β-adrenergic receptors. However, lipolysis stimulation ex vivo or gene expression of β-adrenergic receptors from BAT and WAT from control, L-AktDKO, and L-AktFoxo1TKO mice showed no significant changes, indicating that a defect in receptor expression does not underlie this effect (Figure 4J; Figures S7A–S7C). In addition, it is also plausible that reduced UCP1 expression per se in L-AktDKO mice can negatively affect the catecholamine response and adaptive thermogenesis (Matthias et al., 2000). Lastly, studies by Saltiel and colleagues have observed catecholamine resistance and decreased WAT lipolysis in obesity, caused by WAT inflammation and activation of phosphodiesterase 3B (PDE3B) by the protein kinases IKKε and TBK1 (Mowers et al., 2013). Consistent with this observation, we observed an increase in IL-1β gene expression, a known pro-inflammatory cytokine in the WAT of L-AktDKO mice, suggesting that inflammation may contribute to the anti-lipolysis effects (Figure S8A). Nevertheless, future studies will address the direct mechanism of how liver AKT-FOXO1 signaling regulates adipose tissue metabolic flexibility, including its regulation of catecholamine-induced lipolysis and UCP1 expression.
In addition to lipolysis, the physiologic role of endogenous FGF21 in controlling thermogenesis is debated. Two important studies have directly evaluated the role of liver-derived FGF21 in thermoregulation (Huang et al., 2017; Ameka et al., 2019). In both studies the same mouse model (strain and age) was used; however, different conclusions were reported. Huang et al. (2017) argued that loss of FGF21 in the liver did not have an effect on thermoregulation. In contrast, Ameka et al. (2019) demonstrated that loss of liver FGF21 affects thermoregulation following acute short-term cold exposure. In our study, we sought to determine the role of endogenous FGF21 in thermoregulation downstream of hepatic insulin action. We performed loss-of-function experiments that indicated FOXO1 is an important regulator of FGF21 expression, and this is required for proper cold tolerance and BAT thermogenic capacity. However, these effects were independent of changes in UCP1 and WAT lipolysis, suggesting that additional FGF21-independent mechanisms must exist to mediate the control of WAT lipolysis by liver AKT-FOXO1 signaling. These data support the work of Ameka et al. (2019) that liver-derived FGF21 plays a role in the acute cold response and BAT sympathetic nerve activity, rather than directly affecting UCP1 expression and generation of circulating nutrients. In addition, our data support the concept that liver FGF21, the main contributor of circulating FGF21 (Markan et al., 2014), is under the direct control of hepatic insulin signaling via an AKT-FOXO1-dependent mechanism. This insulin control of FGF21 expression is consistent with human studies as well as in other mouse models with genetic deletion of hepatic FOXO1 (Haeusler et al., 2010; Ling et al., 2018; Samms et al., 2017).
In summary, maintaining core body temperature during cold exposure is essential for survival in mammals and requires proper inter-organ communication. In recent years, a series of seminal reports have begun to delineate the mechanisms of how this inter-organ communication is critical for the acute response to cold challenge (Schreiber et al., 2017; Shin et al., 2017; Simcox et al., 2017; Heine et al., 2018; Ameka et al., 2019). In this study, we showed a role for hepatic insulin action in response to acute cold exposure and the cell-nonautonomous regulation of adaptive thermogenesis. Mechanistically, we show that liver insulin signaling via the AKT-FOXO1 axis orchestrates the systemic thermogenic response to acute cold by regulating catecholamine-induced lipolysis in the WAT and inducing the BAT thermogenesis response via FGF21-dependent and -independent mechanisms.
STAR★METHODS
RESOURCE AVAILABILITY
Lead contact
Further information and requests for resources and reagents should be directed to and will be fulfilled by the lead contact, Paul M. Titchenell (ptitc@pennmedicine.upenn.edu).
Materials availability
This study did not generate new reagents. Mouse lines for this study are available from the lead contact with a completed materials transfer agreement.
Data and code availability
This study did not generate any unique datasets or code.
EXPERIMENTAL MODEL AND SUBJECT DETAILS
Mice
All mice used in all experiments were on a C57/B6J background and were males. To generate Akt1loxp/loxp; Akt2loxp/loxp; Foxo1loxp/loxp; Fgf21loxp/loxp we crossed Akt1loxp/loxp; Akt2loxp/loxp; Foxo1loxp/loxp mice with Fgf21loxp/loxp (kind gift from Dr. Soccio, UPenn). Akt1loxp/loxp; Akt2loxp/loxp, Akt1loxp/loxp; Akt2loxp/loxp; Foxo1loxp/loxp, Foxo1AAAloxp/loxp mice (kind gift Ming Li, Sloan Kettering) and Akt1loxp/loxp; Akt2loxp/loxp; Foxo1loxp/loxp; Fgf21loxp/loxp were injected at 6–14 weeks of age with 1011 genomic copies of adeno-associated virus 8 expressing either GFP or Cre recombinase under the liver-specific promoter, thyroxine-binding globulin (TBG), per mouse to generate Control, L-AktDKO, L-AktFoxo1TKO, L-Foxo1AAA, and L-AktFoxo1Fgf21QKO mice (Lu et al., 2012; Ouyang et al., 2012). The Control group consisted of GFP-injected littermates floxed for each group. Experiments were performed 2-weeks post AAV8-injection. AdipoqCre-positive male mice heterozygous for Akt2loxp/loxp were bred to females homozygous for Akt2loxp/loxp (Leavens et al., 2009), to generate AdipoqCre-positive experimental mice homozygous for Akt2loxp/loxp (F-AKT2KO) and AdipoqCre-negative male mice homozygous for Akt2loxp/loxp that served as Controls that were used at the ages of 8–14 weeks for experiment. All mice were housed at RT (22°C) unless specified otherwise. Animal use followed all standard and guidelines of the Institutional Animal Care and Use Committee (IACUC) at the University of Pennsylvania.
Primary hepatocyte isolation
Hepatocytes were isolated from 8–14 weeks random fed mice 2-weeks post AAV8-injection using a two-step collagenase/DNase digestion protocol (Titchenell et al., 2015) and plated in M199 media containing 5mM glucose, 10% FBS, 500nM dexamethasone, 1% Pen/Strep, and 100 nM insulin. Following attachment, cells were changed to M199 media containing 5mM glucose, 500nM dexamethasone. Cells were lysed in RIPA buffer described below and subjected to western blot analysis.
METHOD DETAILS
Cold tolerance test
Mice were transferred from room temperature to single houses at 4°C. Rectal temperature were measured every hour and mice were sacrificed after a 10-degree dropout of initial temperature or up to 5 hours at 4°C.
Body temperature
Core body temperature was measured in mice using a rectal probe (Type T Thermocouple Meter; 91428–02).
Thermogenic capacity and energy expenditure
For thermogenic capacity measurement, CLAMS metabolic chambers (Columbus Instruments) were warmed to 25°C. Mice were placed in chambers and sedated with 75 mg/kg Pentobarbital. After 3 rounds of reading, mice were injected with 1 mg/kg NE intra-peritoneally and VO2 was measured until mice woke up. For basal energy expenditure, mice were placed into CLAMS metabolic chambers warmed to 25°C. Oxygen consumption and carbon dioxide production were calculated as ml/hr. For NE response, oxygen consumption was normalized to initial Control mice response (T0’).
Food intake
Cumulative food intake was determined by manually weighing the food from single cages every six days.
Lipolysis in vivo upon CL 316,243 injection
Ad-libitum fed mice were sedated with 75 mg/kg Pentobarbital. After, mice were injected with 1mg/kg of CL 316,243 intra-peritoneally. Retro-orbital blood collection took place before and 30 min after CL injection, to measured FFA serum levels.
Lipolysis ex vivo
Fresh eWAT depots were dissected from ad-libitum fed mice and put into FluoroBrite DMEM. The depots were then cut into 4–6 small similar-sized pieces and transferred into 150 μL FluoroBrite DMEM supplemented with 2% FA-free BSA in 96-well plates for 30 min for pre-incubation. To analyze basal lipolysis, tissues were transferred into 150 μL of fresh FluoroBrite DMEM supplemented with 2% FA-free BSA for 60 min. Then, the tissues were transferred and pre-incubated for 30 min in 150 μL FluoroBrite DMEM supplemented with 2% FA-free BSA in the presence of 100 μM CL 316,243. To analyze stimulated lipolysis, tissues were transferred into 150 μL fresh FluoroBrite DMEM supplemented with 2% FA-free BSA and 100 μM of CL 316,243 for another 60 min. Glycerol content was analyzed by combining 5 μL of supernatant and 200 μL of Free Glycerol Reagent and incubating for 15 min at room temperature before measuring absorbance at 540 nm. At the end of the experiment, the tissue pieces were delipidated by CHCL3 extraction and solubilized in 0.3 N NaOH/0.1% SDS at 65°C overnight. Protein content was determined using Pierce BCA Protein assay. Results are expressed as μmol of glycerol per mg of tissue protein.
Body composition analysis
Body weight and body composition were measured using EchoMRI 3-in-1 system nuclear magnetic resonance spectrometer (Echo Medical Systems).
Western blotting
Adipose tissue samples were homogenized in RIPA (50mM Tris HCl, 1% Triton x100, 0.5% Sodium deoxycholate, 0.1% SDS, 150 mM NaCl, 2 mM EDTA) buffer supplemented with protease inhibitor cocktail tablets, and phosphatase inhibitor cocktail II and III in a TissueLyser (QIAGEN). Samples were separated on 4%–15% Mini-PROTEAN TGX pre-cast gels. Primary antibodies used were UCP1, HSP90, AKT1, AKT2, HSL, P-HSL, Perilipin, P-Perilipin, IGFBP1, P-PKA Substrate, P-AKT1/2, P-AKT2, S6, P-S6, and P-PRAS40.
mRNA isolation and real-time PCR
Total RNA was isolated from the frozen livers and adipose tissue samples using the RNeasy Plus kit from QIAGEN. Complementary DNA was generated using M-MuLV reverse transcriptase and quantitated for the relative expression of genes of interest by real time PCR using the SYBR Green dye-based assay.
Glucose tolerance test
For glucose tolerance test, overnight fasted mice were injected with 2 g/kg of glucose solution intra-peritoneally. Blood glucose was measured at 0, 15, 30, 60, 120 min after glucose injection.
Glycerol tolerance test
For glycerol tolerance test, 8 hours fasted mice were injected with 2 mg/kg of glycerol solution intra-peritoneally. Glycerol levels were measured at 0, 30, 60, 90, 120, 150, 180 min after glycerol injection.
Histology
BAT was fixed in 10% buffered formalin overnight, dehydrated in ethanol, paraffin-embedded and sectioned. Sections were stained with hematoxylin and eosin. Scale bar, 100 μm or 200 μm as indicated.
Hepatic triglyceride
Liver samples were homogenized in cell lysis buffer (140mM NaCl, 50mM pH7.4 Tris, 250 μL 20% Triton-X) the samples were then solubilized with 20 μl of 1% deoxycholate and incubated at 37°C for 10 min. For triglyceride measurements, 200 μl of infinity triglyceride reagent was added and incubated for 10 min at 37°C. The triglyceride content was determined using a standard curve generated with triglyceride standard.
Serum collection and extraction for acylcarnitine levels
Blood was collected after a fasting cold tolerance test in a 1.5mL EDTA-free tube, after 30 min at RT the samples were centrifuged at 8000 rpm for 5 min at RT. Then, ice-cold methanol was added to the sample and kept at RT for 20 min, before centrifugation at 4°C for 10 min. The supernatant was transfer to a new tube and the pellet was mixed with 40:40:20 ratio of methanol:acetonitrile:water solution and kept on ice for 10 min before centrifugation at 4°C for 10 min. The supernatant was combined with the previous one to make a final extract. Finally, the extract was dried and sent for MS analysis by the Penn Metabolomics Core at Princeton University as previously described (Papazyan et al., 2016).
Blood chemistry
Serum FFA concentration was measured using NEFA-HR (2) R1 and R2 reagents following manufacture’s instruction, glycerol concentrations were measured using 5 μL of sample and 200 μL free glycerol reagent. Both methods were quantified using enzymatic colorimetric analysis. Blood glucose levels were measured using a glucometer. Insulin levels were measured using an ultrasensitive ELISA. FGF21 levels were measured using an ELISA.
QUANTIFICATION AND STATISTICAL ANALYSIS
Statistical analysis was performed using One-way ANOVAs when more than two groups were compared, Two-way ANOVAs when two conditions were analyzed, and unpaired two-tailed Students’ t test when two groups were being assayed. All data were presented as mean ± SEM. * indicates p value < 0.05, ** indicates p value < 0.01, *** indicates p value < 0.001.
Supplementary Material
KEY RESOURCES TABLE
| REAGENT or RESOURCE | SOURCE | IDENTIFIER |
|---|---|---|
| Antibodies | ||
| UCP1 | R&D Systems | Cat# MAB6158; RRID:AB_10572490 |
| HSP90 | Cell Signaling Technology | Cat# 4874; RRID:AB_2121214 |
| AKT1 | Cell Signaling Technology | Cat# 2938; RRID:AB_915788 |
| AKT2 | Cell Signaling Technology | Cat# 2964; RRID:AB_331162 |
| HSL | Cell Signaling Technology | Cat# 4107; RRID:AB_2296900 |
| P-HSL (Ser660) | Cell Signaling Technology | Cat# 4126; RRID:AB_490997 |
| Perilipin | Cell Signaling Technology | Cat# 9349; RRID:AB_10829911 |
| P-Perilipin (Ser522) | Vala Sciences | Cat# NC0859674 |
| IGFBP1 | Santa Cruz | Cat# sc-6000; RRID:AB_2123087 |
| P-PKA Substrate | Cell Signaling Technology | Cat# 9624; RRID:AB_331817 |
| P-AKT1/2 (Ser473/Ser474) | Cell Signaling Technology | Cat# 4060; RRID:AB_2315049 |
| P-AKT2 (Ser474) | Cell Signaling Technology | Cat# 8599; RRID:AB_26303478 |
| S6 | Cell Signaling Technology | Cat# 2217; RRID:AB_331355 |
| P-S6 (Ser240/244) | Cell Signaling Technology | Cat# 2215; RRID:AB_331682 |
| P-PRAS40 (Thr246) | Cell Signaling Technology | Cat# 2997; RRID:AB_2258110 |
| Bacterial and virus strains | ||
| AAV8-TBG-CRE | University of Pennsylvania Vector Core | N/A |
| AAV8-TBG-eGFP | University of Pennsylvania Vector Core | N/A |
| Biological samples | ||
| Murine Liver | This Paper | N/A |
| Murine Brown Adipose Tissue | This Paper | N/A |
| Murine White Inguinal Adipose Tissue | This Paper | N/A |
| Murine Epididymal Adipose Tissue | This Paper | N/A |
| Chemicals, peptides, and recombinant proteins | ||
| CL 316,243 | Sigma-Aldrich | C5976 |
| Norepinephrine | Sigma-Aldrich | A9512 |
| FluoroBrite DMEM | Thermo Fisher Scientific | A1896701 |
| Protease Inhibitor Cocktail Tablets | Roche | 04693159001 |
| Phosphatase Inhibitor Cocktail 2 | Sigma-Aldrich | P5726-5ML |
| Phosphatase Inhibitor Cocktail 3 | Sigma-Aldrich | P0044-5ML |
| M-MuLV | New England Biolabs | M0253L |
| SYBR Green | Fisher Scientific | 4368702 |
| Glycerol | MP Biomedicals | 800688 |
| 10% Buffered Formalin | Fisher Scientific | SF100-4 |
| TRIzol | Fisher Scientific | 10-296-028 |
| Critical commercial assays | ||
| Free Glycerol Reagent | Sigma-Aldrich | F6428 |
| Infinity Triglyceride Reagent | Thermo Scientific | TR22421 |
| NEFA-HR (2) Reagent A | Wako Chemicals | 999-34691 |
| NEFA-HR (2) Reagent B | Wako Chemicals | 991-34891 |
| NEFA-HR (2) Solvent A | Wako Chemicals | 995-34791 |
| NEFA-HR (2) Solvent B | Wako Chemicals | 993-35191 |
| Insulin ELISA | Crystal Chem | 90080 |
| FGF21 ELISA | BioVendor | RD291108200R |
| RNeasy Mini Kit | QIAGEN | 74106 |
| RNase-Free DNase Set | QIAGEN | 79254 |
| Experimental models: Cell lines | ||
| Murine primary hepatocytes | This Paper | N/A |
| Experimental models: Organisms/strains | ||
| Mouse/B6: Akt1loxp/loxp; Akt2loxp/loxp | Lu et al., 2012 | N/A |
| Mouse/B6: Akt1loxp/loxp; Akt2loxp/loxp; Foxo1loxp/loxp | Lu et al., 2012 | N/A |
| Mouse/B6: FoxoAAA1loxp/loxp | Ouyang et al., 2012 | N/A |
| Mouse/B6: Akt1loxp/loxp; Akt2loxp/loxp; Foxo1loxp/loxp; Fgf21loxp/loxp | This Paper | N/A |
| Mouse/B6: Akt2loxp/loxp | Leavens et al., 2009 | N/A |
| Mouse/B6: AdipoqCre | Jackson Laboratories | Stock No: 028020 |
| Oligonucleotides | ||
| See Table S1 for RT PCR primers | This Paper | N/A |
| Software and algorithms | ||
| Prism V8.4.2 | GraphPad | https://www.graphpad.com/scientific-software/prism/ |
| QuantStudio Software V1.4.2—for QuantStudio 5 Real-Time PCR Systems | Thermo Fisher | https://www.thermofisher.com/order/catalog/product/A28140?SID=srch-hj-A28140#/A28140?SID=srch-hj-A28140 |
Highlights.
Hepatic AKT is activated in response to cold exposure and β3 adrenergic stimulation
Lack of AKT in liver leads to cold sensitivity
Hepatic AKT signaling via FOXO1 induces FGF21 expression
FOXO1 cell-nonautonomously regulates adipose tissue thermogenesis
ACKNOWLEDGMENTS
We thank the entire Titchenell lab and Drs. Raymond Soccio, Anthony Angueira, Alexander Sakers, and Marine Adlanmerini for thoughtful discussion and feedback. We also thank Jean C. De Jesús-Colón for help with the graphical abstract. P.M.T. is supported by NIH grant R01DK125497 and institutional startup funds from the University of Pennsylvania and the Cox Research Institute. M.J.P. is supported by NIH grant R01DK106104. The Viral Vector Core, Histology Core, and Metabolomics Core of the University of Pennsylvania are supported by NIH Diabetes Research Center DK 19525.
INCLUSION AND DIVERSITY
One or more of the authors of this paper self-identifies as an underrepresented ethnic minority in science. One or more of the authors of this paper received support from a program designed to increase minority representation in science. The author list of this paper includes contributors from the location where the research was conducted who participated in the data collection, design, analysis, and/or interpretation of the work.
Footnotes
SUPPLEMENTAL INFORMATION
Supplemental information can be found online at https://doi.org/10.1016/j.celrep.2021.109128.
DECLARATION OF INTERESTS
The authors declare no competing interests.
REFERENCES
- Ameka M, Markan KR, Morgan DA, BonDurant LD, Idiga SO, Naber MC, Zhu Z, Zingman LV, Grobe JL, Rahmouni K, and Potthoff MJ (2019). Liver derived FGF21 maintains core body temperature during acute cold exposure. Sci. Rep 9, 630. [DOI] [PMC free article] [PubMed] [Google Scholar]
- Aoyama H, Daitoku H, and Fukamizu A (2006). Nutrient control of phosphorylation and translocation of Foxo1 in C57BL/6 and db/db mice. Int. J. Mol. Med 18, 433–439. [PubMed] [Google Scholar]
- Arner P, Pettersson A, Mitchell PJ, Dunbar JD, Kharitonenkov A, and Rydén M (2008). FGF21 attenuates lipolysis in human adipocytes—a possible link to improved insulin sensitivity. FEBS Lett. 582, 1725–1730. [DOI] [PubMed] [Google Scholar]
- Badman MK, Koester A, Flier JS, Kharitonenkov A, and Maratos-Flier E (2009). Fibroblast growth factor 21-deficient mice demonstrate impaired adaptation to ketosis. Endocrinology 150, 4931–4940. [DOI] [PMC free article] [PubMed] [Google Scholar]
- Bartness TJ, Vaughan CH, and Song CK (2010). Sympathetic and sensory innervation of brown adipose tissue. Int. J. Obes 34 (Suppl 1), S36–S42. [DOI] [PMC free article] [PubMed] [Google Scholar]
- Blondin DP, Labbé SM, Tingelstad HC, Noll C, Kunach M, Phoenix S, Guérin B, Turcotte ÉE, Carpentier AC, Richard D, and Haman F (2014). Increased brown adipose tissue oxidative capacity in cold-acclimated humans. J. Clin. Endocrinol. Metab 99, E438–E446. [DOI] [PMC free article] [PubMed] [Google Scholar]
- Bloom JD, Dutia MD, Johnson BD, Wissner A, Burns MG, Largis EE, Dolan JA, and Claus TH (1992). Disodium (R,R)-5-[2-[[2-(3-chlorophenyl)-2-hydroxyethyl]-amino] propyl]-1,3-benzodioxole-2,2-dicarboxylate (CL 316,243). A potent beta-adrenergic agonist virtually specific for beta 3 receptors. A promising antidiabetic and antiobesity agent. J. Med. Chem 35, 3081–3084. [DOI] [PubMed] [Google Scholar]
- BonDurant LD, and Potthoff MJ (2018). Fibroblast Growth Factor 21: A Versatile Regulator of Metabolic Homeostasis. Annu. Rev. Nutr 38, 173–196. [DOI] [PMC free article] [PubMed] [Google Scholar]
- Brunet A, Bonni A, Zigmond MJ, Lin MZ, Juo P, Hu LS, Anderson MJ, Arden KC, Blenis J, and Greenberg ME (1999). Akt promotes cell survival by phosphorylating and inhibiting a Forkhead transcription factor, 96, pp. 857–868. [DOI] [PubMed] [Google Scholar]
- Burgering BM, and Coffer PJ (1995). Protein kinase B (c-Akt) in phosphatidylinositol-3-OH kinase signal transduction. Nature 376, 599–602. [DOI] [PubMed] [Google Scholar]
- Cannon B, and Nedergaard JAN (2004). Brown adipose tissue: Function and physiological significance. Physiol. Rev 84, 277–359. [DOI] [PubMed] [Google Scholar]
- Chitraju C, Fischer AW, Farese RV Jr., and Walther TC (2020). Lipid droplets in brown adipose tissue are dispensable for cold-induced thermogenesis. Cell Rep. 33, 108348. [DOI] [PMC free article] [PubMed] [Google Scholar]
- Cho H, Mu J, Kim JK, Thorvaldsen JL, Chu Q, C. EB Iii, Kaestner KH, Bartolomei MS, Shulman GI, and Birnbaum MJ (2001). Insulin resistance and a diabetes mellitus-like syndrome in mice lacking the protein kinase Akt2 (PKBβ). Science 292, 1728–1732. [DOI] [PubMed] [Google Scholar]
- Cypess AM, Lehman S, Williams G, Tal I, Rodman D, Goldfine AB, Kuo FC, Palmer EL, Tseng Y-H, and Doria A (2009). Identification and importance of brown adipose tissue in adult humans. New Engl. J. Med 360, 1509–1517. [DOI] [PMC free article] [PubMed] [Google Scholar]
- Ding X, Boney-Montoya J, Owen BM, Bookout AL, Coate KC, Mangelsdorf DJ, and Kliewer SA (2012). βKlotho is required for fibroblast growth factor 21 effects on growth and metabolism. Cell Metab. 16, 387–393. [DOI] [PMC free article] [PubMed] [Google Scholar]
- Easton RM, Cho H, Roovers K, Shineman DW, Mizrahi M, Forman MS, Lee VM-Y, Szabolcs M, de Jong R, Oltersdorf T, et al. (2005). Role for Akt3/protein kinase Bγ in attainment of normal brain size. Mol. Cell. Biol 25, 1869–1878. [DOI] [PMC free article] [PubMed] [Google Scholar]
- Egan JJ, Greenberg AS, Chang MK, Wek SA, Moos MC Jr., and Londos C (1992). Mechanism of hormone-stimulated lipolysis in adipocytes: Translocation of hormone-sensitive lipase to the lipid storage droplet. Proc. Natl. Acad. Sci. USA 89, 8537–8541. [DOI] [PMC free article] [PubMed] [Google Scholar]
- Geng L, Liao B, Jin L, Huang Z, Triggle CR, Ding H, Zhang J, Huang Y, Lin Z, and Xu A (2019). Exercise alleviates obesity-induced metabolic dysfunction via enhancing FGF21 sensitivity in adipose tissues. Cell Rep. 26, 2738–2752. e4. [DOI] [PubMed] [Google Scholar]
- Guan D, Xiong Y, Trinh TM, Xiao Y, Hu W, Jiang C, Dierickx P, Jang C, Rabinowitz JD, and Lazar MA (2020). The hepatocyte clock and feeding control chronophysiology of multiple liver cell types. Science 369, 1388–1394. [DOI] [PMC free article] [PubMed] [Google Scholar]
- Haeusler RA, Han S, and Accili D (2010). Hepatic FoxO1 ablation exacerbates lipid abnormalities during hyperglycemia. J. Biol. Chem 285, 26861–26868. [DOI] [PMC free article] [PubMed] [Google Scholar]
- Heine M, Fischer AW, Schlein C, Jung C, Straub LG, Gottschling K, Mangels N, Yuan Y, Nilsson SK, Liebscher G, et al. (2018). Lipolysis triggers a systemic insulin response essential for efficient energy replenishment of activated brown adipose tissue in mice. Cell Metab. 28, 644–655. e4. [DOI] [PubMed] [Google Scholar]
- Himms-Hagen J (1976). Cellular thermogenesis. Annu. Rev. Physiol 38, 315–351. [DOI] [PubMed] [Google Scholar]
- Hollstein T, Heinitz S, Ando T, and Rodzevik TL (2020). Metabolic responses to 24-hour fasting and mild cold exposure in overweight individuals are correlated and accompanied by changes in FGF21 concentration. Diabetes 69, 1382–1388. [DOI] [PMC free article] [PubMed] [Google Scholar]
- Huang Z, Zhong L, Lee JTH, Zhang J, Wu D, Geng L, Wang Y, Wong CM, and Xu A (2017). The FGF21-CCL11 axis mediates beiging of white adipose tissues by coupling sympathetic nervous system to type 2 immunity. Cell Metab. 26, 493–508. e4. [DOI] [PubMed] [Google Scholar]
- Inagaki T, Dutchak P, Zhao G, Ding X, Gautron L, Parameswara V, Li Y, Goetz R, Mohammadi M, Esser V, et al. (2007). Endocrine regulation of the fasting response by PPARα-mediated induction of fibroblast growth factor 21. Cell Metab. 5, 415–425. [DOI] [PubMed] [Google Scholar]
- Izumiya Y, Bina HA, Ouchi N, Akasaki Y, Kharitonenkov A, and Walsh K (2008). FGF21 is an Akt-regulated myokine. FEBS Lett. 582, 3805–3810. [DOI] [PMC free article] [PubMed] [Google Scholar]
- Jacobsson A, Stadler U, Glotzer MA, and Kozak LP (1985). Mitochondrial uncoupling protein from mouse brown fat. Molecular cloning, genetic mapping, and mRNA expression. J. Biol. Chem 260, 16250–16254. [PubMed] [Google Scholar]
- Jaiswal N, Gavin MG, Quinn WJ 3rd, Luongo TS, Gelfer RG, Baur JA, and Titchenell PM (2019). The role of skeletal muscle Akt in the regulation of muscle mass and glucose homeostasis. Mol. Metab 28, 1–13. [DOI] [PMC free article] [PubMed] [Google Scholar]
- Kharitonenkov A, Shiyanova TL, Koester A, Ford AM, Micanovic R, Galbreath EJ, Sandusky GE, Hammond LJ, Moyers JS, Owens RA, et al. (2005). FGF-21 as a novel metabolic regulator. J. Clin. Invest 115, 1627–1635. [DOI] [PMC free article] [PubMed] [Google Scholar]
- Kharitonenkov A, Dunbar JD, Bina HA, Bright S, Moyers JS, Zhang C, Ding L, Micanovic R, Mehrbod SF, Knierman MD, et al. (2008). FGF-21/FGF-21 receptor interaction and activation is determined by βKlotho. J. Cell. Physiol 215, 1–7. [DOI] [PubMed] [Google Scholar]
- Kops GJ, de Ruiter ND, De Vries-Smits AM, Powell DR, Bos JL, and Burgering BM (1999). Direct control of the Forkhead transcription factor AFX by protein kinase B. Nature 398, 630–634. [DOI] [PubMed] [Google Scholar]
- Leavens KF, Easton RM, Shulman GI, Previs SF, and Birnbaum MJ (2009). Akt2 is required for hepatic lipid accumulation in models of insulin resistance. Cell Metab. 10, 405–418. [DOI] [PMC free article] [PubMed] [Google Scholar]
- Lee P, Greenfield JR, Ho KKY, and Fulham MJ (2010). A critical appraisal of the prevalence and metabolic significance of brown adipose tissue in adult humans. Am. J. Physiol. Endocrinol. Metab 299, E601–E606. [DOI] [PubMed] [Google Scholar]
- Lee P, Brychta RJ, Linderman J, Smith S, Chen KY, and Celi FS (2013). Mild cold exposure modulates fibroblast growth factor 21 (FGF21) diurnal rhythm in humans: relationship between FGF21 levels, lipolysis, and cold-induced thermogenesis. J. Clin. Endocrinol. Metab 98, E98–E102. [DOI] [PMC free article] [PubMed] [Google Scholar]
- Lee P, Smith S, Linderman J, Courville AB, Brychta RJ, Dieckmann W, Werner CD, Chen KY, and Celi FS (2014). Temperature-acclimated brown adipose tissue modulates insulin sensitivity in humans. Diabetes 63, 3686–3698. [DOI] [PMC free article] [PubMed] [Google Scholar]
- Li X, Ge H, Weiszmann J, Hecht R, Li YS, Véniant MM, Xu J, Wu X, Lindberg R, and Li Y (2009). Inhibition of lipolysis may contribute to the acute regulation of plasma FFA and glucose by FGF21 in ob/ob mice. FEBS Lett. 583, 3230–3234. [DOI] [PubMed] [Google Scholar]
- Ling AV, Gearing ME, Semova I, Shin D-J, Clements R, Lai ZW, and Biddinger SB (2018). FoxO1 is required for most of the metabolic and hormonal perturbations produced by hepatic insulin receptor deletion in male mice. Endocrinology 159, 1253–1263. [DOI] [PMC free article] [PubMed] [Google Scholar]
- Lu M, Wan M, Leavens KF, Chu Q, Monks BR, Ahima RS, Ueki K, Kahn CR, and Birnbaum MJ (2012). Insulin regulates liver metabolism in vivo in the absence of hepatic Akt and Foxo1. Nat. Med 18, 388–395. [DOI] [PMC free article] [PubMed] [Google Scholar]
- Manning BD, and Toker A (2017). AKT/PKB signaling: Navigating the network. Cell 169, 381–405. [DOI] [PMC free article] [PubMed] [Google Scholar]
- Markan KR, Naber MC, Ameka MK, Anderegg MD, Mangelsdorf DJ, Kliewer SA, Mohammadi M, and Potthoff MJ (2014). Circulating FGF21 is liver derived and enhances glucose uptake during refeeding and overfeeding. Diabetes 63, 4057–4063. [DOI] [PMC free article] [PubMed] [Google Scholar]
- Matthias A, Ohlson KBE, Fredriksson JM, Jacobsson A, Nedergaard J, and Cannon B (2000). Thermogenic responses in brown fat cells are fully UCP1-dependent: UCP2 or UCP3 do not substitute for UCP1 in adrenergically or fatty acid-induced thermogenesis. J. Biol. Chem 275, 25073–25081. [DOI] [PubMed] [Google Scholar]
- Morrison SF, Madden CJ, and Tupone D (2012). Central control of brown adipose tissue thermogenesis. Front. Endocrinol. (Lausanne) 3, 1–19. [DOI] [PMC free article] [PubMed] [Google Scholar]
- Mowers J, Uhm M, Reilly SM, Simon J, Leto D, Chiang S-H, Chang L, and Saltiel AR (2013). Inflammation produces catecholamine resistance in obesity via activation of PDE3B by the protein kinases IKKε and TBK1. Elife 2, e01119. [DOI] [PMC free article] [PubMed] [Google Scholar]
- O-Sullivan I, Zhang W, Wasserman DH, Liew CW, Liu J, Paik J, DePinho RA, Stolz DB, Kahn CR, Schwartz MW, and Unterman TG (2015). FoxO1 integrates direct and indirect effects of insulin on hepatic glucose production and glucose utilization. Nat. Commun 12, 7079. [DOI] [PMC free article] [PubMed] [Google Scholar]
- Ogawa Y, Kurosu H, Yamamoto M, Nandi A, Rosenblatt KP, Goetz R, Eliseenkova AV, Mohammadi M, and Kuro-o M (2007). βKlotho is required for metabolic activity of fibroblast growth factor 21. Proc. Natl. Acad. Sci. USA 104, 7432–7437. [DOI] [PMC free article] [PubMed] [Google Scholar]
- Ouyang W, Liao W, Luo CT, Yin N, Huse M, Kim MV, Peng M, Chan P, Ma Q, Mo Y, et al. (2012). Novel Foxo1-dependent transcriptional programs control Treg cell function. Nature 491, 554–559. [DOI] [PMC free article] [PubMed] [Google Scholar]
- Papazyan R, Sun Z, Kim YH, Titchenell PM, Hill DA, Lu W, Damle M, Wan M, Zhang Y, Briggs ER, et al. (2016). Physiological suppression of lipotoxic liver damage by complementary actions of HDAC3 and SCAP/SREBP. Cell Metab. 24, 863–874. [DOI] [PMC free article] [PubMed] [Google Scholar]
- Perry RJ, Camporez JG, Kursawe R, Titchenell PM, Zhang D, Perry CJ, Jurczak MJ, Abudukadier A, Han MS, Zhang X-M, et al. (2015). Hepatic acetyl CoA links adipose tissue inflammation to hepatic insulin resistance and type 2 diabetes. Cell 160, 745–758. [DOI] [PMC free article] [PubMed] [Google Scholar]
- Samms RJ, Lewis JE, Norton L, Stephens FB, Gaffney CJ, Butterfield T, Smith DP, Cheng CC, Perfield JW 2nd, Adams AC, et al. (2017). FGF21 is an insulin-dependent postprandial hormone in adult humans. J. Clin. Endocrinol. Metab 102, 3806–3813. [DOI] [PMC free article] [PubMed] [Google Scholar]
- Schreiber R, Diwoky C, Schoiswohl G, Feiler U, Wongsiriroj N, Abdellatif M, Kolb D, Hoeks J, Kershaw EE, Sedej S, et al. (2017). Cold-induced thermogenesis depends on ATGL-mediated lipolysis in cardiac muscle, but not brown adipose tissue. Cell Metab. 26, 753–763. e7. [DOI] [PMC free article] [PubMed] [Google Scholar]
- Seale P, and Lazar MA (2009). Brown fat in humans: Turning up the heat on obesity. Diabetes 58, 1482–1484. [DOI] [PMC free article] [PubMed] [Google Scholar]
- Shearin AL, Monks BR, Seale P, and Birnbaum MJ (2016). Lack of AKT in adipocytes causes severe lipodystrophy. Mol. Metab 5, 472–479. [DOI] [PMC free article] [PubMed] [Google Scholar]
- Shin H, Ma Y, Chanturiya T, Cao Q, Wang Y, Kadegowda AKG, Jackson R, Rumore D, Xue B, Shi H, et al. (2017). Lipolysis in brown adipocytes is not essential for cold-induced thermogenesis in mice. Cell Metab. 26, 764–777. e5. [DOI] [PMC free article] [PubMed] [Google Scholar]
- Simcox J, Geoghegan G, Maschek JA, Bensard CL, Pasquali M, Miao R, Lee S, Jiang L, Huck I, Kershaw EE, et al. (2017). Global analysis of plasma lipids identifies liver-derived acylcarnitines as a fuel source for brown fat thermogenesis. Cell Metab. 26, 509–522. e6. [DOI] [PMC free article] [PubMed] [Google Scholar]
- Smith RE, and Horwitz BA (1969). Brown fat and thermogenesis. Physiol. Rev 49, 330–425. [DOI] [PubMed] [Google Scholar]
- Suzuki M, Uehara Y, Motomura-Matsuzaka K, Oki J, Koyama Y, Kimura M, Asada M, Komi-Kuramochi A, Oka S, and Imamura T (2008). βKlotho is required for fibroblast growth factor (FGF) 21 signaling through FGF receptor (FGFR) 1c and FGFR3c. Mol. Endocrinol 22, 1006–1014. [DOI] [PMC free article] [PubMed] [Google Scholar]
- Tang Y, Wallace M, Sanchez-Gurmaches J, Hsiao W-Y, Li H, Lee PL, Vernia S, Metallo CM, and Guertin DA (2016). Adipose tissue mTORC2 regulates ChREBP-driven de novo lipogenesis and hepatic glucose metabolism. Nat. Commun 7, 11365. [DOI] [PMC free article] [PubMed] [Google Scholar]
- Tao R, Wang C, Stöhr O, Qiu W, Hu Y, Miao J, Dong XC, Leng S, Stefater M, Stylopoulos N, et al. (2018). Inactivating hepatic follistatin alleviates hyperglycemia. Nat. Med 24, 1058–1069. [DOI] [PMC free article] [PubMed] [Google Scholar]
- Titchenell PM, Chu Q, Monks BR, and Birnbaum MJ (2015). Hepatic insulin signalling is dispensable for suppression of glucose output by insulin in vivo. Nat. Commun 6, 7078. [DOI] [PMC free article] [PubMed] [Google Scholar]
- Titchenell PM, Quinn WJ, Lu M, Chen J, Rabinowitz JD, Birnbaum MJ, and Birnbaum MJ (2016). Direct hepatocyte insulin signaling is required for lipogenesis but is dispensable for the suppression of glucose production. Cell Metab. 23, 1154–1166. [DOI] [PMC free article] [PubMed] [Google Scholar]
- Titchenell PM, Lazar MA, and Birnbaum MJ (2017). Unraveling the regulation of hepatic metabolism by insulin. Trends Endocrinol. Metab 28, 497–505. [DOI] [PMC free article] [PubMed] [Google Scholar]
- Walker KS, Deak M, Paterson A, Hudson K, Cohen P, and Alessi DR (1998). Activation of protein kinase B beta and gamma isoforms by insulin in vivo and by 3-phosphoinositide-dependent protein kinase-1 in vitro: comparison with protein kinase B alpha. Biochem. J 331, 299–308. [DOI] [PMC free article] [PubMed] [Google Scholar]
- Yoneshiro T, Aita S, Matsushita M, Kayahara T, Kameya T, Kawai Y, Iwanaga T, and Saito M (2013). Recruited brown adipose tissue as an antiobesity agent in humans. J. Clin. Invest 123, 3404–3408. [DOI] [PMC free article] [PubMed] [Google Scholar]
- Zechner R, Zimmermann R, Eichmann TO, Kohlwein SD, Haemmerle G, and Lass A (2012). Fat signals: Lipases and lipolysis in lipid metabolism and signaling. Cell Metab. 15, 279–291. [DOI] [PMC free article] [PubMed] [Google Scholar]
- Zhang W, Patil S, Chauhan B, Guo S, Powell DR, Le J, Klotsas A, Matika R, Xiao X, Franks R, et al. (2006). FoxO1 regulates multiple metabolic pathways in the liver: Effects on gluconeogenic, glycolytic, and lipogenic gene expression. J. Biol. Chem 281, 10105–10117. [DOI] [PubMed] [Google Scholar]
Associated Data
This section collects any data citations, data availability statements, or supplementary materials included in this article.
Supplementary Materials
Data Availability Statement
This study did not generate any unique datasets or code.