Yang et al. applied a microfluidics-based imaging method to resolve a controversy regarding how ubiquitinated lysosome membrane proteins are sorted into the lumen for degradation. ESCRTs, but not intralumenal fragments, are responsible for the sorting.
Abstract
The lysosome (or vacuole in fungi and plants) is an essential organelle for nutrient sensing and cellular homeostasis. In response to environmental stresses such as starvation, the yeast vacuole can adjust its membrane composition by selectively internalizing membrane proteins into the lumen for degradation. Regarding the selective internalization mechanism, two competing models have been proposed. One model suggests that the ESCRT machinery is responsible for the sorting. In contrast, the ESCRT-independent intralumenal fragment (ILF) pathway proposes that the fragment generated by homotypic vacuole fusion is responsible for the sorting. Here, we applied a microfluidics-based imaging method to capture the complete degradation process in vivo. Combining live-cell imaging with a synchronized ubiquitination system, we demonstrated that ILF cargoes are not degraded through intralumenal fragments. Instead, ESCRTs function on the vacuole membrane to sort them into the lumen for degradation. We further discussed challenges in reconstituting vacuole membrane protein degradation.
Introduction
The lysosome (or vacuole in fungi and plants) is an essential organelle responsible for the recycling of intracellular materials. It also plays a vital role in nutrient sensing and intracellular signaling through the mTORC1 complex (Lim and Zoncu, 2016). In response to changing environment, the lysosome can adjust its membrane composition by down-regulating membrane proteins. In the past few years, there has been a fast-growing interest in understanding the mechanism of lysosome membrane regulation in yeast (Arines et al., 2021; Hatakeyama et al., 2019; Karim et al., 2018; Li et al., 2015a; Li et al., 2015b; McNally and Brett, 2018; McNally et al., 2017; Morshed et al., 2020; Oku et al., 2017; Sardana and Emr, 2021; Sardana et al., 2019; Yang et al., 2018; Yang et al., 2020; Zhu et al., 2017; Zhu et al., 2020). So far, the consensus is that vacuole membrane (VM) proteins are internalized and degraded by lumenal proteases. However, questions like what conditions might trigger the degradation and what machinery is responsible for sorting cargo proteins are still debatable. Specifically, two competing hypotheses have been proposed.
We and others observed that the ESCRT (endosomal sorting complexes required for transport) machinery is important for the internalization of VM proteins (Hatakeyama et al., 2019; Li et al., 2015a; Li et al., 2015b; Morshed et al., 2020; Oku et al., 2017; Yang et al., 2020; Zhu et al., 2017). Several stress conditions, such as changes in substrate concentrations or TORC1 inactivation, can trigger the degradation of VM transporters. These transporters are ubiquitinated by VM-anchored E3 ubiquitin ligases. Then, the ESCRT machinery is recruited to internalize ubiquitinated cargoes for degradation.
A second model, known as the intralumenal fragment (ILF) pathway, proposes that the fragment created by homotypic vacuole–vacuole fusion is responsible for selectively sorting VM proteins into the lumen for degradation (Karim et al., 2018; McNally et al., 2017). This sorting process is ESCRT independent but requires fusion machinery such as Rab7. The ILF model also differs from the ESCRT model in its triggering conditions. Without stimulation, some VM proteins, such as Fth1 (a subunit of the iron transporter complex) and Cot1 (zinc importer), are already sorted into the ILF and constitutively degraded. Moreover, heat stress and cycloheximide (CHX) treatment, which presumably activates TORC1, can stimulate the degradation of many VM proteins via the ILF pathway. For example, both heat (37°C) and CHX treatment can stimulate the degradation of Fet5 (the other subunit of the iron transporter complex; McNally et al., 2017). Also, 37°C treatment resulted in the degradation of nearly 70% of Vph1 (Vo component of the vATPase) via the ILF pathway (Karim et al., 2018). Lastly, it was reported that the ILF pathway is also important for sorting plasma membrane (PM) transporters such as Hxt3 (a glucose transporter). In an ESCRT deletion mutant (vps36Δ), McNally and Brett showed that endocytosed Hxt3 was efficiently delivered to the VM. It was then sorted into ILFs for degradation (McNally and Brett, 2018).
Initially, it was thought that the two models could coexist to regulate different subsets of the VM proteins. However, there have been several conflicting observations. First, the two pathways have been shown to operate on the same cargoes. For example, Fth1, Vph1, and Cot1 have been characterized as ILF cargoes (Karim et al., 2018; McNally et al., 2017). However, we and others found their degradation to be ESCRT dependent (Hatakeyama et al., 2019; Li et al., 2015a; Oku et al., 2017; Yang et al., 2020). Second, we noticed that the homotypic vacuole fusion machinery, such as Vps18, is not important for the internalization of VM proteins once they are ubiquitinated (Zhu et al., 2017). Third, we observed that TORC1 inactivation leads to the degradation of ILF cargoes (Yang et al., 2020), which contradicts the claim that TORC1 inactivation inhibits the ILF pathway (McNally et al., 2017).
In this study, we used a microfluidics-based imaging method to capture the entire protein degradation process. We also developed a synchronized ubiquitination system to facilitate the imaging. Combining live-cell imaging with genetics and biochemistry, we carefully repeated the in vivo degradation assays for several ILF cargoes. We showed that heat and CHX do not stimulate ILF-based VM protein degradation. ESCRT-independent ILFs do form during homotypic vacuole fusion at a low frequency. However, they do not contribute to the degradation of VM proteins. Instead, ESCRTs are recruited to the VM to sort ubiquitinated cargoes for degradation.
Results and discussion
Time-lapse imaging of VM protein degradation in vivo
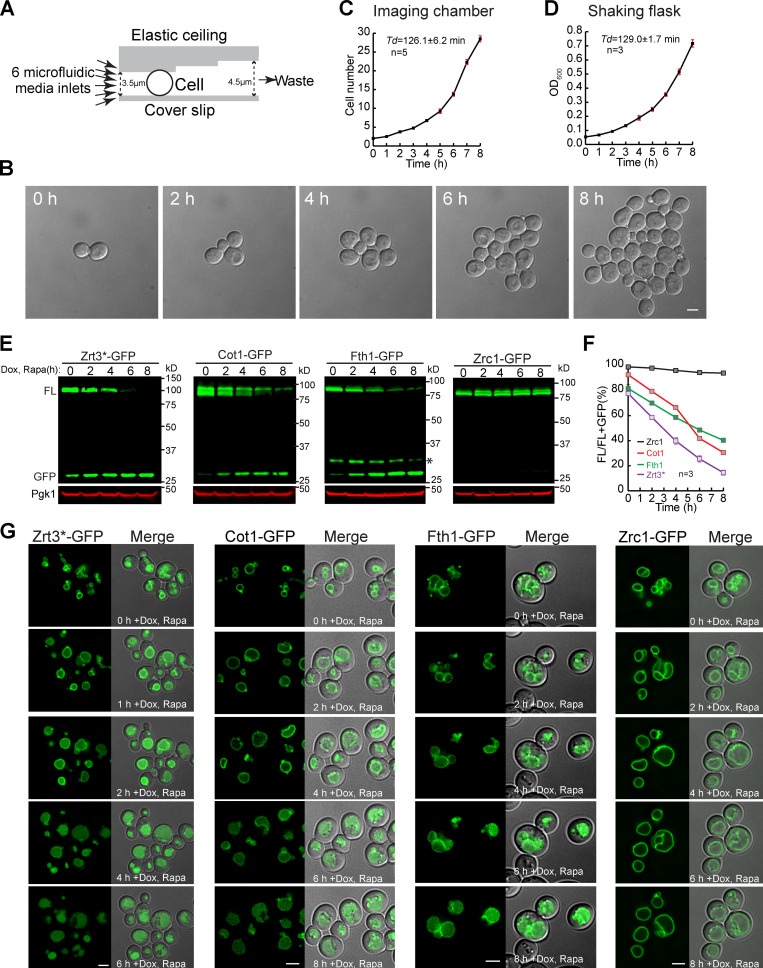
The two most commonly used techniques to study VM degradation are quantitative Western blots and snapshot imaging of GFP-tagged cargoes at different time points. Imaging of the entire VM protein degradation process had been surprisingly difficult. After several years of trying, we made a technical breakthrough by applying microfluidics to live-cell imaging. The elastic and oxygen-permeable ceiling of the microfluidic chamber gently holds yeast cells at the same focal plane. Besides, the six microfluidic media inlets allow the continuous supply of fresh media and rapidly switching of culture conditions (Fig. 1 A). At 26°C, the yeast doubling time (Td) was very similar between a microfluidic chamber and a shaking flask (Fig. 1, B–D; and Video 1).
Figure 1.
Developing a live-cell imaging method to study VM dynamics.(A) Design of a microfluidic imaging chamber. (B) Time-lapse imaging of mid-log cells in a microfluidic imaging chamber. (C and D) Growth curves showing the Td of WT cells in an imaging chamber (C) or shaking flask (D). Error bars represent SD. (E) Western blots to measure the degradation kinetics of VM proteins. Asterisk indicates the protease cleavage product. (F) Quantification (±SD, n = 3) of protein levels in E. (G) Time-lapse imaging to capture the degradation of VM proteins. Scale bars, 2 µm. Dox, doxycycline; FL, full-length protein fused with GFP; Rapa, rapamycin.
Video 1.
Growth of WT yeast cells in a microfluidic imaging chamber, related to Fig. 1 Mid-log WT cells (SEY6210) were loaded into a microfluidic imaging chamber and allowed to grow in the YNB complete medium for 8 h. Pictures were taken every 30 min. The video plays at 2 frames per second.
We then used the microfluidic system to study the effect of rapamycin treatment. Four GFP-tagged VM proteins, including Zrt3* (zinc exporter; Li et al., 2015a), Cot1, Fth1, and Zrc1 (zinc importer, a homologue of Cot1), were imaged (Fig. 1, E–G). To focus on the preexisting pool of VM proteins, we expressed all four proteins from a Tetracycline (TET)-OFF plasmid and pretreated cells with doxycycline to stop protein synthesis (Garí et al., 1997). The rapamycin treatment strongly inhibited yeast growth, and most cells divided no more than once. Besides growth defect, it also triggered the degradation of three VM proteins, with Zrt3* as the fastest.
In contrast, Zrc1-GFP was resistant to rapamycin, and the protein remained on the VM after 8 h of treatment. Cot1 and Fth1 were partially degraded (Fig. 1 G and Video 2). These imaging results were consistent with the degradation kinetics obtained by Western blots (Fig. 1, E and F). During the degradation of Zrt3* and Cot1, we also noticed a transient formation of some green punctae on the VM (arrows in Video 2), suggesting they might be sorted during degradation.
Video 2.
Rapamycin treatment triggers the degradation of Zrt3*-GFP, Cot1-GFP, Fth1-GFP, but not Zrc1-GFP, related to Fig. 1. All four proteins were expressed from a TET-OFF plasmid. Mid-log cells expressing one of the four proteins were loaded into a microfluidic imaging chamber and allowed to recover for 2 h (-2 h). 30 min (-30 min, 2 h for Fth1) before the addition of rapamycin, doxycycline was perfused into the chamber to stop the transcription. The time of adding rapamycin was recorded as 0 h The rapamycin treatment took 6–9 h. Pictures were taken every 30 min. During the treatment, several punctate structures (highlighted by white arrows) were observed. The video plays at 2 frames per second.
Interestingly, although the majority of Fth1-GFP was on the VM at time 0, a small fraction also localized to punctate structures (Fig. 1 G), which colocalized with FM4-64 stained endosomes (data not shown). They disappeared after doxycycline treatment, probably because the endosomal Fth1 trafficked to the vacuole. In addition, expressing Fth1-GFP from a TET-OFF plasmid generated a truncation product (asterisk, Fig. 1 E) that does not exist when GFP is chromosomally tagged.
Fth1 is not constitutively degraded, despite being localized to ILFs
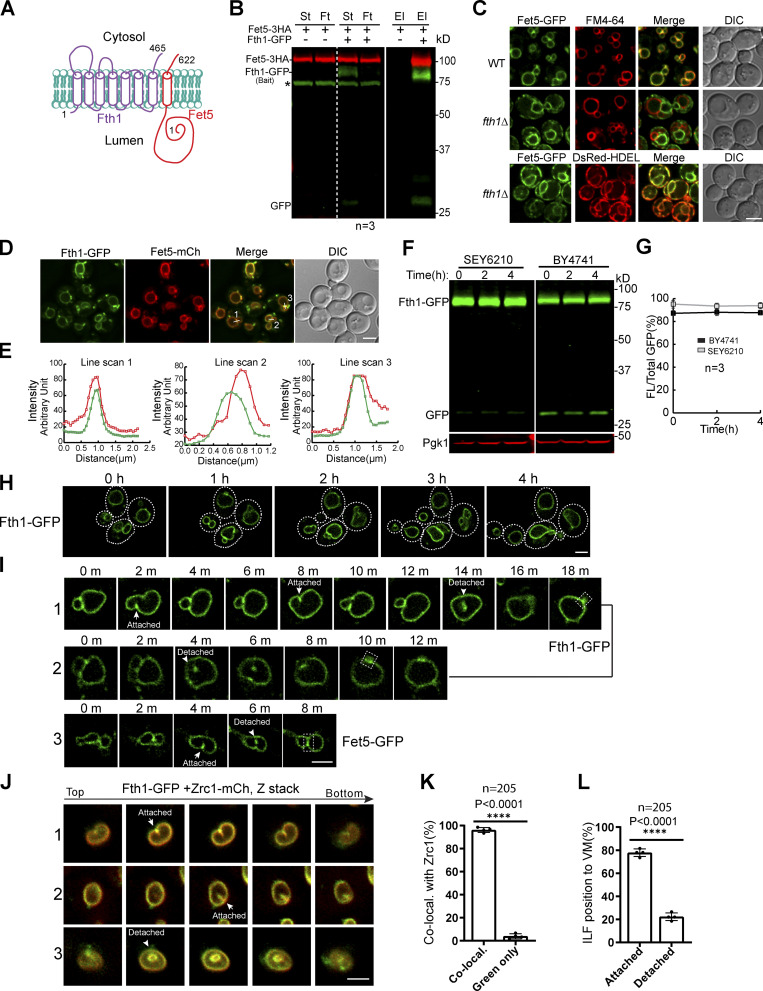
Next, we tested whether some VM proteins are degraded by the ILF pathway, starting with Fth1 and Fet5. ILF studies reported that Fth1 is constitutively sorted into the boundary membrane of two adjacent vacuoles, whereas Fet5 is excluded (McNally et al., 2017). However, because these two proteins share high sequence homology to the PM iron transporting complex Ftr1–Fet3 (Askwith et al., 1994; De Silva et al., 1995; Stearman et al., 1996; Strochlic et al., 2007), they were proposed to function as a complex (Fig. 2 A; Urbanowski and Piper, 1999). This hypothesis was confirmed by the immunoprecipitation experiment in Fig. 2 B. Importantly, when we deleted FTH1, Fet5 was trapped in the ER (Fig. 2 C), indicating complex formation is required for the proper folding and trafficking of Fet5. When coexpressed, Fth1-GFP always colocalizes with Fet5-mCherry at the vacuole boundary membrane, which contradicts the claim that they are physically separated (Fig. 2, D and E; McNally et al., 2017).
Figure 2.
Fth1 forms a stable complex with Fet5 and is not constitutively degraded.(A) Membrane topology of the Fth1–Fet5 complex. (B) Coimmunoprecipitation showing the interaction between Fth1 and Fet5. El, elution; Ft, flow through; St, starting material. Asterisk indicates the nonspecific band. (C) The complex formation is essential for Fet5 to exit the ER. FM4-64 and DsRed-HDEL highlight VM and ER, respectively. (D) Fth1-GFP colocalizes with Fet5-mCherry at the boundary membrane of adjacent vacuoles. (E) Line scans to show the colocalization in D. (F) Fth1-GFP is not constitutively degraded in either SEY6210 or BY4741 background. (G) Quantification (±SD, n = 3) of protein levels in F. (H) Time-lapse imaging to show no increase of lumenal GFP during normal vacuole fusion and fission processes. Dashed lines indicate the periphery of yeast cells. (I) Time-lapse imaging to show the formation of ILFs and their fusion back to the VM. (J and K) Images (J) and quantification (K) showing the colocalization of Fth1-GFP with Zrc1-mCherry on ILFs. Each data point in K represents a biological repeat. A total of 205 ILFs were counted. (L) Distribution of the ILFs relative to the VM. DIC, differential interference contrast. Scale bars, 3 µm.
This inconsistency prompted us to test if the majority of Fth1 is indeed constitutively degraded through ILFs. As shown in Fig. 2, F and G, although there was a background level of degradation and a minor difference between the two yeast strains (SEY6210 versus BY4741), free GFP levels did not increase over time in both strains. With live-cell imaging, we observed that vacuoles underwent normal fusion and fission processes (Fig. 2, H and I; and Videos 3 and 4). These fusion events led to the formation of either attached or detached fragments to the VM (Fig. 2, I and J). ILFs disappeared over time (2–8 min), but there was no increase in lumenal GFP. Instead, we observed either the appearance of bubble-like structures on the VM (Fig. 2 I, dashed boxes; and Video 4) or the restoration of the boundary membrane (i.e., fission; Fig. 2 I and Video 4), suggesting that ILFs might fuse back to the vacuole.
Video 3.
Fth1 is not constitutively degraded, related to Fig. 2. Mid-log cells expressing Fth1-GFP was loaded into a microfluidic imaging chamber and allowed to grow in a fresh YNB medium. After a brief recovery (30 min), images were taken every 2 min for 4 h with 2% laser power. No increase of lumenal free GFP was observed, despite the fact that vacuoles undergo normal fusion (highlighted by white arrows) and fission processes. Scale bar, 2 µm. The video plays at 8 frames per second.
Video 4.
ILFs fuse back to VM, related to Fig. 2. Mid-log cells expressing Fth1-GFP was loaded into a microfluidic imaging chamber and allowed to grow in a fresh YNB medium. After a brief recovery (30 min), images were taken every 2 min with a 2% laser power to track the observed ILFs. The video plays at 2 frames per second.
Lastly, to test if ILFs are involved in the selective sorting of Fth1-GFP, we coexpressed this protein with Zrc1-mCherry. Zrc1 is resistant to degradation, making it an ideal negative control for sorting (Fig. 1, E–G; Yang et al., 2020). As shown in Fig. 2, J and K, Zrc1-mCherry always colocalized with Fth1-GFP at ILFs (∼98%, n = 205), indicating they are not involved in a selective sorting process. Moreover, by taking Z stacks across the entire vacuole, we noticed that only a small fraction of ILFs (22%, n = 205) are detached from the VM (Fig. 2 L).
Altogether, we concluded that Fth1 is not constitutively degraded through ILFs. Its background degradation might be due to an ESCRT-dependent mechanism. Although ILFs do form during homotypic vacuole fusion, they are not involved in the selective sorting of VM proteins.
Neither CHX nor heat stress triggers VM protein degradation in vivo
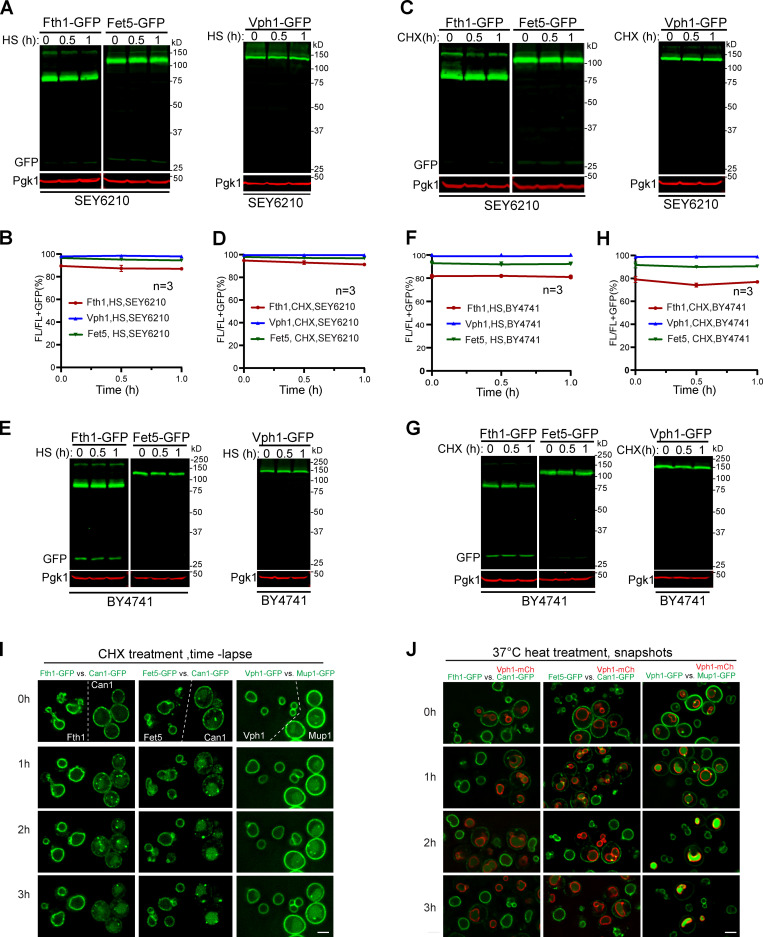
We then tested if either CHX or heat treatments can stimulate the degradation of VM proteins via the ILF pathway. We studied three ILF cargoes, including Fth1, Fet5, and Vph1. Following the ILF studies, we performed either CHX (100 µM) or heat (37°C) treatments for 1 h. Despite many attempts, we did not observe a significant degradation of these proteins (Fig. 3, A–H). The inability to repeat these experiments was not due to the strain differences, as both SEY6210 (Fig. 3, A–D) and BY4741 (Fig. 3, E–H) gave similar negative results.
Figure 3.
Neither CHX nor heat shock triggers the VM protein degradation in vivo.(A, C, E, and G) Western blots showing that Fth1-GFP, Fet5-GFP, and Vph1-GFP in either SEY6210 or BY4741 background were stable after 1-h heat shock (HS) at 37°C or CHX treatment. (B, D, F, and H) Quantification (±SD, n = 3) of protein levels in A, C, E, and G, respectively. (I) Time-lapse imaging showing the subcellular localization of VM-GFP (Fth1, Fet5, and Vph1) and PM-GFP (Can1 and Mup1) during CHX treatment. (J) Snapshot images showing the subcellular localization of VM-GFP (Fth1, Fet5, and Vph1) and PM-GFP (Can1 and Mup1) during heat treatment. For clarity, the PM-GFP strain was colabeled with Vph1-mCherry. Scale bar, 3 µm.
To ensure that our experiments were correctly conducted, we included GFP-tagged PM proteins, Can1 and Mup1, as positive controls (Lin et al., 2008; Nikko and Pelham, 2009; Savocco et al., 2019; Zhao et al., 2013) and extended the incubation time to 3–4 h. We mixed Can1-GFP with either Fth1-GFP or Fet5-GFP and Mup1-GFP with Vph1-GFP because of their similar GFP intensities under the microscope. Yeast cells expressing the paired PM-GFP and VM-GFP were treated in the same container. For CHX treatment, we used time-lapse imaging to compare PM with VM proteins. Because our microfluidic imaging chamber does not have a heating device, we performed the comparison of heat treatment in a shaking flask and imaged snapshots at different time points. As shown in Fig. 3, I and J; and Videos 5 and 6, both treatments led to the degradation of PM proteins, but not VM proteins. Consistent with our results, three independent groups have studied Vph1 under heat stress, and no degradation was reported (Ishii et al., 2018; Toulmay and Prinz, 2013; Zhao et al., 2013).
Video 5.
CHX triggers the degradation of PM, but not VM proteins, related to Fig. 3. Mid-log cells expressing either a PM-GFP protein (Mup1-GFP or Can1-GFP) or a VM-GFP protein (Fet5-GFP, Fth1-GFP, or Vph1-GFP) were mixed at a 1:1 ratio before being loaded into a microfluidic imaging chamber. After a brief recovery (30 min), the CHX-containing medium was perfused into the imaging chamber (time 0). Cells were incubated in the CHX-containing medium for 3–4 h, and images were taken every 30 min. The video plays at 2 frames per second.
Video 6.
Heat triggers the degradation of PM, but not VM proteins, related to Fig. 3. Mid-log cells expressing either a PM-GFP protein (Mup1-GFP or Can1-GFP) or a VM-GFP protein (Fet5-GFP, Fth1-GFP, or Vph1-GFP) were mixed at a 1:1 ratio in a shaking flask and diluted to OD600 = 0.10. The flask was then placed at 37°C for another 3–4 h. Samples were collected every hour and analyzed by snapshot imaging. PM-GFP strain was colabeled with Vph1-mCherry. Z stacks (0.4 µm per step) of the uncropped original images were shown at each time point. The video plays at 2 frames per second.
In conclusion, neither CHX nor heat shock could trigger the degradation of VM proteins in vivo. Our results are in stark contrast to the ILF studies and further question whether ILFs are involved in VM protein degradation.
The ESCRT machinery is essential for the internalization of VM proteins
Instead of ILFs, we and others have proposed that the ESCRT machinery is responsible for the internalization of cargo proteins (Hatakeyama et al., 2019; Li et al., 2015a; Li et al., 2015b; Oku et al., 2017; Zhu et al., 2017). The development of time-lapse imaging allowed us to study how ESCRT mutants might respond differently from WT cells.
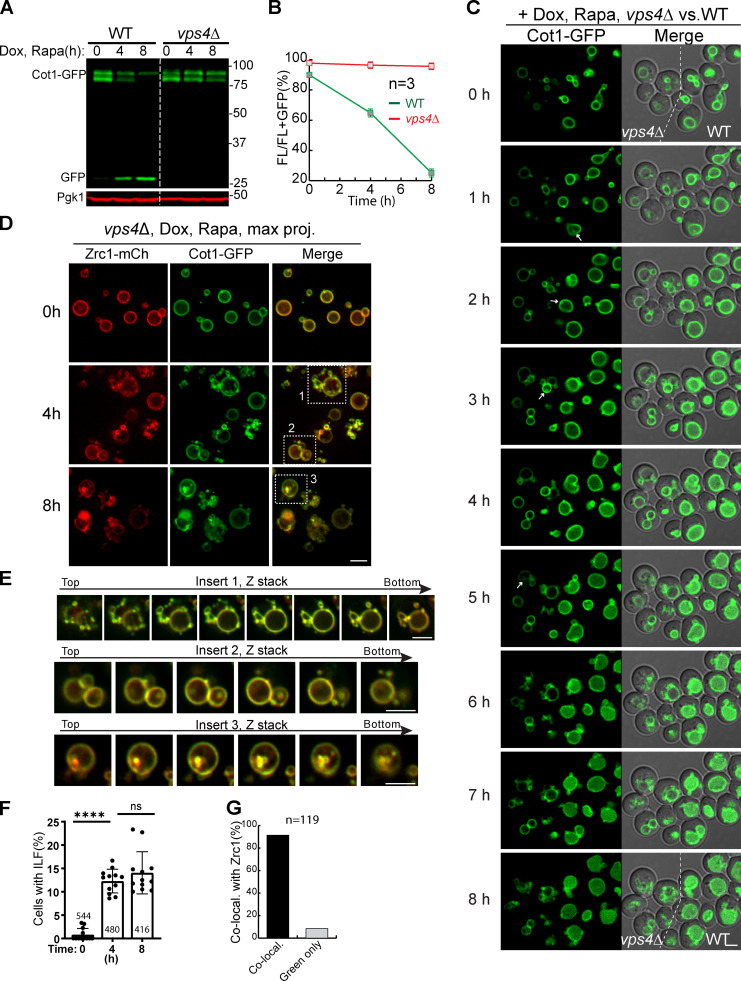
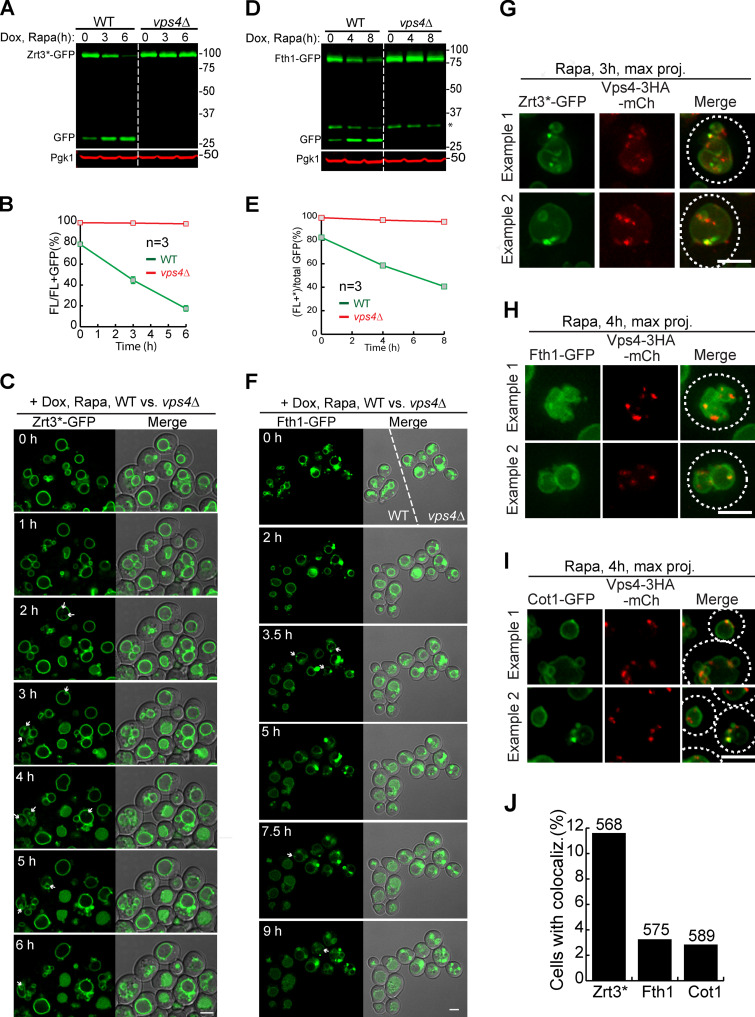
Because neither CHX nor heat can trigger VM degradation, we focused on the rapamycin treatment to perform time-lapse imaging. We imaged three VM proteins, including Cot1, Zrt3*, and Fth1, and compared the WT strain side by side with an ESCRT deletion strain (vps4Δ). To be distinguished from the WT, the vps4Δ strain was colabeled with Zrc1-mCherry. As shown in Fig. 4, Fig. S1, A–F, and Video 7, although rapamycin treatment led to degradation and accumulation of lumenal GFP in WT cells, VPS4 deletion stabilized all three proteins on the VM. These imaging results were consistent with the Western blot analysis.
Figure 4.
The ESCRT machinery is essential for the degradation of Cot1.(A) Western blots showing the degradation of Cot1-GFP in WT and vps4Δ cells. (B) Quantification (±SD, n = 3) of protein levels in A. (C) Time-lapse imaging of Cot1-GFP in WT and vps4Δ strains during an 8-h rapamycin treatment. Both strains were grown in the same imaging chamber. Arrows highlight the ILFs in vps4Δ cells. (D) Images showing the colocalization of Cot1-GFP with Zrc1-mCherry in vps4Δ strain cells during rapamycin treatment. (E) Z stacks showing the colocalization of Cot1-GFP with Zrc1-mCherry in the inserts of D. (F) Percentage of vps4Δ cells with ILF during rapamycin treatment. Error bars represent SD. Numbers on each column indicate the total number of cells counted. The statistical analysis was performed with a paired Student t test. ****, P ≤ 0.0001. (G) Quantification of the colocalization between Cot1-GFP and Zrc1-mCherry on ILF. Scale bars, 3 µm.
Figure S1.
The ESCRT machinery is essential for the degradation of VM proteins, related to Fig. 4.(A) Western blots showing the degradation of Zrt3*-GFP in WT and vps4Δ cells. (B) Quantification (±SD, n = 3) of protein levels in A. (C) Time-lapse imaging of Zrt3*-GFP in WT and vps4Δ strains during a 6-h rapamycin treatment. Both strains were grown in the same chamber. Arrows highlight the intralumenal structures in vps4Δ cells. (D) Western blots showing the degradation of Fth1-GFP in WT and vps4Δ strains. Asterisk indicates a 35-kD cleavage product of Fth1-GFP when expressed from a TET-OFF plasmid. (E) Quantification (±SD, n = 3) of protein levels in D. (F) Time-lapse imaging of Fth1-GFP in WT and vps4Δ cells during a 9-h rapamycin treatment. Both strains were grown in the same chamber. Arrows highlight the intralumenal structures in vps4Δ cells. (G–I) During rapamycin treatment, Zrt3* (G), Fth1 (H), and Cot1 (I) were sorted into punctate structures that colocalized with Vps4-3HA-mCherry. (J) Percentage of yeast cells that contain colocalized punctae. White dashed lines indicate the periphery of yeast cells. Numbers on top of the columns were the counted cell number. Dox, doxycycline; FL, full-length protein fused with GFP; Rapa, rapamycin. Scale bars, 3 µm.
Video 7.
The ESCRT machinery is essential for the degradation of VM proteins, related to Fig.4. All three imaged VM proteins (Zrt3*-GFP, Cot1-GFP, and Fth1-GFP) were expressed from a TET-OFF plasmid. WT and vps4Δ strains expressing these proteins were mixed at a 1:1 ratio before being loaded into a microfluidic imaging chamber. The vps4Δ strain was colabeled with Zrc1-mCherry. After a brief recovery, a doxycycline-containing medium was perfused into the chamber for 30 min (2 h for Fth1). Then, a medium that contained both doxycycline and rapamycin was perfused into the chamber, and imaging was started. Images were taken every 30 min. The intralumenal structures were highlighted with white arrows. The video plays at 2 frames per second.
In the case of Fth1, besides the VM signal, we also observed a significant amount of Fth1-GFP accumulating in bright punctae next to vacuoles, probably because the endosomal Fth1 was trapped in the aberrant endosomes (i.e., class E compartments; Fig. S1 F).
Strikingly, the time-lapse movie also revealed that some ILFs did form in a small but significant percentage of WT and vps4Δ cells for all three cargoes (Figs. 4 C, S1 C, and S1 F, arrows). Besides vps4Δ, we also observed ILFs in vps27Δ and vps23Δ cells previously (data not shown and Yang et al., 2020). Could these structures be involved in the sorting of VM proteins?
ESCRT-independent ILFs do not contribute to the sorting and degradation of VM proteins
The ILFs in the vps4Δ strain provided an opportunity to test if they contribute to VM protein degradation without the interference of ESCRTs. To answer this, we selected an ILF cargo, Cot1-GFP, and coexpressed it with the negative control, Zrc1-mCherry. As shown in Fig. 4, D and F, without rapamycin treatment, very few cells had ILFs (0.6%, n = 544 cells). After rapamycin treatment, we detected ILFs in 12.2% of cells at 4 h (n = 480 cells) and 13.8% at 8 h (n = 416 cells). Besides ILFs, vacuoles also appeared to be fragmented and formed many small external vacuolar structures after rapamycin treatment (Fig. 4 D and insert 1 of Fig. 4 E).
Of all 119 intralumenal structures that we counted, 110 of them (∼92%) showed colocalization with Zrc1-mCherry, strongly suggesting that they are not involved in a selective sorting process (Fig. 4 G). Consistently, there was no accumulation of free GFP in both Western blot and imaging (Fig. 4, A–D).
Taken together, we concluded that ILFs are not involved in the sorting and degradation of VM proteins even though they can form in ESCRT deletion strains.
The ESCRT machinery sorts ubiquitinated VM proteins
If the ESCRT machinery is responsible for sorting a ubiquitinated VM cargo, then it should colocalize with the cargo on the membrane. To test this, we chromosomally tagged VPS4 with 3HA-mCherry (Adell et al., 2017) and examined whether it colocalized with cargo proteins during rapamycin treatment.
As shown in Fig. S1, G–J, we did observe a small number of punctate structures on the VM that colocalized with Vps4-3HA-mCherry. However, the frequency was low (3.2% for Fth1, 2.8% for Cot1, and 11.6% for Zrt3*), probably due to the slow degradation rate of cargo proteins. As shown in Fig. 1 F, it took 8 h to degrade Cot1-GFP and Fth1-GFP partially. Zrt3* was the fastest degrading cargo (5–6 h), and it had the highest frequency of detecting the colocalization (Fig. S1 J).
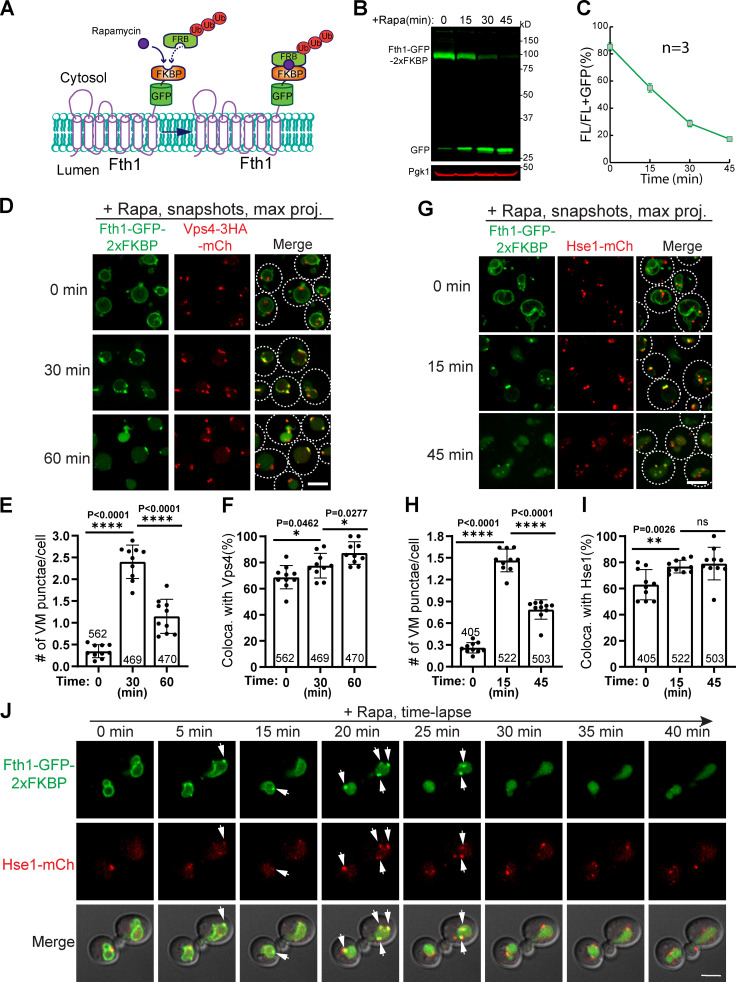
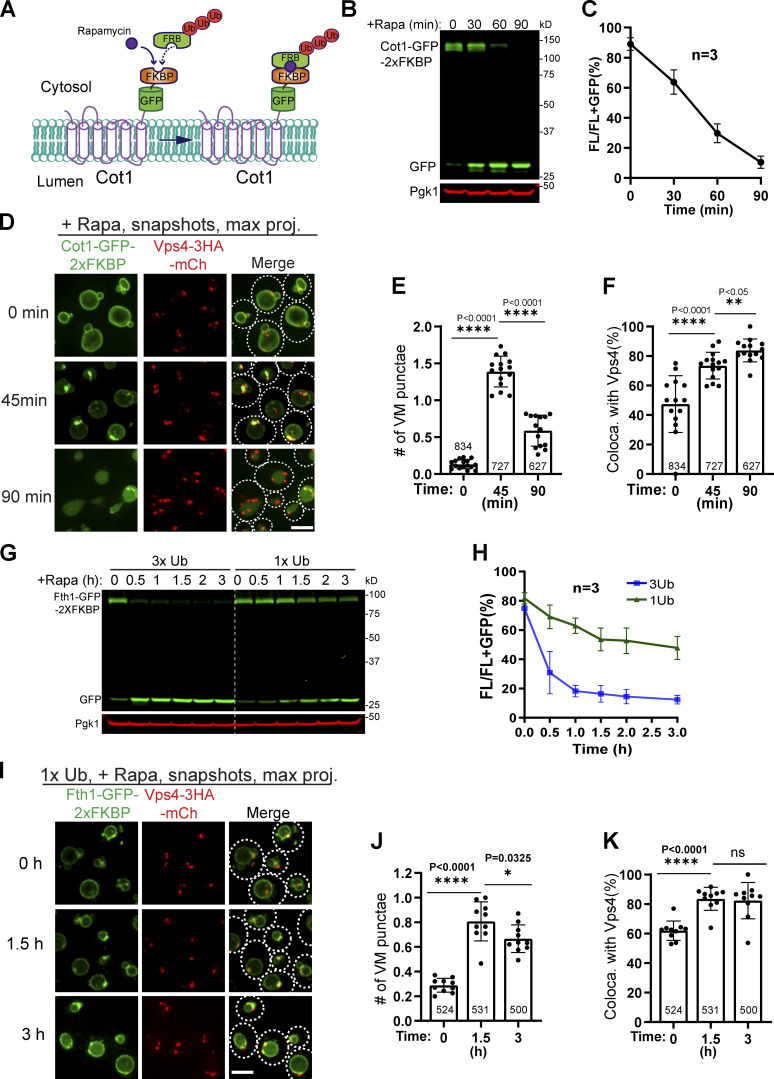
To expedite the degradation, we used the rapamycin-induced degradation (RapIDeg) system that we developed recently (Zhu et al., 2017). In this system, the background strain is rapamycin resistant (tor1-1, fpr1Δ; Haruki et al., 2008). Cargo proteins such as Cot1 and Fth1 are fused with GFP-2xFKBP, whereas a linear 3x ubiquitin (3xUb) is fused to FRB (Fig. 5 A and S2 A). Upon the addition of rapamycin, the FKBP domain dimerizes with the FRB domain. Consequently, the 3xUb will be recruited to the cargo protein to initiate a rapid degradation. This system takes ∼45 min to degrade Fth1-GFP-2xFKBP (Fig. 5, B and C) and ∼60 min to degrade Cot1-GFP-2xFKBP (Fig. S2, B and C).
Figure 5.
The ESCRT machinery colocalizes with ubiquitinated Fth1-GFP during RapID degradation.(A) Design of the RapIDeg system for Fth1 degradation. (B) Western blots showing the fast degradation of Fth1-GFP-2xFKBP. (C) Quantification (±SD, n = 3) of protein levels in B. (D) Snapshots showing the colocalization of Fth1-GFP-2xFKBP with Vps4-3HA-mCherry during degradation. Dashed lines indicate the periphery of yeast cells. (E and F) Quantification of the number of Fth1 punctae per cell and their colocalization with Vps4-3HA-mCherry in D. Error bars represent SD. Numbers on each column indicate the total number of cells counted. (G) Snapshot Imaging showing the colocalization of Fth1-GFP-2xFKBP with Hse1-mCherry during degradation. (H and I) Quantification of the number of Fth1 punctae per cell and their colocalization with Hse1-mCherry in D. (J) Time-lapse imaging to show the colocalization (arrows) of Fth1-GFP-2xFKBP punctae with Hse1-mCherry during degradation. Ub, ubiquitin. Scale bars, 3 µm.
Figure S2.
The ESCRT machinery colocalizes with ubiquitinated cargo proteins, related to Fig. 5.(A) Design of the 3xUb RapIDeg system for Cot1 degradation. (B) Western blots showing the fast degradation of Cot1-GFP-2xFKBP. (C) Quantification (±SD, n = 3) of protein levels in B. (D) Snapshots showing the colocalization of Cot1-GFP with Vps4-mCherry during degradation. (E and F) Quantification of the number of Cot1 punctae per cell and their colocalization with Vps4-mCherry in D. Each data point represents a single image containing ∼30–50 cells. A total of 13–15 images from three biological replicates were quantified at each time point. (G) Comparison of Fth1-GFP-2xFKBP degradation kinetics between 3xUb and 1xUb strains. (H) Quantification (±SD, n = 3) of protein levels in G. (I) Colocalization of Fth1-GFP-2xFKBP with Vps4-3HA-mCherry in the 1xUb RapIDeg strain. White dashed lines indicate the periphery of yeast cells. (J and K) Quantification of the number of Fth1 punctae per cell and their colocalization with Vps4-3HA-mCherry in I. Each data point represents a single image containing ∼50 cells. A total of 10 images from three biological replicates were quantified for each time point. Error bars represent SD. Numbers on each column indicated the total number of cells counted. The statistical analysis was performed with a paired Student t test. Scale bars, 3 µm.
Strikingly, 10–30 min after the addition of rapamycin, we observed that Fth1-GFP-2xFKBP was sorted into several (one to three per cell) bright punctate structures in nearly all cells (Fig. 5, D–I). The majority of these punctae colocalized with the ESCRT machinery (75.56% for Vps4 and 74.36% for Hse1; Fig. 5, F and I). The green punctae gradually diminished as the degradation was getting close to completion (Fig. 5, D–I). Similar sorting and colocalization were also observed for Cot1-GFP-2xFKBP (Fig. S2, A–F). Lastly, we performed time-lapse imaging and captured the colocalization between Fth1-GFP-2xFKBP and Hse1-mCherry (Fig. 5 J and Video 8).
Video 8.
The ESCRT machinery colocalizes with the ubiquitinated cargo during its degradation, related to Fig. 5. A 3xUb RapIDeg yeast strain coexpressing Fth1-GFP-2xFKBP and Hse1-mCherry was loaded into a microfluidic chamber. After a brief recovery (30 min), a rapamycin-containing medium was perfused into the chamber, and images were taken every 5 min. The video plays at 2 frames per second.
To rule out the possibility that the fast recruitment of ESCRTs is an artifact of the 3xUb system, we also tested FRB-1xUb with a lower affinity for ESCRTs. Compared with 3xUb, the degradation of Fth1-GFP-2xFKBP in a 1xUb strain was much slower (Fig. S2, G and H), and fewer sorting structures (0.8 punctae per cell versus 2.4 punctae per cell; Fig. S2, I and J vs. Fig. 5 E) were detected. Nevertheless, we observed a strong colocalization between Fth1 and Vps4 (Fig. S2, I–K), confirming that ESCRTs are recruited to the VM to sort ubiquitinated cargoes.
Altogether, our results provided compelling evidence to support that the ESCRT machinery is responsible for sorting ubiquitinated VM cargoes. Combined with the ESCRT deletion analysis (Fig. 4; and Fig. S1, A–F), the colocalization data strongly argued that VM proteins, such as Fth1 and Cot1, are not degraded by the ILF pathway.
The ESCRT machinery is essential for the degradation of PM protein Hxt3
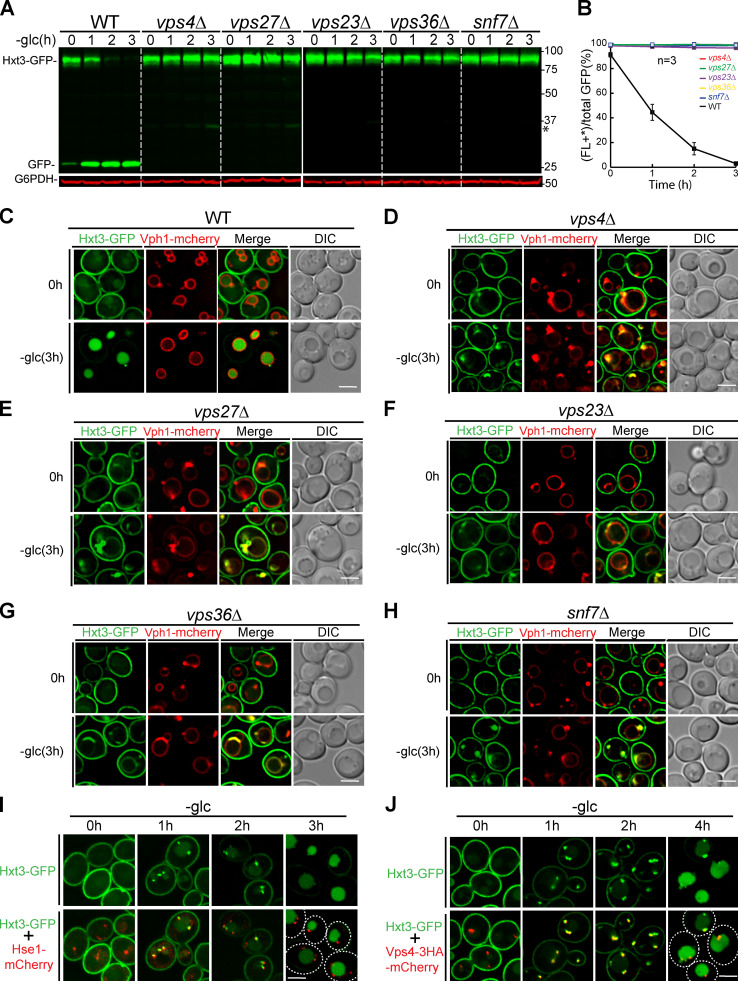
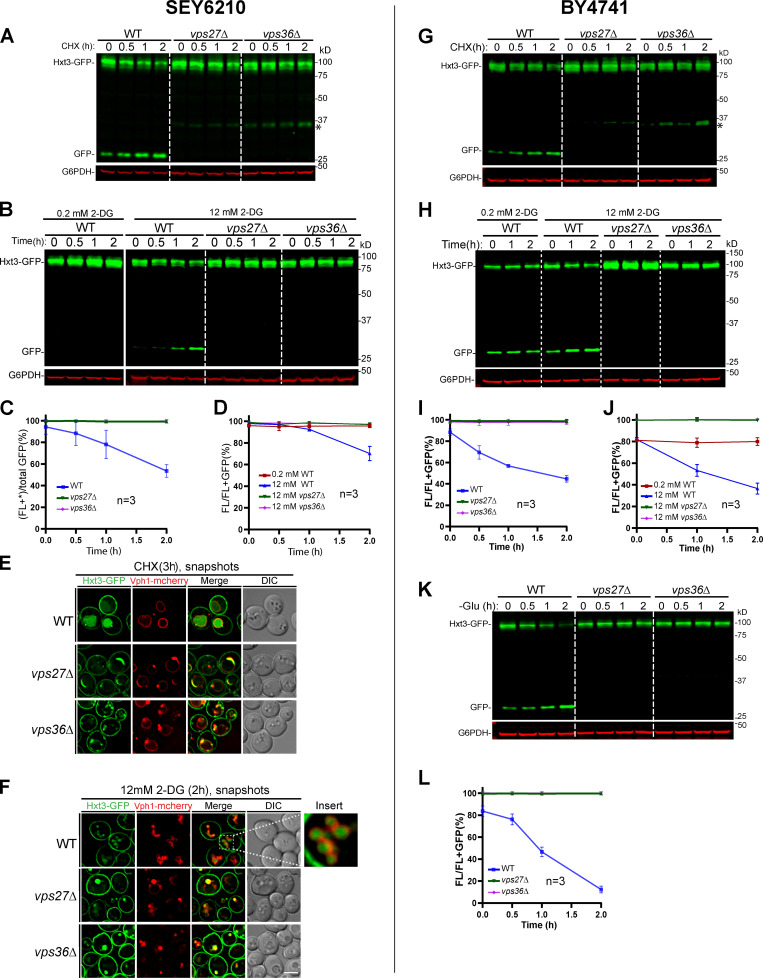
Besides VM proteins, the ILF pathway has been shown to be important for sorting mistargeted PM glucose transporter Hxt3 in an ESCRT-independent manner (McNally and Brett, 2018). Because our studies so far found no evidence to support the ILF pathway, we wondered whether Hxt3 degradation is ESCRT dependent. To answer this, we chromosomally tagged Hxt3 with GFP and subjected yeast cells to acute glucose starvation, CHX treatment, and 2-deoxy-d-glucose (2-DG; a toxic glucose analogue) treatment (Ivashov et al., 2020). Under these conditions, we observed various levels of Hxt3 degradation via endocytosis (Fig. S3, A and B; and Fig. S4, A–D). Concomitant with the degradation, free GFP accumulated in the vacuole lumen (Fig. S3 C; and Fig. S4, E and F). Of note, treating yeast with 0.2 mM 2-DG, as reported by McNally and Brett, did not trigger Hxt3-GFP degradation (Fig. S4, B and D). The concentration had to be increased to 12 mM (60-fold) to achieve a substantial degradation (Fig. S4, B and D; Defenouillère et al., 2019; O’Donnell et al., 2015). Under this concentration, vacuoles were highly fragmented, but we were still able to observe the accumulation of lumenal GFP (Fig. S4 F, insert).
Figure S3.
The ESCRT machinery is essential for the degradation of plasma protein Hxt3 during glucose starvation.(A) Western blots showing the degradation of Hxt3-GFP after glucose starvation in the indicated strains. Asterisk indicates a minor cleavage product from full-length protein. (B) Quantification (±SD, n = 3) of protein levels in A. (C–H) Subcellular localization of Hxt3-GFP before (0 h) and after (3 h) glucose starvation in WT (C), vps4Δ (D), vps27Δ (E), vps23Δ (F), vps36Δ (G), and snf7Δ (H) cells. (I and J) Colocalization of Hxt3-GFP with Hse1-mCherry (I) and Vps4-3HA-mCherry (J) during glucose starvation. Dashed lines indicate the periphery of yeast cells. Scale bars, 3 µm.
Figure S4.
The ESCRT machinery is essential for the degradation of PM protein Hxt3 in both SEY6210 and BY4741, related to Fig. S3.(A and B) Degradation of Hxt3-GFP in WT, vps27Δ, and vps36Δ cells in SEY6210 background under CHX (A) or 2-DG (B) treatment. The asterisk indicates a minor cleavage product from full-length protein. (C and D) Quantification (±SD, n = 3) of protein levels in A and B, respectively. (E) Subcellular localization of Hxt3-GFP in WT, vps27Δ, and vps36Δ cells after CHX treatment. (F) Subcellular localization of Hxt3-GFP in WT, vps27Δ, and vps36Δ cells after 2-DG treatment. The insert highlights fragmented vacuoles. (G and H) Degradation of Hxt3-GFP in WT, vps27Δ, and vps36Δ strains in BY4741 background under CHX (G) or 2-DG (H) treatment. (I and J) Quantification (±SD, n = 3) of protein levels in G and H, respectively. (K) Degradation of Hxt3-GFP under glucose starvation in WT, vps27Δ, and vps36Δ strains in BY4741 background. (L) Quantification (±SD, n = 3) of protein levels in K. Scale bars, 2 µm.
Next, we tested whether ESCRTs were dispensable for Hxt3 degradation. To this end, we systematically deleted components of each ESCRT subcomplex, including VPS4 (AAA ATPase), VPS27 (ESCRT-0), VPS23 (ESCRT-I), VPS36 (ESCRT-II), and SNF7 (ESCRT-III; Henne et al., 2011). As shown in Fig. S3, A–H, and Fig. S4, all deletions resulted in the block of Hxt3 degradation under all treatment conditions. Furthermore, the majority of endocytosed Hxt3 accumulated at the Vph1-mCherry–labeled class E compartment. Only a minimal amount of Hxt3-GFP was delivered to the VM. Importantly, we did not find the accumulation of free GFP in ESCRT mutants by either imaging or Western blotting, indicating there was no degradation of Hxt3-GFP by the ILF pathway. To further confirm the importance of the ESCRT machinery, we also performed colocalization assays. As shown in Fig. S3, I and J, endocytosed Hxt3-GFP clearly colocalized with Hse1-mCherry and Vps4-3HA-mCherry .
Again, our results contradicted the ILF model. Instead of being ESCRT independent, Hxt3 endocytosis depends on all stages of the ESCRT machinery. The inconsistency is not due to the strain background, because BY4741 gave similar results (Fig. S4, G–L).
In this study, we present in vivo evidence to challenge the ILF pathway. Our evidence includes (1) Fth1 and Fet5 are not physically separated by the vacuole boundary membrane. Instead, they form a stable protein complex. (2) Under CHX and heat shock, there was no degradation of ILF cargoes (Fth1, Fet5, and Vph1) in vivo. (3) The deletion of ESCRT components led to a complete block of ILF cargoes such as Fth1 and Cot1. (4) Although ILFs could form at a low frequency during homotypic vacuole fusion, they are not involved in the selective sorting of cargo proteins. (5) After protein ubiquitination, ILF cargoes, such as Fth1 and Cot1, were sorted into punctate structures that colocalized with the ESCRT machinery. (6) Any ESCRT deletion mutant completely blocked the degradation of Hxt3.
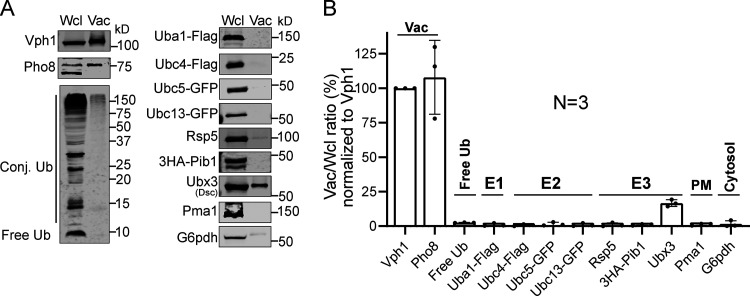
The majority of ILF studies were performed with an in vitro vacuole fusion system (Karim et al., 2018; McNally and Brett, 2018; McNally et al., 2017). However, this reconstituted reaction does not contain functional ubiquitination machinery. Of the three E3 ligases (the Dsc complex, Rsp5, and Pib1) that function on the VM (Yang et al., 2020), only the Dsc complex is a transmembrane E3 ligase complex (Fig. S5). Rsp5 and Pib1 are cytosolic proteins and are mostly missing in purified vacuoles. Furthermore, purified vacuoles do not contain E1, E2, and free ubiquitin (Fig. S5). Without the addition of these missing components, vacuoles are incapable of carrying out protein ubiquitination (Christiano et al., 2020). Essentially, besides being ESCRT independent, the reconstituted VM protein degradation by ILF studies is also ubiquitination independent. Confusingly, they still propose that ubiquitination triggers protein degradation (McNally et al., 2017). How to reconcile this apparent discrepancy remains to be addressed.
Figure S5.
Purified vacuoles do not contain a functional ubiquitination system.(A) Comparison of protein levels between whole-cell lysate (Wcl) and purified vacuoles (Vac). Samples that contain a similar level of Vph1 were loaded in each lane. (B) Quantification (±SD, n = 3) of the relative protein levels in A, which was normalized to Vph1.
Materials and methods
Yeast strains, plasmids, media, and growth conditions
All yeast strains and plasmids used in this study are listed in Table S1. Both Difco yeast peptone dextrose (YPD) broth and Difco yeast nitrogen base (YNB) without amino acids were purchased from MilliporeSigma. Yeast strains were grown in either YPD or YNB at 26°C before further analysis unless indicated otherwise.
Time-lapse imaging
The time-lapse imaging was performed with a CellASIC ONIX2 Microfluidic System (MilliporeSigma). Essentially, yeast cells were grown in a shaking flask to mid-log phase (OD600 ∼0.4–0.6) before being loaded into a CellASIC ONIX imaging plate (Y04C-02; MilliporeSigma). After loading, yeast cells were allowed to recover for another 30–120 min with the continuous supply of fresh YNB medium at 1 psi (6.7 kPa). The YNB medium can be quickly switched to other drug-containing media such as rapamycin (5 µg/ml) or CHX (100 µM) by perfusion at 5 psi (34.5 kPa) for 5 min. The end of the perfusion was defined as time 0 for drug treatment. After perfusion, a fresh drug-containing medium was continuously supplied at 2 psi (13.4 kPa). During treatment, images were collected using the DeltaVision system. To minimize photodamage, we used the lowest possible (typically 2–5%) laser power for imaging. Images were taken every 30 min unless indicated otherwise.
Growth curve analysis
Yeast cells were grown at 26°C in a shaking flask to mid-log phase (OD600 ∼0.5–0.7) and then diluted to OD600 = 0.05. Diluted yeast cells were allowed to grow under the same condition for another 8 h. The OD600 was measured every hour to plot the growth curve, and the Td was calculated accordingly.
Rapamycin treatment to induce VM protein degradation
Most of the VM proteins used in rapamycin treatment were expressed using a TET-OFF plasmid (pCM189). Yeast cells were grown in YNB minus uracil medium to mid-log phase (OD600 ∼0.4–0.6). Before rapamycin treatment, yeast cells were preincubated with 2 µg/ml doxycycline for an appropriate time to shut down protein synthesis and allow proper protein trafficking (20 min for Zrt3*-GFP, Cot1-GFP, and Zrc1-GFP and 2 h for Fth1-GFP). Rapamycin (ASW-135; LC Laboratories) was then added at 500 ng/ml and incubated for 6–8 h to induce VM degradation. Different time points were collected for Western and snapshot imaging analysis.
Glucose starvation assay
Yeast cells were first grown in YPD medium to mid-log phase (OD600 ∼0.4–0.6) and pelleted at 3,500 rpm for 5 min. After one wash with the starvation medium (yeast extract and peptone), cells were resuspended in the starvation medium and incubated at 26°C for an appropriate amount of time. Cells were then collected for further analysis.
2-DG treatment
Yeast cells were first grown in YPD medium to mid-log phase (OD600 ∼0.4–0.6), incubated with either 0.2 mM or 12 mM 2-DG (MilliporeSigma) for an appropriate amount of time, and collected for further analysis.
Microscopy and image processing
The microscopy and imaging processing were performed with a DeltaVision system (GE Healthcare Life Sciences) as described in Yang et al. (2018). The filter sets FITC (excitation, 475/28; emission, 525/48) and TRITC (excitation 542/27; emission 594/45) were used for GFP and mCherry, respectively. Basically, for snapshot imaging, yeast cells grown in YNB were imaged directly, while those grown in YPD (i.e., Fig. 5, D and G; Fig. S3, C–J; and Fig. S4, E and F) were washed with MilliQ water before imaging. Image acquisition and deconvolution were performed with the softWoRx program. The images were further cropped or adjusted using ImageJ (National Institutes of Health).
Coimmunoprecipitation
The immunoprecipitation (IP) assay was adapted from Arines et al., (2021), with some modifications. Basically, cells were grown overnight at 28°C in synthetic medium. At mid-log, 200 OD600 cells were collected by spinning at 7,000 rpm for 12 min and washed with MilliQ H2O. Pellets were resuspended in a 500 µl solution containing IP buffer (50 mM Hepes-KOH, pH 6.8; 150 mM KOAc; 2 mM MgOAc; 1 mM CaCl2; and 15% glycerol) with 0.1% Triton-X-100, 2x cOmplete Protease Inhibitor Cocktail (21169500; Roche), and 2 mM PMSF. Cell lysates were prepared by bead beating at 4°C for 10 min. An equal volume (500 µl) of IP buffer with 1.9% Triton-X-100 was added, and lysates were mixed by nutating at 4°C for 50 min. Lysates were collected by spinning at maximum speed at 4°C for 10 min. 1 ml of supernatant was transferred to a microcentrifuge tube kept on ice. At this step, 50 µl supernatant (starting material) was transferred to a new tube and mixed with 450 µl ice-cold MilliQ H2O and 60 µl 100% TCA. To the rest of the supernatant, 20 µl of GFP-Trap agarose beads (gta-20; Chromotek) was added, and the mixture was nutated at 4°C for 1 h. Beads were collected by spinning at 1,000 g for 30 s and set aside on ice. From the supernatant, 50 µl unbound material (flow through) was transferred to a new tube, and 450 µl ice-cold MilliQ H2O and 60 µl 100% TCA were added. Beads were washed four times with 50 µl IP buffer with 0.1% Triton-X-100, spinning at 1,000 g for 30 s each time. Beads were washed finally with 500 µl Hepes buffer (0.1 M Hepes-KOH, pH 7.5; and 0.15 M NaCl) with 0.1% Triton-X-100, and the supernatant was discarded. Bound proteins were eluted with 80 µl 2× urea sample buffer (150 mM Tris, pH 6.8; 2% SDS; 100 mM DTT; and bromophenol blue) followed by incubation at 65°C for 5 min. Beads were spun at 12,000 rpm for 1 min, and the supernatant (eluate) was collected.
Yeast sample preparation for Western blotting and antibodies
Yeast cells (7 OD600) were resuspended with 10% ice-cold TCA and incubated on ice for at least 1 h. After washing with 0.1% TCA, the cell pellets were resuspended in 70 µl 2× boiling buffer (150 mM Tris, pH 6.8; 6 M urea; 6% SDS; 10% glycerol; 100 mM DTT), lysed by bead beating for 5 min, and heat-treated at 65°C for another 5 min. After the addition of 70 µl 2× urea sample buffer (50 mM Tris, pH 7.5; 6 M urea; 10 mM EDTA; 2% SDS; 100 mM DTT; and 0.01% bromophenol blue), samples were treated for another round of bead beating and 65°C heating. After spinning at 13,000 g for 5 min, the supernatant was collected, subjected to SDS-PAGE, and transferred to nitrocellulose membranes for Western blotting analysis. To detect ubiquitin, after the transfer, the membrane was boiled for half an hour before blocking. Typically, 1 OD600 unit (20 µl) of yeast cells was loaded in each lane. For TET-OFF samples, the same volume of cells was loaded, with 0.5 OD600 units of cells loaded at 0 h.
The following antibodies were used in this study: G6PDH (1:10,000, A9521; MilliporeSigma), Pgk1 (1:5,000, 22C5D8; Invitrogen), mouse anti-GFP (1:500, sc-9996; Santa Cruz Biotechnology; used in all HXT3-related Western blots), rabbit anti-GFP (1:3,000, TP401; Torrey Pines Biolabs), Vph1 (1:2000, 10D7; Invitrogen), anti-HA (1:1,000, 16B12; BioLegend), anti-Flag (1:2,000, F7425; MilliporeSigma), and anti-ubiquitin (1:100, sc-8017; Santa Cruz Biotechnology). Antibodies against Pho8, Pma1, Ubx3, and Rsp5 were generous gifts from Daniel Klionsky (University of Michigan, Ann Arbor, MI), Amy Chang (University of Michigan, Ann Arbor, MI), Peter Espenshade (Johns Hopkins University, Baltimore, MD), and Scott Emr (Cornell University, Ithaca, NY), respectively.
Quantification and statistical analysis
The Western blotting images were scanned by the LI-COR Odyssey CLx system, and the band intensities were quantified from the raw data files using the Image Studio Ver5.2 software. The degradation efficiency was calculated as full-length protein/(full-length protein + free GFP) unless indicated otherwise.
For the quantification of microscope images, each data point represents a single image containing ∼30–50 cells, and a total of 10–15 images from three biological replicates were quantified for each time point. The statistical analysis was performed with paired Student t test. Error bars represent SD.
RapIDeg system
The RapIDeg strains were built as described in Zhu et al. (2017). Essentially, a rapamycin-resistant strain (SEY6210.1, tor1-1, fpr1Δ::NAT) was used as the starting strain. First, a pRS305-pGPD-FRB-3xUb plasmid was integrated into the genome to overexpress FRB-3xUb. To prevent the cleavage of linear 3xUb by deubiquitinases, we mutated Gly75 and Gly76 of the first and second ubiquitins to Ala-Ala. To stop the conjugation of FRB-3xUb to endogenous proteins, the Gly76 of the third ubiquitin was mutated to Glu. For the 1xUb system, the Gly76 of ubiquitin was also mutated to Glu.
Fth1 was chromosomally tagged with GFP-2xFKBP. For snapshot imaging, yeast cells were first grown in YPD to mid-log phase (OD600 ∼0.4–0.6) and then incubated with 1 µg/ml rapamycin for an appropriate amount of time. Cot1-GFP-2xFKBP was expressed from a TET-OFF plasmid. For snapshot imaging, yeast cells were grown in YNB minus uracil medium to mid-log phase (OD600 ∼0.4–0.6) before preincubating with 2 µg/ml doxycycline for 20 min. Then the cells were incubated with 1 µg/ml rapamycin for an appropriate amount of time and collected for imaging.
Vacuole purification
The vacuole purification assay was modified from a published protocol (Cabrera and Ungermann, 2008). Basically, 1 liter of yeast cells (OD600 ∼1.5) was harvested by spinning at 4,000 g for 10 min, resuspended in 50 ml weakening buffer (100 mM Tris-HCl, pH 9.4, and 10 mM DTT), and gently rocked at room temperature for 10 min to weaken the cell wall. The cells were then washed once with 10 ml spheroplasting media (0.05 M potassium phosphate, pH 7.5, 0.6 M sorbitol, and 0.16× YPD), resuspended with 25 ml spheroplasting media containing 200 µl of 10 mg/ml Zymolyase (120493–1; Amsbio), and incubated at 30°C for 30 min with gentle rocking. After washing once with 20 ml spheroplasting media, the spheroplasts were gently resuspended with 3.5 ml of 15% Ficoll solution in PS buffer (10 mM Pipes-KOH, pH 6.8, and 200 mM sorbitol, with protease inhibitors). Then, 200 µl of 0.4 mg/ml DEAE-Dextran solution in PS buffer was added to the spheroplasts, and the cells were lysed by incubation on ice for 5 min, at 30°C for 2 min, and then back to the ice for three or four rounds. The lysate was transferred to the bottom of an SW41 ultracentrifuge tube, and a discontinuous Ficoll gradient was set up by sequentially laying 2.5 ml of 8%, 2.5 ml of 4%, and 2.5 ml of 0% Ficoll solutions on the top. After 110,000 g spinning for 90 min at 4°C, intact vacuoles were collected at the interface between 0% and 4% Ficoll.
Online supplemental material
Fig. S1 shows the ESCRT machinery is essential for the degradation of VM proteins. Fig. S2 shows the ESCRT machinery colocalizes with ubiquitinated cargo proteins. Fig. S3 shows the ESCRT machinery is essential for the degradation of plasma protein Hxt3 during glucose starvation. Fig. S4 shows the ESCRT machinery is essential for the degradation of PM protein Hxt3 in both SEY6210 and BY4741. Fig. S5 shows that the purified vacuoles do not contain a functional ubiquitination system. Video 1 shows the growth of WT yeast cells in a microfluidic imaging chamber. Video 2 shows that rapamycin treatment triggers the degradation of Zrt3*-GFP, Cot1-GFP, and Fth1-GFP, but not Zrc1-GFP. Video 3 shows that Fth1 is not constitutively degraded. Video 4 shows that ILFs fuse back to VM. Video 5 shows that CHX triggers the degradation of PM, but not VM proteins. Video 6 shows that heat triggers the degradation of PM, but not VM proteins. Video 7 shows that the ESCRT machinery is critical for the degradation of VM proteins. Video 8 shows that the ESCRT machinery colocalizes with the ubiquitinated cargo during its degradation. Table S1 lists all strains and plasmids used in this study.
Supplementary Material
lists yeast strains and plasmids used in this study.
Acknowledgments
We thank the Li laboratory members, including V. Venkatarangan, W. Zhang, Y. Liu, G. Shi, A. Hamlin, and J. Zhang from the Wang laboratory, for their technical support. We also thank P. Espenshade, A. Chang, S. Emr, and J. Yin for generously sharing reagents. We are grateful to A. Mayer and L. Weisman for the critical reading of the manuscript.
This research is supported by a University of Michigan startup fund and MCubed 3.0 fund and National Institutes of Health grants GM133873 and GM133873-01S2 to M. Li.
The authors declare no competing financial interests.
Author contributions: Conceptualization, X. Yang and M. Li; methodology, X. Yang and M. Li; investigation, X. Yang, L. Reist, D.A. Chomchai, L. Chen, F.M. Arines, and M. Li; writing and editing, X. Yang and M. Li; funding acquisition, resources, and supervision, M. Li.
References
- Adell, M.A.Y., Migliano S.M., Upadhyayula S., Bykov Y.S., Sprenger S., Pakdel M., Vogel G.F., Jih G., Skillern W., Behrouzi R., et al. 2017. Recruitment dynamics of ESCRT-III and Vps4 to endosomes and implications for reverse membrane budding. eLife. 6:e31652. 10.7554/eLife.31652 [DOI] [PMC free article] [PubMed] [Google Scholar]
- Arines, F.M., Hamlin A.J., Yang X., Liu Y.J., and Li M.. 2021. A selective transmembrane recognition mechanism by a membrane-anchored ubiquitin ligase adaptor. J. Cell Biol. 220:e202001116. 10.1083/jcb.202001116 [DOI] [PMC free article] [PubMed] [Google Scholar]
- Askwith, C., Eide D., Van Ho A., Bernard P.S., Li L., Davis-Kaplan S., Sipe D.M., and Kaplan J.. 1994. The FET3 gene of S. cerevisiae encodes a multicopper oxidase required for ferrous iron uptake. Cell. 76:403–410. 10.1016/0092-8674(94)90346-8 [DOI] [PubMed] [Google Scholar]
- Cabrera, M., and Ungermann C.. 2008. Purification and in vitro analysis of yeast vacuoles. Methods Enzymol. 451:177–196. 10.1016/S0076-6879(08)03213-8 [DOI] [PubMed] [Google Scholar]
- Christiano, R., Arlt H., Kabatnik S., Mejhert N., Lai Z.W., Farese R.V. Jr., and Walther T.C.. 2020. A Systematic Protein Turnover Map for Decoding Protein Degradation. Cell Rep. 33:108378. 10.1016/j.celrep.2020.108378 [DOI] [PMC free article] [PubMed] [Google Scholar]
- De Silva, D.M., Askwith C.C., Eide D., and Kaplan J.. 1995. The FET3 gene product required for high affinity iron transport in yeast is a cell surface ferroxidase. J. Biol. Chem. 270:1098–1101. 10.1074/jbc.270.3.1098 [DOI] [PubMed] [Google Scholar]
- Defenouillère, Q., Verraes A., Laussel C., Friedrich A., Schacherer J., and Léon S.. 2019. The induction of HAD-like phosphatases by multiple signaling pathways confers resistance to the metabolic inhibitor 2-deoxyglucose. Sci. Signal. 12:eaaw8000. 10.1126/scisignal.aaw8000 [DOI] [PubMed] [Google Scholar]
- Garí, E., Piedrafita L., Aldea M., and Herrero E.. 1997. A set of vectors with a tetracycline-regulatable promoter system for modulated gene expression in Saccharomyces cerevisiae. Yeast. 13:837–848. [DOI] [PubMed] [Google Scholar]
- Haruki, H., Nishikawa J., and Laemmli U.K.. 2008. The anchor-away technique: rapid, conditional establishment of yeast mutant phenotypes. Mol. Cell. 31:925–932. 10.1016/j.molcel.2008.07.020 [DOI] [PubMed] [Google Scholar]
- Hatakeyama, R., Péli-Gulli M.P., Hu Z., Jaquenoud M., Garcia Osuna G.M., Sardu A., Dengjel J., and De Virgilio C.. 2019. Spatially Distinct Pools of TORC1 Balance Protein Homeostasis. Mol. Cell. 73:325–338.e8. 10.1016/j.molcel.2018.10.040 [DOI] [PubMed] [Google Scholar]
- Henne, W.M., Buchkovich N.J., and Emr S.D.. 2011. The ESCRT pathway. Dev. Cell. 21:77–91. 10.1016/j.devcel.2011.05.015 [DOI] [PubMed] [Google Scholar]
- Ishii, A., Kawai M., Noda H., Kato H., Takeda K., Asakawa K., Ichikawa Y., Sasanami T., Tanaka K., and Kimura Y.. 2018. Accelerated invagination of vacuoles as a stress response in chronically heat-stressed yeasts. Sci. Rep. 8:2644. 10.1038/s41598-018-20781-8 [DOI] [PMC free article] [PubMed] [Google Scholar]
- Ivashov, V., Zimmer J., Schwabl S., Kahlhofer J., Weys S., Gstir R., Jakschitz T., Kremser L., Bonn G.K., Lindner H., et al. 2020. Complementary α-arrestin-ubiquitin ligase complexes control nutrient transporter endocytosis in response to amino acids. eLife. 9: e58246. 10.7554/eLife.58246 [DOI] [PMC free article] [PubMed] [Google Scholar]
- Karim, M.A., McNally E.K., Samyn D.R., Mattie S., and Brett C.L.. 2018. Rab-Effector-Kinase Interplay Modulates Intralumenal Fragment Formation during Vacuole Fusion. Dev. Cell. 47:80–97.e6. 10.1016/j.devcel.2018.09.002 [DOI] [PubMed] [Google Scholar]
- Li, M., Koshi T., and Emr S.D.. 2015a. Membrane-anchored ubiquitin ligase complex is required for the turnover of lysosomal membrane proteins. J. Cell Biol. 211:639–652. 10.1083/jcb.201505062 [DOI] [PMC free article] [PubMed] [Google Scholar]
- Li, M., Rong Y., Chuang Y.S., Peng D., and Emr S.D.. 2015b. Ubiquitin-dependent lysosomal membrane protein sorting and degradation. Mol. Cell. 57:467–478. 10.1016/j.molcel.2014.12.012 [DOI] [PubMed] [Google Scholar]
- Lim, C.Y., and Zoncu R.. 2016. The lysosome as a command-and-control center for cellular metabolism. J. Cell Biol. 214:653–664. 10.1083/jcb.201607005 [DOI] [PMC free article] [PubMed] [Google Scholar]
- Lin, C.H., MacGurn J.A., Chu T., Stefan C.J., and Emr S.D.. 2008. Arrestin-related ubiquitin-ligase adaptors regulate endocytosis and protein turnover at the cell surface. Cell. 135:714–725. 10.1016/j.cell.2008.09.025 [DOI] [PubMed] [Google Scholar]
- McNally, E.K., and Brett C.L.. 2018. The intralumenal fragment pathway mediates ESCRT-independent surface transporter down-regulation. Nat. Commun. 9:5358. 10.1038/s41467-018-07734-5 [DOI] [PMC free article] [PubMed] [Google Scholar]
- McNally, E.K., Karim M.A., and Brett C.L.. 2017. Selective Lysosomal Transporter Degradation by Organelle Membrane Fusion. Dev. Cell. 40:151–167. 10.1016/j.devcel.2016.11.024 [DOI] [PubMed] [Google Scholar]
- Morshed, S., Sharmin T., and Ushimaru T.. 2020. TORC1 regulates ESCRT-0 complex formation on the vacuolar membrane and microautophagy induction in yeast. Biochem. Biophys. Res. Commun. 522:88–94. 10.1016/j.bbrc.2019.11.064 [DOI] [PubMed] [Google Scholar]
- Nikko, E., and Pelham H.R.. 2009. Arrestin-mediated endocytosis of yeast plasma membrane transporters. Traffic. 10:1856–1867. 10.1111/j.1600-0854.2009.00990.x [DOI] [PMC free article] [PubMed] [Google Scholar]
- O’Donnell, A.F., McCartney R.R., Chandrashekarappa D.G., Zhang B.B., Thorner J., and Schmidt M.C.. 2015. 2-Deoxyglucose impairs Saccharomyces cerevisiae growth by stimulating Snf1-regulated and α-arrestin-mediated trafficking of hexose transporters 1 and 3. Mol. Cell. Biol. 35:939–955. 10.1128/MCB.01183-14 [DOI] [PMC free article] [PubMed] [Google Scholar]
- Oku, M., Maeda Y., Kagohashi Y., Kondo T., Yamada M., Fujimoto T., and Sakai Y.. 2017. Evidence for ESCRT- and clathrin-dependent microautophagy. J. Cell Biol. 216:3263–3274. 10.1083/jcb.201611029 [DOI] [PMC free article] [PubMed] [Google Scholar]
- Sardana, R., and Emr S.D.. 2021. Membrane Protein Quality Control Mechanisms in the Endo-Lysosome System. Trends Cell Biol. 31:269–283. 10.1016/j.tcb.2020.11.011 [DOI] [PubMed] [Google Scholar]
- Sardana, R., Zhu L., and Emr S.D.. 2019. Rsp5 Ubiquitin ligase-mediated quality control system clears membrane proteins mistargeted to the vacuole membrane. J. Cell Biol. 218:234–250. 10.1083/jcb.201806094 [DOI] [PMC free article] [PubMed] [Google Scholar]
- Savocco, J., Nootens S., Afokpa W., Bausart M., Chen X., Villers J., Renard H.F., Prévost M., Wattiez R., and Morsomme P.. 2019. Yeast α-arrestin Art2 is the key regulator of ubiquitylation-dependent endocytosis of plasma membrane vitamin B1 transporters. PLoS Biol. 17:e3000512. 10.1371/journal.pbio.3000512 [DOI] [PMC free article] [PubMed] [Google Scholar]
- Stearman, R., Yuan D.S., Yamaguchi-Iwai Y., Klausner R.D., and Dancis A.. 1996. A permease-oxidase complex involved in high-affinity iron uptake in yeast. Science. 271:1552–1557. 10.1126/science.271.5255.1552 [DOI] [PubMed] [Google Scholar]
- Strochlic, T.I., Setty T.G., Sitaram A., and Burd C.G.. 2007. Grd19/Snx3p functions as a cargo-specific adapter for retromer-dependent endocytic recycling. J. Cell Biol. 177:115–125. 10.1083/jcb.200609161 [DOI] [PMC free article] [PubMed] [Google Scholar]
- Toulmay, A., and Prinz W.A.. 2013. Direct imaging reveals stable, micrometer-scale lipid domains that segregate proteins in live cells. J. Cell Biol. 202:35–44. 10.1083/jcb.201301039 [DOI] [PMC free article] [PubMed] [Google Scholar]
- Urbanowski, J.L., and Piper R.C.. 1999. The iron transporter Fth1p forms a complex with the Fet5 iron oxidase and resides on the vacuolar membrane. J. Biol. Chem. 274:38061–38070. 10.1074/jbc.274.53.38061 [DOI] [PubMed] [Google Scholar]
- Yang, X., Arines F.M., Zhang W., and Li M.. 2018. Sorting of a multi-subunit ubiquitin ligase complex in the endolysosome system. eLife. 7:e33116. 10.7554/eLife.33116 [DOI] [PMC free article] [PubMed] [Google Scholar]
- Yang, X., Zhang W., Wen X., Bulinski P.J., Chomchai D.A., Arines F.M., Liu Y.Y., Sprenger S., Teis D., Klionsky D.J., and Li M.. 2020. TORC1 regulates vacuole membrane composition through ubiquitin- and ESCRT-dependent microautophagy. J. Cell Biol. 219:e201902127. 10.1083/jcb.201902127 [DOI] [PMC free article] [PubMed] [Google Scholar]
- Zhao, Y., Macgurn J.A., Liu M., and Emr S.. 2013. The ART-Rsp5 ubiquitin ligase network comprises a plasma membrane quality control system that protects yeast cells from proteotoxic stress. eLife. 2:e00459. 10.7554/eLife.00459 [DOI] [PMC free article] [PubMed] [Google Scholar]
- Zhu, L., Jorgensen J.R., Li M., Chuang Y.S., and Emr S.D.. 2017. ESCRTs function directly on the lysosome membrane to downregulate ubiquitinated lysosomal membrane proteins. eLife. 6:e26403. 10.7554/eLife.26403 [DOI] [PMC free article] [PubMed] [Google Scholar]
- Zhu, L., Sardana R., Jin D.K., and Emr S.D.. 2020. Calcineurin-dependent regulation of endocytosis by a plasma membrane ubiquitin ligase adaptor, Rcr1. J. Cell Biol. 219:e201909158. 10.1083/jcb.201909158 [DOI] [PMC free article] [PubMed] [Google Scholar]
Associated Data
This section collects any data citations, data availability statements, or supplementary materials included in this article.
Supplementary Materials
lists yeast strains and plasmids used in this study.


