

Summary
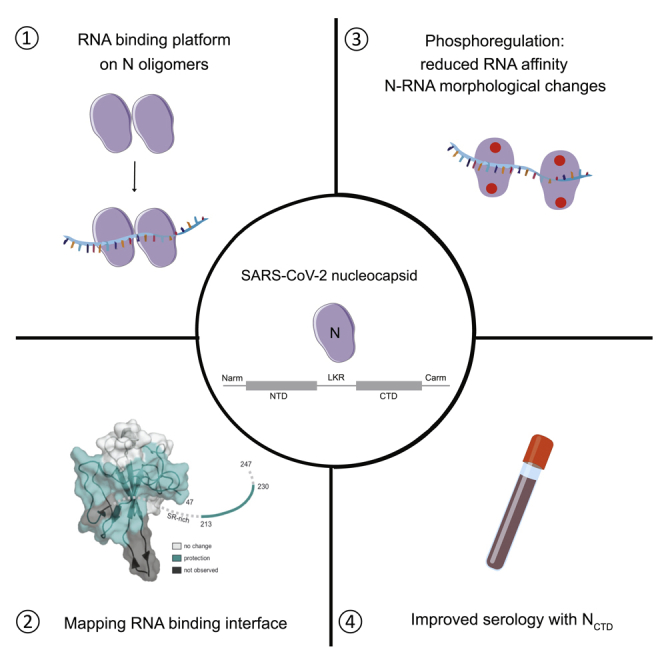
Nucleocapsid (N) encoded by severe acute respiratory syndrome coronavirus 2 (SARS-CoV-2) plays key roles in the replication cycle and is a critical serological marker. Here, we characterize essential biochemical properties of N and describe the utility of these insights in serological studies. We define N domains important for oligomerization and RNA binding and show that N oligomerization provides a high-affinity RNA-binding platform. We also map the RNA-binding interface, showing protection in the N-terminal domain and linker region. In addition, phosphorylation causes reduction of RNA binding and redistribution of N from liquid droplets to loose coils, showing how N-RNA accessibility and assembly may be regulated by phosphorylation. Finally, we find that the C-terminal domain of N is the most immunogenic, based on antibody binding to patient samples. Together, we provide a biochemical description of SARS-CoV-2 N and highlight the value of using N domains as highly specific and sensitive diagnostic markers.
Subject area: Human Specimen, Virology, Biophysics
Graphical abstract
Highlights
-
•
Domain-specific contributions of SARS-CoV-2 N to oligomerization and RNA binding are characterized
-
•
Phosphorylation of N modulates RNA-binding affinity and N-RNA solution properties
-
•
HDX-MS results probe RNA binding interface of SARS-CoV-2 N
-
•
CTD may be a more sensitive and specific serological marker of infection
Human specimen; Virology; Biophysics
Introduction
Severe acute respiratory syndrome coronavirus 2 (SARS-CoV-2) is a novel coronavirus and the causative agent of coronavirus disease 2019 (COVID-19). The coronavirus has a single-stranded, positive-sense RNA genome encoding for four major structural proteins: spike (S), envelope (E), membrane (M), and nucleocapsid (N). The N protein is the second-most proximal to the 3′ end of the genome and is one of the most abundantly expressed viral proteins given the multifunctional roles of N during viral replication and assembly (Fung and Liu, 2019; Kim et al., 2020; McBride et al., 2014; Perlman and Netland, 2009). It is estimated that 1,000 copies of N are incorporated into each virion compared with only 100 copies of S (Bar-On et al., 2020). N exists mostly in a phosphorylated state in the cytoplasm, whereas it is predominantly dephosphorylated in mature virions, suggesting that N function is regulated by phosphorylation (Wu et al., 2009, 2014).
A major function of N is to encapsidate the ssRNA viral genome to evade immune detection and to protect the viral RNA from degradation by host factors (Chang et al., 2014; McBride et al., 2014). N has two structural domains (Figure 1A): an N-terminal domain (NTD; amino acid residues 44–176) and a C-terminal domain (CTD; amino acid residues 248–369). NTD is generally referred to as the RNA-binding domain, although regions outside of NTD are implicated in RNA binding as well (Chang et al., 2014; Grossoehme et al., 2009; Gui et al., 2017; Kang et al., 2020; McBride et al., 2014). NCTD exists as a dimer in solution and can also bind RNA (Bouhaddou et al., 2020; Gui et al., 2017; Takeda et al., 2008). A conserved serine/arginine-rich linker region (LKR) connects the NTD and CTD (Figures 1A and S1A) (Chang et al., 2014). Phosphorylation of residues in the serine-arginine of the LKR is believed to regulate discontinuous transcription, particularly for shorter subgenomic mRNA closer to the 3′ end during early stages of replication (Wu et al., 2009, 2014). The LKR along with residues at the extreme N and C termini (Narm: amino acid residues 1–43 and Carm: amino acid residues 370–419) are intrinsically disordered (Chang et al., 2014; Cubuk et al., 2021). However, relative to the Narm and Carm, the LKR is more conserved (Figures 1B and S1B).
Figure 1.

Characterization of N oligomerization with dynamic light scattering
(A) Domain architecture of N. N has two structural domains: NTD and CTD. The sequence between NTD and CTD is a linker region (LKR) containing a serine-arginine rich motif. The Narm, LKR, and Carm are predicted to be disordered based on sequence analysis.
(B) Sequence identity between N of SARS-CoV-2, common cold coronaviruses, and other epidemic severe coronaviruses MERS-CoV and SARS-CoV.
(C) Measurements of N oligomerization with DLS. Measured hydrodynamic radius, Rh, is reported in (D).
(D) Table summarizes the DLS data for all constructs. Numbers are reported as average and standard deviation of three experiments.
See also Figures S1 and S2.
Given its abundant expression and conservation within the genome, N has been used as an antigen for serology tests (Chew et al., 2020; Tang et al., 2020a, 2020b). Previous studies showed that N-specific antibodies dominate the overall antibody response (Hachim et al., 2020; Lu et al., 2021a). Furthermore, the T cell responses directed toward N are highly immunodominant in SARS-CoV and SARS-CoV-2 infection, with N-specific memory T cell responses evident 17 years after the initial SARS-CoV infection (Le Bert et al., 2020). Thus, N protein stability, RNA-binding characteristics, abundance, and conservation are likely to impact T and B cell immunity.
Previous studies, including our own, revealed shared and unique functions among viral nucleocapsid proteins (Arragain et al., 2019; Ding et al., 2016; Lu et al., 2021b; Luo et al., 2020; Raymond et al., 2010; Su et al., 2018; Wan et al., 2017). These insights include oligomerization, RNA binding, and N-dependent functions such as RNA synthesis and immune evasion. Here, we use a series of biochemical and biophysical assays to dissect different regions in N to determine how oligomerization, RNA binding, and phosphorylation are coupled to functions of N. Our results reveal that oligomeric N provides a continuous platform for binding RNA with high affinity. Our hydrogen-deuterium exchange mass spectrometry (HDX-MS) data identified a novel RNA-binding region within the LKR in addition to a positively charged patch within the NTD. We also show that phosphorylation modulates N-RNA interactions and solution properties, including phase-separated droplets. Finally, we find that the CTD contributes to oligomerization and RNA binding, and is efficient at suppressing immune signaling. In SARS-CoV-2-infected patient plasma samples, the truncated CTD of N provides a highly sensitive serological marker. Our studies add to the wealth of information on SARS-CoV-2 N protein and expand upon our knowledge into N-domain-specific functions.
Results
Multiple regions within N contribute to oligomerization
While several studies on SARS coronavirus N proteins report that N proteins oligomerize and that N oligomers are important for the assembly of viral particles (Chang et al., 2009; Luo et al., 2005; Ye et al., 2020), the contribution of each N domain to oligomerization remains to be defined. To better understand the regions within SARS-CoV-2 N important for promoting N-N interactions, we first used dynamic light scattering (DLS) to determine the hydrodynamic properties of isolated, RNA-free N domains and combinations of domains. Analysis of DLS results show that there are two major oligomeric species for full-length N (NWT; 46 kDa), with hydrodynamic radii (Rh) of 8.9 nm and 450 nm (Figures 1C and 1D), suggesting the presence of different oligomeric forms of the protein. For comparison, the Rh values for maltose binding protein (44 kDa) and BSA (66 kDa) are 2.9 nm and 3.7 nm, respectively. Removal of the Narm and Carm (NNTD-LKR-CTD) results in two major species that are similar to NWT. However, both NNTD-LKR-CTD populations display reduced polydispersity (narrower peak width, Figure S2A), suggesting that both Narm and Carm contribute to N oligomerization. Further removal of the CTD (NNTD-LKR) results in a single peak representing a dimeric species (Rh = 3.9 nm), but with considerable polydispersity. NNTD and NCTD alone form stable domains; NNTD is a monomer (Rh = 2.3 nm), whereas NCTD is a dimer in solution (Rh = 3.5 nm), consistent with previous studies (Takeda et al., 2008). Exact mass measurement by denaturing mass spectrometry yields values corresponding to the mass expected from the amino acid sequence (±1 Da) and supports the identity of the constructs used here (Figures S2B–S2E).
Oligomeric N provides a platform for high-affinity RNA binding
A critical function for N is to bind and encapsidate viral genomic ssRNA (Chang et al., 2014). This interaction is sequence independent and as a result of N-RNA interactions, newly synthesized viral RNA often avoids immune detection by cellular pattern recognition receptors (Leung and Amarasinghe, 2016). Previous results suggest that regions beyond the NTD are involved in RNA binding, but were limited by experimental detection and only select regions were characterized (Chang et al., 2009; Grossoehme et al., 2009; Keane et al., 2012). To address this limitation and to gain insight into how each domain of SARS-CoV-2 N contributes to RNA binding, we developed a sensitive fluorescence polarization assay to measure binding of a fluorescein isothiocyanate (FITC)-labeled 20-nt ssRNA (sequence: UUUCACCUCCCUUUCAGUUU) (Figure 2A). From this assay, we find that NWT binds the 20-nt ssRNA with high affinity (KD = 0.007 ± 0.001 μM). Removal of the Narm and Carm do not impact ssRNA binding (KD = 0.006 ± 0.002 and 0.006 ± 0.002 μM for NNTD-LKR-CTD-Carm and NNTD-LKR-CTD, respectively) (Figure 2B). In contrast, the isolated NNTD and NCTD have low-affinity binding (KD = 20 ± 10 and 13 ± 5 μM, respectively). However, inclusion of the LKR region increased RNA binding affinity significantly (0.50 ± 0.08 and 0.35 ± 0.04 μM for NNTD-LKR and NLKR-CTD, respectively) (Figures 2B–2D). Addition of CTD onto NTD-LKR in cis increases the binding affinity to the single-digit nM range (0.006 ± 0.002 μM) (Figure 2C) but not in trans (compare NNTD-LKR + NCTD with NNTD-LKR-CTD). The increase in binding affinity also occurs when NTD is added to LKR-CTD in cis (Figure 2D, compare NLKR-CTD + NNTD with NNTD-LKR-CTD). Similar binding curves and KD values were obtained when fluorescence polarization values were converted to anisotropy (Figure S3A). Collectively, our data quantitatively show that the NTD, CTD, and LKR each contribute to ssRNA binding and that the presence of these three domains in tandem confers N with high-affinity RNA binding, suggesting a more extensive and coupled RNA binding interface on N than is encompassed within a single domain.
Figure 2.

SARS-CoV-2 nucleocapsid protein binds RNA with high affinity
(A) Fluorescence polarization assay to measure RNA binding. Increasing concentrations of N was titrated into 1 nM of FITC-labeled RNA. Protein binding to FITC-RNA leads to slower tumbling of FITC-RNA, resulting in increased fluorescence polarization.
(B) Fluorescence polarization binding curves of N constructs to a 20-nt ssRNA. The fitted KD values are 0.007 ± 0.001 μM (NWT, black square), 16 ± 12 μM (NNTD, red circle), 13 ± 5 μM (NCTD, blue up triangle), 0.006 ± 0.002 μM (NNTD-LKR-CTD, magenta down triangle), and 0.006 ± 0.002 μM (NNTD-LKR-CTD-Carm, green diamond).
(C) Fluorescence polarization binding curves of N constructs with or without CTD to a 20-nt ssRNA. The fitted KD values are 0.006 ± 0.002 nM (NNTD-LKR-CTD, magenta down triangle), 13 ± 5 μM (NCTD, blue circle), 0.50 ± 0.08 μM (NNTD-LKR, orange star), and 0.44 ± 0.04 μM (NNTD-LKR + NCTD, purple pentagon).
(D) Fluorescence polarization binding curves of N constructs with or without NTD to a 20-nt ssRNA. The fitted KD values are 0.006 ± 0.002 μM (NNTD-LKR-CTD, magenta down triangle), 16 ± 12 μM (NNTD, red circle), 0.35 ± 0.04 μM (NLKR-CTD, orange up triangle), and 0.72 ± 0.09 μM (NNTD + NLKR-CTD, purple down triangle).
(E) Fluorescence polarization binding curves of N constructs to a slRNA. The fitted KD values are 0.051 ± 0.004 μM (NWT, black square), 124 ± 84 μM (NNTD, red circle), 65 ± 44 μM (NCTD, blue up triangle), 2.5 ± 0.5 μM (NNTD-LKR, magenta down triangle), 0.22 ± 0.02 μM (NNTD-LKR-CTD, green diamond), and 0.10 ± 0.01 μM (NNTD-LKR-CTD-Carm, navy left triangle).
(F) Table summarizes KD values (μM) for key constructs binding to ssRNA and slRNA. Numbers are reported as average and standard deviation of two experiments. See also Figure S3.
N is proposed to disrupt dsRNA structures formed by transcription regulatory sequences during discontinuous transcription and impact viral RNA synthesis (Grossoehme et al., 2009; Keane et al., 2012; Sola et al., 2015). To evaluate the impact of N binding to dsRNA structures, we used an RNA that forms a stable stem-loop structure (slRNA) (sequence: GGAAGAUUAAUAAUUUUCC) (Figure 2E). We find that NWT binds this slRNA with relative high affinity (KD = 0.051 ± 0.004 μM), whereas both NNTD and NCTD alone have significantly weaker binding affinities (KD = 120 ± 80 and 60 ± 40 μM, respectively). Addition of LKR significantly improves binding, consistent with results observed for ssRNA. Overall, slRNA binding to N appears to be at an order of magnitude lower than to ssRNA binding (Figure S3B). This is potentially because, in part, of the energetic penalty of unfolding the stem-loop structure. Furthermore, the Narm and Carm may contribute more to slRNA binding than ssRNA because the impact on N binding is more pronounced after removal of the Narm or Carm (Figure S3C).
HDX-MS defines an extended RNA-binding interface in N
X-ray crystal and NMR structures are available for the SARS-CoV-2 NNTD and NCTD as well as hybrid models for RNA-bound NNTD (Dinesh et al., 2020, Kang et al., 2020, Ye et al., 2020). While these static structures provide a wealth of information, a critical gap remains in our knowledge of N-RNA interactions. Our studies here show that other N domains in cis contribute significantly to RNA binding. To further define the RNA-binding interface on N, we performed HDX-MS to locate regions that become protected upon RNA binding. We first tested the NNTD-LKR-CTD protein but observed aggregation on RNA binding that caused a 100-fold loss in peptide abundances for the bound state, possibly attributable to aggregation-induced poor digestion. To circumvent RNA-binding-induced protein aggregation, we reasoned that shorter constructs, such as NNTD-LKR, could be used based on our binding studies. However, even for this shorter construct, we noticed that the sample became cloudy after mixing with RNA. Next, given phosphorylation of N is a crucial regulatory mechanism in the coronavirus life cycle (Wu et al., 2009), we hypothesized that N phosphorylation likely impacts N-RNA solution properties and stability. Therefore, we examined phosphomimics of N for improved sample stability and solubility that are compatible with HDX-MS studies. For SARS-CoV, glycogen synthase kinase (GSK)-3 was shown to phosphorylate N at Ser177 (corresponding to Ser176 in SARS-CoV-2 N) (Wu et al., 2009). Phosphorylation of Ser177 is preceded by phosphorylation of Ser189 and Ser207 (Ser188 and 206 in SARS-CoV-2 N) by priming kinases (Wu et al., 2009). While more phosphorylation events may occur, we focused on these three better-known positions to evaluate if introduction of S176D/S188D/S206D mutations into NNTD-LKR (NNTD-LKR S176D/S188D/S206D) will resolve N protein aggregation at the concentrations of interest.
With the introduction of the mutations on a shorter construct, NNTD-LKR S176D/S188D/S206D, we were able to use sequential FXIII and pepsin digestion to recover 152 peptides, resulting in 93.3% sequence coverage (Figure S4), which enabled us to further examine the system by HDX-MS. HDX-MS analysis of NNTD-LKR S176D/S188D/S206D shows clear protection in four distinct regions on RNA binding (amino acid residues 41–63, 105–108, and 146–171 in NTD, and 213–230 in LTR) (Figures 3A and 3B and Mendeley data set https://doi.org/10.17632/sv8r6phkzt.1). Residues 133–143 are not perturbed by RNA binding, but peptides covering residues 146–171 show clear protection. The largest differences in HDX are observed where 50–80% of the residues of unbound peptides undergo a burst phase of HDX in the first 10 s (amino acid residues 146–156, 163–171, and 213–230), where the peptides cover regions of little hydrogen bonding in the unbound state. When bound to RNA, the fraction of residues participating in the burst phase decreases, resulting in observed protection. Then, HDX either converges over time (amino acid residues 146–156, 163–171, and 219–223) consistent with protein conformation or RNA binding dynamics or the HDX never converges in the timescale of the experiment (amino acid residues 222–230), consistent with relatively static binding. Interestingly, peptides covering amino acid residues 103–108 and 156–159 undergo very little HDX throughout the experiment, consistent with either a hydrophobic pocket or secondary or tertiary structure hydrogen bonding. Of note, HDX decreases for the bound state in these peptides only after 1 h. The low initial HDX limits the dynamic range of binding-induced protection from HDX, but statistically significant protection is still observed.
Figure 3.

HDX-MS mapping of RNA binding to NNTD-LKR S176D/S188D/S206D
(A) Woods' plot showing cumulative differential HDX and validating differences using global significance limits. The horizontal bars depict the cumulative HDX differences between the RNA-bound and unbound NNTD-LKR S176D/S188D/S206D. Standard deviations are shown for each peptide. Peptides showing statistically significant differences are differentiated by global significance limit using the standard error of the mean and t-values for a two-tailed Student's t-distribution (∗, p < 0.1; ∗∗, p < 0.05; ∗∗∗, p < 0.01). The blue shade of the peptide bar indicates differing statistical significance (green, light blue, and dark blue, respectively); gray peptide bars depict peptides where statistically significant differences in HDX were not observed. Vertical bars show previously reported binding sites (residues reported for RNA-binding CoV2 N-protein (Dinesh et al., 2020, Ye et al., 2020), AMP-binding HCoV-OC43 (Lin et al., 2014; Ye et al., 2020), and for both are shown in red, yellow, and orange, respectively). Secondary structure of SARS-CoV-2 NNTD (PDB 6M3M) is shown above.
(B) Representative kinetic plots showing peptide level HDX as a function of exchange time (unbound, black; bound to RNA, red).
(C) Sites of protection measured by HDX mapped on the NNTD structure (PDB 6M3M). Statistically significant HDX protection, regions of no difference in HDX, and regions where lacking proteolytic coverage results in no data are shown in teal, light gray, and dark gray, respectively. Those residues unresolved in the structure are shown as a dashed line, with the exception of those reporting a statistically significant difference in teal.
(D) Electrostatic potential calculated with APBS mapped on to the NNTD structure (PDB 6M3M) shows a major positive charge groove. Red and blue represent negative and positive electrostatic potential. The color scale is in kTe−1 units. See also Figure S4 and Mendeley data set (https://doi.org/10.17632/sv8r6phkzt.1).
Overall, HDX analysis revealed that the protected regions (Figure 3C) overlap with a basic patch groove in the NNTD structure (Figure 3D) that is also observed in recently published NMR titration studies (Dinesh et al., 2020); however, a region (amino acid residues 213–230) within the LKR domain, C-terminal to the SR-motif, also shows statistically significant HDX protection. This observation is consistent with the C-terminal end of the LKR domain, a region truncated in other RNA-binding studies of similar N proteins, being perturbed by RNA binding; furthermore, the parallel HDX kinetics plots indicate relatively static binding interactions within this region. Interestingly, we did not detect HDX protection in the SR-motif, which was proposed to bind RNA. This may be due to the Ser-to-Asp mutations introduced into this region, changing the RNA binding patterns. Altogether, HDX results along with our biochemical data define an RNA-binding interface within the NTD and LKR regions of N.
N-RNA liquid droplet formation is impacted by N domains
The aforementioned oligomerization and RNA-binding results were obtained using RNA-free protein. However, oligomerization is an intrinsic property of N and is complicated by RNA binding during copurification due to the high affinity of N proteins for RNA. We found that bacterial RNA copurified even with increased ionic strength in purification buffer. Size-exclusion chromatography revealed three populations of N, including two RNA-bound states (p1 and p2) and an RNA-free state (p3) (Figure 4A). Truncation of the Narm results in an increase of the RNA-free peak (p3), suggesting that N truncations can alter the structure of N and correspondingly impact RNA binding and oligomerization. When both Narm and Carm were removed, we observed an even greater shift to p3, suggesting that both arms contribute to RNA-binding interactions. To gain a better understanding of the two RNA-bound populations p1 and p2, we visualized these samples using negative-stain electron microscopy in near-physiological salt concentrations (150 mM). We observed that NWT p1 contains N-RNA with a loose-coil appearance (Figure 4B, top left), similar to that observed for other RNA-bound Ns (Bharat et al., 2012; Mavrakis et al., 2002). In contrast, we mostly observe spheres in NWT p2 that correspond to liquid droplets separated from the surrounding buffer (Figure 4B, top right), consistent with many recent studies that describe liquid-liquid phase separation of N in the presence of RNA (Carlson et al., 2020; Cubuk et al., 2021; Iserman et al., 2020; Jack et al., 2020; Savastano et al., 2020).
Figure 4.

N-RNA forms liquid droplets and phosphorylation modulates N-RNA interactions
(A) Size exclusion chromatography of N constructs (NWT, black; NNTD-LKR-CTD-Carm, red; NNTD-LKR-CTD, blue) in 25 mM HEPES, 500 mM NaCl, 2 mM TCEP, 5% glycerol. Samples from peak 1 (p1) and p2 contain RNA whereas p3 are RNA-free based upon absorbance from the 260/280 ratio.
(B) Negative stain electron microscopy (EM) image of p1 (left panel) and p2 (right panel) for NWT, NNTD-LKR-CTD-Carm, and NNTD-LKR-CTD in 150 mM NaCl. Samples were diluted into 150 mM NaCl before negative-staining fixation by uranyl acetate.
(C) Size exclusion chromatography of N constructs (NWT, black; NS188D/S206D, blue; NS176D/S188D/S206D, red) in 25 mM HEPES, 500 mM NaCl, 2 mM TCEP, 5% glycerol.
(D) Negative stain EM images of NS188D/S206D (top row) and NS176D/S188D/S206D (bottom row) in 150 mM NaCl.
(E) Fluorescence polarization binding curves of N mutants to a 20-nt ssRNA. The fitted KD values are 0.007 ± 0.001 μM (NWT, black square), 0.015 ± 0.002 μM (NS176D/S188D/S206D, black circle), 0.505 ± 0.075 μM (NNTD-LKR, orange up triangle), and 1.1 ± 0.2 μM (NNTD-LKR S176D/S188D/S206D, orange down triangle). Numbers are reported as average and standard deviation of two experiments. See also Figure S5.
To determine if N regions that impact RNA binding also impact liquid droplet formation, we next examined the role of Narm and Carm. NNTD-LKR-CTD-Carm behaves similarly to NWT, having loose coils in p1 (Figure 4B, middle left) and forming spherical liquid droplets in p2 (Figure 4B, middle right). However, examination of p2 from NNTD-LKR-CTD (Figure 4B, bottom right) revealed a much smaller population of liquid droplets (red arrow) and mostly crystal-like needle aggregates, suggesting that the Carm is important for droplet formation. A transition from spherical liquids to needle-like solids is consistent with the liquid-to-solid transitions observed for other proteins that undergo phase separation (Patel et al., 2015).
Phosphorylation of LKR modulates RNA binding and higher-order assembly
Recently, N protein phosphorylation has been qualitatively shown to modulate both RNA binding and phase separation (Carlson et al., 2020; Lu et al., 2021b; Savastano et al., 2020), and we successfully used the improved solubility of phosphomimics to map the RNA binding interface within the NTD-LKR region. To further test how phosphorylation quantitatively impacts RNA binding and solution properties of SARS-CoV-2 N-RNA, we generated additional N phosphomimics in the context of NWT and NNTD-LKR. Size-exclusion chromatography showed that, compared with NWT, NS188D/S206D (priming serine residues for S176 by GSK-3) produced a reduced RNA-free peak (p3) and an increased RNA-bound peak (p1) (Figure 4C). Introduction of S176D to generate NS176D/S188D/S206D resulted in an even greater shift in p1 and p3 distributions, showing how phosphorylation can affect N interactions with RNA. The height of p2 remains relatively the same for all preparations. Examination of these protein peaks using electron microscopy revealed that NS188D/S206D displays similar loose coils in p1 (Figure 4D, top left) and spherical droplets in p2 (Figure 4D, top right) for the RNA-bound species. Similar observations were made for NS176D/S188D/S206D (Figure 4D). To describe this interaction further, we measured ssRNA binding to the N phosphomimics (Figures 4E and S5A). NS176D/S188D/S206D displays ∼5-fold lower binding affinity to ssRNA compared with NWT binding, a result in trend with previous work examining the impact of LKR phosphorylation on RNA binding through simulations (Savastano et al., 2020). We observed a similar trend of lower binding to phosphomimics for the NNTD-LKR construct. Furthermore, binding to slRNA is also affected by these mutations (Figure S5B). Collectively, our data suggest that phosphorylation of the LKR region can impact N interactions with RNA, causing changes in properties, including solvent accessibility and RNA binding. Interestingly, there are 14 serine residues in the SR motif of LKR in SARS-CoV-2 N, of which 13 are found in SARS-CoV N, and an increase in phosphorylation in this region may further enhance these changes for RNA interaction and N associated functions.
NCTD is a sensitive serological marker
Given that the different domains of N impact the various biochemical and physicochemical properties of N, we next assessed if particular domains contribute more significantly to N immunodominance that has been observed worldwide (Hachim et al., 2020). Plasma samples collected from two cohorts of patients with real-time polymerase chain reaction (RT-PCR)-confirmed COVID-19, one in St. Louis, USA (n = 45) and one in Hong Kong (n = 23), at different time points of infection. Using these samples, we performed enzyme-linked immunosorbent assays (ELISAs) to detect IgG present in plasma of patients with COVID-19 using different N domains that we have purified and characterized. First, we confirmed that purified NWT is a sensitive serological marker to differentiate between COVID-19-positive and COVID-19-negative individuals (Figure 5A). As shown in Figure 5B, antibodies against all five N constructs were detected in the COVID-19 cohort (p < 0.0001 versus negative controls for all). A cutoff based on the mean of the negatives plus three standard deviations allowed us to assess the performance of each N construct at detecting IgG antibodies in COVID-19-positive individuals (Figure 5C). We find that NNTD-LKR-CTD-Carm shows the lowest sensitivity (41.2%), whereas the truncated NNTD-LKR-CTD can detect more COVID-19-positive individuals (70.6%). Furthermore, NCTD shows the highest combination of sensitivity (75%) and specificity (96.4%) over the other N constructs tested. This is demonstrated by the lowest cutoff score for the NCTD for negative control samples, despite a comparable level of amino acid sequence conservation of the NCTD (29–41%) to the NNTD (32–48%) and NLKR (28–42%) domains with common cold coronaviruses (Figure 1B).
Figure 5.

The CTD of N is a highly sensitive serological marker
(A) ELISA data of NWT screened against plasma of COVID-19 positive and negative individuals from a combined Hong Kong, PRC and St. Louis, MO, USA cohort. Black solid line indicates the mean OD450 value for each population. ∗∗∗∗p < 0.0001.
(B) ELISAs with the various N constructs for patient IgG. ELISAs were performed on plasma samples from COVID-19 patients (n = 68) and negative controls (n = 28). The cutoff is represented by the dotted line and calculated as the mean +3 standard deviations of the negative population. Mean values ± standard deviation of COVID-19 and negative groups are shown.
(C) Sensitivity and specificity for each of the N domains calculated from the ELISA results.
(D) Heatmap of ELISA results for NNTD-LKR-CTD-Carm, NCTD, and NNTD constructs from COVID-19 samples (n = 67). Each column represents an individual sample.
(E) Maturation of the NCTD and NNTD-LKR-CTD-Carm IgG response over time (n = 67).
(F) Ratio of OD450 for NCTD and NNTD-LKR-CTD-Carm for acute and convalescent time points. Mean values ± standard deviation of acute and convalescent COVID-19 samples are shown. Experiments were repeated twice. Statistical significance was calculated by unpaired Student's t-test, ∗∗∗∗p < 0.0001.
(G) Inhibition of Sendai virus (SeV)-induced IFNβ promoter activation by N constructs. Fold changes are relative to vector-only (V) transfections without SeV infection. MLAV VP35 served as a positive control for inhibition. Three transfection concentrations were used: 1.25, 12.5, and 125 ng/well. Statistical significance was determined by performing a one-way ANOVA followed with Tukey multiple comparison as compared to SeV-infected control; ∗∗∗∗p < 0.0001, ∗∗∗p < 0.0002, ∗∗p < 0.0021, ∗p < 0.0332.
We next compared the immunogenicity of NNTD-LKR-CTD-Carm to NCTD and NNTD on an IgG heatmap during natural infection to an independent panel of 67 COVID-19 samples from Hong Kong. The magnitude of the IgG response to the NNTD-LKR-CTD-Carm tends to follow the same trend as that of NCTD (Figure 5D). When we assessed the kinetics of NCTD and the NNTD-LKR-CTD-Carm responses, we find that the magnitude of the NCTD IgG detection tends to reach a similar level to that of NNTD-LKR-CTD-Carm at convalescent time points (after day 14) (Figure 5E). The ELISA ratio of NCTD/NNTD-LKR-CTD-Carm demonstrates this finding, pointing to a maturation of the humoral immune response toward the NCTD with time after infection (Figure 5F, p < 0.0001 for acute versus convalescent time points). The early dominance of the NNTD-LKR-CTD-Carm IgG response may reflect the recruitment of a cross-reactive preexisting N-specific response. This response becomes more specific with time for the NCTD domain as a de novo antibody response is made.
Given that some RNA viral N proteins are known immune antagonists, including prior studies of SARS-CoV, we hypothesized that N from SARS-CoV-2 may also suppress the type-I interferon (IFN) signaling pathway (Messaoudi et al., 2015). Using an IFNβ promoter reporter assay, we showed that N has a role in suppressing IFN signaling pathway when stimulated by Sendai virus (SeV) infection (Figure 5G). NWT can inhibit IFNβ promoter activity, although not as well as Měnglà virus (MLAV) VP35, a potent inhibitor of IFN signaling (Williams et al., 2020). Both NNarm-NTD-LKR and NNTD show modest inhibition at the highest concentration tested. However, NCTD-Carm shows similar levels of inhibition as NWT, and NCTD displays the highest inhibition even at lower concentrations. In summary, N is a potent inhibitor of IFN signaling and the NCTD appears to be the region critical for mediating this function.
Discussion
SARS-CoV-2 N protein is a core viral protein produced by the subgenomic RNA, positioned proximal to the 3′ end of genome, displays high transcription levels, and is in high abundance in virions. N is prone to forming higher-order oligomers that is impacted by the presence of different domains. We found that the isolated NNTD and NCTD form well-behaved monomers and dimers, respectively. Linkage of the two domains through the LKR and addition of the Narm and Carm contribute to N oligomerization, demonstrated in our DLS studies. It also contributes to enhancement of RNA binding to a continuous platform that was quantitatively measured using a sensitive fluorescence polarization assay. Using HDX-MS for the NNTD-LKR phosphomimic, we confirmed a positively charged groove as an RNA-binding region in the NNTD but also revealed that unstructured regions flanking the SR motif in the LKR are important for RNA interactions, which was not included in previous studies and crystal structures. The high extent of HDX observed for the LKR domain in the absence of RNA is consistent with minimal hydrogen bonding (i.e., minimal defined structure). Thus, with a lack of structural information from other techniques, RNA-induced decreased HDX in the LKR domain could indicate RNA binding-induced secondary or tertiary structure, direct interactions with the RNA, or oligomerization. Overall, these results demonstrate the functional importance of the LKR domain for oligomerization and RNA binding. Thus, the coupling of oligomerization and RNA binding likely provides multilayered regulation that is important for immune evasion, viral replication, and N assembly.
N is also regulated by post-translational modifications and phosphorylation appears to play an important role that modulates RNA binding and changes the physicochemical properties of N. Our data revealed that mutation of S176, S188, and S206 in the SR motif to generate N phosphomimics resulted in decreased binding to RNA and a shift in protein-RNA populations with different solution properties.
In addition to characterizing the domain-specific biochemical and biophysical properties of N, we also gained insight into the antigenicity of individual domains of N and their potential utility in serological studies. Our data reveal that NCTD acts more specifically in detecting infection of SARS-CoV-2, from patient plasma in comparison with NWT, consistent with predictions that the NCTD region encompasses major antigenic sites of N (Bussmann et al., 2006; Liang et al., 2005). Interestingly, 2 of 10 individuals assessed in this study of longitudinal donors unexposed to SARS-CoV-2 by Edridge et al., produced broadly reactive antibodies toward SARS-CoV-2 NWT. The possibility of broadly reactive antibodies in unexposed individuals highlights the need for domain-specific serology, such as our use of the NCTD for increased sensitivity to discriminate COVID-19 cases, while reducing the false-positive rate from cross-reactive antibodies generated by infections of the common cold coronaviruses. Current serodiagnostic assays to identify COVID-19-positive individuals are based on the detection of antibodies against N due to its abundant expression and corresponding high immune response (Chew et al., 2020; Tang et al., 2020a, b). However, these N-directed serological assays are highly variable, and their sensitivity depend on the sampling time-points, ranging from 0% to 93.75% (Liu et al., 2020; Tang et al., 2020a, b), suggesting that serological markers for SARS-CoV-2 infection can be further improved to include the NCTD.
In conclusion, we describe our efforts to characterize how different domains contribute to the biochemical and physicochemical properties of SARS-CoV-2 N. Our results advance the understanding of the different levels of regulation involved in modulating viral replication and highlight the utility of using the NCTD as a highly specific and sensitive diagnostic marker of COVID-19.
Limitations of the study
This study describes domain-specific insights into oligomerization, RNA binding, and phosphorylation of SARS-CoV-2 N protein. Generated reagents were then used to demonstrate that NCTD is a more sensitive and specific serology marker. However, the underlying mechanisms of how these biochemical properties contribute to the observed immunodominance of the CTD of N are not clear and warrant further studies.
Resource availability
Lead contact
Further information and requests for resources and reagents should be directed to and will be fulfilled by the lead contact, Gaya Amarasinghe (gamarasinghe@wustl.edu).
Materials availability
Plasmids in this study are available with a completed Materials Transfer Agreement Request for these reagents by submitting to Dr. Gaya Amarasinghe (gamarasinghe@wustl.edu).
Data and code availability
HDX-MS peptides table and all kinetic plots are accessible in Mendeley (https://doi.org/10.17632/sv8r6phkzt.1).
STAR★Methods
Key resources table
| REAGENT or RESOURCE | SOURCE | IDENTIFIER |
|---|---|---|
| Antibodies | ||
| Anti-human IgG secondary ab labeled with HRP | Southern BioTech | Cat#905209; RRID:AB_2796621 |
| Bacterial and virus strains | ||
| E. coli BL21(DE3) | Agilent | Cat#200131 |
| SeV | Department of Microbiology, Icahn School of Medicine at Mount Sinai, New York, NY USA | N/A |
| Biological samples | ||
| Human Plasma, Patient with Confirmed SARS-CoV-2 Infection | Barnes-Jewish Hospital, St. Louis, MO, USA | N/A |
| Human Plasma, Patient with Confirmed SARS-CoV-2 Infection | Hong Kong University and HK Island West Cluster of Hospitals, Hong Kong, PRC | N/A |
| Human Plasma, Patient with negative test | Barnes-Jewish Hospital, St. Louis, MO, USA | N/A |
| Chemicals, peptides, and recombinant proteins | ||
| LC-MS grade formic acid | CovaChem | Cat# PI 85171; CAS 64-18-6 |
| Phosphate buffered saline tablets | Millipore Sigma | Cat# P4417 |
| Deuterium oxide (D, 99.9%) | Cambridge Isotope Laboratories | Cat# DLM-4-100; CAS 7789-20-0; |
| Urea | Millipore Sigma | Cat# U4883; CAS: 57-13-6 |
| 2% Uranyl Acetate | Ted Pella | 19481 |
| Critical commercial assays | ||
| Dual-Glo luciferase kit | Promega | Cat#E2920 |
| Experimental models: Cell lines | ||
| Human: HEK293T cells | ATCC | CRL-3216; RRID:CVCL_0063 |
| Deposited data | ||
| HDX peptides table and kinetc plots | Mendeley | https://doi.org/10.17632/sv8r6phkzt.1 |
| Oligonucleotides | ||
| 20nt ssRNA sequence: UUUCACCUCCCUUUCAGUUU | GenScript | N/A |
| 19nt slRNA sequence: GGAAGAUUAAUAAUUUUCC | GenScript | N/A |
| Recombinant DNA | ||
| Plasmid pET28a-CterTEV His6 SARS-CoV-2 N 1-419 | This work | N/A |
| Plasmid pET28a-CterTEV His6 SARS-CoV-2 N 44-419 | This work | N/A |
| Plasmid pET28a-CterTEV His6 SARS-CoV-2 N 44-369 | This work | N/A |
| Plasmid pET28a-CterTEV His6 SARS-CoV-2 N 44-247 | This work | N/A |
| Plasmid pET28a-CterTEV His6 SARS-CoV-2 N 44-176 | This work | N/A |
| Plasmid pET28a-CterTEV His6 SARS-CoV-2 N 248-369 | This work | N/A |
| Plasmid pCAGGS MLAV VP35 | This work | N/A |
| Plasmid pCAGGS SARS-CoV-2 N 1-419 | This work | N/A |
| Plasmid pCAGGS SARS-CoV-2 N 44-369 | This work | N/A |
| Plasmid pCAGGS SARS-CoV-2 N 44-176 | This work | N/A |
| Plasmid pCAGGS SARS-CoV-2 N 248-419 | This work | N/A |
| Plasmid pCAGGS SARS-CoV-2 N 248-369 | This work | N/A |
| IFN-β promoter-firefly luciferase reporter plasmid | Department of Microbiology, Icahn School of Medicine at Mount Sinai, New York, NY USA | N/A |
| pRL-TK Renilla luciferase reporter plasmid | Promega | E2231 |
| Software and algorithms | ||
| Intact Mass™ | Protein Metrics Incorporated | Version 3.11 |
| Byonic™ | Protein Metrics Incorporated | Version 3.11 |
| Byologic™ | Protein Metrics Incorporated | Version 3.11 |
| DataAnalysis v 4.4 | Bruker Daltonics | Version 4.4 |
| HDExaminer | Sierra Analytics Incorporated | Version 2.5.1 |
| Origin | OriginLab | Version 7 |
| UCSF Chimera | http://www.cgl.uscf.edu/chimera/ | Version 1.14 |
| PRISM | GraphPad | Version 7 |
| Dynamics Software | Wyatt | Version 7 |
| Gen5 Software | BioTek | Version 3 |
| Other | ||
| ZORBAX Eclipse XDB C8 trap column (2.1 x 15 mm) | Agilent Technologies | Cat# 975700-936 |
| XSelect CSH C18 XP (130 Å, 2.5 μm, 2.1 x 50 mm) | Waters Corporation | Cat# 186006101 |
| MaXis II 4G Q-TOF | Bruker Daltonics | N/A |
| MaXis II HM Q-TOF | Bruker Daltonics | N/A |
| EmulsiFlex-C5 homogenizer | Avestin | N/A |
| Glow-Discharged Copper Grid, 200 mesh | Ted Pella | 01840-F |
| JEM-1400 plus TEM | JEOL | N/A |
| Phosphor-Scintillated 12-bit CCD Camera | AMT | XR111 |
| DynaPro-PlateReader II | Wyatt Technologies Corporation | N/A |
| Cytation5 Plate Reader | BioTek | N/A |
Experimental model and subject details
Human plasma
The collection of patient plasma was approved by the Human Research Protection Office at Washington University in St. Louis (IRB reference number 202007097) and the Institutional Review Board of The Hong Kong University and the Hong Kong Island West Cluster of Hospitals (IRB reference number UW20-169).
Method details
Patients and sample collection
Our study enrolled a total of 67 patients with RT-PCR-confirmed COVID-19 infection: with 45 patients from St. Louis, MO, USA, and 23 patients from Hong Kong, PRC. The negative samples (n = 28) used in this study were from St. Louis, USA, and were obtained from patients after the start of the pandemic. Plasma samples were obtained from patients at Barnes-Jewish Hospital (St. Louis, MO, USA) and the Hong Kong Island West Cluster of Hospitals (Hong Kong, PRC). Both hospital systems are urban, tertiary-care, academic medical centers. Positive and negative patients from all cohorts were confirmed using standard of care, RT-PCR-based methods. Plasma samples were collected from heparinized blood. Sample day was defined as days after symptom onset.
Enzyme-linked immunosorbent assay
Enzyme-linked immunosorbent assays (ELISAs) were performed with N proteins made in house, as described in the following. Briefly, recombinant N proteins were coated on 96-well flat-bottom immunosorbent plates (Nunc Immuno MaxiSorp) at a concentration of 500 ng/mL in 100 μL coating buffer (phosphate-buffered saline [PBS] with 53% Na2CO3 and 42% NaHCO3, pH 9.6) at 4°C overnight. An additional plate coated with a nonspecific protein (blocking buffer, PBS with 5% fetal bovine serum (FBS)) was used to measure the background binding of each plasma sample. After FBS blocking and thorough washing, diluted plasma samples (1:100) were bound for 2 h, further washed, and then detected by an antihuman IgG secondary antibody labeled with HRP (Invitrogen), and absorbance detected at 450 nm on a spectrophotometer (Wallac).
Protein expression and purification
SARS-CoV-2 N constructs were expressed as His-tag fusion proteins in BL21 (DE3) E. coli cells (Novagen). At OD600 of 0.6-0.7, recombinant protein expression was induced with 0.5 mM isopropyl β-d-1-thiogalactopyranoside for 12–14 h at 18°C. Cells were harvested and resuspended in lysis buffer containing 20 mM Tris (pH 7.5), 1 M NaCl, 20 mM imidazole, 5 mM 2-mercaptoethanol (BME). Cells were lysed using an EmulsiFlex-C5 homogenizer (Avestin), and lysates were clarified by centrifugation at 30,000 x g at 4°C for 40 min. N proteins were purified using affinity tag and gel filtration columns. Purity of N proteins was determined by Coomassie staining of sodium dodecyl sulfate polyacrylamide gel electrophoresis. RNA-free species are used for oligomerization, RNA binding, and ELISA studies.
Negative staining EM
Two microliter of N sample at a concentration of 1 mg/mL was applied to a glow-discharged copper grid (Ted Pella), washed twice with water before staining with 2% uranyl acetate for 30 s, and air-dried. Grids were imaged using a JEOL JEM-1400Plus Transmission Electron Microscope operating at 120 kV and recorded with an AMT XR111 high-speed 4k x 2k pixel phosphor-scintillated 12-bit CCD camera.
Dynamic light scattering
Dynamic light scattering experiments were performed on a DynaPro-PlateReader II (Wyatt Technologies Corporation). Measurements of N samples in triplicates (1 mg/mL) were obtained at 25°C and analyzed using Dynamics software (Wyatt).
Fluorescence polarization assay
Fluorescence polarization assay experiments were performed on a Cytation5 plate reader (BioTek) operating on Gen5 software. Excitation and emission wavelengths were set to 485 and 528 nm, respectively, with a bandpass of 20 nm. Read height and G factor were set to 8.5 mm and 1.26, respectively, using the autogain function. For RNA-binding experiments, fluorescein-isothiocyanate-labeled 20-nt ssRNA or 19-nt slRNA at a final concentration of 1 nM was loaded on N samples (in 20 mM HEPES (pH 7.5), 150 mM NaCl, 2 mM TCEP, 5% glycerol) at concentrations ranging from 0.4 nM to 10 μM in a 96-well plate. After 10 min of incubation, fluorescence polarization signals were read. The fluorescence polarization values were then plotted against N concentrations to fit the dissociation constant, KD, using ORIGIN software. For anisotropy plots, anisotropy values were converted from polarization as per previous research (Kozlov et al., 2012).
Liquid chromatography-tandem mass spectrometry analysis
Unless otherwise indicated, all chemical reagents were sourced from Millipore Sigma and used without further purification. For liquid chromatography-tandem mass spectrometry (LC-MS) analyses, 30 pmol of protein in 50 μL of 1:1 solvent mixture of acetonitrile:water with 0.1% formic acid (CovaChem) was loaded onto a C8 trap (ZORBAX Eclipse XDB C8 column, 2.1 x 15 mm, Agilent), desalted for 3 min by using water/0.1% formic acid at a flow rate of 100 μL/min, and eluted using an 14 minute gradient from 0 to 80% acetonitrile/0.1% formic acid at a flow rate of 100 μL/min. Samples were analyzed using a MaXis 4G Q-TOF (Bruker Daltonics). The mass spectrum was extracted, guided by the elution peak and submitted to PMI Intact Mass and searched for M values ranging from 5 to 50 kDa.
HDX-MS
NNTD-LKR S176D/S188D/S206D was incubated with a 20-nt ssRNA at a 1:1 ratio. After incubation, 2 μL of 50 μM protein/protein-RNA in PBS (pH 7.4) was diluted 10 times (v/v) with labeling buffer (PBS in D2O, pD 7.0) (D2O from Cambridge Isotope Laboratories), incubated for 10, 30, 300, and 3600 s on ice, quenched by using a 60% dilution with 3 M urea, PBS (pH 2.5), and flash frozen for later LC-MS analysis. A 0 s control was prepared with PBS in H2O. Before incubation, each 50 μL of 2 μM sample was thawed for 1 min at 37°C before injection into a custom-built liquid chromatography apparatus for LC-MS analysis. The labeled protein passed through two in-house packed protease columns (2 mm x 20 mm), coupled so that the first using protease from Aspergillus saitoi type XIII (FXIII) and the second porcine pepsin (0.1% formic acid, flow rate 200 μL/min); the resulting peptides were trapped on a ZORBAX Eclipse XDB C8 column (2.1 mm x 15 mm, Agilent), desalted for 3 min, and then separated on a XSelect CSH C18 XP column (130Å, 2.5 μm, 2.1 mm X 50 mm, Waters) with a 10.5 min linear gradient from 4 – 40% acetonitrile/0.1% formic acid (flow rate 100 μL/min). All valves, tubes, and columns (except for the protease columns, which lose activity at low temperature) were submerged in ice during the experiment to minimize back exchange. Peptides were eluted into a Bruker Maxis HM Q-TOF MS for mass analysis. Experiments were in duplicate unless otherwise indicated. The HDX data processing was performed by using HDExaminer (version 2.5.1, Sierra Analytics, Inc.).
IFNβ promoter reporter gene assay
HEK-293T cells (5 x 10⁴) were cotransfected using Lipofectamine 2000 with 25 ng of an IFNβ promoter-firefly luciferase reporter plasmid, 25 ng of pRL-TK Renilla luciferase reporter plasmid, and 125, 12.5, and 1.25 ng of the indicated viral protein expression plasmid. Twenty-four hours after transfection, cells were mock-treated or SeV (15 hemagglutination units/mL) infected. Eighteen hours after treatment or after infection, cells were lysed and analyzed for luciferase activity using a Dual-Luciferase reporter assay system (Promega). Firefly luciferase activity was normalized to Renilla luciferase activity. Assays were performed in triplicate; error bars indicate the standard error of the mean (SEM) for the triplicate. Viral protein expression was confirmed by Western blot analysis.
Quantification and statistical analysis
All HDX samples for each time point were prepared and acquired in duplicate. HDX results for peptides with m/z peaks interfering/overlapping with the theoretical centroid fit were excluded from the analysis. Error bars in the kinetic plots show the standard deviation for each protein state and time point. Error bars shown in the Woods’ plot are 3 times the propagated error for each peptide across all time points (if the error bar does not cross zero, then the difference is potentially significant). The global significance limit (i.e., the minimum difference in number of deuterium for a statistically significant difference) is shown in gray. Briefly, we first calculated the pooled standard deviation for each state, using standard deviations for all peptides and all time points (n = 214 peptides x 4 states = 856 total data points for each state). From the pooled standard deviations of each state, the SEM was calculated for the entire data set (n = 2 replicates). The global significance limit is then the confidence interval using this SEM t-values for a two-tailed Student’s t-distribution (∗, p < 0.1; ∗∗, p < 0.05; ∗∗∗, p < 0.01, 2 degrees of freedom [2 states + 2 replicates – 2]). In the Woods’ plot, peptide HDX differences are considered significant if the difference exceeds this limit. Peptides are only considered statistically significant if both the conditions for the propagated error and the global significance limit are met.
For ELISA data, the cutoff is represented by the dotted line and calculated as the mean + 3 standard deviations of the negative population, used to calculate sensitivity and specificity. Experiments were repeated twice. Statistical significance was calculated by unpaired Student’s t-test using GraphPad Prism.
For IFN-β promoter assay, statistical significance was determined by performing a one-way ANOVA followed with Tukey multiple comparison as compared to Sendai-virus-infected control using GraphPad Prism.
Acknowledgments
We thank Dr. N. Krogan (UCSF) for sharing SARS-CoV-2 plasmids, Drs. A. Holehouse and A. Soranno (Washington University School of Medicine) for providing critical feedback, and R. Ridings for coordinating studies between WUSM and external groups. We would like to thank Bruker for mass spectrometry technical and instrument support, and Protein Metrics (R42GM1213302 to H.W.R) and Sierra Analytics for providing proteomic and HDX data analysis software. Research was supported by Fast Grant #2161 (Emergent Ventures) to G.K.A., Fast Grant # 2158 to C.F.B, and NIH grants (P01AI120943, R01AI123926 to G.K.A. and C.F.B; R01AI107056 to D.W.L.; P41GM103422 and R24GM136766 to M.L.G.; R01AI143292 and R01AI148663 C.F.B). S.A.V was supported by COVID190115 and COVID190126 Health and Medical Research Fund, Food and Health Bureau, Hong Kong and NIH/NIAID CEIRS contract HHSN272201400006C. A.J.Q. is supported by a NIH T32 training grant (T32CA009547).
Author contributions
CW, GKA, and DWL conceived the overall project. All authors were integral to the design and execution of the study. CW, AQ, GKA, and DWL wrote the initial draft with significant input from all authors.
Declaration of interests
The authors declare no competing interests.
Inclusion and diversity
We worked to ensure sex balance in the selection of non-human subjects. One or more of the authors of this paper self-identifies as living with a disability. One or more of the authors of this paper received support from a program designed to increase minority representation in science.
Published: June 25, 2021
Footnotes
Supplemental information can be found online at https://doi.org/10.1016/j.isci.2021.102681.
Contributor Information
Christopher W. Farnsworth, Email: cwfarnsworth@wustl.edu.
Sophie A. Valkenburg, Email: sophiev@hku.hk.
Gaya K. Amarasinghe, Email: gamarasinghe@wustl.edu.
Daisy W. Leung, Email: dwleung@wustl.edu.
Supplemental information
References
- Arragain B., Reguera J., Desfosses A., Gutsche I., Schoehn G., Malet H. High resolution cryo-EM structure of the helical RNA-bound Hantaan virus nucleocapsid reveals its assembly mechanisms. eLife. 2019;8:e43075. doi: 10.7554/eLife.43075. [DOI] [PMC free article] [PubMed] [Google Scholar]
- Bar-On Y.M., Flamholz A., Phillips R., Milo R. SARS-CoV-2 (COVID-19) by the numbers. eLife. 2020;9:e57309. doi: 10.7554/eLife.57309. [DOI] [PMC free article] [PubMed] [Google Scholar]
- Bharat T.A.M., Noda T., Riches J.D., Kraehling V., Kolesnikova L., Becker S., Kawaoka Y., Briggs J.A.G. Structural dissection of Ebola virus and its assembly determinants using cryo-electron tomography. Proc. Natl. Acad. Sci. U S A. 2012;109:4275–4280. doi: 10.1073/pnas.1120453109. [DOI] [PMC free article] [PubMed] [Google Scholar]
- Bouhaddou M., Memon D., Meyer B., White K.M., Rezelj V.V., Correa Marrero M., Polacco B.J., Melnyk J.E., Ulferts S., Kaake R.M. The global phosphorylation landscape of SARS-CoV-2 infection. Cell. 2020;182:685–712.e19. doi: 10.1016/j.cell.2020.06.034. [DOI] [PMC free article] [PubMed] [Google Scholar]
- Bussmann B.M., Reiche S., Jacob L.H., Braun J.M., Jassoy C. Antigenic and cellular localisation analysis of the severe acute respiratory syndrome coronavirus nucleocapsid protein using monoclonal antibodies. Virus Res. 2006;122:119–126. doi: 10.1016/j.virusres.2006.07.005. [DOI] [PMC free article] [PubMed] [Google Scholar]
- Carlson C.R., Asfaha J.B., Ghent C.M., Howard C.J., Hartooni N., Safari M., Frankel A.D., Morgan D.O. Phosphoregulation of phase separation by the SARS-CoV-2 N protein suggests a biophysical basis for its dual functions. Mol. Cell. 2020;80:1092–1103.e4. doi: 10.1016/j.molcel.2020.11.025. [DOI] [PMC free article] [PubMed] [Google Scholar]
- Chang C.-k., Hou M.-H., Chang C.-F., Hsiao C.-D., Huang T.-h. The SARS coronavirus nucleocapsid protein – forms and functions. Antiviral Res. 2014;103:39–50. doi: 10.1016/j.antiviral.2013.12.009. [DOI] [PMC free article] [PubMed] [Google Scholar]
- Chang C.-K., Hsu Y.-L., Chang Y.-H., Chao F.-A., Wu M.-C., Huang Y.-S., Hu C.-K., Huang T.-H. Multiple nucleic acid binding sites and intrinsic disorder of severe acute respiratory syndrome coronavirus nucleocapsid protein: implications for ribonucleocapsid protein packaging. J. Virol. 2009;83:2255–2264. doi: 10.1128/JVI.02001-08. [DOI] [PMC free article] [PubMed] [Google Scholar]
- Chew K.L., Tan S.S., Saw S., Pajarillaga A., Zaine S., Khoo C., Wang W., Tambyah P., Jureen R., Sethi S.K. Clinical evaluation of serological IgG antibody response on the Abbott Architect for established SARS-CoV-2 infection. Clin. Microbiol. Infect. 2020;26:1256.e9–1256.e11. doi: 10.1016/j.cmi.2020.05.036. [DOI] [PMC free article] [PubMed] [Google Scholar]
- Cubuk J., Alston J.J., Incicco J.J., Singh S., Stuchell-Brereton M.D., Ward M.D., Zimmerman M.I., Vithani N., Griffith D., Wagoner J.A. The SARS-CoV-2 nucleocapsid protein is dynamic, disordered, and phase separates with RNA. Nat. Commun. 2021;12:1936. doi: 10.1038/s41467-021-21953-3. [DOI] [PMC free article] [PubMed] [Google Scholar]
- Dinesh D.C., Chalupska D., Silhan J., Koutna E., Nencka R., Veverka V., Boura E. Structural basis of RNA recognition by the SARS-CoV-2 nucleocapsid phosphoprotein. PLoS Pathog. 2020;16:e1009100. doi: 10.1371/journal.ppat.1009100. [DOI] [PMC free article] [PubMed] [Google Scholar]
- Ding B., Qin Y., Chen M. Nucleocapsid proteins: roles beyond viral RNA packaging. Wiley Interdiscip. Rev. RNA. 2016;7:213–226. doi: 10.1002/wrna.1326. [DOI] [PMC free article] [PubMed] [Google Scholar]
- Fung T.S., Liu D.X. Human coronavirus: host-pathogen interaction. Annu. Rev. Microbiol. 2019;73:529–557. doi: 10.1146/annurev-micro-020518-115759. [DOI] [PubMed] [Google Scholar]
- Grossoehme N.E., Li L., Keane S.C., Liu P., Dann C.E., Leibowitz J.L., Giedroc D.P. Coronavirus N protein N-terminal domain (NTD) specifically binds the transcriptional regulatory sequence (TRS) and melts TRS-cTRS RNA duplexes. J. Mol. Biol. 2009;394:544–557. doi: 10.1016/j.jmb.2009.09.040. [DOI] [PMC free article] [PubMed] [Google Scholar]
- Gui M., Liu X., Guo D., Zhang Z., Yin C.-C., Chen Y., Xiang Y. Electron microscopy studies of the coronavirus ribonucleoprotein complex. Protein Cell. 2017;8:219–224. doi: 10.1007/s13238-016-0352-8. [DOI] [PMC free article] [PubMed] [Google Scholar]
- Hachim A., Kavian N., Cohen C.A., Chin A.W.H., Chu D.K.W., Mok C.K.P., Tsang O.T.Y., Yeung Y.C., Perera R.A.P.M., Poon L.L.M. ORF8 and ORF3b antibodies are accurate serological markers of early and late SARS-CoV-2 infection. Nat. Immunol. 2020;21:1293–1301. doi: 10.1038/s41590-020-0773-7. [DOI] [PubMed] [Google Scholar]
- Iserman C., Roden C., Boerneke M., Sealfon R., McLaughlin G., Jungreis I., Park C., Boppana A., Fritch E., Hou Y.J. Specific viral RNA drives the SARS CoV-2 nucleocapsid to phase separate. bioRxiv. 2020 doi: 10.1101/2020.06.11.147199. [DOI] [Google Scholar]
- Jack A., Ferro L.S., Trnka M.J., Wehri E., Nadgir A., Costa K., Schaletzky J., Yildiz A. SARS CoV-2 nucleocapsid protein forms condensates with viral genomic RNA. bioRxiv. 2020 doi: 10.1101/2020.09.14.295824. [DOI] [PMC free article] [PubMed] [Google Scholar]
- Kang S., Yang M., Hong Z., Zhang L., Huang Z., Chen X., He S., Zhou Z., Zhou Z., Chen Q. Crystal structure of SARS-CoV-2 nucleocapsid protein RNA binding domain reveals potential unique drug targeting sites. Acta Pharma. Sin. B. 2020;10:1228–1238. doi: 10.1016/j.apsb.2020.04.009. [DOI] [PMC free article] [PubMed] [Google Scholar]
- Keane S.C., Liu P., Leibowitz J.L., Giedroc D.P. Functional transcriptional regulatory sequence (TRS) RNA binding and helix destabilizing determinants of murine hepatitis virus (MHV) nucleocapsid (N) protein. J. Biol. Chem. 2012;287:7063–7073. doi: 10.1074/jbc.M111.287763. [DOI] [PMC free article] [PubMed] [Google Scholar]
- Kim D., Lee J.-Y., Yang J.-S., Kim J.W., Kim V.N., Chang H. The architecture of SARS-CoV-2 transcriptome. Cell. 2020;181:914–921.e910. doi: 10.1016/j.cell.2020.04.011. [DOI] [PMC free article] [PubMed] [Google Scholar]
- Kozlov A.G., Galletto R., Lohman T.M. SSB–DNA binding monitored by fluorescence intensity and anisotropy. In: Keck J.L., editor. Single-Stranded DNA Binding Proteins: Methods and Protocols. Humana Press; 2012. pp. 55–83. [DOI] [PMC free article] [PubMed] [Google Scholar]
- Le Bert N., Tan A.T., Kunasegaran K., Tham C.Y.L., Hafezi M., Chia A., Chng M.H.Y., Lin M., Tan N., Linster M. SARS-CoV-2-specific T cell immunity in cases of COVID-19 and SARS, and uninfected controls. Nature. 2020;584:457–462. doi: 10.1038/s41586-020-2550-z. [DOI] [PubMed] [Google Scholar]
- Leung D.W., Amarasinghe G.K. When your cap matters: structural insights into self vs non-self recognition of 5' RNA by immunomodulatory host proteins. Curr. Opin. Struct. Biol. 2016;36:133–141. doi: 10.1016/j.sbi.2016.02.001. [DOI] [PMC free article] [PubMed] [Google Scholar]
- Liang Y., Wan Y., Qiu L.-w., Zhou J., Ni B., Guo B., Zou Q., Zou L., Zhou W., Jia Z. Comprehensive antibody epitope mapping of the nucleocapsid protein of severe acute respiratory syndrome (SARS) coronavirus: insight into the humoral immunity of SARS. Clin. Chem. 2005;51:1382–1396. doi: 10.1373/clinchem.2005.051045. [DOI] [PMC free article] [PubMed] [Google Scholar]
- Lin S.-Y., Liu C.-L., Chang Y.-M., Zhao J., Perlman S., Hou M.-H. Structural basis for the identification of the N-terminal domain of coronavirus nucleocapsid protein as an antiviral target. J. Med. Chem. 2014;57:2247–2257. doi: 10.1021/jm500089r. [DOI] [PMC free article] [PubMed] [Google Scholar]
- Liu W., Liu L., Kou G., Zheng Y., Ding Y., Ni W., Wang Q., Tan L., Wu W., Tang S. Evaluation of nucleocapsid and spike protein-based enzyme-linked immunosorbent assays for detecting antibodies against SARS-CoV-2. J. Clin. Microbiol. 2020;58 doi: 10.1128/JCM.00461-20. e00461–00420. [DOI] [PMC free article] [PubMed] [Google Scholar]
- Luo H., Ye F., Chen K., Shen X., Jiang H. SR-rich motif plays a pivotal role in recombinant SARS coronavirus nucleocapsid protein multimerization. Biochemistry. 2005;44:15351–15358. doi: 10.1021/bi051122c. [DOI] [PubMed] [Google Scholar]
- Lu S., Xie X.-x., Zhao L., Wang B., Zhu J., Yang T.-r., Yang G.-w., Ji M., Lv C.-p., Xue J. The immunodominant and neutralization linear epitopes for SARS-CoV-2. Cell Rep. 2021;34:108666. doi: 10.1016/j.celrep.2020.108666. [DOI] [PMC free article] [PubMed] [Google Scholar]
- Lu S., Ye Q., Singh D., Villa E., Cleveland D.W., Corbett K.D. The SARS-CoV-2 Nucleocapsid phosphoprotein forms mutually exclusive condensates with RNA and the membrane-associated M protein. Nat. Commun. 2021;21 doi: 10.1038/s41467-020-20768-y. [DOI] [PMC free article] [PubMed] [Google Scholar]
- Luo M., Terrell J.R., Mcmanus S.A. Nucleocapsid structure of negative strand RNA virus. Viruses. 2020;12:835. doi: 10.3390/v12080835. [DOI] [PMC free article] [PubMed] [Google Scholar]
- Mavrakis M., Kolesnikova L., Schoehn G., Becker S., Ruigrok R.W.H. Morphology of marburg virus NP–RNA. Virology. 2002;296:300–307. doi: 10.1006/viro.2002.1433. [DOI] [PubMed] [Google Scholar]
- McBride R., Zyl M.v., Fielding B. The coronavirus nucleocapsid is a multifunctional protein. Viruses. 2014;6:2991–3018. doi: 10.3390/v6082991. [DOI] [PMC free article] [PubMed] [Google Scholar]
- Messaoudi I., Amarasinghe G.K., Basler C.F. Filovirus pathogenesis and immune evasion: insights from Ebola virus and Marburg virus. Nat. Rev. Microbiol. 2015;13:663–676. doi: 10.1038/nrmicro3524. [DOI] [PMC free article] [PubMed] [Google Scholar]
- Patel A., Lee Hyun O., Jawerth L., Maharana S., Jahnel M., Hein Marco Y., Stoynov S., Mahamid J., Saha S., Franzmann T.M. A liquid-to-solid phase transition of the ALS protein FUS accelerated by disease mutation. Cell. 2015;162:1066–1077. doi: 10.1016/j.cell.2015.07.047. [DOI] [PubMed] [Google Scholar]
- Perlman S., Netland J. Coronaviruses post-SARS: update on replication and pathogenesis. Nat. Rev. Microbiol. 2009;7:439–450. doi: 10.1038/nrmicro2147. [DOI] [PMC free article] [PubMed] [Google Scholar]
- Raymond D.D., Piper M.E., Gerrard S.R., Smith J.L. Structure of the Rift Valley fever virus nucleocapsid protein reveals another architecture for RNA encapsidation. Proc. Natl. Acad. Sci.U S A. 2010;107:11769–11774. doi: 10.1073/pnas.1001760107. [DOI] [PMC free article] [PubMed] [Google Scholar]
- Savastano A., Ibáñez de Opakua A., Rankovic M., Zweckstetter M. Nucleocapsid protein of SARS-CoV-2 phase separates into RNA-rich polymerase-containing condensates. Nat. Commun. 2020;11:6041. doi: 10.1038/s41467-020-19843-1. [DOI] [PMC free article] [PubMed] [Google Scholar]
- Sola I., Almazán F., Zúñiga S., Enjuanes L. Continuous and discontinuous RNA synthesis in coronaviruses. Annu. Rev. Virol. 2015;2:265–288. doi: 10.1146/annurev-virology-100114-055218. [DOI] [PMC free article] [PubMed] [Google Scholar]
- Su Z., Wu C., Shi L., Luthra P., Pintilie G.D., Johnson B., Porter J.R., Ge P., Chen M., Liu G. Electron cryo-microscopy structure of ebola virus nucleoprotein reveals a mechanism for nucleocapsid-like assembly. Cell. 2018;172:966–978.e12. doi: 10.1016/j.cell.2018.02.009. [DOI] [PMC free article] [PubMed] [Google Scholar]
- Takeda M., Chang C.-k., Ikeya T., Güntert P., Chang Y.-h., Hsu Y.-l., Huang T.-h., Kainosho M. Solution structure of the C-terminal dimerization domain of SARS coronavirus nucleocapsid protein solved by the SAIL-NMR method. J. Mol. Biol. 2008;380:608–622. doi: 10.1016/j.jmb.2007.11.093. [DOI] [PMC free article] [PubMed] [Google Scholar]
- Tang M.S., Hock K.G., Logsdon N.M., Hayes J.E., Gronowski A.M., Anderson N.W., Farnsworth C.W. Clinical performance of the roche SARS-CoV-2 serologic assay. Clin. Chem. 2020;66:1107–1109. doi: 10.1093/clinchem/hvaa132. [DOI] [PMC free article] [PubMed] [Google Scholar]
- Tang M.S., Hock K.G., Logsdon N.M., Hayes J.E., Gronowski A.M., Anderson N.W., Farnsworth C.W. Clinical performance of two SARS-CoV-2 serologic assays. Clin. Chem. 2020;66:1055–1062. doi: 10.1093/clinchem/hvaa120. [DOI] [PMC free article] [PubMed] [Google Scholar]
- Wan W., Kolesnikova L., Clarke M., Koehler A., Noda T., Becker S., Briggs J.A.G. Structure and assembly of the Ebola virus nucleocapsid. Nature. 2017;551:394–397. doi: 10.1038/nature24490. [DOI] [PMC free article] [PubMed] [Google Scholar]
- Williams C.G., Gibbons J.S., Keiffer T.R., Luthra P., Edwards M.R., Basler C.F. Impact of Měnglà virus proteins on human and bat innate immune pathways. J. Virol. 2020;94 doi: 10.1128/JVI.00191-20. e00191–00120. [DOI] [PMC free article] [PubMed] [Google Scholar]
- Wu C.-H., Chen P.-J., Yeh S.-H. Nucleocapsid phosphorylation and RNA helicase DDX1 recruitment enables coronavirus transition from discontinuous to continuous transcription. Cell Host Microbe. 2014;16:462–472. doi: 10.1016/j.chom.2014.09.009. [DOI] [PMC free article] [PubMed] [Google Scholar]
- Wu C.-H., Yeh S.-H., Tsay Y.-G., Shieh Y.-H., Kao C.-L., Chen Y.-S., Wang S.-H., Kuo T.-J., Chen D.-S., Chen P.-J. Glycogen synthase kinase-3 regulates the phosphorylation of severe acute respiratory syndrome coronavirus nucleocapsid protein and viral replication. J. Biol. Chem. 2009;284:5229–5239. doi: 10.1074/jbc.M805747200. [DOI] [PMC free article] [PubMed] [Google Scholar]
- Ye Q., West A.M.V., Silletti S., Corbett K.D. Architecture and self-assembly of the SARS-CoV-2 nucleocapsid protein. Protein Sci. 2020;29:1890–1901. doi: 10.1002/pro.3909. [DOI] [PMC free article] [PubMed] [Google Scholar]
Associated Data
This section collects any data citations, data availability statements, or supplementary materials included in this article.
Supplementary Materials
Data Availability Statement
HDX-MS peptides table and all kinetic plots are accessible in Mendeley (https://doi.org/10.17632/sv8r6phkzt.1).