

Abstract
Steps of mRNA maturation are important gene regulatory events that occur in distinct cellular locations. However, transcriptomic analyses often lose information on the subcellular distribution of processed and unprocessed transcripts. We generated extensive RNA-seq data sets to track mRNA maturation across subcellular locations in mouse embryonic stem cells, neuronal progenitor cells, and postmitotic neurons. We find disparate patterns of RNA enrichment between the cytoplasmic, nucleoplasmic, and chromatin fractions, with some genes maintaining more polyadenylated RNA in chromatin than in the cytoplasm. We bioinformatically defined four regulatory groups for intron retention, including complete cotranscriptional splicing, complete intron retention in the cytoplasmic RNA, and two intron groups present in nuclear and chromatin transcripts but fully excised in cytoplasm. We found that introns switch their regulatory group between cell types, including neuronally excised introns repressed by polypyrimidine track binding protein 1 (PTBP1). Transcripts for the neuronal gamma-aminobutyric acid (GABA) B receptor, 1 (Gabbr1) are highly expressed in mESCs but are absent from the cytoplasm. Instead, incompletely spliced Gabbr1 RNA remains sequestered on chromatin, where it is bound by PTBP1, similar to certain long noncoding RNAs. Upon neuronal differentiation, Gabbr1 RNA becomes fully processed and exported for translation. Thus, splicing repression and chromatin anchoring of RNA combine to allow posttranscriptional regulation of Gabbr1 over development. For this and other genes, polyadenylated RNA abundance does not indicate functional gene expression. Our data sets provide a rich resource for analyzing many other aspects of mRNA maturation in subcellular locations and across development.
After transcription initiation, the maturation of pre-messenger RNA (pre-mRNA) requires splicing, polyadenylation, and release of the RNA from the chromatin template before export to the cytoplasm for translation. For many genes, the bulk of expressed RNA exists in the cytoplasm as mature mRNA, whereas nascent, intron-containing transcripts are limited to small nuclear puncta at the sites of transcription (Vargas et al. 2011; Coulon et al. 2014). For other genes, unspliced introns may remain after transcript completion but are ultimately excised to allow export (Girard et al. 2012; Popp and Maquat 2013; Stewart 2019). These nuclear transcripts are not necessarily found at their gene loci, but some polyadenylated transcripts, including many noncoding RNAs, are tightly associated with chromatin (Quinn and Chang 2016). Although proteins affecting processes such as DNA template release, RNA export, and nuclear RNA decay have been identified (Schmid and Jensen 2018; Stewart 2019), the global distribution of RNA transcripts between subcellular compartments and the alteration of their maturation and location with development have not been well studied.
In earlier studies, we examined the kinetics of transcription, splicing, and nuclear export for macrophage transcripts induced by inflammatory stimuli (Bhatt et al. 2012; Pandya-Jones et al. 2013). By following inflammatory gene transcripts, we found that partially spliced but polyadenylated transcripts in the chromatin fraction completed splicing over time and were released to the soluble nucleoplasmic fraction before appearing in the cytoplasm as functional mRNAs (Bhatt et al. 2012; Pandya-Jones et al. 2013). These studies focused on introns whose slow splicing impacted the rate of inflammatory gene expression. However, polyadenylated, partially spliced RNA has been long been observed in nuclei, where its interactions and localization are largely unknown.
The above analyses used a fractionation procedure to enrich for nucleoplasmic or chromatin-associated RNA (Wuarin and Schibler 1994; Pawlicki and Steitz 2008; Pandya-Jones and Black 2009; Khodor et al. 2012; Herzel and Neugebauer 2015; Yeom and Damianov 2017). Nucleoplasmic and chromatin compartments are operationally defined as the supernatant and pellet fractions, respectively, after nuclear lysis in a stringent buffer containing NP-40, urea, and NaCl. This solubilizes many components such as the U1 snRNP, while leaving other molecules associated with the high-molecular-weight chromatin pellet (Wuarin and Schibler 1994). The cytoplasmic fraction is enriched for mature mRNA, whereas the nucleoplasmic fraction contains recently matured transcripts released from the chromatin that have not yet reached the cytoplasm (Bhatt et al. 2012; Pandya-Jones et al. 2013), as well as some mature mRNAs associated with ER and mitochondria (Yeom and Damianov 2017). The chromatin pellet is enriched for nascent RNA bound by elongating RNA Pol II but also contains substantial polyadenylated RNA, including the Xist noncoding RNA tightly bound to chromatin (Pandya-Jones et al. 2020) and the Malat1 noncoding RNA, which is enriched in nuclear speckles that are adjacent to chromatin but only partially in contact with it (Hutchinson et al. 2007; Fei et al. 2017).
The consequences of intron retention (IR) are diverse and complex to dissect. Splice sites and binding of spliceosomal components can prevent nuclear RNA export (Hautbergue 2017; Stewart 2019; Garland and Jensen 2020). Nevertheless, some intron-containing transcripts are exported to the cytoplasm as alternative mRNA isoforms that either encode an alternative protein or are subject to altered translation and decay (Jacob and Smith 2017; Wegener and Müller-McNicoll 2018). Other introns slow to be excised relative to transcription are ultimately removed and their transcripts exported as fully spliced mRNAs (Ninomiya et al. 2011; Bhatt et al. 2012; Hao and Baltimore 2013; Pandya-Jones et al. 2013; Frankiw et al. 2019a). Such transcripts can create a nuclear pool of partially spliced RNA, which acts as a reservoir to feed the cytoplasmic mRNA pool upon splicing. A group of these introns found in genes affecting growth control and cell division was named “detained introns” (DIs) to distinguish them from classical “retained introns” found in cytoplasmic mRNA (Boutz et al. 2015; Braun et al. 2017). A similar pool of incompletely spliced transcripts affecting synaptic function is found in neurons, where cell stimulation induces their processing to allow transcription-independent changes in mRNA pools (Mauger et al. 2016). The term “retained intron” thus encompasses a wide range of molecular behaviors.
Retained introns are more difficult to characterize than other patterns of alternative splicing in whole-transcriptome RNA-seq data. Overlapping patterns of alternative processing can be miscalled as IR by sequence analysis tools (Wang and Rio 2018; Broseus and Ritchie 2020). Many RNA-seq studies have identified conditions leading to higher levels of unspliced introns across the transcriptome (Wong et al. 2013; Braunschweig et al. 2014; Edwards et al. 2016; Pimentel et al. 2016; Jacob and Smith 2017; Naro et al. 2017; Schmitz et al. 2017; Parra et al. 2018). These studies have not always distinguished between nuclear and cytoplasmic RNA or examined the fate of the partially spliced transcripts, information that is essential to understanding the biological role of these regulatory mechanisms.
Here we undertook a broad examination of how RNAs are distributed between subcellular compartments and how this compartmentalization changes with development. Our goals were to distinguish transcripts in the nucleoplasmic and chromatin-associated RNA pools from cytoplasmic mRNAs and assess how their processing and localization to chromatin tracked with expression of mature cytoplasmic mRNA.
Results
Both coding and noncoding RNAs show defined partitioning between cellular compartments
To broadly categorize RNAs enriched in different cellular locations and to gain insight into how this compartmentalization might be regulated across cell types, we generated deep RNA-seq data from mouse embryonic stem cells (mESCs), a neuronal progenitor cell line derived from embryonic mouse brain (mNPC), and explanted mouse cortical neurons cultured in vitro for 5 d (mCtx) (Fig. 1A). RNA was isolated from three fractions of each cell: cytoplasm, soluble nucleoplasm, and chromatin pellet as previously described (Wuarin and Schibler 1994; Pandya-Jones and Black 2009; Bhatt et al. 2012; Yeom and Damianov 2017). The quality of subcellular fractionation was assessed by immunoblot for GAPDH and tubulin, alpha 1A (TUBA1A) proteins as cytoplasmic markers, SNRNP70 fractionating with the soluble nucleoplasm, and Histone H3.1 as a chromatin marker (Supplemental Fig. S1A; Supplemental Table S1B).
Figure 1.

RNA partitioning between subcellular compartments. (A) Workflow used in this study. (B) Genome browser tracks of the Gapdh locus in mESCs. GENCODE annotated isoforms (M11) are diagrammed at the top. Poly(A)+ RNA (open box), total RNA (gray box), and peak RPM are noted on the left. RNA from chromatin (Chr), nucleoplasmic (Nuc), and cytoplasmic (Cyto) fractions are labeled at the right. The fixed Y-scale (RPM) shows the strong enrichment of Gapdh RNA in the cytoplasm. The bottom tracks show chromatin RNA with an extended Y-scale to observe the intron reads. (C) Genome browser tracks of the Xist/Tsix locus in female mNPCs show strong chromatin enrichment of Xist RNA. (D) Distribution of chromatin partition indices. The chromatin/cytoplasm ratio [Chr_Poly(A)+/Cyto_Poly(A)+] of the averaged read counts of each gene are plotted as a distribution along the log2 scale, with partition indices of representative genes indicated below. Biotypes of the 400 genes from bottom (left [L]; blue bar), peak (middle [M]; green bar), and top (right [R]; red bar) of the distribution are presented in the bar graph below.
To provide information on the maturation of transcripts in each cell type and location, RNA was isolated as two separate pools. A total RNA pool depleted of ribosomal RNA [total] will include nascent incomplete transcripts. A polyadenylated pool [poly(A)+] includes RNAs whose transcription and 3′ processing are complete. Each RNA pool from each fraction was isolated from three separate cultures of each cell type to yield biological triplicates of each experimental condition. The RNA pools were converted to cDNA libraries, sequenced on the Illumina platform to yield 100-nt paired end reads, and aligned to the genome (Supplemental Table S2). Gene expression markers for each of the three cell types confirmed the expected patterns of ESCs, NPCs, or immature neurons (Supplemental Fig. S1B). Clustering of gene expression values across all the data sets showed the expected segregation by cell type, fraction, and replicate, for both the poly(A)+ and total RNA libraries (Supplemental Fig. S1C). The resulting 54 data sets constitute an extensive resource for examining multiple aspects of RNA maturation and its modulation during development (see Data access [GSE159919 for poly(A)+ RNA and GSE159944 for total RNA]). In addition to the libraries used in this study, we also generated libraries of small RNAs (<200 nt) from all samples. As previously described, these can be used to assess miRNA maturation and other processes (Yeom et al. 2018). These 27 data sets are also available from the NCBI Gene Expression Omnibus (GEO; https://www.ncbi.nlm.nih.gov/geo/) (GSE159971).
Examining read distributions in the different RNA pools and fractions, we found that the housekeeping gene Gapdh (Fig. 1B) yields similar patterns of reads from either the poly(A)+ or the total RNA populations, with the RNA being most abundant in the cytoplasm. The total Gapdh RNA on chromatin contains intron reads from the nascent transcripts (Fig. 1B, bottom). Although more abundant in the soluble nucleoplasm and especially in the cytoplasm, polyadenylated Gapdh transcripts are also found in the chromatin fraction but, in contrast to the total RNA, lack intron reads. We also examined the long noncoding RNA Xist, which condenses on the inactive X Chromosome in female cells (Fig. 1C). The mNPCs were isolated from female mice, and Xist is seen to partition almost completely to chromatin in these cells. The poly(A)+ and the total RNA samples yielded very similar patterns of Xist reads, indicating that this RNA is largely spliced and polyadenylated (Brockdorff et al. 1992). Other noncoding RNAs yielded more complex patterns of subcellular partitioning that changed with cell type. The paraspeckle lncRNA Neat1 is more highly expressed in mESCs than mNPCs or neurons (Supplemental Fig. S2A). The short polyadenylated form (Neat1_1) predominates in ESCs and is found mostly with chromatin but also in the nucleoplasm. The longer nonpolyadenylated Neat1 RNA (Neat1_2) is seen in the total RNA samples and is also chromatin enriched. Whether this is a stable long isoform or nascent RNA is not clear. This longer RNA contributes a larger portion of the Neat1 transcripts in mNPCs and neurons, consistent with observations that Neat1 cleavage and polyadenylation may be modulated (Naganuma et al. 2012). Overall, we find that gene transcripts can show diverse patterns of enrichment and processing across the different fractions and cell types.
Because the relative transcript numbers and overall library complexity will differ between fractions, reads per million (RPM) values or other read number normalizations of individual genes cannot be directly compared between different subcellular fractions. By using qRT-PCR in mESCs to directly quantify individual transcripts in different fractions, we found that for cytoplasmic enriched transcripts in both the poly(A)+ and the total RNA libraries, RPM values undercounted the RNA abundance in the cytoplasmic fraction relative to the chromatin and nucleoplasm (Supplemental Table S3). On the other hand, for RNAs that are primarily chromatin associated, qRT-PCR quantification yielded cytoplasmic-to-chromatin ratios that were similar to relative RPM numbers (Supplemental Table S3). Although the absolute transcript levels were not quantifiable by RPM, the ratios of these RPM values did reflect their relative enrichment in each fraction across a variety of genes. As an index for how RNAs partition between the chromatin and cytoplasmic pools, we used DESeq2 (Anders and Huber 2010) to measure the fold change in reads for each gene between the chromatin and cytoplasmic poly(A)+ RNA. This returns the ratio of the averaged read counts for each gene between fractions. For genes that had a transcripts per million (TPM) value in chromatin over the median and that had read counts greater than zero in the cytoplasm (13,036 genes), this chromatin partition index was distributed over a 100-fold range centered on one (Log2 = 0). Thus, a typical gene showed equal normalized read counts in chromatin and cytoplasm (Fig. 1D). By examining the Ensembl annotations (V.91) for genes in the left, middle, and right side of this distribution (400 genes each), we found that genes with predominately cytoplasmic reads as well as genes with roughly equal read numbers in cytoplasm and chromatin were annotated almost entirely as protein-coding genes. For example, on the left edge (Fig. 1D), Gapdh RNAs partition much more strongly to the cytoplasm than is typical. In the middle of the distribution, Rbfox2 RNAs show slightly fewer reads on chromatin than in the cytoplasm, whereas Cdk8 shows two- to threefold more chromatin reads (Fig. 1D). Thus, although the transcripts from protein-coding genes are usually most abundant in the cytoplasm, a substantial fraction of a gene's RNA product is often nuclear and chromatin associated. By comparing qRT-PCR quantification for select genes to their chromatin partition indices, we found that RNAs from genes showing a partition index above 3.6 were actually more abundant in chromatin than the cytoplasm. This included ∼3% of protein-coding genes. At the right edge of the curve, the 400 most chromatin enriched transcripts included the expected noncoding RNAs, such as pri-miRNAs, snoRNAs, and lncRNAs, but also many protein-coding genes, including Clcn2, Ankrd16, and Gpc2 (Supplemental Figs. S2C,D, S6B), and Gabbr1, which is analyzed further below. For these protein-coding genes, the majority of the polyadenylated product RNA is chromatin associated, where it is presumably inactive for protein expression (Supplemental Figs. S2C,D, S6B).
Examination of individual genes whose poly(A)+ transcripts remain sequestered with chromatin showed that their splicing was modulated across cell types. The chromatin-associated Meg3 noncoding RNA is well expressed in mESCs and neurons but not in mNPCs (Supplemental Fig. S2B). Meg3 is the host transcript for the miRNAs MiR-770 and MiR-1906-1. Mature MiR-770, processed from the last Meg3 intron, is weakly expressed in neurons but absent from mESCs (Supplemental Table S4). This intron is absent from the RNA in mESCs, where it is apparently efficiently spliced. In contrast in neurons, this intron is abundant in the chromatin fraction of polyadenylated RNA, where its reduced excision might allow more efficient processing of mir-770 (Supplemental Fig. S2B). This is consistent with observations that perturbations causing a host transcript to be released from chromatin reduce DROSHA cleavage and miRNA expression (Pawlicki and Steitz 2008; Liu et al. 2016a). The mESC small RNA data were previously used to examine expression of primary mir-124a-1 in mESCs whose processing is blocked by PTBP1 in the chromatin fraction (Yeom et al. 2018). For Meg3, the processing of mir-770 may be modulated by the excision rate of its host intron. The upstream portion of Meg3 that includes mir-1906-1 undergoes complex processing and shows more splicing in neurons than in mESCs. Thus, an additional product from the gene, possibly mir-1906-1, may also be differentially regulated between mESCs and neurons. These introns present in the polyadenylated RNA are not more abundant in the total RNA than adjacent exon sequences, indicating an absence of excised intron, which could also give rise to the miRNAs. Overall, the data indicate that splicing of the Meg3 transcript is regulated on chromatin to allow differential expression of its mature products.
Chromatin-associated transcripts can be spliced either cotranscriptionally or posttranscriptionally
It is expected that most introns will be transient species within the chromatin RNA, with many introns excised before transcript completion, whereas some introns with slow kinetics will be removed later. Various studies estimate that 45%–84% of introns are cotranscriptionally excised in mammals (Ameur et al. 2011; Bhatt et al. 2012; Girard et al. 2012; Khodor et al. 2012; Tilgner et al. 2012; Windhager et al. 2012). Several approaches compare read numbers for spliced (exon–exon [EE]) and unspliced (exon–intron [EI] or intron–exon [IE]) junctions in nascent RNA to those in total RNA to measure cotranscriptional excision (Tilgner et al. 2012; Windhager et al. 2012; Herzel and Neugebauer 2015). To ensure that measurements are of the nascent RNA, this requires removal of polyadenylated RNA from the chromatin fraction and prevents parallel analysis of posttranscriptional events. Other studies identified sawtooth patterns of RNA read abundance in total cellular RNA, where reads peak in exons and then decline to the next exon or recursive splice site. Such a pattern is thought to indicate that the time needed to excise an intron is small relative to the time for RNA synthesis through the next intron downstream (Ameur et al. 2011; Duff et al. 2015; Sibley et al. 2015). Although sawtooth read densities can be observed on certain introns in the total chromatin RNA pools (Supplemental Fig. S3), these patterns were infrequent and lost on introns <50 kb, many of which are expected to be cotranscriptionally excised (Ameur et al. 2011).
As an alternative for defining cotranscriptional and posttranscriptional intron excision, we compared the total RNA from chromatin to the poly(A)+ RNA from the same fraction. Introns remaining in polyadenylated RNA must be excised after transcription or be dead-end products. For example, in the Sorbs1 gene (Fig. 2A), reads are observed across all the introns in the total RNA from chromatin, indicating the presence of unspliced introns in the nascent transcripts. In the polyadenylated RNA on chromatin, reads are largely absent from introns, indicating that by the time of polyadenylation or shortly after, these introns have been spliced out. However, one intron in Sorbs1 shows substantial read numbers in poly(A)+ RNA on chromatin that are reduced in RNA from the nucleoplasm and absent from the cytoplasm (Fig. 2A). This intron is presumably excised after cleavage/polyadenylation. Although most introns are absent from the polyadenylated RNA and are likely spliced cotranscriptionally, there are many transcripts with one or more introns that are highly retained in the polyadenylated chromatin-associated RNA (Fig. 2A,B). The comparison of intron levels in total and poly(A)+ RNA on chromatin provides a simple bioinformatic metric for distinguishing co- versus posttranscriptional excision.
Figure 2.
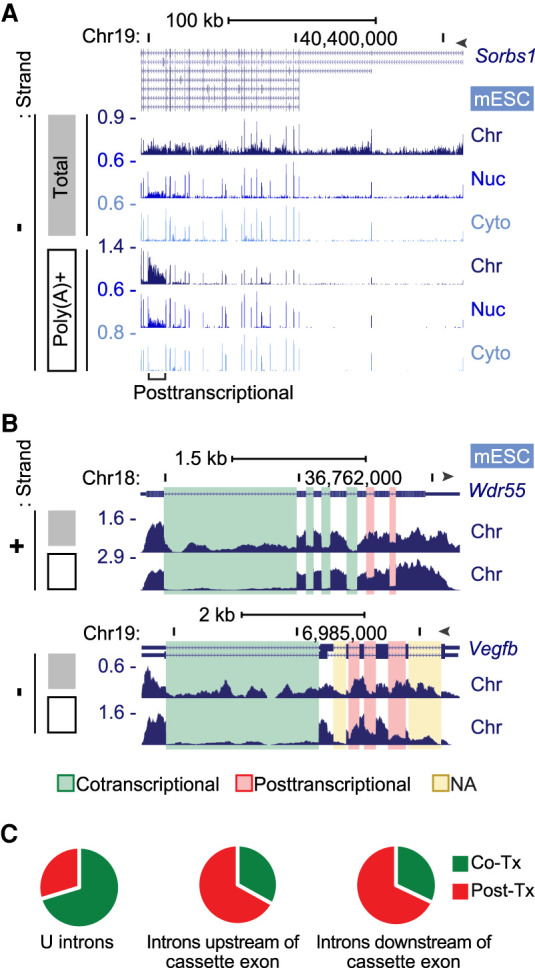
Cotranscriptional and posttranscriptional intron excision. (A) Genome browser tracks of the Sorbs1 locus in mESCs. Total chromatin RNA (gray box) shows intron reads, but the poly(A)+ RNA (open box) shows primarily exon reads except one posttranscriptional intron. (B) Genome browser tracks of chromatin RNA at the Wdr55 and Vegfb loci in mESCs. Total (gray box) and poly(A)+ (open box) are shown, with cotranscriptionally and posttranscriptionally spliced introns highlighted in green and red, respectively. Yellow highlighted introns were not analyzable owing to multiple processing patterns. (C) Proportions of co- and posttranscriptional splicing for 49,692 U introns in mESCs, using criteria described in Supplemental Figure S4, C through E. Introns upstream of (2779) and downstream from (2744) simple cassette exons were similarly analyzed.
To compare intron levels in the total and poly(A)+ RNA pools, we determined fractional inclusion (FI) values (Supplemental Fig. S4A) by counting reads across EI, IE, and EE junctions. Assessing IR by FI value can be confounded by alternative splicing, polyadenylation, or transcription initiation events occurring within the intron being measured (Supplemental Fig. S4B; Wang and Rio 2018; Broseus and Ritchie 2020). To avoid errors in IR measurements arising from other processes, we defined a set of introns showing a unique Ensembl v91 annotation without alternative processing events (Supplemental Fig. S4B). This set of 149,333 “unique” introns (U introns) across 28,733 genes was used for subsequent analysis. By focusing on the mESC RNA, we determined the FI values of all U introns in the total RNA and the poly(A)+ RNA for genes above the median expression level as measured by kallisto (Bray et al. 2016). We included only introns excised by the major spliceosome with GU/AG splice junctions. Reads from poly(A)+ RNA containing long unspliced introns can be biased toward the 3′ ends. To avoid undercounting in the poly(A)+ samples, we removed genes in which reads per nucleotide length from the second exon were less than half that of the second to last exon. To filter out introns that were not measurable owing to anomalies in the generation of particular junction reads, we removed introns yielding a FI value below 0.1 in the total RNA, and introns with a zero value for one or more of the junction read counts. In mESCs, these criteria returned 49,629 U introns within 7672 genes for analysis.
Of the 49,629 U introns being measured, 34,939 introns (within 6952 genes) showed low FI values in the poly(A)+ RNA (FI < 0.1) and are presumably spliced before transcript completion. Conversely, 14,753 introns within 5550 genes showed a FI value ≥0.1 in the poly(A)+ RNA. These introns (29.7%) appear to be excised posttranscriptionally, with many highly unspliced in the chromatin poly(A)+ RNA despite being fully spliced in other fractions. By this analysis, at least 70.3% of introns within our analysis set are excised cotranscriptionally, similar to estimates made by other methods (Fig. 2C; Supplemental Fig. S4C–F; Supplemental Table S5). On the other hand, the majority of genes (5550 out of 7672) have at least one posttranscriptionally spliced intron. If the analysis is restricted to the top quartile of expressed genes rather than the top half, the fractions of co- and posttranscriptional splicing change only slightly (70.7% cotranscriptional). The fraction of cotranscriptionally spliced introns is also essentially the same if the analysis is restricted to the first introns in each transcript or to internal introns. For introns that are the last intron transcribed before the polyadenylation site, a slightly higher fraction is classified as posttranscriptional, presumably because they are polyadenylated more rapidly after intron synthesis (Supplemental Fig. S4F). Thus, posttranscriptional splicing does not appear to be associated with higher or lower gene expression or with the position of an intron along the gene. Examples of introns defined as co- or posttranscriptional by these measures are shown in Figure 2B. Although in the minority, posttranscriptionally spliced introns are found across a wide range of genes and often show high FI values in the chromatin fraction, even though the cytoplasmic RNA is completely spliced.
In addition to the U introns analyzed above, we also analyzed a set of introns flanking simple cassette exons that could also be unambiguously measured for FI. By using the same parameters to define co- versus posttranscriptional splicing, we found a reversal in the percentages. Of these introns flanking alternative exons, ∼67% show high read numbers (FI > 0.1) in the poly(A)+ RNA and thus appear to be excised posttranscriptionally (Fig. 2C; Supplemental Fig. S4E). This was seen for introns both upstream of and downstream from the cassette exon. These data indicate that the majority of regulated splicing events occur with slower kinetics than the excision of typical constitutive introns.
Retained introns can be classified by their enrichment in the chromatin, nucleoplasmic, and cytoplasmic compartments
A variety of fates are possible for transcripts that retain introns after polyadenylation. Intron-containing transcripts can be sequestered in the nucleus until they are spliced or can undergo nuclear decay. Other intron-containing mRNAs are exported unspliced to the cytoplasm, where they can be translated or undergo nonsense-mediated mRNA decay (NMD). To categorize introns based on both their retention levels and location, FI values for the unique intron set in the polyadenylated RNA of all cells and fractions were subjected to X-means cluster analysis (Fig. 3A; Supplemental Table S6; Pelleg and Moore 2000). Consistently, in all three cell types, the clustering algorithm defined four groups of introns. The largest cluster Group A, containing 49,981 introns in mESCs, was almost entirely spliced in all three fractions. Introns in Group B (7529) showed measurable retention in the poly(A)+ RNA from chromatin but showed nearly complete splicing in the nucleoplasm and cytoplasm (Fig. 3A). Group C introns (1351), including introns in Zfp598 and Neil3 (Fig. 3B), showed higher FI values in the chromatin and nucleoplasm than did Group B but were almost completely excised from the cytoplasmic RNA. The smallest cluster of only 247 introns in mESCs, Group D, was almost entirely retained in all three fractions. Each of the other two cell types also generated four clusters with similar splicing levels and similar numbers of introns in each group (Fig. 3A).
Figure 3.

Intron groups defined by their retention level and fractionation behavior. (A) X-means clustering was applied to intron FI values and fraction enrichment in mESCs, mNPCs, and mCtx neurons. The FI distribution for introns in each subcellular fraction and group is shown. (B) Genome browser tracks (top) and RT-PCR validation (bottom) of representative transcripts in mESCs. Validated introns are indicated by a blue highlight and a bracket below. Gel images are one of three biological replicates. (C) The proportion of introns containing a PTC in frame with the upstream sequence is shown for each cluster and cell type. (D) Percentage of introns in each group for U introns from mESCs and for detained introns within the U intron set (Boutz et al. 2015).
Group B and C introns that do not leave the nucleus can be seen to have different properties from Group D introns that also have high retention levels in the cytoplasm. A larger percentage of Group D introns are found in 5′ and 3′ UTR sequences, where they will not disrupt the primary reading frame but will likely affect translation and decay (Supplemental Table S7B). Group D introns were also found to be depleted of in-frame premature termination codons (PTC) compared with Groups A, B, and C (Fig. 3C), presumably owing to selection to prevent NMD in the cytoplasm. These observations indicate that the different intron clusters arise from selection for different functions in the intron-containing RNAs.
We found that among transcripts in which all introns were annotated as unique introns (Supplemental Fig. S4G), RNAs containing at least one Group C intron have a higher average chromatin partition index than transcripts with no Group C intron (Supplemental Fig. S4H). Previous work defined nuclear transcripts in mESCs containing what are called detained introns (DIs), whose splicing is modulated in cancer and growth control pathways (Boutz et al. 2015; Braun et al. 2017). Of 3150 DIs, 1021 were on our U intron list (Supplemental Tables S7A, S7B). Of these, 1000 introns passed the filters for FI measurement and are seen to fall predominantly into Groups B and C, in agreement with the earlier studies (Fig. 3D). However, the 1021 DIs were only a subset of the nearly 9000 retained introns identified in Groups B and C (Supplemental Table S8B). Similar to the DIs affecting growth control, as well as inflammatory and neuronal gene introns also identified previously (Bhatt et al. 2012; Hao and Baltimore 2013; Pandya-Jones et al. 2013; Mauger et al. 2016; Frankiw et al. 2019b), these new retained introns could affect cellular function by altering the movement of material through the gene expression pathway.
Predicting retained introns
To examine whether introns in different groups could be identified by their sequence features alone, we developed a deep learning model for predicting intron behavior. We extracted 1387 sequence features from the first and last 300 nucleotides (nt) of each intron and from the two flanking exons. For introns <300 nt, the intron interval includes some adjacent exon sequence. Analyzed features included short motif frequencies, predicted RBP binding elements, propensity to form local secondary structure, splice site strength scores, conservation scores, and nucleosome positioning scores (Supplemental Table S9A). This feature information was used to train a three-layer deep neural network (DNN) tasked with predicting whether an intron belonged in Group A, B, C, or D (Fig. 4A).
Figure 4.

Deep learning analysis of intron groups. (A) Flow diagram for training the deep neural network. (B) Performance of the model in distinguishing introns of different groups. ROC curves were plotted for individual pairwise comparisons with AUC values shown in parentheses. (C) t-SNE plots of the 15 genomic features most predictive for distinguishing intron groups. Features distinguishing Group A from Groups C and D are shown above and those distinguishing Group C from Group D below. Features colored blue or red indicate the group for which they are positively correlated.
The performance of the model was assessed using receiver operating characteristic (ROC) curves plotting the false- and true-positive rates (Fig. 4B). The model was highly predictive in distinguishing Group D introns from A, yielding an area under the curve (AUC) of 0.94 (AUC = probability that any true positive will rank higher than any true negative). Group D introns could also be distinguished from Group B and C (AUC = 0.9 and 0.84, respectively), whereas Group B and C introns were distinguished from Group A with reduced accuracy (AUC = 0.68 and 0.76, respectively). Thus, the Group D introns are most different from the introns of other groups.
To assess the features of Group C and D introns that distinguish them from each other and from Group A, we isolated the top 15 features predictive of IR or its absence and used a t-distributed stochastic neighbor embedding algorithm (t-SNE) to project them onto two dimensions (Fig. 4C; for top 50 features, see Supplemental Table S9B). As previously observed, high splice site strength scores were predictive of Groups A and C over D, as well as Group A over C (Sakabe and de Souza 2007; Braunschweig et al. 2014). Other features redundant with splice site strength scores were also predictive of Groups A or C, including GTAAG count in the 5′ portion of the intron and the conservation of the splice site sequences. Translatability of the flanking exons and their spliced product was predictive of Groups A and C over D. This may reflect a greater percentage of Group D introns in 5′ and 3′ UTR sequences (Supplemental Table S7B). Conversely, the translatability of the exon–intron–exon unit containing the retained intron was predictive of Group D over Group C, in agreement with the Group D introns being depleted of in-frame termination codons (Fig. 3C) and adding a coding segment to the mRNA. Overall, the data indicate that IR is controlled by many factors each having relatively small effect.
We examined whether particular sequence elements correlated with the intron group assignments, indicative of regulatory protein binding sites. The model did not clearly identify known elements affecting nuclear localization or IR such as constitutive transport elements or decoy exons (Li et al. 2006; Parra et al. 2018). However, the sequence conservation score of the 5′ portion of the intron was predictive of Group D over Groups C or A, and conservation of both ends of the intron was predictive of C over A (Supplemental Table S9B). Particular triplet motif frequencies within introns or their flanking exons were also predictive of intron behavior. For example, CGA triplets in the 3′ portion of the intron were predictive of Group D over C, whereas TTG and GTT triplets in the 5′ intron segment were predictive of Group C over D. The predictive power of intron sequence conservation and of multiple triplets indicate that particular RNA/protein interactions likely determine the retention properties of these groups.
IR and chromatin association are regulated with neuronal development
Because the X-means analysis yielded four intron clusters in each cell type, these cluster definitions allow bioinformatic analysis of IR regulation between cell types. Although many introns maintain their classification between cell types (Fig. 5A, left), some introns switched their group (Fig. 5A, right). One example is Med22 (Fig. 5B), which contains a highly retained intron 3 (I3) in all three fractions of mESCs (Group D). This intron became more spliced in mNPCs and was classified as Group C and then became almost fully spliced as a Group B intron in neurons. The nearby intron 1 (I1) was maintained as a Group A intron in all three cell types. Med22 encodes a subunit of the transcriptional mediator complex. The retention or splicing of Med22 I3 creates MED22 proteins with different C-terminal peptides that likely alter mediator function in the two cell types. The group-switching introns are presumably part of the extensive alternative splicing programs modulated during neuronal development. By examining their Gene Ontology (GO) functions, we found that the 231 genes containing introns highly spliced in mESCs but unspliced in neurons (switching from Group A or B to Group C or D) were enriched in processes such as ribosome biogenesis, organelle assembly, and metabolism. These functional categories may reflect the different proliferation rates and metabolic status of the two cells. In contrast, 413 genes whose introns were unspliced in mESCs and became more spliced in neurons (switching from Group C or D to Group A or B) were enriched in GO biological processes of glutamatergic synaptic transmission and organelle localization by membrane tethering, in keeping with gene expression and cell morphology changes in the early neuronal state (Supplemental Fig. S5).
Figure 5.

Regulation of intron retention and chromatin association during neuronal development. (A) Circos plot (Krzywinski et al. 2009; Gu et al. 2014) of intron group changes between cell types (mESCs, mNPCs, and mCtx neurons). Introns not changing groups are on the left. Introns switching groups between cell types on the right. (B) Genome browser tracks of Med22 during neuronal differentiation (left three panels) and after Ptbp knockdown in mESCs (right three panels). Dashed boxes indicate U introns with measured FI values (introns 1 and 3) under each track. Group classification of intron 3 is at the bottom. (C) Scatter plots of FI change between mESCs and neurons (mCtx) plotted for each fraction against FI change after Ptbp1 knockdown in mESCs. Introns with Δ FI < −0.1 in both conditions are in red and with Δ FI > 0.1 in blue. The number of introns showing these changes with the number carrying PTBP1 iCLIP tags in parentheses, is above and below (Linares et al. 2015). Intron 3 of Med22 is circled in green.
The changes in splicing between mESCs, mNPCs, and neurons are driven by changes in the expression of multiple protein regulators. In previous work, we and others characterized alternative splicing programs controlled by the polypyrimidine tract binding proteins PTBP1 and PTBP2 (Keppetipola et al. 2012; Vuong et al. 2016). In ESCs and other cells, PTBP1 maintains alternative splicing patterns characteristic of nonneuronal cells, and PTBP1 down-regulation is a key step in neuronal differentiation. Although the cultured NPCs are not true lineage precursors to the immature cortical neurons used here, the depletion of PTBP1 is common to many neuronal lineages. We previously reported neuronal cassette exons regulated by PTBP1 in ESCs (Linares et al. 2015), and PTBP1-regulated retained introns, including the Med22 intron, have been described in a neuronal cell line (Yap et al. 2012). We next examined whether additional PTBP1 targets could be identified in the chromatin compartment of mESCs.
To assess PTBP1 regulation, we fractionated cells after Ptbp1 knockdown and measured the splicing of polyadenylated RNA in the different compartments by RNA-seq. This confirmed the PTBP1 dependence of Med22 I3, which shifted from Group D to Group C with Ptbp1 depletion (Fig. 5B, right). By examining all the retained introns, we found that many more splicing changes could be observed in the chromatin-associated RNA than in the nucleoplasmic and cytoplasmic fractions (Fig. 5C). As shown previously with cassette exons, these PTBP1-dependent introns in ESCs also change with neuronal differentiation as PTBP1 levels drop (Fig. 5C). These include introns identified previously (Yap et al. 2012) as well as new introns. Other introns whose splicing changes with neuronal development but are not sensitive to PTBP1 are presumably regulated by other factors.
By examining the chromatin-associated RNA, our analysis identified substantially more PTBP1-regulated introns than previously recognized. The transcripts containing these introns may remain in the nucleus, similar to DIs, or may be exported to the cytoplasm and then lost to NMD. To assess this, we used data from a study of unfractionated polyadenylated RNA after Upf1 knockdown that globally identified NMD targets in mESCs (Hurt et al. 2013). A majority of Group A, B, and C introns is predicted to induce NMD if their parent transcripts were exported to the cytoplasm (Fig. 3C). However, we find that of 871 genes containing PTBP1-dependent retained introns in the chromatin fraction, only 87 showed >10% transcript up-regulation after Upf1 depletion (Supplemental Table S8C). Thus, the majority of the PTBP1-dependent retained intron transcripts likely stay in the nucleus and will be eliminated by nuclear RNA decay pathways.
By looking more broadly at whether NMD might create the apparent nuclear enrichment of some transcripts, we found that protein-coding genes with high chromatin partition indices were actually less likely to show increases after Upf1 depletion than other genes across the distribution (Supplemental Table S8D). For the genes in the L, M, and R regions in Figure 1D, NMD targets constituted 4.2%, 7.2%, and 1.1%, respectively. Rather than NMD causing the observed nuclear enrichment by depleting the cytoplasmic RNA, the nuclear enrichment may buffer the effect of NMD on the level of total RNA. It would be interesting to assess this by examining the effect of Upf1 knockdown specifically on the levels of cytoplasmic mRNA.
Posttranscriptional repression of Gabbr1 expression
For the most part, transcripts enriched in the chromatin fraction of mESCs (Fig. 1D) were only mildly or unaffected by Upf1 depletion (Supplemental Table S8D). Rather than cytoplasmic degradation, other processes prevent mRNA expression from these genes. A notable example is Gabbr1, which encodes GABBR1, an inhibitory neurotransmitter receptor whose cytoplasmic mRNAs are highly expressed in neurons, moderately expressed in mNPCs, but nearly absent in mESCs (Fig. 6A). By immunoblot, GABBR1 protein is only observed in neurons (Fig. 6C). In the chromatin fraction of mESCs, the Gabbr1 precursor RNA is present at high levels that nearly match those seen in mNPCs and neurons (Fig. 6A). This Gabbr1 RNA is polyadenylated and most introns are excised, but introns 4 and 5, which show a complex pattern of alternative processing in neurons, are largely unprocessed in mESCs (Fig. 6A). Gabbr1 mRNA expression is apparently blocked by a combined process of splicing inhibition and sequestration on chromatin. Upon differentiation into neurons, the chromatin partition index of Gabbr1 RNA shifts from 4.43 to −0.69, as the RNA becomes fully processed and released from chromatin to appear in the cytoplasm as mature mRNA (Fig. 6A). Other protein-coding transcripts, including Gpc2, were found to behave similarly to Gabbr1 with RNA abundant in mESC chromatin but low in cytoplasm. In neurons, this pattern was reversed with the Gpc2 partition index shifting from 4.60 in mESCs to 1.09 in neurons (Supplemental Fig. S6B).
Figure 6.

Chromatin enrichment and PTBP1 regulation of Gabbr1 transcripts. (A) Genome browser tracks of Gabbr1 in mESCs and mCtx neurons. PTBP1 iCLIP tags in mESCs are plotted above in pink. The y-axis indicates the maximum RPM in each cell type. The green box and bracket mark the intron 4–5 region expanded in panel B. PTBP1-responsive exons 5 and 15 are marked with arrowheads. (B) Sashimi plots of the Gabbr1 intron 4–5 region in mESCs, in mCtx neurons, and after Ptbp knockdown in mESCs. RPKM is plotted on the y-axis. PTBP1-responsive exon 5 is marked with an arrowhead. Exons encoding the two sushi domains and the 6-aa linker are marked on the conservation track below. (C) Immunoblot showing expression of GABBR1 protein relative to other proteins in mESCs and cortical neurons.
PTBP1 was previously found to regulate Gabbr1 exon 15 in a neuronal cell line (Makeyev et al. 2007). To assess introns 4 and 5, we examined iCLIP maps of PTBP1 binding in mESCs (Linares et al. 2015), which showed prominent PTBP1 binding peaks in the intron 4–5 region, as well as confirming PTBP1 binding upstream of exon 15 and to the 3′ UTR (Fig. 6A,B). By examining the fractionated RNA-seq data, we found that Ptbp1 knockdown led to processing of the Gabbr1 RNA into the neuronal isoforms, including activation of exon 15 and activation of the exon 5 microexon encoding a 6-amino-acid linker of Gabbr1a (Fig. 6A,B). Some processed Gabbr1 mRNA was present in the cytoplasm after Ptbp1 knockdown, but more of this spliced RNA was in the soluble nuclear fraction. Even after Ptbp1 depletion, a majority of the Gabbr1 RNA was still in the chromatin fraction and still unprocessed in the intron 4–5 region, despite exon 15 being strongly activated for splicing in this fraction (Supplemental Fig. S6C). GABBR1 protein was also not observed in mESCs after Ptbp1 knockdown (Supplemental Fig. S6D). Thus, although PTBP1 strongly affected the processing of Gabbr1, its depletion did not yield the predominantly cytoplasmic RNA seen in neurons. There must be additional factors preventing release of the RNA from chromatin in mESCs. Gabbr1 is highly transcribed in mESCs, but its mRNA expression is blocked by a combination of splicing repression, NMD of transcripts that enter the cytoplasm, and sequestration of the unprocessed RNA on chromatin, with the latter mechanism having the largest effect.
Discussion
A resource for the analysis of RNA-level gene regulation
We developed extensive data sets to examine RNA maturation events across cellular location and developmental state. By applying these data to analyze IR, we compare total and polyadenylated RNA across subcellular fractions and cell types to define classes of introns showing different regulatory behaviors, and we uncover a novel form of gene regulation acting on chromatin-associated RNA. We find that a substantial fraction of the polyadenylated RNA product of some genes is incompletely spliced and still associated with chromatin. This points to a limitation for whole-transcriptome measurements of gene expression that assess total cellular polyadenylated RNA. The RNA being measured in these studies is not all cytoplasmic mRNA. The presence of nuclear polyadenylated RNA may thus contribute to the observed lack of correlation between RNA and protein levels in global gene expression measurements (Edfors et al. 2016; Liu et al. 2016b).
The isolation of chromatin-associated RNA has frequently been used to enrich for nascent pre-mRNAs and other short-lived species (Pandya-Jones and Black 2009; Davidson et al. 2012; Herzel et al. 2017). We find that many introns are only observed in the total RNA of this fraction, whereas others are also present in the polyadenylated RNA. By quantifying this difference, we estimate that 70% of introns within our analysis set are spliced before the RNA has been completely transcribed. Although this roughly agrees with other studies, we believe it is a lower-bound estimate in our system because the criteria for counting cotranscriptionally excised introns required a measurable presence of the intron in the total RNA. In contrast, we find that introns flanking alternatively spliced cassette exons are mostly spliced posttranscriptionally, showing significant IR levels in the polyadenylated RNA. These introns may be spliced more slowly than typical constitutive introns because of the complex regulatory RNP structures that must assemble onto the sequences flanking alternative exons. By creating a pool of unspliced RNA for these genes, the delayed splicing may allow additional controls over the isoform choice. It will be interesting to examine whether the subset of exons whose inclusion is affected by transcription elongation rates and perturbations of RNA Pol II is among the 30% that appear to be cotranscriptionally excised (Herzel and Neugebauer 2015; Naftelberg et al. 2015; Saldi et al. 2016).
Our data provide a rich resource for examining other questions of RNA metabolism and its regulation over development. Besides introns, transient species one could observe in chromatin-associated RNA include upstream antisense RNAs and extended transcripts downstream from polyadenylation sites (Seila et al. 2008; Flynn et al. 2011; Vilborg and Steitz 2017). These data could also allow more sensitive detection of recursive or back-splicing and could inform studies of regulated RNA export. We have also examined regulated miRNA processing using parallel data from short RNA libraries (GSE159971) (Supplemental Table S4; Yeom et al. 2018).
Behaviors of retained introns
To characterize incompletely spliced transcripts, we assessed introns based on their retention levels across fractions and cell types. Unsupervised X-means clustering yielded four intron groups in each cell type. The largest cluster (Group A) were completely spliced in the poly(A)+ RNA, including in the chromatin fraction, and are presumably excised before transcription termination. The smallest cluster (Group D) behaved like classical retained introns in being exported to the cytoplasm within the otherwise fully spliced mRNA. Two intermediate clusters of introns (Groups B and C) were fully spliced in the cytoplasm while showing different levels of retention on chromatin and, to some extent, the nucleoplasm. A DNN trained using a well-defined set of introns and a wide range of genomic features was able to distinguish introns in Group D from those in A or C with high accuracy. Group C introns were also distinguished from Group A with moderate accuracy (Fig. 4B). These data indicate that Groups D and C are functionally distinct and that the features that define them should give clues to their regulation. These features include those previously associated with retained introns, such as weak splice sites, conservation, and coding capacity (Sakabe and de Souza 2007; Jaillon et al. 2008; Braunschweig et al. 2014; Dvinge and Bradley 2015; Mauger et al. 2016; Parra et al. 2018). We found that introns of the different groups were defined by enrichment of particular short sequence motifs in their terminal regions and adjacent exons. We have not yet identified proteins whose binding sites might underlie the enrichment of these motifs. This may be because the recognition elements assigned to individual proteins are not sufficiently specific. Introns also may be regulated by so many different proteins that no single binding motif is strongly predictive. Proteins including PTBP1 and others are known to regulate particular retained introns (Yap et al. 2012; Horan et al. 2015; Pendleton et al. 2017; Frankiw et al. 2019b), but there may be many such factors, each regulating a subset of introns in a group. The extension of our approach to larger data sets will allow correlation of changes in intron group assignment with the expression of particular RNA-binding proteins.
Groups B and C include several previously described sets of interesting retained introns. DIs were defined as partially spliced introns in transcripts affecting growth control, whose excision can be modulated by cellular stimuli (Ninomiya et al. 2011; Boutz et al. 2015; Braun et al. 2017). These DIs are a subset of the Group B and, particularly, Group C introns we defined in mESCs. Another group of retained introns were shown to be regulated by PTB proteins in a neuronal cell line (Yap et al. 2012). Our analytical strategy identified many new PTBP1-dependent introns that remain as chromatin-associated transcripts in mESCs. In the total cellular polyadenylated RNA of mature primary neuronal cultures (Mauger et al. 2016), retained introns were characterized as transient or stable according to their splicing after transcription inhibition. In our data from less mature neurons, we found that the largest portion of transient introns were in Group C (40%). In contrast, of the stable introns that we could assay in our cultures, ∼40% were in Group D (Supplemental Table S8E), consistent with the stable introns remaining in cytoplasmic mRNA after transcriptional shutoff. Mauger et al. (2016) found that similar to DIs, synaptic activation could change the splicing level of some retained introns. It will be interesting to examine whether these introns are associated with chromatin, but this will require improved isolation of nuclei from mature neuronal cultures.
Developmental regulation by splicing inhibition and chromatin sequestration
In previous studies, we showed how the neuronal-specific expression of certain genes is determined by the coupling of a PTBP1-dependent splicing event to NMD. RNAs for the neuronal PTBP2 and DLG4 (also known as PSD-95) proteins are expressed in ESCs and other nonneuronal cells, but through the action of PTBP1 are spliced as isoforms that are subject to NMD (Boutz et al. 2007; Makeyev et al. 2007; Spellman et al. 2007; Zheng et al. 2012; Linares et al. 2015). A similar mechanism affects Gabbr1 through regulation of exon 15 by PTBP1 (Makeyev et al. 2007), but the change in RNA with loss of NMD is small (Hurt et al. 2013). Most protein-coding transcripts showing chromatin enrichment were not seen to be up-regulated by Upf1 depletion, whereas some were modestly affected similar to Gabbr1. The nuclear pools of these RNAs may reduce the observed efficiency of NMD on total RNA levels, where transcripts show only partial depletion by the decay pathway even though near complete loss of protein is observed. Here we uncover another mechanism controlling the developmental-specific expression of a neuronal protein. The Gabbr1 RNA is abundant in mESCs, but its splicing is incomplete, and its transcript remains in the chromatin compartment.
Gabbr1 is expressed as multiple isoforms (Kaupmann et al. 1997). The long Gabbr1a isoform comes from a promoter active in all three cell types studied here. Gabbr1b, which lacks N-terminal sushi domains, arises from an alternative promoter within intron 5 active in neurons (Vigot et al. 2006). There is also a short transcript derived from an alternative polyadenylation site in intron 4. A microexon 5 between these two introns adds a linker into the 1a isoform (Vigot et al. 2006). This complex intron 4–5 region is largely unprocessed in mESCs and becomes processed in neurons with the production of cytoplasmic mRNA including exon 5. The depletion of Ptbp1 from mESCs leads to multiple changes in Gabbr1 splicing, including activation of microexon 5 and downstream exon 15. This leads to some expression of neuronal mRNA isoforms but very limited protein expression. Much of the RNA remains nuclear, indicating that additional factors prevent its mobilization. Instead of regulation at the level of transcription or mRNA stability, incomplete Gabbr1 splicing and sequestration of its RNA on chromatin are modulated to control gene output over development.
The Gabbr1 transcript is extensively bound by PTBP1. Studies have shown that when binding RNA at high stoichiometry, PTBP1 can cause the condensation of RNA/protein liquid droplets in vitro (Lin et al. 2015). Extensive PTBP1 binding to the long noncoding RNA Xist is required for Xist condensation onto the X Chromosome during X inactivation (Pandya-Jones et al. 2020). PTBP1 also drives the condensation of the long noncoding RNA PNCTR in the perinucleolar compartment, and a similar mechanism may be involved in its interaction with LINE RNAs (Attig et al. 2018; Yap et al. 2018). It will be interesting to examine whether PTBP1 might create a nuclear condensate of Gabbr1 RNA. Although Ptbp1 knockdown led to increased splicing and increased mRNA in the nucleoplasm and cytoplasm, it did not eliminate the enrichment of the unspliced RNA in the chromatin. This may be because of the partial depletion of Ptbp1 by RNAi, but it seems likely that other proteins will also contribute to the sequestration of Gabbr1 RNA, as is seen with Xist. If the chromatin enrichment of protein-coding transcripts like Gabbr1 involve similar mechanisms to those controlling lncRNA function, they may also have similar effects on chromatin condensation and gene expression.
Methods
Subcellular fractionation, RNA isolation, and library construction
Total RNA was isolated from mESCs, mNPCs, and mCtx neurons that were fractionated into cytoplasmic, soluble nuclear, and chromatin pellet compartments as described previously (Pandya-Jones and Black 2009; Wuarin and Schibler 1994; Yeom and Damianov 2017; Yeom et al. 2018). After checking RNA quantity and integrity, RNAs >200 nt (long RNA) and <200 nt (short RNA) were separated using RNeasy MinElute cleanup kit (Qiagen). Long RNAs were used for total and poly(A)+ libraries, and short RNAs were used for small RNA library construction. See also the Supplemental Material.
Calculation of chromatin partition indices and biotype analysis
To analyze differential compartmentalization of RNAs, genes were selected that had chromatin expression greater or equal to the median TPM reported by kallisto (2.13 TPM) and had read counts greater than zero in the cytoplasmic fractions as measured by FeatureCount. This returned 13,036 genes for analysis. DESeq2 was used to measure fold change in read counts between the chromatin-associated and the cytoplasmic poly(A)+ RNA by calculating the average read count among replicates of the chromatin fraction divided by the average read counts of the cytoplasmic fraction. The chromatin partition index was defined as the log2 of this ratio (Fig. 1D).
Biotypes were retrieved from Ensembl annotation (V.91). Of the 13,036 genes, 400 genes (3.1%) were analyzed in each of three ranges of the distribution. Partition indices were from −4.2 to −2.6 for region L, −0.1 to 0.1 for region M, and 4.1 to 8.6 for region R.
Measurement of IR
We developed systematic investigation of retained introns (SIRI), a tool to stringently quantify unspliced introns by deep sequencing (https://github.com/Xinglab/siri). In this tool, we first retrieved all introns from Ensembl gene transfer format (GTF) version 91 for the mouse mm10 genome (Hunt et al. 2018). The numbers of reads mapping to each EE, EI, and IE junctions were counted to determine the FI value of each intron. We selected only introns with a unique intron annotation (U introns) that are not involved in other alternative processing events (Supplemental Fig. S4B). Introns subjected to FI measurement were also required have an intron length ≥60 and have a sum of EE + EI + IE reads be ≥20 (Supplemental Table S6). From this set, IR events with EE reads no fewer than two in at least one cell compartment in one cell type were then kept for downstream analysis.
X-means clustering of IR events
X-means clustering was performed using the PyClustering tool (Novikov 2019) applied to the FI values determined in all three compartments of each cell type (Fig. 3A), with the maximum number of clusters set at six. The distance matrix for X-means clustering is based on the dynamic time warping (DTW) algorithm (Berndt and Clifford 1994) for the purpose of investigating directional changes of FI values from chromatin to nucleoplasm to cytoplasm. The Circos plot (Krzywinski et al. 2009) showing the intron group changes from one cell type to another cell type was produced using R (R Core Team 2020) package circlize (version 0.4.4) (Fig. 5A; Gu et al. 2014).
Predicting IR patterns by deep learning
To apply deep learning to IR group prediction, we constructed a compendium of 1387 intron features of five types: sequence motifs, transcript features, RNA secondary structure, nucleosome positioning, and conservation (Supplemental Table S9). Sequence motif features included splice site consensus sequences, position-specific matrices of RNA-binding proteins, and dinucleotide and trinucleotide frequencies of introns and flanking exons. Transcript features included the lengths of upstream exon (E1), downstream exon (E2), and intron (I) and intron number in the host gene. The translatability of E1, E2, E1 + E2, I and E1 + I + E2 were defined by confirming the absence of a stop codon in one of the three reading frames. To predict RNA secondary structure, RNA sequences from the regions from −20 to +20 nt relative to each splice site were examined. Sequence intervals from 1–70 nt, 70–140 nt, 140–210 nt from the 5′ portion of the intron and from −210 to −140 nt, −140 to −70 nt, and −70 to −1 nt from the 3′ portion of the intron were also examined. We computed the free energy of folding for each region with RNAfold (2.2.10) (Kerpedjiev et al. 2015) and used the free energy of unfolding for each region as features for the deep learning. The nucleosome positioning was predicted by NuPoP (version 1.0, set to the mouse model) (Xi et al. 2010) on the last 50 nt of the upstream exon, the first 100 nt of 5′ intron region, the last 100 nt of 3′ intron region, and the first 50 nt of downstream exon. The training data set included introns that had grouping information in at least two cell types and excluded U11/U12 introns and other introns lacking GT or AG splice sites. We trained a DNN (LeCun et al. 2015) with these 1387 features to predict whether introns belong to Group A, B, C, and D for each cell type (Fig. 3A). The training was performed with fivefold cross-validation with area under the ROC curves on data held-out during training reported for performance evaluation (Pounraja et al. 2019). To evaluate the strengths of individual features, we assessed the decrease of AUC on held-out data when the values of each feature were substituted by its median.
Data access
All raw and processed sequencing data generated in this study have been submitted to the NCBI Gene Expression Omnibus (GEO; https://www.ncbi.nlm.nih.gov/geo/) under accession numbers GSE159944 for total RNA, GSE159919 for poly(A)+ RNA, GSE159971 for small RNA, and GSE159993 for poly(A)+ RNA in Ptbp knockdown experiments in Figures 5 and 6. Links to the data displayed on the UCSC Genome Browser are as follows: https://genome.ucsc.edu/s/Chiaho/Kay_fraction_total_hub_10202020 for total RNA and https://genome.ucsc.edu/s/Chiaho/Kay_fraction_polyA%2B_hub_10202020 for poly(A)+ RNA. The source code of data analysis is available at GitHub (https://github.com/Xinglab/intron-retentionpaper), as well as in Supplemental Code files. The data resources used to reproduce the analysis are available at Zenodo (https://zenodo.org/record/4540589#.YJVgEC1h2v4).
Supplementary Material
Acknowledgments
We thank Grigori Enikolopov (Cold Spring Harbor Laboratory) for the Nestin-GFP mouse line and Celine Vuong, Amy Pandya-Jones, Kathrin Plath, and members of the Black laboratory for help, discussions, and comments on the manuscript. Financial support was provided by W.M. Keck Foundation and National Institutes of Health (NIH) R01 MH109166 grants to D.L.B. and Y.X., NIH R01 GM088342 to Y.X., and R35 GM136426, R01 GM049662, and funding from the David Geffen School of Medicine and Division of Life Sciences at UCLA to D.L.B. K.-H.Y. received a postdoctoral fellowship from the Eli and Edythe Broad Center of Regenerative Medicine and Stem Cell Research at UCLA. H.Y.L. was supported by Whitcome Warsaw Family fellowships from UCLA.
Author contributions: K-H.Y., Z.P., Y.X., and D.L.B. conceived and designed the study. K-H.Y. performed all the experiments and generated the RNA-seq data, except the Ptbp knockdown experiments and microscopy, which were performed by H.Y.L. and W.X. Z.P., C-H.L., and K-H.Y. processed and analyzed the sequence data. Z.P. defined the unique intron set and carried out the clustering and the deep learning analyses. K-H.Y. and D.L.B. wrote the manuscript with input from Z.P. and Y.X. D.L.B. and Y.X. supervised the project and provided funding.
Footnotes
[Supplemental material is available for this article.]
Article published online before print. Article, supplemental material, and publication date are at https://www.genome.org/cgi/doi/10.1101/gr.273904.120.
Competing interest statement
The authors declare no competing interests.
References
- Ameur A, Zaghlool A, Halvardson J, Wetterbom A, Gyllensten U, Cavelier L, Feuk L. 2011. Total RNA sequencing reveals nascent transcription and widespread co-transcriptional splicing in the human brain. Nat Struct Mol Biol 18: 1435–1440. 10.1038/nsmb.2143 [DOI] [PubMed] [Google Scholar]
- Anders S, Huber W. 2010. Differential expression analysis for sequence count data. Genome Biol 11: R106. 10.1186/gb-2010-11-10-r106 [DOI] [PMC free article] [PubMed] [Google Scholar]
- Attig J, Agostini F, Gooding C, Chakrabarti AM, Singh A, Haberman N, Zagalak JA, Emmett W, Smith CWJ, Luscombe NM, et al. 2018. Heteromeric RNP assembly at LINEs controls lineage-specific RNA processing. Cell 174: 1067–1081.e17. 10.1016/j.cell.2018.07.001 [DOI] [PMC free article] [PubMed] [Google Scholar]
- Berndt DJ, Clifford J. 1994. Using dynamic time warping to find patterns in time series. In Proceedings of the 3rd International Conference on Knowledge Discovery and Data Mining, AAAIWS'94, pp. 359–370. AAAI Press, Seattle. [Google Scholar]
- Bhatt DM, Pandya-Jones A, Tong A-J, Barozzi I, Lissner MM, Natoli G, Black DL, Smale ST. 2012. Transcript dynamics of proinflammatory genes revealed by sequence analysis of subcellular RNA fractions. Cell 150: 279–290. 10.1016/j.cell.2012.05.043 [DOI] [PMC free article] [PubMed] [Google Scholar]
- Boutz PL, Stoilov P, Li Q, Lin C-H, Chawla G, Ostrow K, Shiue L, Ares M, Black DL. 2007. A post-transcriptional regulatory switch in polypyrimidine tract-binding proteins reprograms alternative splicing in developing neurons. Genes Dev 21: 1636–1652. 10.1101/gad.1558107 [DOI] [PMC free article] [PubMed] [Google Scholar]
- Boutz PL, Bhutkar A, Sharp PA. 2015. Detained introns are a novel, widespread class of post-transcriptionally spliced introns. Genes Dev 29: 63–80. 10.1101/gad.247361.114 [DOI] [PMC free article] [PubMed] [Google Scholar]
- Braun CJ, Stanciu M, Boutz PL, Patterson JC, Calligaris D, Higuchi F, Neupane R, Fenoglio S, Cahill DP, Wakimoto H, et al. 2017. Coordinated splicing of regulatory detained introns within oncogenic transcripts creates an exploitable vulnerability in malignant glioma. Cancer Cell 32: 411–426.e11. 10.1016/j.ccell.2017.08.018 [DOI] [PMC free article] [PubMed] [Google Scholar]
- Braunschweig U, Barbosa-Morais NL, Pan Q, Nachman EN, Alipanahi B, Gonatopoulos-Pournatzis T, Frey B, Irimia M, Blencowe BJ. 2014. Widespread intron retention in mammals functionally tunes transcriptomes. Genome Res 24: 1774–1786. 10.1101/gr.177790.114 [DOI] [PMC free article] [PubMed] [Google Scholar]
- Bray NL, Pimentel H, Melsted P, Pachter L. 2016. Near-optimal probabilistic RNA-seq quantification. Nat Biotechnol 34: 525–527. 10.1038/nbt.3519 [DOI] [PubMed] [Google Scholar]
- Brockdorff N, McCabe M, Norris P, Cooper J, Swift S, Kay F. 1992. The product of the mouse Xist gene is a 15 kb inactive X-specific transcript containing no conserved ORF and located in the nucleus. Cell 71: 515–526. 10.1016/0092-8674(92)90519-i [DOI] [PubMed] [Google Scholar]
- Broseus L, Ritchie W. 2020. Challenges in detecting and quantifying intron retention from next generation sequencing data. Comput Struct Biotechnol J 18: 501–508. 10.1016/j.csbj.2020.02.010 [DOI] [PMC free article] [PubMed] [Google Scholar]
- Coulon A, Ferguson ML, de Turris V, Palangat M, Chow CC, Larson DR. 2014. Kinetic competition during the transcription cycle results in stochastic RNA processing. eLife 3: e03939. 10.7554/eLife.03939 [DOI] [PMC free article] [PubMed] [Google Scholar]
- Davidson L, Kerr A, West S. 2012. Co-transcriptional degradation of aberrant pre-mRNA by Xrn2. EMBO J 31: 2566–2578. 10.1038/emboj.2012.101 [DOI] [PMC free article] [PubMed] [Google Scholar]
- Duff MO, Olson S, Wei X, Garrett SC, Osman A, Bolisetty M, Plocik A, Celniker SE, Graveley BR. 2015. Genome-wide identification of zero nucleotide recursive splicing in Drosophila. Nature 521: 376–379. 10.1038/nature14475 [DOI] [PMC free article] [PubMed] [Google Scholar]
- Dvinge H, Bradley RK. 2015. Widespread intron retention diversifies most cancer transcriptomes. Genome Med 7: 45. 10.1186/s13073-015-0168-9 [DOI] [PMC free article] [PubMed] [Google Scholar]
- Edfors F, Danielsson F, Hallström BM, Käll L, Lundberg E, Pontén F, Forsström B, Uhlén M. 2016. Gene-specific correlation of RNA and protein levels in human cells and tissues. Mol Syst Biol 12: 883. 10.15252/msb.20167144 [DOI] [PMC free article] [PubMed] [Google Scholar]
- Edwards CR, Ritchie W, Wong JJ-L, Schmitz U, Middleton R, An X, Mohandas N, Rasko JEJ, Blobel GA. 2016. A dynamic intron retention program in the mammalian megakaryocyte and erythrocyte lineages. Blood 127: e24–e34. 10.1182/blood-2016-01-692764 [DOI] [PMC free article] [PubMed] [Google Scholar]
- Fei J, Jadaliha M, Harmon TS, Li ITS, Hua B, Hao Q, Holehouse AS, Reyer M, Sun Q, Freier SM, et al. 2017. Quantitative analysis of multilayer organization of proteins and RNA in nuclear speckles at super resolution. J Cell Sci 130: 4180–4192. 10.1242/jcs.206854 [DOI] [PMC free article] [PubMed] [Google Scholar]
- Flynn RA, Almada AE, Zamudio JR, Sharp PA. 2011. Antisense RNA polymerase II divergent transcripts are P-TEFb dependent and substrates for the RNA exosome. Proc Natl Acad Sci 108: 10460–10465. 10.1073/pnas.1106630108 [DOI] [PMC free article] [PubMed] [Google Scholar]
- Frankiw L, Baltimore D, Li G. 2019a. Alternative mRNA splicing in cancer immunotherapy. Nat Rev Immunol 19: 675–687. 10.1038/s41577-019-0195-7 [DOI] [PubMed] [Google Scholar]
- Frankiw L, Majumdar D, Burns C, Vlach L, Moradian A, Sweredoski MJ, Baltimore D. 2019b. BUD13 promotes a type I interferon response by countering intron retention in Irf7. Mol Cell 73: 803–814.e6. 10.1016/j.molcel.2018.11.038 [DOI] [PubMed] [Google Scholar]
- Garland W, Jensen TH. 2020. Nuclear sorting of RNA. WIREs RNA 11: e1572. 10.1002/wrna.1572 [DOI] [PubMed] [Google Scholar]
- Girard C, Will CL, Peng J, Makarov EM, Kastner B, Lemm I, Urlaub H, Hartmuth K, Lührmann R. 2012. Post-transcriptional spliceosomes are retained in nuclear speckles until splicing completion. Nat Commun 3: 994. 10.1038/ncomms1998 [DOI] [PubMed] [Google Scholar]
- Gu Z, Gu L, Eils R, Schlesner M, Brors B. 2014. circlize implements and enhances circular visualization in R. Bioinformatics 30: 2811–2812. 10.1093/bioinformatics/btu393 [DOI] [PubMed] [Google Scholar]
- Hao S, Baltimore D. 2013. RNA splicing regulates the temporal order of TNF-induced gene expression. Proc Natl Acad Sci 110: 11934–11939. 10.1073/pnas.1309990110 [DOI] [PMC free article] [PubMed] [Google Scholar]
- Hautbergue GM. 2017. RNA nuclear export: from neurological disorders to cancer. Adv Exp Med Biol 1007: 89–109. 10.1007/978-3-319-60733-7_6 [DOI] [PubMed] [Google Scholar]
- Herzel L, Neugebauer KM. 2015. Quantification of co-transcriptional splicing from RNA-Seq data. Methods 85: 36–43. 10.1016/j.ymeth.2015.04.024 [DOI] [PubMed] [Google Scholar]
- Herzel L, Ottoz DSM, Alpert T, Neugebauer KM. 2017. Splicing and transcription touch base: co-transcriptional spliceosome assembly and function. Nat Rev Mol Cell Biol 18: 637–650. 10.1038/nrm.2017.63 [DOI] [PMC free article] [PubMed] [Google Scholar]
- Horan L, Yasuhara JC, Kohlstaedt LA, Rio DC. 2015. Biochemical identification of new proteins involved in splicing repression at the Drosophila P-element exonic splicing silencer. Genes Dev 29: 2298–2311. 10.1101/gad.268847.115 [DOI] [PMC free article] [PubMed] [Google Scholar]
- Hunt SE, McLaren W, Gil L, Thormann A, Schuilenburg H, Sheppard D, Parton A, Armean IM, Trevanion SJ, Flicek P, et al. 2018. Ensembl variation resources. Database (Oxford) 2018: bay119. 10.1093/database/bay119 [DOI] [PMC free article] [PubMed] [Google Scholar]
- Hurt JA, Robertson AD, Burge CB. 2013. Global analyses of UPF1 binding and function reveal expanded scope of nonsense-mediated mRNA decay. Genome Res 23: 1636–1650. 10.1101/gr.157354.113 [DOI] [PMC free article] [PubMed] [Google Scholar]
- Hutchinson JN, Ensminger AW, Clemson CM, Lynch CR, Lawrence JB, Chess A. 2007. A screen for nuclear transcripts identifies two linked noncoding RNAs associated with SC35 splicing domains. BMC Genomics 8: 39. 10.1186/1471-2164-8-39 [DOI] [PMC free article] [PubMed] [Google Scholar]
- Jacob AG, Smith CWJ. 2017. Intron retention as a component of regulated gene expression programs. Hum Genet 136: 1043–1057. 10.1007/s00439-017-1791-x [DOI] [PMC free article] [PubMed] [Google Scholar]
- Jaillon O, Bouhouche K, Gout J-F, Aury J-M, Noel B, Saudemont B, Nowacki M, Serrano V, Porcel BM, Ségurens B, et al. 2008. Translational control of intron splicing in eukaryotes. Nature 451: 359–362. 10.1038/nature06495 [DOI] [PubMed] [Google Scholar]
- Kaupmann K, Huggel K, Heid J, Flor PJ, Bischoff S, Mickel SJ, McMaster G, Angst C, Bittiger H, Froestl W, et al. 1997. Expression cloning of GABAB receptors uncovers similarity to metabotropic glutamate receptors. Nature 386: 239–246. 10.1038/386239a0 [DOI] [PubMed] [Google Scholar]
- Keppetipola N, Sharma S, Li Q, Black DL. 2012. Neuronal regulation of pre-mRNA splicing by polypyrimidine tract binding proteins, PTBP1 and PTBP2. Crit Rev Biochem Mol Biol 47: 360–378. 10.3109/10409238.2012.691456 [DOI] [PMC free article] [PubMed] [Google Scholar]
- Kerpedjiev P, Hammer S, Hofacker IL. 2015. Forna (force-directed RNA): simple and effective online RNA secondary structure diagrams. Bioinformatics 31: 3377–3379. 10.1093/bioinformatics/btv372 [DOI] [PMC free article] [PubMed] [Google Scholar]
- Khodor YL, Menet JS, Tolan M, Rosbash M. 2012. Cotranscriptional splicing efficiency differs dramatically between Drosophila and mouse. RNA 18: 2174–2186. 10.1261/rna.034090.112 [DOI] [PMC free article] [PubMed] [Google Scholar]
- Krzywinski M, Schein J, Birol İ, Connors J, Gascoyne R, Horsman D, Jones SJ, Marra MA. 2009. Circos: an information aesthetic for comparative genomics. Genome Res 19: 1639–1645. 10.1101/gr.092759.109 [DOI] [PMC free article] [PubMed] [Google Scholar]
- LeCun Y, Bengio Y, Hinton G. 2015. Deep learning. Nature 521: 436–444. 10.1038/nature14539 [DOI] [PubMed] [Google Scholar]
- Li Y, Bor Y-C, Misawa Y, Xue Y, Rekosh D, Hammarskjöld M-L. 2006. An intron with a constitutive transport element is retained in a Tap messenger RNA. Nature 443: 234–237. 10.1038/nature05107 [DOI] [PubMed] [Google Scholar]
- Lin Y, Protter DSW, Rosen MK, Parker R. 2015. Formation and maturation of phase-separated liquid droplets by RNA-binding proteins. Mol Cell 60: 208–219. 10.1016/j.molcel.2015.08.018 [DOI] [PMC free article] [PubMed] [Google Scholar]
- Linares AJ, Lin C-H, Damianov A, Adams KL, Novitch BG, Black DL. 2015. The splicing regulator PTBP1 controls the activity of the transcription factor Pbx1 during neuronal differentiation. eLife 4: e09268. 10.7554/eLife.09268 [DOI] [PMC free article] [PubMed] [Google Scholar]
- Liu H, Liang C, Kollipara RK, Matsui M, Ke X, Jeong B-C, Wang Z, Yoo KS, Yadav GP, Kinch LN, et al. 2016a. HP1BP3, a chromatin retention factor for co-transcriptional microRNA processing. Mol Cell 63: 420–432. 10.1016/j.molcel.2016.06.014 [DOI] [PMC free article] [PubMed] [Google Scholar]
- Liu Y, Beyer A, Aebersold R. 2016b. On the dependency of cellular protein levels on mRNA abundance. Cell 165: 535–550. 10.1016/j.cell.2016.03.014 [DOI] [PubMed] [Google Scholar]
- Makeyev EV, Zhang J, Carrasco MA, Maniatis T. 2007. The microRNA miR-124 promotes neuronal differentiation by triggering brain-specific alternative pre-mRNA splicing. Mol Cell 27: 435–448. 10.1016/j.molcel.2007.07.015 [DOI] [PMC free article] [PubMed] [Google Scholar]
- Mauger O, Lemoine F, Scheiffele P. 2016. Targeted intron retention and excision for rapid gene regulation in response to neuronal activity. Neuron 92: 1266–1278. 10.1016/j.neuron.2016.11.032 [DOI] [PubMed] [Google Scholar]
- Naftelberg S, Schor IE, Ast G, Kornblihtt AR. 2015. Regulation of alternative splicing through coupling with transcription and chromatin structure. Annu Rev Biochem 84: 165–198. 10.1146/annurev-biochem-060614-034242 [DOI] [PubMed] [Google Scholar]
- Naganuma T, Nakagawa S, Tanigawa A, Sasaki YF, Goshima N, Hirose T. 2012. Alternative 3′-end processing of long noncoding RNA initiates construction of nuclear paraspeckles. EMBO J 31: 4020–4034. 10.1038/emboj.2012.251 [DOI] [PMC free article] [PubMed] [Google Scholar]
- Naro C, Jolly A, Di Persio S, Bielli P, Setterblad N, Alberdi AJ, Vicini E, Geremia R, De la Grange P, Sette C. 2017. An orchestrated intron retention program in meiosis controls timely usage of transcripts during germ cell differentiation. Dev Cell 41: 82–93.e4. 10.1016/j.devcel.2017.03.003 [DOI] [PMC free article] [PubMed] [Google Scholar]
- Ninomiya K, Kataoka N, Hagiwara M. 2011. Stress-responsive maturation of Clk1/4 pre-mRNAs promotes phosphorylation of SR splicing factor. J Cell Biol 195: 27–40. 10.1083/jcb.201107093 [DOI] [PMC free article] [PubMed] [Google Scholar]
- Novikov AV. 2019. PyClustering: data mining library. J Open Source Softw 4: 1230. 10.21105/joss.01230 [DOI] [Google Scholar]
- Pandya-Jones A, Black DL. 2009. Co-transcriptional splicing of constitutive and alternative exons. RNA 15: 1896–1908. 10.1261/rna.1714509 [DOI] [PMC free article] [PubMed] [Google Scholar]
- Pandya-Jones A, Bhatt DM, Lin C-H, Tong A-J, Smale ST, Black DL. 2013. Splicing kinetics and transcript release from the chromatin compartment limit the rate of lipid A-induced gene expression. RNA 19: 811–827. 10.1261/rna.039081.113 [DOI] [PMC free article] [PubMed] [Google Scholar]
- Pandya-Jones A, Markaki Y, Serizay J, Chitiashvili T, Mancia Leon WR, Damianov A, Chronis C, Papp B, Chen C-K, McKee R, et al. 2020. A protein assembly mediates Xist localization and gene silencing. Nature 587: 145–151. 10.1038/s41586-020-2703-0 [DOI] [PMC free article] [PubMed] [Google Scholar]
- Parra M, Booth BW, Weiszmann R, Yee B, Yeo GW, Brown JB, Celniker SE, Conboy JG. 2018. An important class of intron retention events in human erythroblasts is regulated by cryptic exons proposed to function as splicing decoys. RNA 24: 1255–1265. 10.1261/rna.066951.118 [DOI] [PMC free article] [PubMed] [Google Scholar]
- Pawlicki JM, Steitz JA. 2008. Primary microRNA transcript retention at sites of transcription leads to enhanced microRNA production. J Cell Biol 182: 61–76. 10.1083/jcb.200803111 [DOI] [PMC free article] [PubMed] [Google Scholar]
- Pelleg D, Moore A. 2000. X-means: extended K-means with efficient estimation of the number of clusters. In 17th International Conference on Machine Learning, Stanford, CA, pp. 727–734. Morgan Kaufmann, Stanford, CA. [Google Scholar]
- Pendleton KE, Chen B, Liu K, Hunter OV, Xie Y, Tu BP, Conrad NK. 2017. The U6 snRNA m6A methyltransferase METTL16 regulates SAM synthetase intron retention. Cell 169: 824–835.e14. 10.1016/j.cell.2017.05.003 [DOI] [PMC free article] [PubMed] [Google Scholar]
- Pimentel H, Parra M, Gee SL, Mohandas N, Pachter L, Conboy JG. 2016. A dynamic intron retention program enriched in RNA processing genes regulates gene expression during terminal erythropoiesis. Nucleic Acids Res 44: 838–851. 10.1093/nar/gkv1168 [DOI] [PMC free article] [PubMed] [Google Scholar]
- Popp MW-L, Maquat LE. 2013. Organizing principles of mammalian nonsense-mediated mRNA decay. Annu Rev Genet 47: 139–165. 10.1146/annurev-genet-111212-133424 [DOI] [PMC free article] [PubMed] [Google Scholar]
- Pounraja VK, Jayakar G, Jensen M, Kelkar N, Girirajan S. 2019. A machine-learning approach for accurate detection of copy-number variants from exome sequencing. Genome Res 29: 1134–1143. 10.1101/gr.245928.118 [DOI] [PMC free article] [PubMed] [Google Scholar]
- Quinn JJ, Chang HY. 2016. Unique features of long non-coding RNA biogenesis and function. Nat Rev Genet 17: 47–62. 10.1038/nrg.2015.10 [DOI] [PubMed] [Google Scholar]
- R Core Team. 2020. R: a language and environment for statistical computing. R Foundation for Statistical Computing, Vienna. https://www.R-project.org/. [Google Scholar]
- Sakabe NJ, de Souza SJ. 2007. Sequence features responsible for intron retention in human. BMC Genomics 8: 59. 10.1186/1471-2164-8-59 [DOI] [PMC free article] [PubMed] [Google Scholar]
- Saldi T, Cortazar MA, Sheridan RM, Bentley DL. 2016. Coupling of RNA polymerase II transcription elongation with pre-mRNA splicing. J Mol Biol 428: 2623–2635. 10.1016/j.jmb.2016.04.017 [DOI] [PMC free article] [PubMed] [Google Scholar]
- Schmid M, Jensen TH. 2018. Controlling nuclear RNA levels. Nat Rev Genet 19: 518–529. 10.1038/s41576-018-0013-2 [DOI] [PubMed] [Google Scholar]
- Schmitz U, Pinello N, Jia F, Alasmari S, Ritchie W, Keightley M-C, Shini S, Lieschke GJ, Wong JJ-L, Rasko JEJ. 2017. Intron retention enhances gene regulatory complexity in vertebrates. Genome Biol 18: 216. 10.1186/s13059-017-1339-3 [DOI] [PMC free article] [PubMed] [Google Scholar]
- Seila AC, Calabrese JM, Levine SS, Yeo GW, Rahl PB, Flynn RA, Young RA, Sharp PA. 2008. Divergent transcription from active promoters. Science 322: 1849–1851. 10.1126/science.1162253 [DOI] [PMC free article] [PubMed] [Google Scholar]
- Sibley CR, Emmett W, Blazquez L, Faro A, Haberman N, Briese M, Trabzuni D, Ryten M, Weale ME, Hardy J, et al. 2015. Recursive splicing in long vertebrate genes. Nature 521: 371–375. 10.1038/nature14466 [DOI] [PMC free article] [PubMed] [Google Scholar]
- Spellman R, Llorian M, Smith CWJ. 2007. Crossregulation and functional redundancy between the splicing regulator PTB and its paralogs nPTB and ROD1. Mol Cell 27: 420–434. 10.1016/j.molcel.2007.06.016 [DOI] [PMC free article] [PubMed] [Google Scholar]
- Stewart M. 2019. Polyadenylation and nuclear export of mRNAs. J Biol Chem 294: 2977–2987. 10.1074/jbc.REV118.005594 [DOI] [PMC free article] [PubMed] [Google Scholar]
- Tilgner H, Knowles DG, Johnson R, Davis CA, Chakrabortty S, Djebali S, Curado J, Snyder M, Gingeras TR, Guigó R. 2012. Deep sequencing of subcellular RNA fractions shows splicing to be predominantly co-transcriptional in the human genome but inefficient for lncRNAs. Genome Res 22: 1616–1625. 10.1101/gr.134445.111 [DOI] [PMC free article] [PubMed] [Google Scholar]
- Vargas DY, Shah K, Batish M, Levandoski M, Sinha S, Marras SAE, Schedl P, Tyagi S. 2011. Single-molecule imaging of transcriptionally coupled and uncoupled splicing. Cell 147: 1054–1065. 10.1016/j.cell.2011.10.024 [DOI] [PMC free article] [PubMed] [Google Scholar]
- Vigot R, Barbieri S, Bräuner-Osborne H, Turecek R, Shigemoto R, Zhang Y-P, Luján R, Jacobson LH, Biermann B, Fritschy J-M, et al. 2006. Differential compartmentalization and distinct functions of GABAB receptor variants. Neuron 50: 589–601. 10.1016/j.neuron.2006.04.014 [DOI] [PMC free article] [PubMed] [Google Scholar]
- Vilborg A, Steitz JA. 2017. Readthrough transcription: how are DoGs made and what do they do? RNA Biol 14: 632–636. 10.1080/15476286.2016.1149680 [DOI] [PMC free article] [PubMed] [Google Scholar]
- Vuong CK, Black DL, Zheng S. 2016. The neurogenetics of alternative splicing. Nat Rev Neurosci 17: 265–281. 10.1038/nrn.2016.27 [DOI] [PMC free article] [PubMed] [Google Scholar]
- Wang Q, Rio DC. 2018. JUM is a computational method for comprehensive annotation-free analysis of alternative pre-mRNA splicing patterns. Proc Natl Acad Sci 115: E8181–E8190. 10.1073/pnas.1806018115 [DOI] [PMC free article] [PubMed] [Google Scholar]
- Wegener M, Müller-McNicoll M. 2018. Nuclear retention of mRNAs: quality control, gene regulation and human disease. Semin Cell Dev Biol 79: 131–142. 10.1016/j.semcdb.2017.11.001 [DOI] [PubMed] [Google Scholar]
- Windhager L, Bonfert T, Burger K, Ruzsics Z, Krebs S, Kaufmann S, Malterer G, L'Hernault A, Schilhabel M, Schreiber S, et al. 2012. Ultrashort and progressive 4sU-tagging reveals key characteristics of RNA processing at nucleotide resolution. Genome Res 22: 2031–2042. 10.1101/gr.131847.111 [DOI] [PMC free article] [PubMed] [Google Scholar]
- Wong JJ-L, Ritchie W, Ebner OA, Selbach M, Wong JWH, Huang Y, Gao D, Pinello N, Gonzalez M, Baidya K, et al. 2013. Orchestrated intron retention regulates normal granulocyte differentiation. Cell 154: 583–595. 10.1016/j.cell.2013.06.052 [DOI] [PubMed] [Google Scholar]
- Wuarin J, Schibler U. 1994. Physical isolation of nascent RNA chains transcribed by RNA polymerase II: evidence for cotranscriptional splicing. Mol Cell Biol 14: 7219–7225. 10.1128/MCB.14.11.7219 [DOI] [PMC free article] [PubMed] [Google Scholar]
- Xi L, Fondufe-Mittendorf Y, Xia L, Flatow J, Widom J, Wang J-P. 2010. Predicting nucleosome positioning using a duration hidden Markov model. BMC Bioinformatics 11: 346. 10.1186/1471-2105-11-346 [DOI] [PMC free article] [PubMed] [Google Scholar]
- Yap K, Lim ZQ, Khandelia P, Friedman B, Makeyev EV. 2012. Coordinated regulation of neuronal mRNA steady-state levels through developmentally controlled intron retention. Genes Dev 26: 1209–1223. 10.1101/gad.188037.112 [DOI] [PMC free article] [PubMed] [Google Scholar]
- Yap K, Mukhina S, Zhang G, Tan JSC, Ong HS, Makeyev EV. 2018. A short tandem repeat-enriched RNA assembles a nuclear compartment to control alternative splicing and promote cell survival. Mol Cell 72: 525–540.e13. 10.1016/j.molcel.2018.08.041 [DOI] [PMC free article] [PubMed] [Google Scholar]
- Yeom K-H, Damianov A. 2017. Methods for extraction of RNA, proteins, or protein complexes from subcellular compartments of eukaryotic cells. Methods Mol Biol 72: 155–167. 10.1007/978-1-4939-7204-3_12 [DOI] [PubMed] [Google Scholar]
- Yeom K-H, Mitchell S, Linares AJ, Zheng S, Lin C-H, Wang X-J, Hoffmann A, Black DL. 2018. Polypyrimidine tract-binding protein blocks miRNA-124 biogenesis to enforce its neuronal-specific expression in the mouse. Proc Natl Acad Sci 115: E11061–E11070. 10.1073/pnas.1809609115 [DOI] [PMC free article] [PubMed] [Google Scholar]
- Zheng S, Gray EE, Chawla G, Porse BT, O'Dell TJ, Black DL. 2012. PSD-95 is post-transcriptionally repressed during early neural development by PTBP1 and PTBP2. Nat Neurosci 15: 381–388. 10.1038/nn.3026 [DOI] [PMC free article] [PubMed] [Google Scholar]
Associated Data
This section collects any data citations, data availability statements, or supplementary materials included in this article.