

Abstract
There is growing concern about the health of older US adults who live in rural areas, but little is known about how mortality has changed over time for low-income Medicare beneficiaries residing in rural areas compared with their urban counterparts. We evaluated whether all-cause mortality rates changed for rural and urban low-income Medicare beneficiaries dually enrolled in Medicaid, and we studied disparities between these groups. The study cohort included 11,737,006 unique dually enrolled Medicare beneficiaries. Between 2004 and 2017 all-cause mortality declined from 96.6 to 92.7 per 1,000 rural beneficiaries (relative percentage change: −4.0 percent). Among urban beneficiaries, declines in mortality were more pronounced (from 86.9 to 72.8 per 1,000 beneficiaries, a relative percentage change of −16.2 percent). The gap in mortality between rural and urban beneficiaries increased over time. Rural mortality rates were highest in East North central states and increased modestly in West North central states during the study period. Public health and policy efforts are urgently needed to improve the health of low-income older adults living in rural areas.
Significant health disparities exist between Medicare beneficiaries residing in rural areas of the US and their urban counterparts.1 Rural beneficiaries often face numerous challenges that influence their health, including poverty; unreliable access to health care services; and, more recently, hospital closures.2–4 Given these concerning patterns, policy and public health efforts to improve the health of rural beneficiaries have intensified in recent years.5
One group of people at particularly high risk for poor health outcomes is low-income Medicare beneficiaries who are dually enrolled in Medicaid.6 They represent the poorest and sickest subset of the Medicare population, with a high burden of chronic illnesses, comorbidities, and social needs.7,8 However, little is known about the health outcomes of dually enrolled beneficiaries living in rural areas. Although recent policy and public health initiatives have focused on improving the health of low-income people, these efforts have primarily concentrated on urban areas.9,10 As a result, it is possible that rural beneficiaries have not benefited equally from these initiatives and that disparities between rural and urban dually enrolled beneficiaries have widened over time.9,11–14 Understanding how health outcomes have changed for this low-income population in rural areas compared with those in urban areas is critical for public health and policy efforts to reduce health inequities.
Therefore, in this study we aimed to answer the following key questions. First, did all-cause mortality rates differ between Medicare (fee-for-service and Medicare Advantage) beneficiaries older than age sixty-five who were dually enrolled in Medicaid in rural versus urban areas? Second, how did mortality change among rural and urban dually enrolled beneficiaries from 2004 to 2017, and did the difference in mortality between these groups decrease over time? Third, is there geographic variation in mortality among rural dually enrolled beneficiaries, and, if so, have these patterns changed over time?
Study Data And Methods
Institutional Review Board approval, including waiver of the requirement of participant informed consent, was provided by Beth Israel Deaconess Medical Center.
STUDY POPULATION
Medicare Master Beneficiary Summary Files were used to identify beneficiaries older than age sixty-five who were enrolled in Medicare for at least twelve months between 2004 and 2017. We included people enrolled in fee-for-service or Medicare Advantage. Medicare beneficiaries were considered dually enrolled if they were also concurrently enrolled in Medicaid for at least one month within a given year. To identify whether Medicare beneficiaries lived in a rural or urban area, we crosswalked each beneficiary’s ZIP code of residence with the 2010 rural-urban commuting area codes from US census tract data.15 Census tracts are subdivisions of counties; because the rural-urban commuting area is linked to census tracts, it provides a more granular assessment of the rurality of a beneficiary’s place of residence than county-level data. This also allows for more reliable longitudinal comparisons of populations within these census tracts.16 We used rural-urban commuting area codes to define areas as urban (rural-urban commuting area 1–3) or rural (rural-urban commuting area 4–10), consistent with prior studies17–20 (see online appendix exhibit 1).21 The final study cohort is shown in appendix exhibit 2.21
OUTCOMES
The primary outcome was annual all-cause mortality rates among rural and urban dually enrolled Medicare beneficiaries.
STATISTICAL ANALYSIS
Continuous variables were summarized with means and standard deviations; categorical variables were summarized with frequencies and percentages. Patient demographics (age, sex, and race/ethnicity), insurance type (fee-for-service or Medicare Advantage), and geographical region were characterized for beneficiaries residing in rural and urban areas.
Observed annual all-cause mortality rates for rural dually enrolled beneficiaries per 1,000 rural dually enrolled beneficiaries and for urban dually enrolled beneficiaries per 1,000 urban dually enrolled beneficiaries were calculated for each year. We then calculated annual all-cause mortality rates after standardization for age (five-year intervals) and sex to account for differences in demographics between rural and urban beneficiaries and for changes over time (using 2004 as a reference year). To examine whether demographics-standardized all-cause mortality rates changed over time for rural and urban dually enrolled beneficiaries, we used a Z-test to compare the first and final years of the study period. To determine whether mortality changed differentially over time between rural versus urban dually enrolled beneficiaries, we evaluated the interaction between rural status and time. We then performed the same analyses to examine these patterns by the nine US census regions. As a subgroup analysis, we also examined changes in all-cause mortality among Black and White dually enrolled beneficiaries residing in rural versus urban areas. All analyses were performed using SAS, version 15.1.
LIMITATIONS
This study had several limitations. First, many states elected to expand Medicaid under the Affordable Care Act, beginning in 2014, which changed eligibility requirements for the program. However, our study population is unlikely to have been affected, as Medicaid eligibility requirements for people age sixty-five or older are set federally and are more comparable across states. Second, Medicare beneficiaries are able to move in and out of the Medicaid program according to whether they meet eligibility requirements. However, rates of continuous enrollment in Medicaid tend to be high (greater than 85 percent) among Medicare beneficiaries older than age sixty-five.22,23 Third, because it is linked to census tracts and therefore provides a more granular assessment of where beneficiaries reside, we used the rural-urban commuting area to evaluate whether beneficiaries resided in a rural or urban area. However, this may limit comparisons of our findings to prior studies that use county-level measures of rurality. Fourth, the 2010 rural-urban commuting area data were not able to account for changes in census tract data that may have occurred beyond this time frame. As a result, we were unable to account for minor urbanization or deurbanization changes that may have occurred during the study period. Fifth, approximately 10 percent of dually enrolled beneficiaries in our initial cohort were excluded because of missing information on rural versus urban residence. However, demographics (age and sex) were similar between the final study cohort and the excluded beneficiaries, making it unlikely that excluding these beneficiaries biased our findings.
Study Results
STUDY COHORT
Overall, there were 11,737,006 unique dually enrolled Medicare (fee-for-service and Medicare Advantage) beneficiaries in the period 2004–17. The mean age of the cohort was 74.8 years (standard deviation: 8.8), and 66.2 percent were female. During the study period there were 65,999,705 total dually enrolled beneficiary-years represented, of which 46,668,763 (70.7 percent) were fee-for-service and 19,330,942 (29.3 percent) were Medicare Advantage beneficiary-years. Of the total beneficiary-years, there were 11,929,876 (18.1 percent) rural beneficiary-years and 54,069,829 (81.9 percent) urban beneficiary-years.
Between 2004 and 2017, mean age decreased among rural (from 78.0 [SD: 8.2] to 76.4 [SD: 8.2] years; p < 0.001) and urban (from 77.5 [SD: 8.0] to 76.5 [SD: 8.1] years; p < 0.001) dually enrolled beneficiaries. In both groups the proportion of dually enrolled beneficiaries who were female declined (rural: from 71.1 percent to 66.7 percent [p < 0.001]; urban: from 70.9 percent to 65.9 percent [p < 0.001]). The proportion of dually enrolled White beneficiaries remained consistent in rural areas (at 77.2 percent; p = 0.16) but decreased slightly in urban areas (from 57.5 percent to 53.6 percent; p < 0.001). Annual rates of enrollment in Medicare Advantage for at least one month within a given year increased for both rural (from 3.1 percent to 26.0 percent; p < 0.001) and urban (from 14.0 percent to 46.6 percent; p < 0.001) dually enrolled beneficiaries (exhibit 1; appendix exhibit 3).21
EXHIBIT 1.
Baseline characteristics of rural and urban dually enrolled Medicare beneficiaries, 2004–05 and 2016–17
| Rural |
Urban |
|||
|---|---|---|---|---|
| Characteristics | 2004–05 | 2016–17 | 2004–05 | 2016–17 |
| Total number | 1,616,427 | 1,811,403 | 6,550,268 | 9,144,286 |
| Age, mean years | 78.0 | 76.4 | 77.5 | 76.5 |
| Female (%) | 71.1 | 66.7 | 70.9 | 65.9 |
| Race/ethnicity (%) | ||||
| White | 77.2 | 77.2 | 57.5 | 53.6 |
| Black | 16.7 | 15.4 | 19.5 | 19.7 |
| Other | 0.65 | 0.9 | 3.0 | 3.14 |
| Asian | 0.61 | 0.9 | 10.0 | 11.3 |
| Hispanic | 3.1 | 3.7 | 9.7 | 12.0 |
| Native American | 1.8 | 1.9 | 0.34 | 0.4 |
| Insurance type (%) | ||||
| Fee-for-service | 96.9 | 74.0 | 86.0 | 54.4 |
| Medicare Advantage | 3.1 | 26.0 | 14.0 | 46.6 |
| Region (%) | ||||
| East North Central | 13.0 | 13.9 | 10.6 | 10.8 |
| East South Central | 22.0 | 19.1 | 5.8 | 4.6 |
| West North Central | 8.3 | 7.3 | 2.8 | 2.6 |
| West South Central | 15.8 | 13.8 | 10.7 | 10.2 |
| Mid-Atlantic | 4.4 | 5.1 | 16.7 | 16.0 |
| Mountain | 5.4 | 6.9 | 4.1 | 5.0 |
| New England | 3.1 | 4.9 | 5.2 | 6.1 |
| Pacific | 9.1 | 10.7 | 24.4 | 24.0 |
| South Atlantic | 18.9 | 18.2 | 19.5 | 20.7 |
| Others | 0.04 | 0.03 | 0.13 | 0.09 |
SOURCE Authors’ analysis of dually enrolled Medicare (fee-for-service and Medicare Advantage) beneficiaries, 2004–17, using rural-urban commuting area codes and data from the Centers for Medicare and Medicaid Services Medicare Master Beneficiary Summary Files.
The distribution of rural and urban dually enrolled beneficiaries varied geographically. Throughout the study period, the largest share of rural beneficiaries resided in the East South Central region, and the largest share of urban beneficiaries resided in the Pacific region (exhibit 1).
ALL-CAUSE MORTALITY
In the Medicare (fee-for-service and Medicare Advantage) dually enrolled population, observed all-cause mortality rates were higher among rural beneficiaries (92.8 per 1,000 rural dually enrolled beneficiaries) when compared with their urban counterparts (75.1 per 1,000 urban dually enrolled beneficiaries) over the entire study period. Among rural dually enrolled beneficiaries, observed all-cause mortality declined from 99.5 to 87.0 per1.0 beneficiaries (difference: 12.5; 95% confidence interval: 11.6, 13.4; p < 0.001) from 2004 to 2017. In comparison, among urban dually enrolled beneficiaries, declines were more pronounced, from 86.2 to 68.6 per 1,000 beneficiaries (difference: 17.6; 95% CI: 17.2, 17.9; p < 0.001) from 2004 to 2017 (data not shown). After all-cause mortality rates were standardized for age and sex, mortality declined among the rural dually enrolled, from 96.6 to 92.7 per 1,000 beneficiaries (difference:, 3.9; 95% CI: 3.0, 4.7; p < 0.001), as well as among the urban dually enrolled, from 86.9 to 72.8 per 1,000 beneficiaries (difference: 14.1; 95% CI: 13.7, 14.5; p < 0.001), from 2004 to 2017 (exhibit 2). The relative percentage decline in all-cause mortality for rural and urban dually enrolled beneficiaries is shown in exhibit 3. The difference in all-cause mortality between rural and urban dually enrolled beneficiaries widened during the study period (p < 0.001 for the difference in rural versus urban change over time).
EXHIBIT 2. Age-sex standardized all-cause mortality rates per 1,000 dually enrolled Medicare beneficiaries in rural and urban areas of the US, 2004–17.

source Authors’ analysis of dually enrolled Medicare (fee-for-service and Medicare Advantage) beneficiaries, 2004–17, using rural-urban commuting area codes and data from the Centers for Medicare and Medicaid Services Master Beneficiary Summary files. notes All-cause mortality rates after standardization for age and sex. The interaction between rural/urban status and all-cause mortality over time was statistically significant (p < 0.001).
EXHIBIT 3.
Change in age- and sex-standardized all-cause mortality among rural and urban dually enrolled Medicare beneficiaries, by census region, 2004 and 2017
| Rural |
Urban |
|||||
|---|---|---|---|---|---|---|
| Region (states) | 2004 | 2017 | Relative percent change |
2004 | 2017 | Relative percent change |
| Overall | 96.6 | 92.7 | −4.0 | 86.9 | 72.8 | −16.2 |
| New England (CT, ME, MA, NH, RI, VT) | 90.0 | 74.2 | −17.6 | 81.4 | 66.3 | −18.6 |
| Mid-Atlantic (NJ, NY, PA) | 90.5 | 79.7 | −11.9 | 73.5 | 59.9 | −18.5 |
| East North Central (IL, IN, MI, OH, WI) | 114.9 | 108.9 | −5.2 | 109.6 | 92.0 | −16.1 |
| West North Central (IA, KS, MN, MO, NE, ND, SD) | 100.4 | 103.9 | + 3.5 | 101.1 | 94.4 | −6.6 |
| South Atlantic (DE, FL, GA, MD, NC, SC, VA, DC, WV) | 97.1 | 94.1 | −3.1 | 99.0 | 81.8 | −17.4 |
| East South Central (AL, KY, MS, TN) | 90.0 | 91.8 | + 2.0 | 97.5 | 92.1 | −5.5 |
| West South Central (AR, LA, OK, TX) | 88.8 | 87.9 | −1.0 | 83.6 | 71.7 | −14.2 |
| Mountain (AZ, CO, ID, MT, NV, NM, UT, WY) | 98.1 | 88.4 | −9.9 | 99.6 | 84.3 | −15.4 |
| Pacific (AK, CA, HI, OR, WA) | 99.3 | 86.9 | −12.5 | 73.4 | 59.7 | −18.7 |
source Authors’analysis of dually enrolled Medicare (fee-for-service and Medicare Advantage) beneficiaries, 2004–17, using rural-urban commuting area codes and data from the Centers for Medicare and Medicaid Services Medicare Master Beneficiary Summary Files. note All p values were <0.001 for difference in rural versus urban change over time except for the Mid-Atlantic (p = 0.17), New England (p = 0.80), Pacific (p = 0.35), and Mountain (p = 0.007) regions.
All-cause mortality varied geographically across the nine US census regions (exhibit 3; appendix exhibit 4).21 In 2004 mortality rates were highest for rural dually enrolled beneficiaries in the East North Central region (114.9 per 1,000 beneficiaries) and lowest in the West South Central region (88.8 per 1,000 beneficiaries). By 2017 mortality rates for the rural dually enrolled remained highest in the East North Central region (108.9 per 1,000 beneficiaries) but were lowest in New England (74.2 per 1,000 beneficiaries). Between 2004 and 2017 mortality among rural dually enrolled beneficiaries increased modestly in West North Central (from 100.4 to 103.9 per 1,000 beneficiaries; p = 0.03) and East South Central (from 90.0 to 91.8 per 1,000 beneficiaries; p = 0.06) states. Exhibit 3 shows the relative percentage change in all-cause mortality for rural and urban dually enrolled beneficiaries by US census region. The difference in all-cause mortality between rural and urban dually enrolled beneficiaries increased significantly (p < 0.001 for difference in rural versus urban change over time) from 2004 to 2017 in all US census regions except the Mid-Atlantic, New England, Pacific, and Mountain regions.
In our subgroup analysis of dually enrolled beneficiaries stratified by race, age- and sex-standardized all-cause mortality rates for White rural beneficiaries declined from 102.2 to 98.2 per 1,000 beneficiaries (difference: 4.0; 95% CI: 3.0, 5.0; p < 0.001) between 2004 and 2017, whereas all-cause mortality for Black rural beneficiaries declined from 80.7 to 78.5 per 1,000 beneficiaries (difference: 2.2; 95% CI: 0.13, 4.2; p < 0.001). In comparison, declines in all-cause mortality were more pronounced for both White (from 101.3 to 87.6 per 1,000 beneficiaries; difference: 13.7; 95% CI: 13.1,14.3; p < 0.001) and Black (from 88.2 to 75.4 per 1,000 beneficiaries; difference: 12.8; 95% CI: 11.9, 13.7; p < 0.001) urban beneficiaries from 2004 to 2017 (exhibit 4).
EXHIBIT 4. Age-sex standardized all-cause mortality rates per 1,000 dually enrolled Medicare beneficiaries in rural and urban areas in the US, by race, 2004–17.
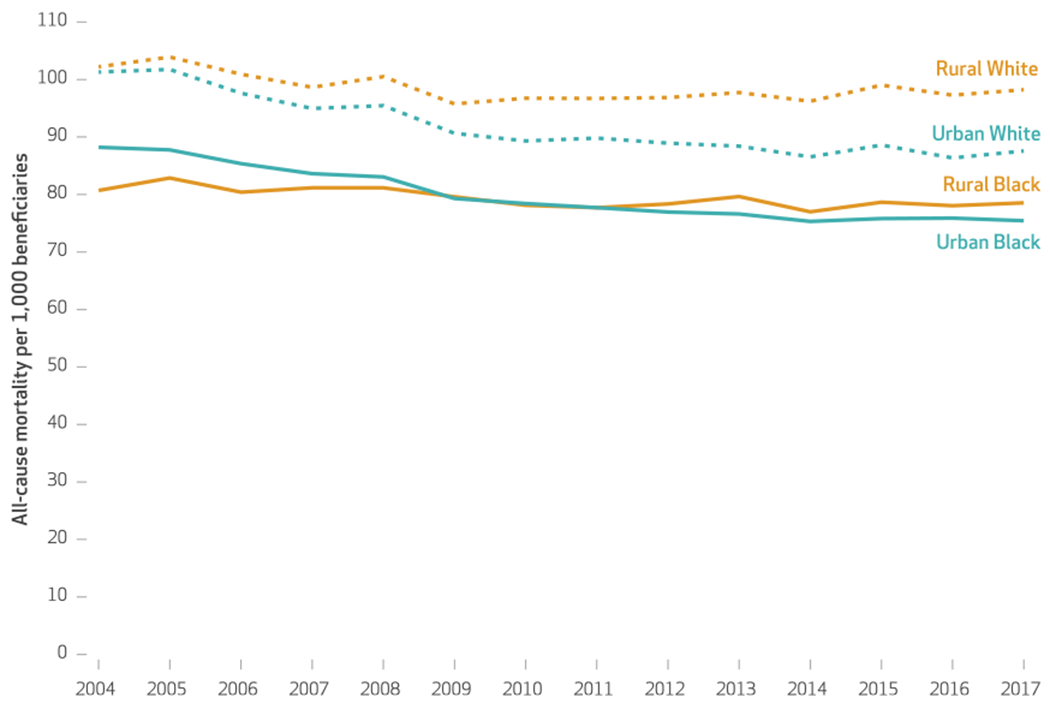
source Authors’ analysis of dually enrolled Medicare (fee-for-service and Medicare Advantage) beneficiaries, 2004–17, using rural-urban commuting area codes and data from the Centers for Medicare and Medicaid Services Medicare Master Beneficiary Summary Files. note The exhibit shows all-cause mortality rates by race (Black or White) after standardization for age and sex.
Discussion
In this study of dually enrolled Medicare beneficiaries older than age sixty-five, rural beneficiaries had higher all-cause mortality rates than their urban counterparts. Although all-cause mortality rates decreased overall for both groups from 2004 to 2017, declines among rural beneficiaries were more modest and stalled in more recent years, resulting in an increased gap in mortality. There was also substantial geographic variation in all-cause mortality rates among rural dually enrolled beneficiaries. Rural mortality rates were highest in East North Central states and increased modestly in West North Central states during the study period.
In recent years there has been increasing concern about the health of rural communities in the US. Approximately 60 million Americans currently reside in rural areas,24 and these people experience worse outcomes than their urban counterparts, including higher rates of death from heart disease, cancer, and unintentional injuries.10,25,26 These disparities have been attributed to the complex social, behavioral, and structural factors that rural residents face, which result in disproportionally higher rates of poverty, chronic disease, and fragmented medical care.3,9,10,25,27,28 Our study extends this evidence by focusing specifically on low-income (dually enrolled) Medicare beneficiaries and demonstrates an alarming, growing gap in all-cause mortality between those living in rural and in urban areas.
We found that there was marked geographic variation in patterns and trends in all-cause mortality rates in the dually enrolled population. For example, rural beneficiaries living in the East North Central region persistently experienced the highest mortality rates throughout the study period. Further, although mortality in urban areas decreased in West North Central states, this region experienced a modest increase in rural mortality. These patterns may be explained, at least in part, by several factors, including the opioid epidemic and the growing shortage of health care providers that has primarily affected rural and low-income settings in midwestern states.29–32 In addition, mortality generally did not improve in the South, an area that has experienced a rapid rise in chronic diseases and has disproportionately been affected by rural hospital closures.11,33 In contrast, New England, a region that includes states with generally high-performing health care systems, experienced the sharpest declines in rural mortality during the study period.34 Overall, these findings indicate that local and regional public health efforts are needed to improve health outcomes for low-income Medicare beneficiaries residing in rural areas.
Federal policy efforts that aim to improve the health of dually enrolled Medicare beneficiaries have intensified in recent years. The Centers for Medicare and Medicaid Services has implemented integrated care models, such as the Program of All-Inclusive Care for the Elderly, that specifically target this population.8 However, these initiatives, which were developed based on urban infrastructure, have achieved limited success in rural areas because of challenges associated with implementation.35–37 In addition, home-based services and nursing home facilities also remain limited within rural areas, often leaving dually enrolled beneficiaries living in these communities without reliable access to skilled medical care.38–40 As a result, rural dually enrolled beneficiaries continue to disproportionately experience worse access to medical services, as well as uncoordinated care, that may negatively affect their outcomes. Therefore, policy efforts that specifically target these beneficiaries may be needed to improve care delivery and long-term health.
Conclusion
In the dually enrolled Medicare (fee-for-service and Medicare Advantage) population older than age sixty-five, beneficiaries living in rural areas had higher all-cause mortality rates than their urban counterparts. Although all-cause mortality rates decreased for both groups from 2004 to 2017, declines among rural beneficiaries lagged behind those living in urban areas and have stalled during the last several years, resulting in a widening rural-urban gap in mortality. Given increasing inequities in health outcomes for low-income Medicare beneficiaries living in rural areas, there is an urgent need for public health and policy efforts to focus on improving access to care, care delivery, and the health of this vulnerable population. ■
Supplementary Material
Acknowledgments
Karen Joynt Maddox receives research support from the National Heart, Lung, and Blood Institute (Grant No. R01HL143421) and National Institute on Aging (Grant No. R01AG060935) at the National Institutes of Health. Robert Yeh receives research support from the National Heart, Lung and Blood Institute (Grant No. R01HL136708) and from the Richard A. and Susan F. Smith Center for Outcomes Research in Cardiology and receives personal fees from Biosense Webster and grants and personal fees from Abbott Vascular, AstraZeneca, Boston Scientific, and Medtronic (unrelated to the submitted work). Rishi Wadhera receives research support from the National Heart, Lung, and Blood Institute (Grant No. K23HL148525). He previously served as a consultant for Regeneron (unrelated to the submitted work). All other authors have no disclosures.
Contributor Information
Emefah Loccoh, Richard A. and Susan F. Smith Center for Outcomes Research, Beth Israel Deaconess Medical Center, in Boston, Massachusetts.
Karen E. Joynt Maddox, assistant professor of medicine at the Washington University School of Medicine and codirector of the Center for Health Economics and Policy at the Institute for Public Health at Washington University in St. Louis, in St. Louis, Missouri.
Jiaman Xu, Richard A. and Susan F. Smith Center for Outcomes Research, Beth Israel Deaconess Medical Center.
Changyu Shen, Richard A. and Susan F. Smith Center for Outcomes Research, Beth Israel Deaconess Medical Center.
José F. Figueroa, Department of Health Policy and Management, Harvard T. H. Chan School of Public Health, in Boston, Massachusetts.
Dhruv S. Kazi, Richard A. and Susan F. Smith Center for Outcomes Research, Beth Israel Deaconess Medical Center.
Robert W. Yeh, director of the Richard A. and Susan F. Smith Center for Outcomes Research at Beth Israel Deaconess Medical Center and the Katz Silver Family Endowed Chair and associate professor of medicine in the field of outcomes research in cardiology at Harvard Medical School, in Boston, Massachusetts
Rishi K. Wadhera, assistant professor of medicine at Harvard Medical School and an investigator at the Richard A. and Susan F. Smith Center for Outcomes Research, Beth Israel Deaconess Medical Center.
NOTES
- 1.Centers for Medicare and Medicaid Services. Rural-urban disparities in health care in Medicare [Internet]. Baltimore (MD): CMS; 2018. November [cited 2020 Dec 11]. Available from: https://www.cms.gov/files/document/rural-urban-disparities-health-care-medicare-national-report [Google Scholar]
- 2.Henning-Smith C, Hernandez AM, Lahr M. Rural-urban differences in access to and attitudes toward care for Medicare beneficiaries [Internet]. Minneapolis (MN): University of Minnesota Rural Health Research Center; 2019. December [cited 2020 Dec 11]. Available from: http://rhrc.umn.edu/wp-content/uploads/2019/12/UMN-MCBS-Access-Brief_12.10.pdf [Google Scholar]
- 3.Johnston KJ, Wen H, Joynt Maddox KE. Lack of access to specialists associated with mortality and preventable hospitalizations of rural Medicare beneficiaries. Health Aff (Millwood). 2019;38(12): 1993–2002. [DOI] [PubMed] [Google Scholar]
- 4.Moy E, Garcia MC, Bastian B, Rossen LM, Ingram DD, Faul M, et al. Leading causes of death in nonmetropolitan and metropolitan areas—United States, 1999–2014. MMWR Surveill Summ. 2017;66(1):1–8. [DOI] [PMC free article] [PubMed] [Google Scholar]
- 5.Centers for Medicare and Medicaid Services. CMS rural health strategy [Internet]. Baltimore (MD): CMS; 2018. [cited 2020 Dec 11]. Available from: https://www.cms.gov/About-CMS/Agency-Information/OMH/Downloads/Rural-Strategy-2018.pdf [Google Scholar]
- 6.Wadhera RK, Wang Y, Figueroa JF, Dominici F, Yeh RW, Joynt Maddox KE. Mortality and hospitalizations for dually enrolled and nondually enrolled Medicare beneficiaries aged 65 years or older, 2004 to 2017. JAMA. 2020;323(10):961–9. [DOI] [PMC free article] [PubMed] [Google Scholar]
- 7.Department of Health and Human Services, Office of the Assistant Secretary for Planning and Evaluation. Analysis of pathways to dual eligible status: final report [Internet]. Washington (DC): HHS; 2019. May [cited 2020 Dec 11]. Available from: https://aspe.hhs.gov/system/files/pdf/261726/DualStatus.pdf [Google Scholar]
- 8.Centers for Medicare and Medicaid Services. People dually eligible for Medicare and Medicaid [Internet]. Baltimore (MD): CMS; 2020. March [cited 2020 Dec 11]. Available from: https://www.cms.gov/Medicare-Medicaid-Coordination/Medicareand-Medicaid-Coordination/Medicare-Medicaid-Coordination-Office/Downloads/MMCO_Factsheet.pdf [Google Scholar]
- 9.Probst J, Eberth JM, Crouch E. Structural urbanism contributes to poorer health outcomes for rural America. Health Aff (Millwood). 2019;38(12):1976–84. [DOI] [PubMed] [Google Scholar]
- 10.Cosby AG, McDoom-Echebiri MM, James W, Khandekar H, Brown W, Hanna HL. Growth and persistence of place-based mortality in the United States: the rural mortality penalty. Am J Public Health. 2019;109(1):155–62. [DOI] [PMC free article] [PubMed] [Google Scholar]
- 11.Government Accountability Office. Rural hospital closures: number and characteristics of affected hospitals and contributing factors [Internet]. Washington (DC): GAO; 2018. August [cited 2020 Dec 11]. Available from: https://www.gao.gov/assets/700/694125.pdf [Google Scholar]
- 12.Gujral K, Basu A. Impact of rural and urban hospital closures on inpatient mortality [Internet]. Cambridge (MA): National Bureau of Economic Research; 2019. August [cited 2020 Dec 11]. (NBER Working Paper No. 26182). Available from: https://www.nber.org/papers/w26182 [Google Scholar]
- 13.James W, Cossman JS. Long-term trends in black and white mortality in the rural United States: evidence of a race-specific rural mortality penalty. J Rural Health. 2017;33(1): 21–31. [DOI] [PubMed] [Google Scholar]
- 14.Spencer JC, Wheeler SB, Rotter JS, Holmes GM. Decomposing mortality disparities in urban and rural U.S. counties. Health Serv Res. 2018; 53(6):4310–31. [DOI] [PMC free article] [PubMed] [Google Scholar]
- 15.Department of Agriculture, Economic Research Service. Rural-urban commuting area codes [Internet]. Washington (DC): USDA; 2020. [last updated 2020 Aug 17; cited 2020 Dec 11]. Available from: https://www.ers.usda.gov/data-products/rural-urban-commuting-area-codes.aspx [Google Scholar]
- 16.Rossiter K Decoding state-county census tracts versus tribal census tracts [Internet]. Washington (DC): Census Bureau; 2012. July 17 [cited 2020 Dec 11]. Available from: https://www.census.gov/newsroom/blogs/random-samplings/2012/07/decoding-state-county-census-tracts-versus-tribal-census-tracts.html [Google Scholar]
- 17.Ohl M, Tate J, Duggal M, Skanderson M, Scotch M, Kaboli P, et al. Rural residence is associated with delayed care entry and increased mortality among veterans with human immunodeficiency virus infection. Med Care. 2010;48(12): 1064–70. [DOI] [PMC free article] [PubMed] [Google Scholar]
- 18.Redmond N, Richman J, Gamboa CM, Albert MA, Sims M, Durant RW, et al. Perceived stress is associated with incident coronary heart disease and all-cause mortality in low- but not high-income participants in the Reasons for Geographic and Racial Differences in Stroke study. J Am Heart Assoc. 2013;2(6):e000447. [DOI] [PMC free article] [PubMed] [Google Scholar]
- 19.Wilcock AD, Zachrison KS, Schwamm LH, Uscher-Pines L, Zubizarreta JR, Mehrotra A. Trends among rural and urban Medicare beneficiaries in care delivery and outcomes for acute stroke and transient ischemic attacks, 2008–2017. JAMA Neurol. 2020;77(7):863–71. [DOI] [PMC free article] [PubMed] [Google Scholar]
- 20.Fan JX, Wen M, Wan N. Built environment and active commuting: rural-urban differences in the U.S. SSM Popul Health. 2017;3:435–41. [DOI] [PMC free article] [PubMed] [Google Scholar]
- 21.To access the appendix, click on the Details tab of the article online.
- 22.Ku L, Steinmetz E (George Washington University; Washington, DC). Bridging the gap: continuity and quality of coverage in Medicaid [Internet]. Washington (DC): Association for Community Affiliated Plans; 2013. September 10 [cited 2020 Dec 11]. Available from: https://ccf.georgetown.edu/wp-content/uploads/2013/09/GW-Continuity-Report-9-10-13.pdf [Google Scholar]
- 23.Riley GF, Zhao L, Tilahun N. Understanding factors associated with loss of Medicaid coverage among dual eligibles can help identify vulnerable enrollees. Health Aff (Millwood). 2014;33(1):147–52. [DOI] [PubMed] [Google Scholar]
- 24.Census Bureau. What is rural America? [Internet]. Washington (DC): Census Bureau; 2017. August 9 [cited 2020 Jan 14]. Available from: https://www.census.gov/library/stories/2017/08/rural-america.html [Google Scholar]
- 25.Medicare Payment Advisory Commission, Medicaid and CHIP Payment and Access Commission. Data book: beneficiaries dually eligible for Medicare and Medicaid [Internet]. Washington (DC): MACPAC; 2017. January [cited 2020 Dec 11]. Available from: https://www.macpac.gov/wp-content/uploads/2020/07/Data-Book-Beneficiaries-Dually-Eligible-for-Medicare-and-Medicaid-January-2017.pdf [Google Scholar]
- 26.Bechtold D, Salvatierra GG, Bulley E, Cypro A, Daratha KB. Geographic variation in treatment and outcomes among patients with AMI: investigating urban-rural differences among hospitalized patients. J Rural Health. 2017;33(2):158–66. [DOI] [PubMed] [Google Scholar]
- 27.Weil AR. Rural health. Health Aff (Millwood). 2019;38(12):1963. [DOI] [PubMed] [Google Scholar]
- 28.Villapiano N, Iwashyna TJ, Davis MM. Worsening rural-urban gap in hospital mortality. J Am Board Fam Med. 2017;30(6):816–23. [DOI] [PubMed] [Google Scholar]
- 29.Martin TF II. The stark inaccessibility of medical care in rural Indiana: judicial and legislative solutions [Internet]. Indianapolis (IN): Indiana University Robert H. McKinney School of Law; 2014. [cited 2020 Dec 11]. Available from: https://mckinneylaw.iu.edu/ihlr/pdf/vol11p831.pdf [Google Scholar]
- 30.Health Resources and Services Administration. State-level projections of supply and demand for primary care practitioners: 2013–2025 [Internet]. Rockville (MD): HRSA; 2016. November [cited 2020 Dec 11]. Available from: https://bhw.hrsa.gov/sites/default/files/bureau-health-workforce/data-research/primary-care-state-projections2013-2025.pdf [Google Scholar]
- 31.Roland CL, Ye X, Stevens V, Oderda GM. The prevalence and cost of Medicare beneficiaries diagnosed and at risk for opioid abuse, dependence, and poisoning. J Manag Care Spec Pharm. 2019;25(1):18–27. [DOI] [PMC free article] [PubMed] [Google Scholar]
- 32.Monnat SM, Rigg KK. The opioid crisis in rural and small town America [Internet]. Durham (NH): University of New Hampshire; 2018. [cited 2020 Dec 11]. Available from: https://scholars.unh.edu/cgi/viewcontent.cgi?article=1342&context=carsey [Google Scholar]
- 33.Oates GR, Jackson BE, Partridge EE, Singh KP, Fouad MN, Bae S. Sociodemographic patterns of chronic disease: how the Mid-South region compares to the rest of the country. Am J Prev Med. 2017;52(1S1):S31–9. [DOI] [PMC free article] [PubMed] [Google Scholar]
- 34.Agency for Healthcare Research and Quality. Health care quality: how does your state compare? [Internet]. Rockville (MD): AHRQ; 2018. April [cited 2020 Dec 11]. Available from: https://www.ahrq.gov/data/infographics/state-compare-text.html [Google Scholar]
- 35.Griffin E, Coburn AF. Integrated care for older adults in rural communities [Internet]. Portland (ME): University of Southern Maine, Muskie School of Public Service; 2014. [cited 2020 Dec 11]. Available from: https://digitalcommons.usm.maine.edu/cgi/viewcontent.cgi?article=1005&context=behavioral_health [Google Scholar]
- 36.Anderson KK. Report to Congress: evaluation of the rural PACE provider grant program [Internet]. Baltimore (MD): Centers for Medicare and Medicaid Services; 2011. [cited 2020 Dec 11]. Available from: https://www.cms.gov/Research-Statistics-Data-and-Systems/Statistics-Trends-and-Reports/Reports/Downloads/Anderson_Rural_PACE_RTC_2010.pdf [Google Scholar]
- 37.Hirth V, Baskins J, Dever-Bumba M. Program of All-Inclusive Care (PACE): past, present, and future. J Am Med Dir Assoc. 2009;10(3): 155–60. [DOI] [PubMed] [Google Scholar]
- 38.Flinn B Nursing home closures and trends, June 2015–June 2019 [Internet]. Washington (DC): Leading-Age; 2020. February [cited 2020 Dec 11]. Available from: https://leadingage.org/sites/default/files/Nursing%20Home%20Closures%20and%20Trends%202020.pdf [Google Scholar]
- 39.Skillman SM, Patterson DG, Coulthard C, Mroz TM. Access to rural home health services: views from the field [Internet]. Seattle (WA): WWAMI Rural Health Research Center, University of Washington; 2016. February [cited 2020 Dec 11]. (Final Report No. 152). Available from: https://depts.washington.edu/fammed/rhrc/wp-content/uploads/sites/4/2016/02/RHRC_FR152_Skillman.pdf [Google Scholar]
- 40.Kosar CM, Loomer L, Ferdows NB, Trivedi AN, Panagiotou OA, Rahman M. Assessment of rural-urban differences in postacute care utilization and outcomes among older US adults. JAMA Netw Open. 2020;3(1):e1918738. [DOI] [PMC free article] [PubMed] [Google Scholar]
Associated Data
This section collects any data citations, data availability statements, or supplementary materials included in this article.