PURPOSE
Although the majority of patients with metastatic non–small-cell lung cancer (mNSCLC) lacking a detectable targetable mutation will receive pembrolizumab-based therapy in the frontline setting, predicting which patients will experience a durable clinical benefit (DCB) remains challenging.
MATERIALS AND METHODS
Patients with mNSCLC receiving pembrolizumab monotherapy or in combination with chemotherapy underwent a 74-gene next-generation sequencing panel on blood samples obtained at baseline and at 9 weeks. The change in circulating tumor DNA levels on-therapy (molecular response) was quantified using a ratio calculation with response defined by a > 50% decrease in mean variant allele fraction. Patient response was assessed using RECIST 1.1; DCB was defined as complete or partial response or stable disease that lasted > 6 months. Progression-free survival and overall survival were recorded.
RESULTS
Among 67 patients, 51 (76.1%) had > 1 variant detected at a variant allele fraction > 0.3% and thus were eligible for calculation of molecular response from paired baseline and 9-week samples. Molecular response values were significantly lower in patients with an objective radiologic response (log mean 1.25% v 27.7%, P < .001). Patients achieving a DCB had significantly lower molecular response values compared to patients with no durable benefit (log mean 3.5% v 49.4%, P < .001). Molecular responders had significantly longer progression-free survival (hazard ratio, 0.25; 95% CI, 0.13 to 0.50) and overall survival (hazard ratio, 0.27; 95% CI, 0.12 to 0.64) compared with molecular nonresponders.
CONCLUSION
Molecular response assessment using circulating tumor DNA may serve as a noninvasive, on-therapy predictor of response to pembrolizumab-based therapy in addition to standard of care imaging in mNSCLC. This strategy requires validation in independent prospective studies.
INTRODUCTION
Over the past decade, treatment for metastatic non–small-cell lung cancer (mNSCLC) has undergone a paradigm shift. For patients with NSCLC not harboring an actionable mutation, immunotherapy with or without concurrent chemotherapy has become the standard first-line therapeutic approach. Pembrolizumab is currently approved for the treatment of patients with mNSCLC with a programmed death ligand 1 (PD-L1) Tumor Proportion Score (TPS) ≥ 1%, and in combination with chemotherapy regardless of PD-L1 TPS.1,2 In practice, pembrolizumab monotherapy is given to relatively asymptomatic patients with a low overall disease burden and a PD-L1 TPS ≥ 50%.3 By contrast, patients with PD-L1 < 50% are usually treated with histology-specific platinum-doublet therapy in combination with pembrolizumab.2,4
CONTEXT
Key Objective
For patients with metastatic non–small-cell lung cancer without a targetable mutation, programmed death 1 or programmed death ligand 1 antibody therapy alone, or in combination with chemotherapy, has become the standard first-line therapeutic approach. However, only a subset of patients respond to these therapies. Predicting which patients will experience a durable clinical benefit remains a clinical challenge.
Knowledge Generated
We performed plasma next-generation sequencing on circulating tumor DNA (ctDNA) from paired blood samples obtained at baseline and at 9 weeks in a prospective cohort of patients with metastatic non–small-cell lung cancer treated with pembrolizumab-based therapy. We demonstrate that a reduction in on-treatment ctDNA level is associated with improved response rates at 9 weeks and 6 months, as well as improved progression-free survival and overall survival.
Relevance
These results highlight the potential role of assessing on-treatment changes in ctDNA as a noninvasive means to predict long-term efficacy from pembrolizumab-based therapy in advanced non–small-cell lung cancer (NSCLC).
Despite significant advances, many patients do not benefit from immunotherapy, and currently available biomarkers are unable to adequately predict which patients are most likely to respond.3,5,6 Current management and therapeutic decisions continue to be based on clinical symptoms and radiographic evaluation. Plasma-based approaches using circulating tumor DNA (ctDNA) and next-generation sequencing (NGS) are being increasingly used for noninvasive detection of mutations in mNSCLC. Our group recently evaluated plasma NGS as a potential biomarker for selection of immunotherapy for treatment-naive patients with mNSCLC. Using a 500-gene plasma NGS assay, we demonstrated that patients with a higher blood tumor mutational burden at baseline were more likely to benefit from pembrolizumab-based therapy.7
With the integration of plasma-based NGS testing into clinical practice, emerging reports have correlated changes in ctDNA on-treatment compared to baseline with response to targeted and immunotherapy in various cancer types.8-10 There are still very limited data, however, regarding changes in ctDNA during the course of immunotherapy and how these changes correlate with response and outcome in patients with mNSCLC.11-15 Recently, Zhang et al14 demonstrated that early on-treatment decreases in ctDNA levels were associated with improved progression-free survival (PFS) and overall survival (OS) across three clinical trial cohorts treated with durvalumab. Similarly, on-treatment ctDNA kinetics were recently associated with improved patient outcomes in five clinical trial cohorts of various solid tumors treated with pembrolizumab.15 However, additional data validating the role of a clinically available ctDNA NGS assay to predict response and outcomes to standard of care pembrolizumab-based therapy in mNSCLC are needed. We hypothesized that serial ctDNA molecular response assessment could serve as a biomarker of therapeutic response and outcome in patients with mNSCLC who receive pembrolizumab either alone or in combination with platinum-based chemotherapy.
MATERIALS AND METHODS
Patients and Study Design
This single-center, prospective, observational study was performed at the University of Pennsylvania between March 2, 2017, and August 15, 2019. Patients with pathologically confirmed mNSCLC scheduled to receive standard of care pembrolizumab-based therapy in the first- or second-line setting were enrolled. Patients with a concurrent malignancy or who were identified to have a targetable mutation were excluded. PD-L1 expression in pretreatment biopsy specimens was assessed using the commercially available PDL-1 IHC 22C3 assay (pharmDx; DakoNorth America, Carpinteria, CA) in 60 patients and the VENTANA PDL-1 SP263 Assay (Ventana Medical Systems, Inc., Tucson, AZ) in four patients. Three patients had either an unknown assay used or an unknown PDL-1 status. RECIST, version 1.1, was used to perform radiographic response assessments. Efficacy was defined as durable clinical benefit (DCB; complete response [CR], partial response [PR], or stable disease [SD] lasting > 6 months) or no durable benefit (NDB; PD or SD lasting ≤ 6 months). OS was calculated from the date of first pembrolizumab infusion to the time of death or censored at most recent follow-up; PFS was calculated from the date of first pembrolizumab infusion to the time of death or first documented progression, whichever came first, or censored at most recent follow-up. This study was approved by the University of Pennsylvania's Institutional Review Board. All patients provided informed consent.
Plasma Collection and Cell-Free DNA Analysis
Plasma samples for 67 patients were obtained before the first pembrolizumab infusion (T0) and at 9 weeks (T1) after the first infusion. Blood was collected in two 10-mL Streck tubes (Streck) from each patient. All cell-free DNA isolation and sequencing were performed at Guardant Health Inc. (Redwood City, CA), a Clinical Laboratory Improvement Amendments–certified, CAP-accredited facility. Samples from 32 patients were analyzed using the Guardant360 assay, and samples from 35 patients were analyzed with the GuardantOMNI assay. Samples were analyzed using the Guardant360 74 gene panel and OMNI assay as described previously (Data Supplement [online only]).7,16-21 All samples sequenced on the Guardant360 assay were processed with the current Guardant360 bioinformatics pipeline. GuardantOMNI is a superset of the Guardant360 panel with equivalent variant detection performance, including equivalent sensitivity on the common panel space. Thus, for samples sequenced with GuardantOMNI, only variants covered by the Guardant360 panel were included in molecular response calculations.
Measurement of Molecular Response
To calculate molecular response, single nucleotide variants, insertions and deletions (indels), and fusion events with a variant allele fraction (VAF) of > 0.3% were averaged to generate the mean VAF values from baseline plasma samples. Samples lacking detectable variants or that did not have any variants with a VAF of > 0.3% at baseline were considered not evaluable for molecular response analysis. These criteria were previously described by Raja et al11 and chosen based on the 95%-100% limit of detection for these three variant types. Only variants detected at baseline were used to calculate the mean VAF on-treatment to focus on the dynamics of changes in disease present at baseline, rather than clonal evolution and emergence of new variants. Some previously published studies have focused on binary presence or clearance of ctDNA on-treatment.13,22 Others measure a quantitative score, including the absolute change in ctDNA (eg, change in mean VAF)11 or by incorporating the level of residual ctDNA on-treatment, as a ratio of the maximum12 or mean VAF.14 Assessment of differing methods to calculate molecular response to predict response and outcome is shown in Appendix Figure A3. Here, molecular response is calculated as the ratio of mean VAF on-treatment to baseline, as in Zhang et al14 using a cutoff of 50% to define molecular responders (< 50%) or molecular nonresponders (≥ 50%). As Zhang et al showed, this method and cutoff is equivalent to an equally weighted sum of the absolute change in ctDNA VAF and residual on-treatment ctDNA VAF with a cutoff of 0: that is, ratio of mean VAF is < 50% if the reduction in mean VAF is greater than the residual mean VAF.
mVAF on-treatment/ mVAF baseline = 50% ⇔ 50% (mVAF on-treatment − mVAF baseline) + 50% mVAF on-treatment = 0.
Statistical Analysis
Descriptive statistics were computed for patient, tumor, and treatment characteristics. Comparisons of molecular response between 9-week response status and 6-month DCB were determined using the nonparametric Wilcoxon test. The association between molecular response and duration of therapy was examined using the Wilcoxon rank-sum test. Kaplan-Meier curves for PFS and OS were generated for patients above or below a molecular response of 50% using the logrank test. Hazard ratios (HR) and the associated 95% CIs were estimated using Cox proportional hazard model. All statistical analyses were two-sided and performed using GraphPad Prism version 7.0 (La Jolla, CA), Stata version 15.1 (College Station, TX), or R version 3.5.1 (Vienna, Austria).
RESULTS
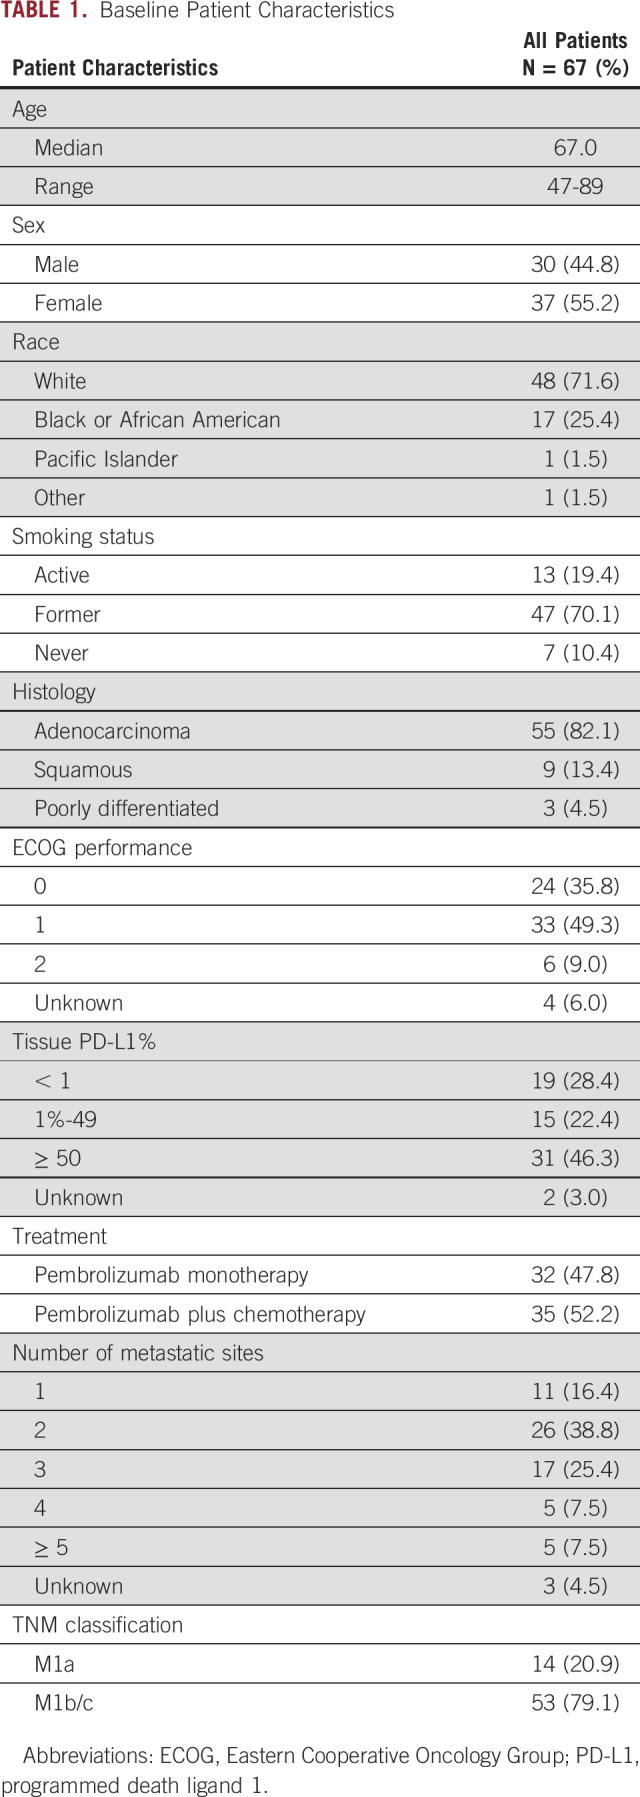
Plasma-based NGS was performed on 134 blood samples from 67 prospectively enrolled patients with mNSCLC. Median age was 67 years (range, 47-89 years), 60 (90%) patients were current or former smokers, and 82% of subjects had adenocarcinoma histology (Table 1). Thirty-two (48%) patients received pembrolizumab monotherapy and 35 (52%) patients received pembrolizumab plus platinum-based chemotherapy. There were 29 responders (1 CR and 28 PR) and 38 nonresponders (SD and PD), as measured using best overall response by RECIST 1.1. Forty-three patients (64%) had a DCB at 6 months, whereas 23 (34%) had NDB. One patient was lost to follow-up before the 6-month radiographic assessment. With a median follow-up of 20.4 months, the median PFS and OS were 9.3 and 22.1 months, respectively.
TABLE 1.
Baseline Patient Characteristics
Plasma Sequencing
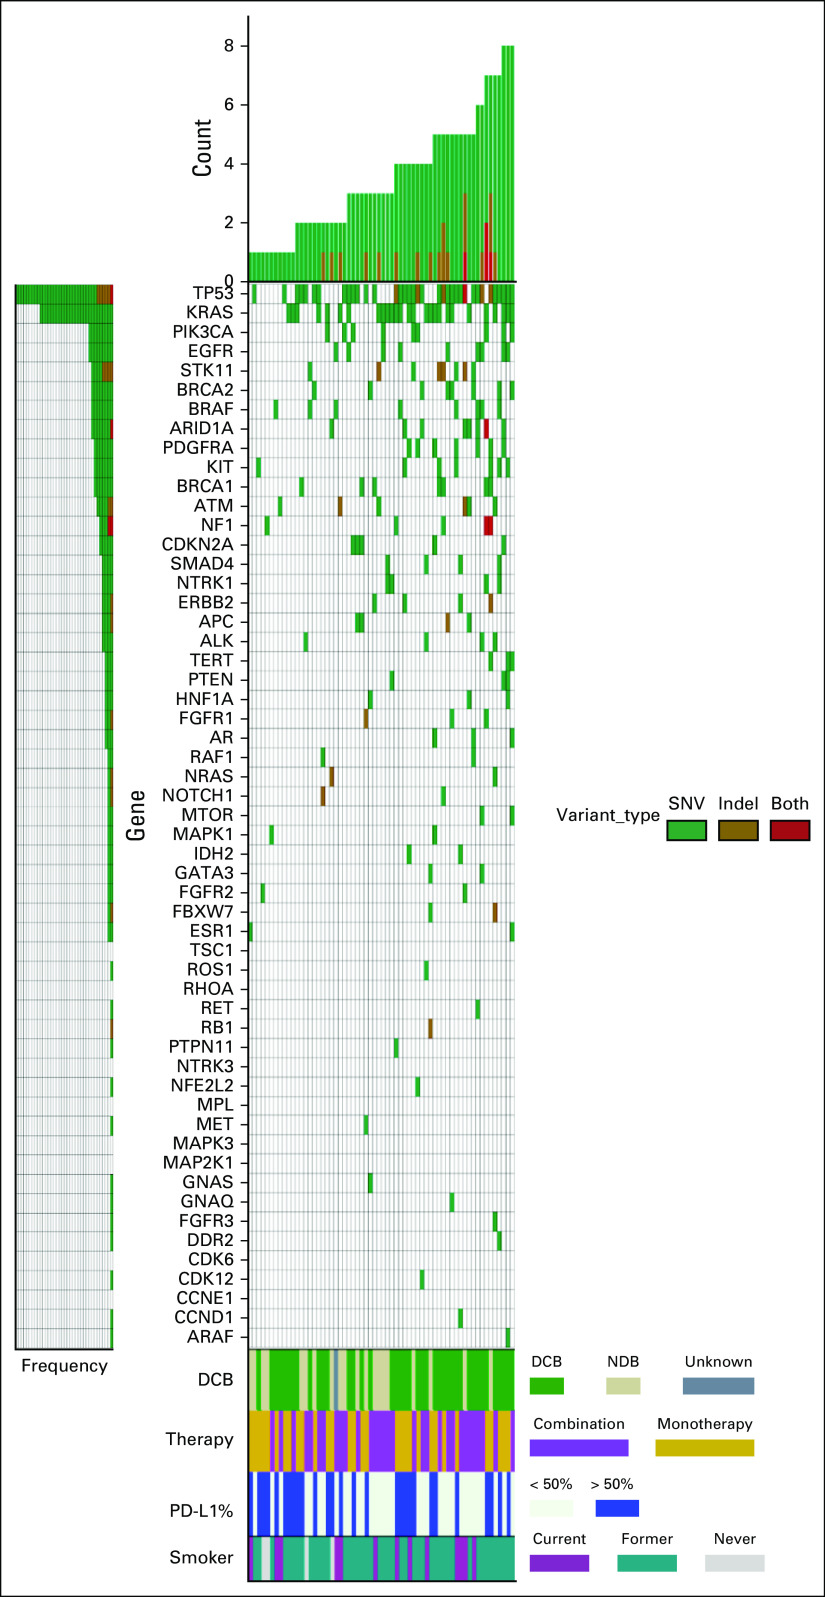
At least one somatic variant was detected in 62/67 (93%) of pretreatment plasma specimens. Two hundred one nonsynonymous variants and indels were identified in 43 different genes with a mean of 3.4 mutations per patient (range, 1-9 mutations) (Data Supplement [online only]). The most frequently mutated genes at baseline were TP53 (n = 41) and KRAS (n = 29) (Fig 1). Mutations in STK11, which have been associated with inferior outcomes in patients treated with pembrolizumab-based therapy,23 were identified in eight patients. Appendix Figure A1 shows the 9-week plasma sequencing mutational profile for the cohort. Of the 67 patients enrolled, 51 had variants detected at baseline with VAF > 0.3% and were included in the molecular response analysis. For the 16 patients in whom molecular response could not be calculated because of lack of baseline ctDNA variants > 0.3%, there was no significant difference in response or outcomes compared with the molecular response evaluable cohort (Appendix Fig A2).
FIG 1.
Baseline mutational profile. Pretreatment circulating tumor DNA analysis showing nonsynonymous variants (green), indels (golden brown), or both (red) detected in each gene for the 62 patients with at least one baseline mutation identified. Each row indicates a gene for which one or more patient had a mutation detected, with rows ordered from top to bottom based on decreasing prevalence of mutations. Number of variants detected in each patient is represented by the height of the bars and patients are arranged in increasing order. The four rows at the bottom indicate assessment of response at 6 months with DCB (green), NDB (beige), and one patient without a 6-month assessment (dark gray); treatment with pembrolizumab monotherapy (gold) or pembrolizumab plus chemotherapy (light purple); PD-L1 status with PD-L1 > 50% (blue); and smoking status with current (dark purple), former (teal), and never smokers (light gray). DCB, durable clinical benefit; NDR, no durable benefit; PD-L1, programmed death ligand 1; SNV, single nucleotide variant.
Association of Molecular Response With Response and Outcome
We examined the association between molecular response and objective radiologic response to pembrolizumab-based therapy. Thirty-one (46%) patients had a PDL1 TPS > 50% and there was no significant association between PDL1 TPS and molecular response (ρ = −0.01, P = .95). At the 9-week radiographic assessment, 17 patients had CR or PR, 22 patients had SD, and nine had PD. Three patients did not have radiographic assessments at week 9. Molecular response values were significantly lower in patients with CR or PR compared to patients with SD or PD (log mean molecular response CR or PR, 1.5% v SD, 19% [P = .0011]; PD, 69.5% [P < .001] [Fig 2A]). Patients achieving a DCB had significantly lower molecular response values compared to patients with NDB (log mean molecular response 3.5% v 49.4% [P < .001], respectively Fig 2B). The area under the receiver operating characteristic curve was 0.81 (Appendix Fig A3). Molecular responders had significantly longer duration of treatment with pembrolizumab-based therapy (median duration: 11.1 months) compared with molecular nonresponders (median duration 5.4 months, P = .0001) (Fig 2C).
FIG 2.
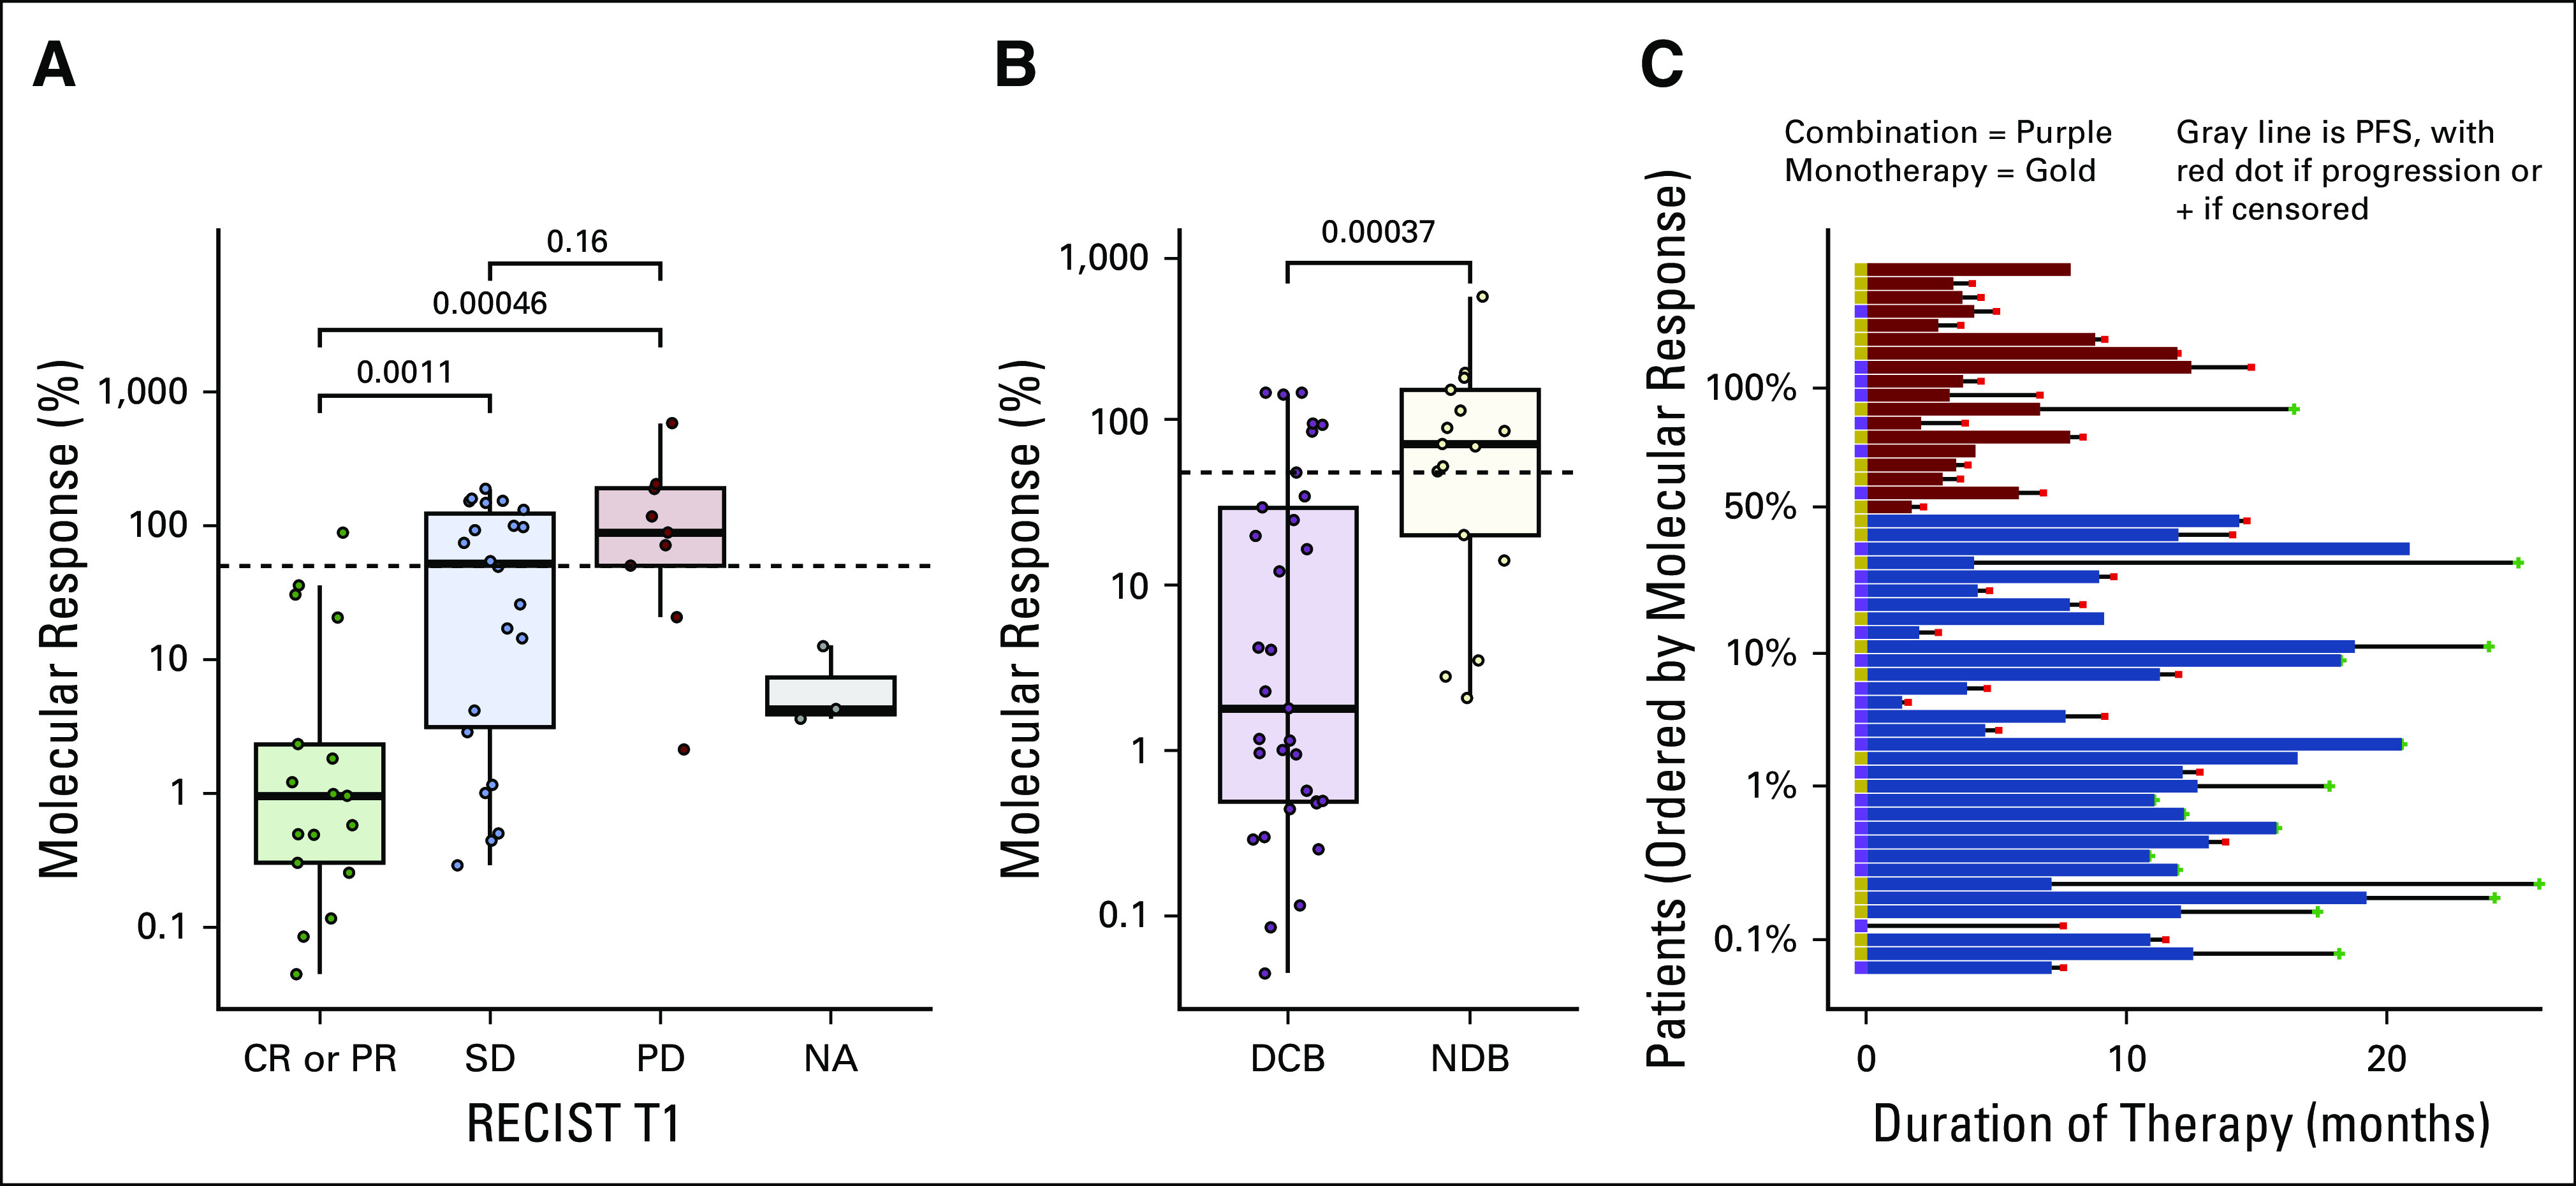
Molecular response and response to pembrolizumab-based therapy. (A) The association between molecular response and RECIST response at week-9 on therapy for the 17 patients with a CR or PR, 22 patients with SD, nine patients with PD, and three patients without a 9-week RECIST response assessment. (B) Association between molecular response and RECIST response at 6 months for the 33 patients achieving a DCB and 17 patients with an NDB. (C) Swimmer plots for each patient showing the duration of pembrolizumab-based therapy arranged by patients with a molecular response (blue) and without a molecular response (red). Patients treated with pembrolizumab monotherapy are denoted with a gold box to the left of the horizontal bar and those treated with pembrolizumab plus chemotherapy with a purple box. CR, complete response; DCB, durable clinical benefit; NA, RECIST not available; NDR, no durable benefit; PD, progressive disease; PR, partial response; SD, stable disease.
We next evaluated whether molecular response was associated with PFS and OS. Patients with a molecular response had significantly longer PFS compared to patients without a molecular response (median PFS 14.1 months v 4.4 months; hazard ratio [HR], 0.25; 95% CI, 0.13 to 0.50) (Fig 3A). OS was also significantly longer among molecular responders (median OS NR [95% CI lower bound 22.1 months] v 12.0 months; HR, 0.27; 95% CI, 0.12 to 0.64) (Fig 3B). Appendix Figure A4 shows the association between molecular response with PFS and OS in the pembrolizumab monotherapy and pembrolizumab plus platinum-based chemotherapy cohorts. Seventeen out of 32 molecular responders had complete clearance of ctDNA at 9 weeks (molecular response = 0%). When compared to molecular nonresponders, patients with complete clearance of ctDNA at 9 weeks had improved PFS (median PFS NR [95% CI lower bound 12.8 months] v 4.4 months; HR, 0.20; 95% CI, 0.08 to 0.50) and OS (median OS NR [95% CI lower bound 21.9 months] v 12.0 months; HR, 0.24; 95% CI, 0.08 to 0.73) (Figs 3C and 3D).
FIG 3.
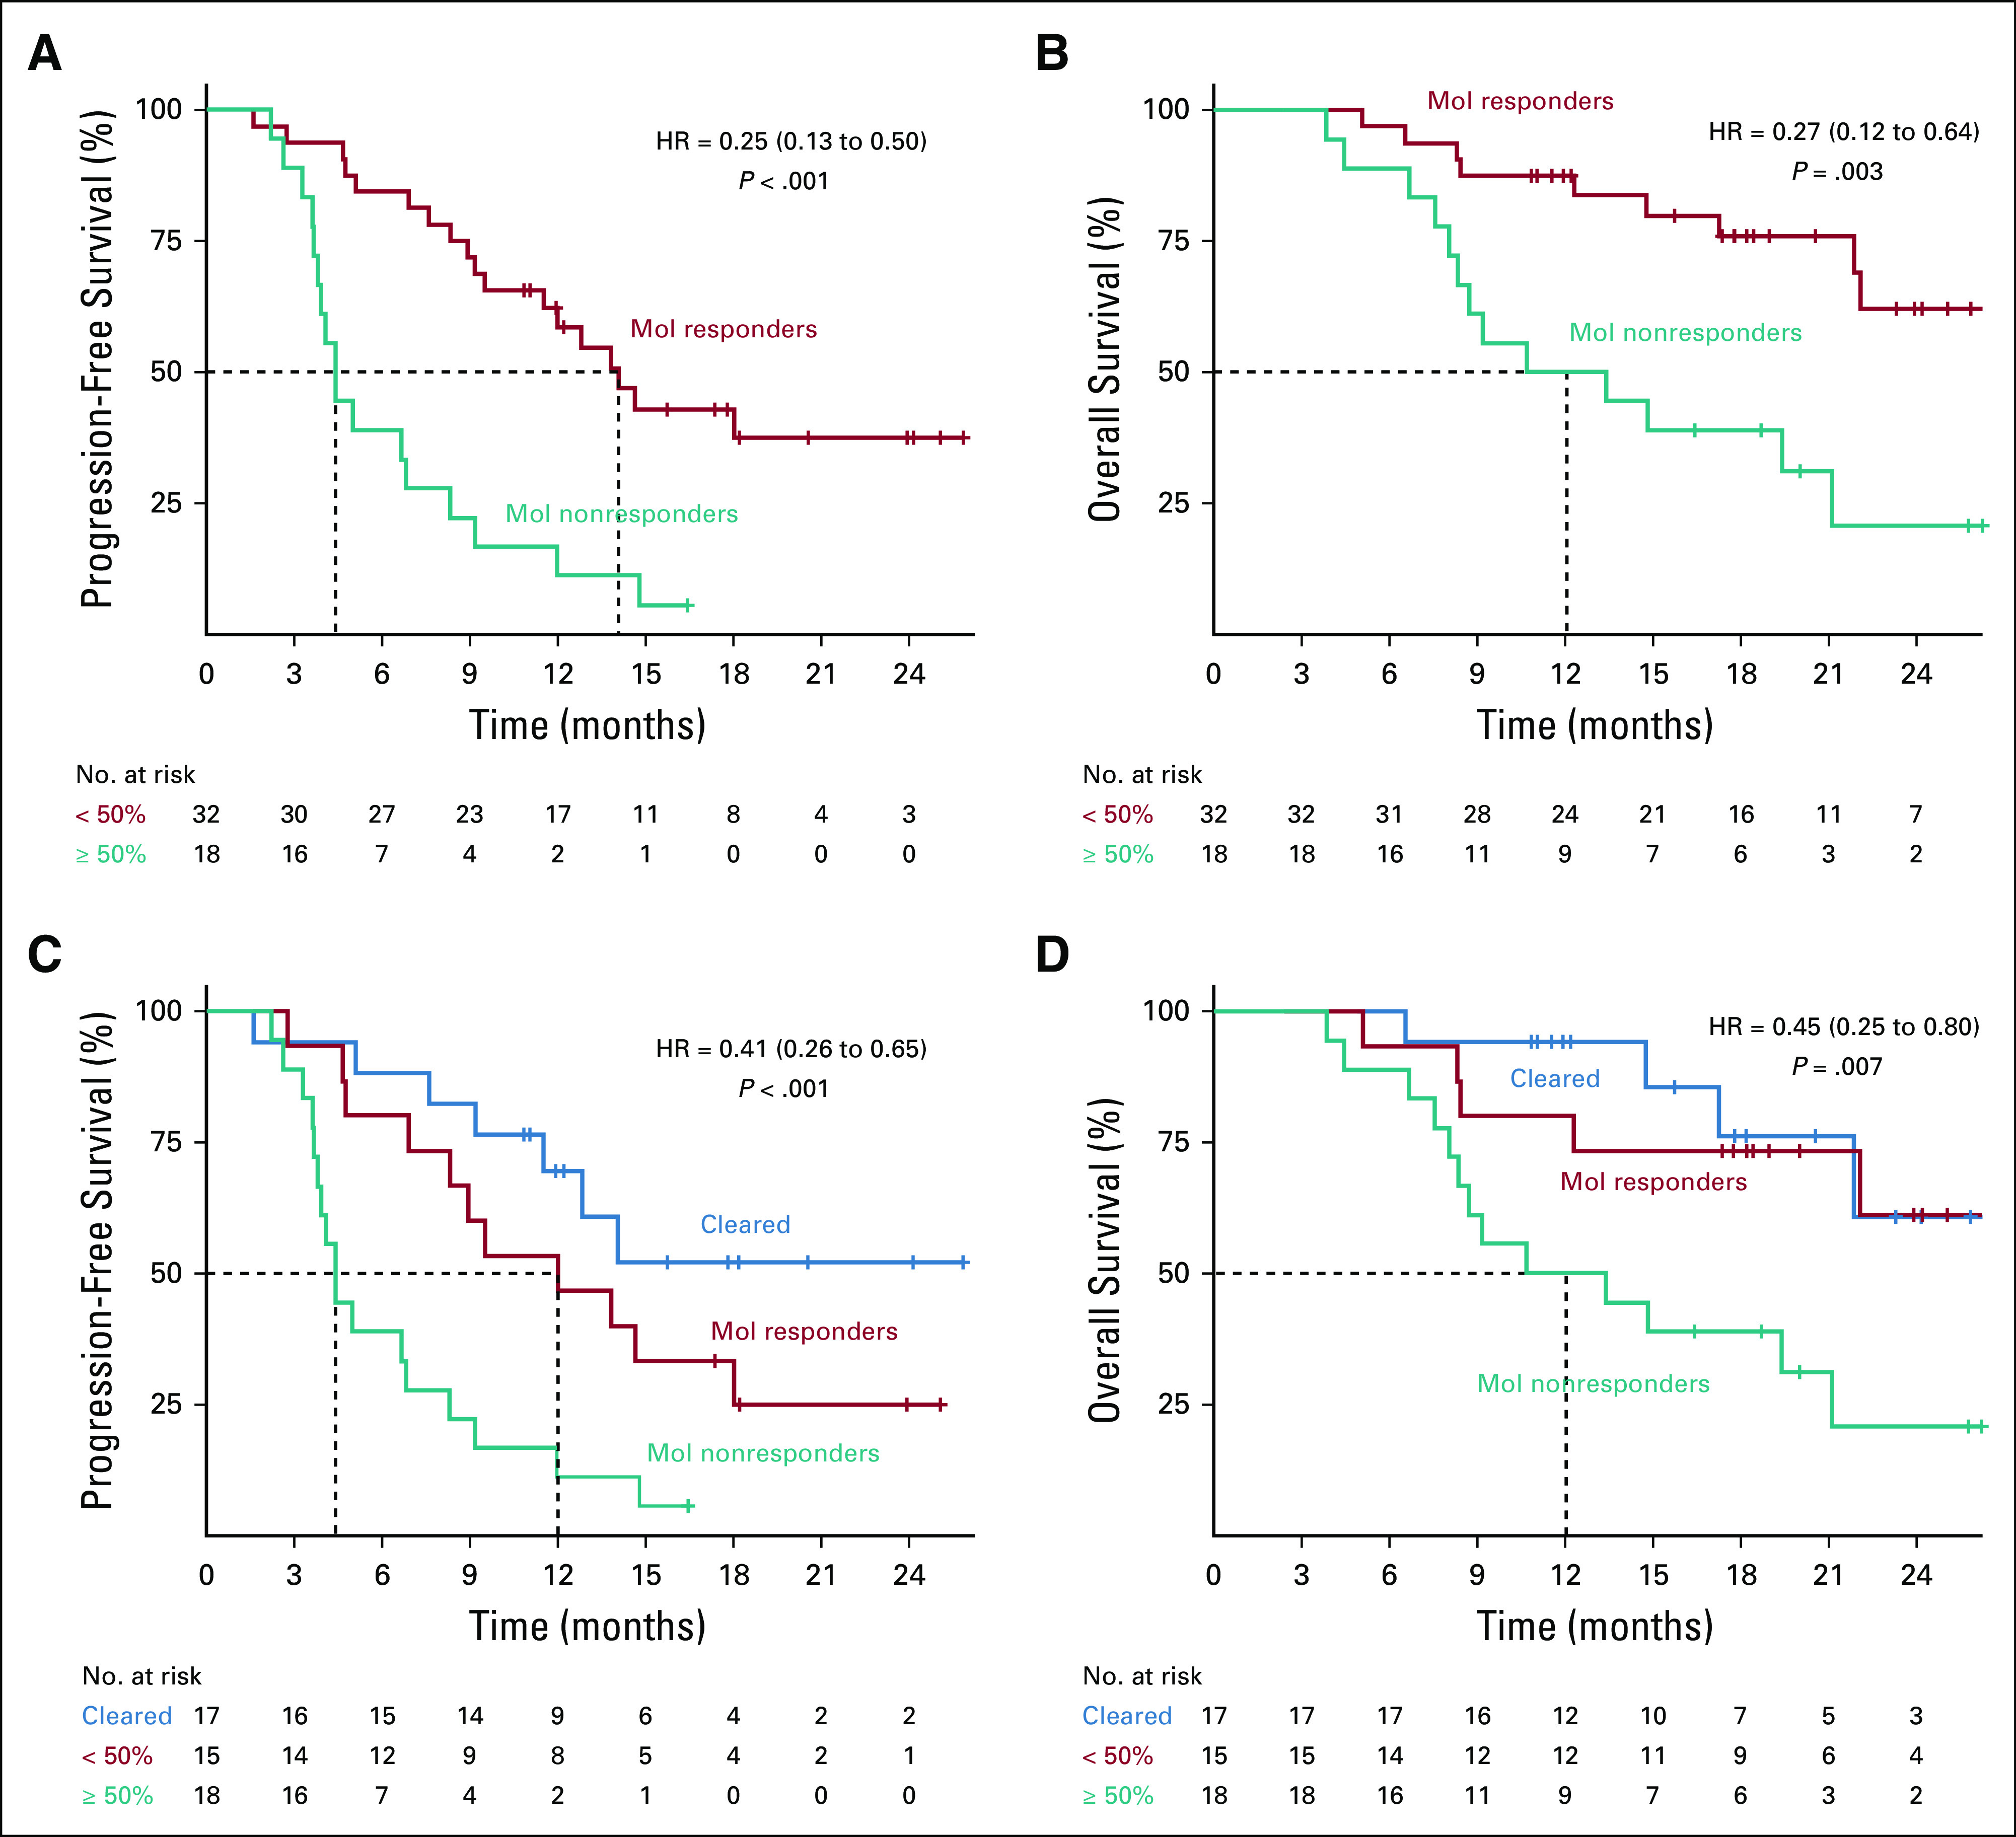
Association of molecular response with survival outcomes. Kaplan-Meier survival curves using a molecular response cutoff of 50% for (A) PFS and (B) OS. Kaplan-Meier survival curves showing patients with complete clearance of ctDNA at 9 weeks (blue), molecular response > 0% (teal), and molecular response > 50% (red) for (C) PFS and (D) OS. Dotted lines show median survival times for each group; median PFS was not reached for patients with ctDNA clearance (C). Median OS was not reached for patients with ctDNA clearance or molecular response but no clearance (D). ctDNA, circulating tumor DNA; OS, overall survival; PFS, progression-free survival.
FIG 4.
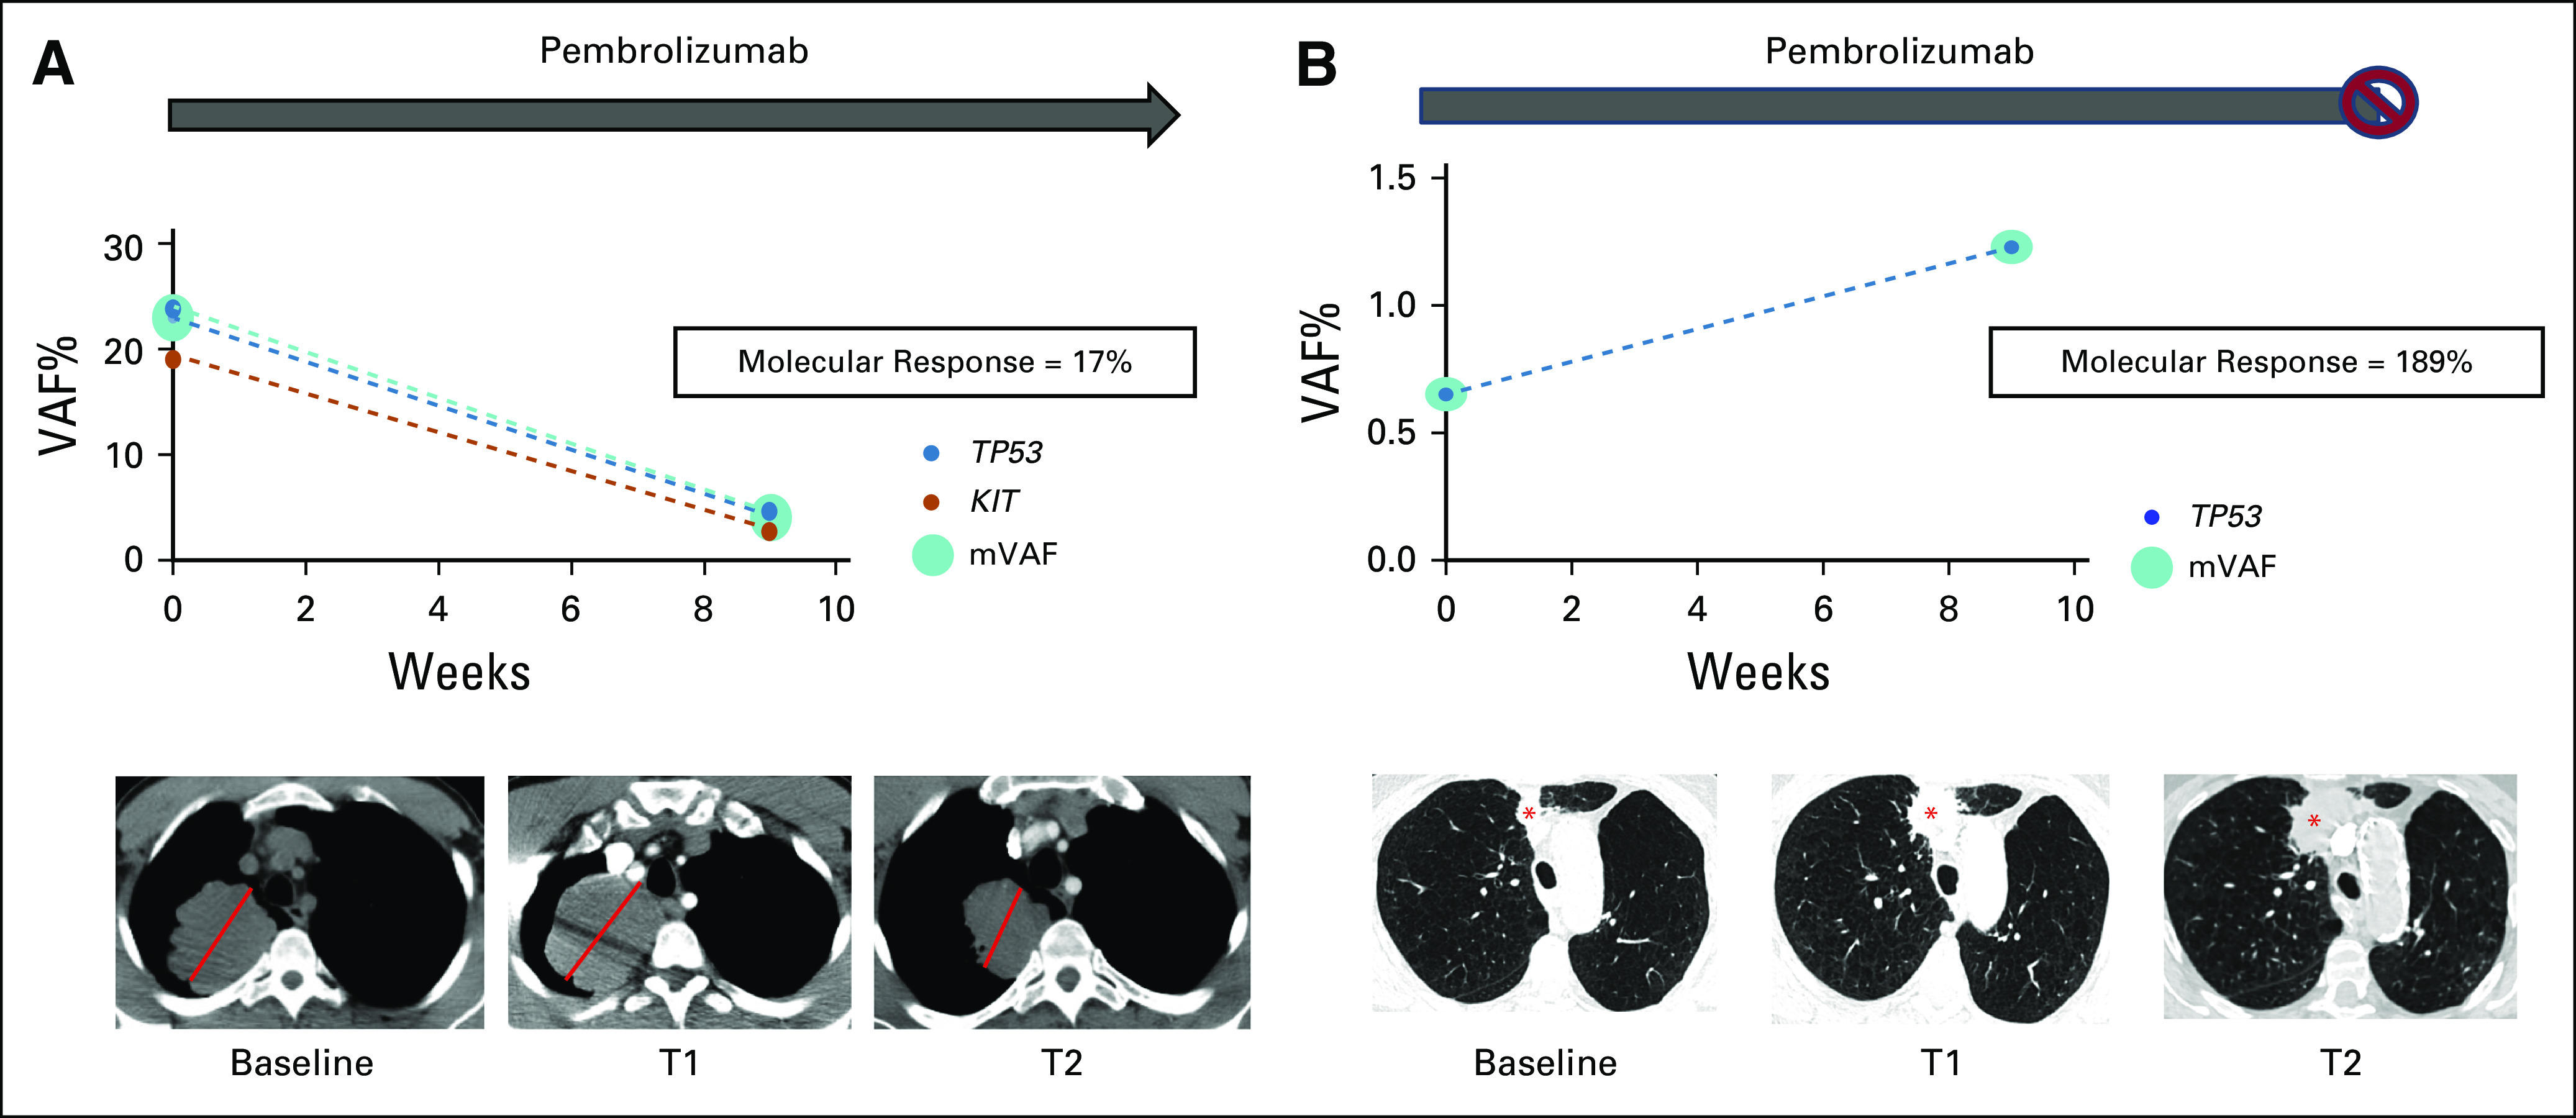
ctDNA molecular response in pseudoprogression versus true progressive disease. (A) Patient with metastatic non–small-cell lung cancer and a dominant 7.0-cm RUL mass (red line) initiated pembrolizumab monotherapy; a 9-week (T1) scan showed an increase in the size of the RUL mass to 7.8 cm along with the development of mediastinal adenopathy. 9-week ctDNA analysis showed a reduction in identified variants with an AF > 0.3% and associated reduction the mean VAF with a molecular response = 17%. Pembrolizumab was continued and a follow-up scan at 16 weeks (T2) showed a reduction in the RUL mass to 6.2 cm and resolution of mediastinal adenopathy. The overall clinical picture was consistent with radiologic pseudoprogression to anti–PD-1 therapy. (B) Patient with newly diagnosed advanced NSCLC with a dominant 1.7-cm nodule in the RUL (red asterisk) initiated pembrolizumab monotherapy; a 9-week (T1) scan showed an increase in this lesion to 3.1 cm suggestive of progressive disease. 9-week ctDNA analysis shows an increase in ctDNA (molecular response = 189%). Pembrolizumab was continued and a repeat chest computed tomography at 13 weeks (T2) showed continued radiographic progression, and pembrolizumab was subsequently discontinued. ctDNA, circulating tumor DNA; RUL, right upper lobe; VAF, variant allele fraction.
Early Molecular Response Assessment to Evaluate the Presence of Pseudoprogression
We also hypothesized that early ctDNA assessment might assist in distinguishing true progression from pseudoprogression in response to immunotherapy. Pseudoprogression has been reported for 2%-8% of patients with NSCLC receiving checkpoint blockade24-29 and frequently confounds clinical decision making in patients receiving immunotherapy. Figure 4A shows a 63-year-old male with newly diagnosed mNSCLC with a 7.0-cm right upper lobe (RUL) mass. Treatment with pembrolizumab monotherapy was initiated, and a 9-week (T1) chest computed tomography (CT) scan showed development of mediastinal adenopathy and an increase in size of the RUL mass to a maximal diameter of 7.8 cm. At week 9, the molecular response value was 17%. Pembrolizumab was continued and a repeat CT chest performed at 16 weeks (T2) showed a reduction in the RUL mass to a maximal diameter of 6.2 cm and interval resolution of mediastinal adenopathy. The overall clinical picture is consistent with radiologic pseudoprogression. This patient had a PFS and OS of 8.9 and 22.1 months, respectively. Figure 4B shows a 77-year-old female with newly diagnosed mNSCLC with a dominant 1.7-cm RUL nodule. The patient initiated pembrolizumab monotherapy, and a 9-week (T1) scan showed an increase in this lesion to 3.1 cm with a + 43% change in target lesions consistent with PD. Molecular response value at week 9 was 189%. Given the possibility of radiographic pseudoprogression, pembrolizumab was continued. However, a repeat chest CT at 13 weeks (T2) because of acute worsening of symptoms showed continued progression, and pembrolizumab was discontinued.
DISCUSSION
This study evaluated the association of molecular response using plasma-based changes in ctDNA levels with radiographic response and outcome in patients with mNSCLC receiving pembrolizumab, either alone or in combination with chemotherapy. The patients in our study were eligible to begin a standard immunotherapy-based regimen, largely representative of a real-world population. The median OS, progression-free survival, and overall response rate were similar to those observed in large phase III trials.2,3 Patients underwent collection of plasma at baseline and at the time of first restaging evaluation. Using a clinically available 74-gene NGS assay, we detected mutations at baseline in 62/67 (93%) patients. Molecular response measured by a VAF ratio calculation was significantly associated with response to pembrolizumab-based therapy at 9 weeks (P < .001) and 6 months (P < .001). Molecular response at 9 weeks had an area under the curve of 0.81 for predicting response at 6 months and was associated with improved PFS (HR, 0.25) and OS (HR, 0.27). These results support the role of assessing on-treatment changes in ctDNA using a clinically available NGS assay to predict short- and long-term efficacy to pembrolizumab-based therapies in NSCLC.
We also demonstrate the potential role for using ctDNA molecular response to facilitate differentiating between true progression and pseudoprogression in patients treated with immunotherapy. Radiologic assessment for restaging remains the gold standard for making treatment decisions for patients on-therapy. Some patients experience delayed tumor shrinkage following an apparent increase in tumor burden after immunotherapy. This phenomenon, called pseudoprogression, can lead to premature cessation of efficacious therapy, and conversely, lead to detrimental outcomes when therapies are continued in the face of real progression. The incidence of pseudoprogression in patients with advanced NSCLC treated with anti–PD-1 or PDL-1 therapy varies from 2% to 8%.24-29 Previous studies have suggested a potential role for assessing ctDNA dynamics in differentiating pseudoprogression from true disease progression.30 Here, we demonstrate the potential clinical utility of combining ctDNA molecular response with radiographic assessment to inform clinical decision making in two cases where there was concern for possible pseudoprogression. These data suggest that ctDNA molecular response may be an effective tool to evaluate therapeutic response when combined with standard of care radiographic correlates.
Although our findings are novel, we are not the first to report a correlation between longitudinal assessment of ctDNA and outcomes following immunotherapy. In a cohort of 24 patients with mNSCLC, Anagnostou et al13 demonstrated that early ctDNA dynamics could predict clinical response and outcome. Using ultrasensitive measures of ctDNA and T-cell expansion, they showed that patients with a clinical response had a complete reduction in ctDNA levels after initiation of therapy, whereas nonresponders had no significant changes or an increase in ctDNA levels. This reduction in ctDNA levels was also associated with improved PFS and OS. A recent study demonstrated that baseline ctDNA concentration and change in ctDNA concentration (using a bespoke, multiplex-PCR, NGS assay) including clearance correlated with progression-free survival, OS, clinical response, and clinical benefit in patients treated with pembrolizumab.15 Although these studies using research-only assays have established proof of principle for use of ctDNA as a dynamic biomarker, they would be difficult to implement in clinical practice. Using a readily available clinical assay would be more clinically relevant, as the results could rapidly be incorporated into routine clinical practice. A recent study by Zhang et al. used a clinically available 73-gene NGS ctDNA assay (an earlier version of the assay used in the present study) and demonstrated the utility of ctDNA as a prognostic and predictive biomarker in patients treated with durvalumab. Similar to our results, they demonstrated that on-treatment reductions in VAF and lower on-treatment VAF were independently associated with longer PFS and OS, and increased objective radiologic response, but not prognostic variables, suggesting that on-treatment ctDNA dynamics were predictive of benefit from immune checkpoint blockade.14 Although these results are similar to our findings, there are two key differences: patients were treated with durvalumab monotherapy or in combination with tremelimumab. Therefore, the results cannot be applied directly to the current real-world clinical management of first-line lung cancer, where patients are often treated with immunotherapy alone, and more often in combination with chemotherapy.
Pembrolizumab-based immunotherapy and chemo-immunotherapy have become standard first-line treatments for patients with mNSCLC without a targetable mutation. Decisions regarding monotherapy versus chemo-immunotherapy are largely based on PDL-1 TPS. PD-L1 TPS is an acknowledged imperfect biomarker, and there is a critical need for novel biomarker approaches to better guide treatment selection. The ability to identify the subgroup of patients more likely to respond to immunotherapy would assist in avoiding unnecessary toxicities, reduce costs, and enable more effective therapies to be delivered. A potential clinical application of our findings could be to use ctDNA molecular response assessment as an early indicator of lack of response to immunotherapy, thus enabling investigators to incorporate additional agents into the therapeutic regimen or to rapidly enroll patients into clinical trials.
Our study does have limitations. It is a single-center, nonrandomized study, with a relatively small number of patients. Although the timing of on-treatment ctDNA assessment at 9 weeks was uniform across our study, an ideal time to assess molecular response remains to be defined. An earlier time point, for example, at 3 or 6 weeks before radiographic assessment, may be even more clinically meaningful as a measure of early response. Furthermore, the formula for calculation of molecular response is not definitive, and further prospective studies are clearly required to validate our findings. The role of molecular response assessment in differentiating pseudoprogression from true progression is a relevant clinical question that should be further explored, as our study was not powered to address this question. If these results are substantiated, molecular response using serial plasma-based NGS could eventually be integrated into routine management of patients with mNSCLC receiving immunotherapy.
In summary, molecular response assessment using plasma NGS is significantly associated with therapeutic response and outcomes in patients with mNSCLC receiving pembrolizumab-based therapy. Future studies are needed to assess whether this may be used as a disease evaluation tool to influence treatment decisions.
Appendix
FIG A1.
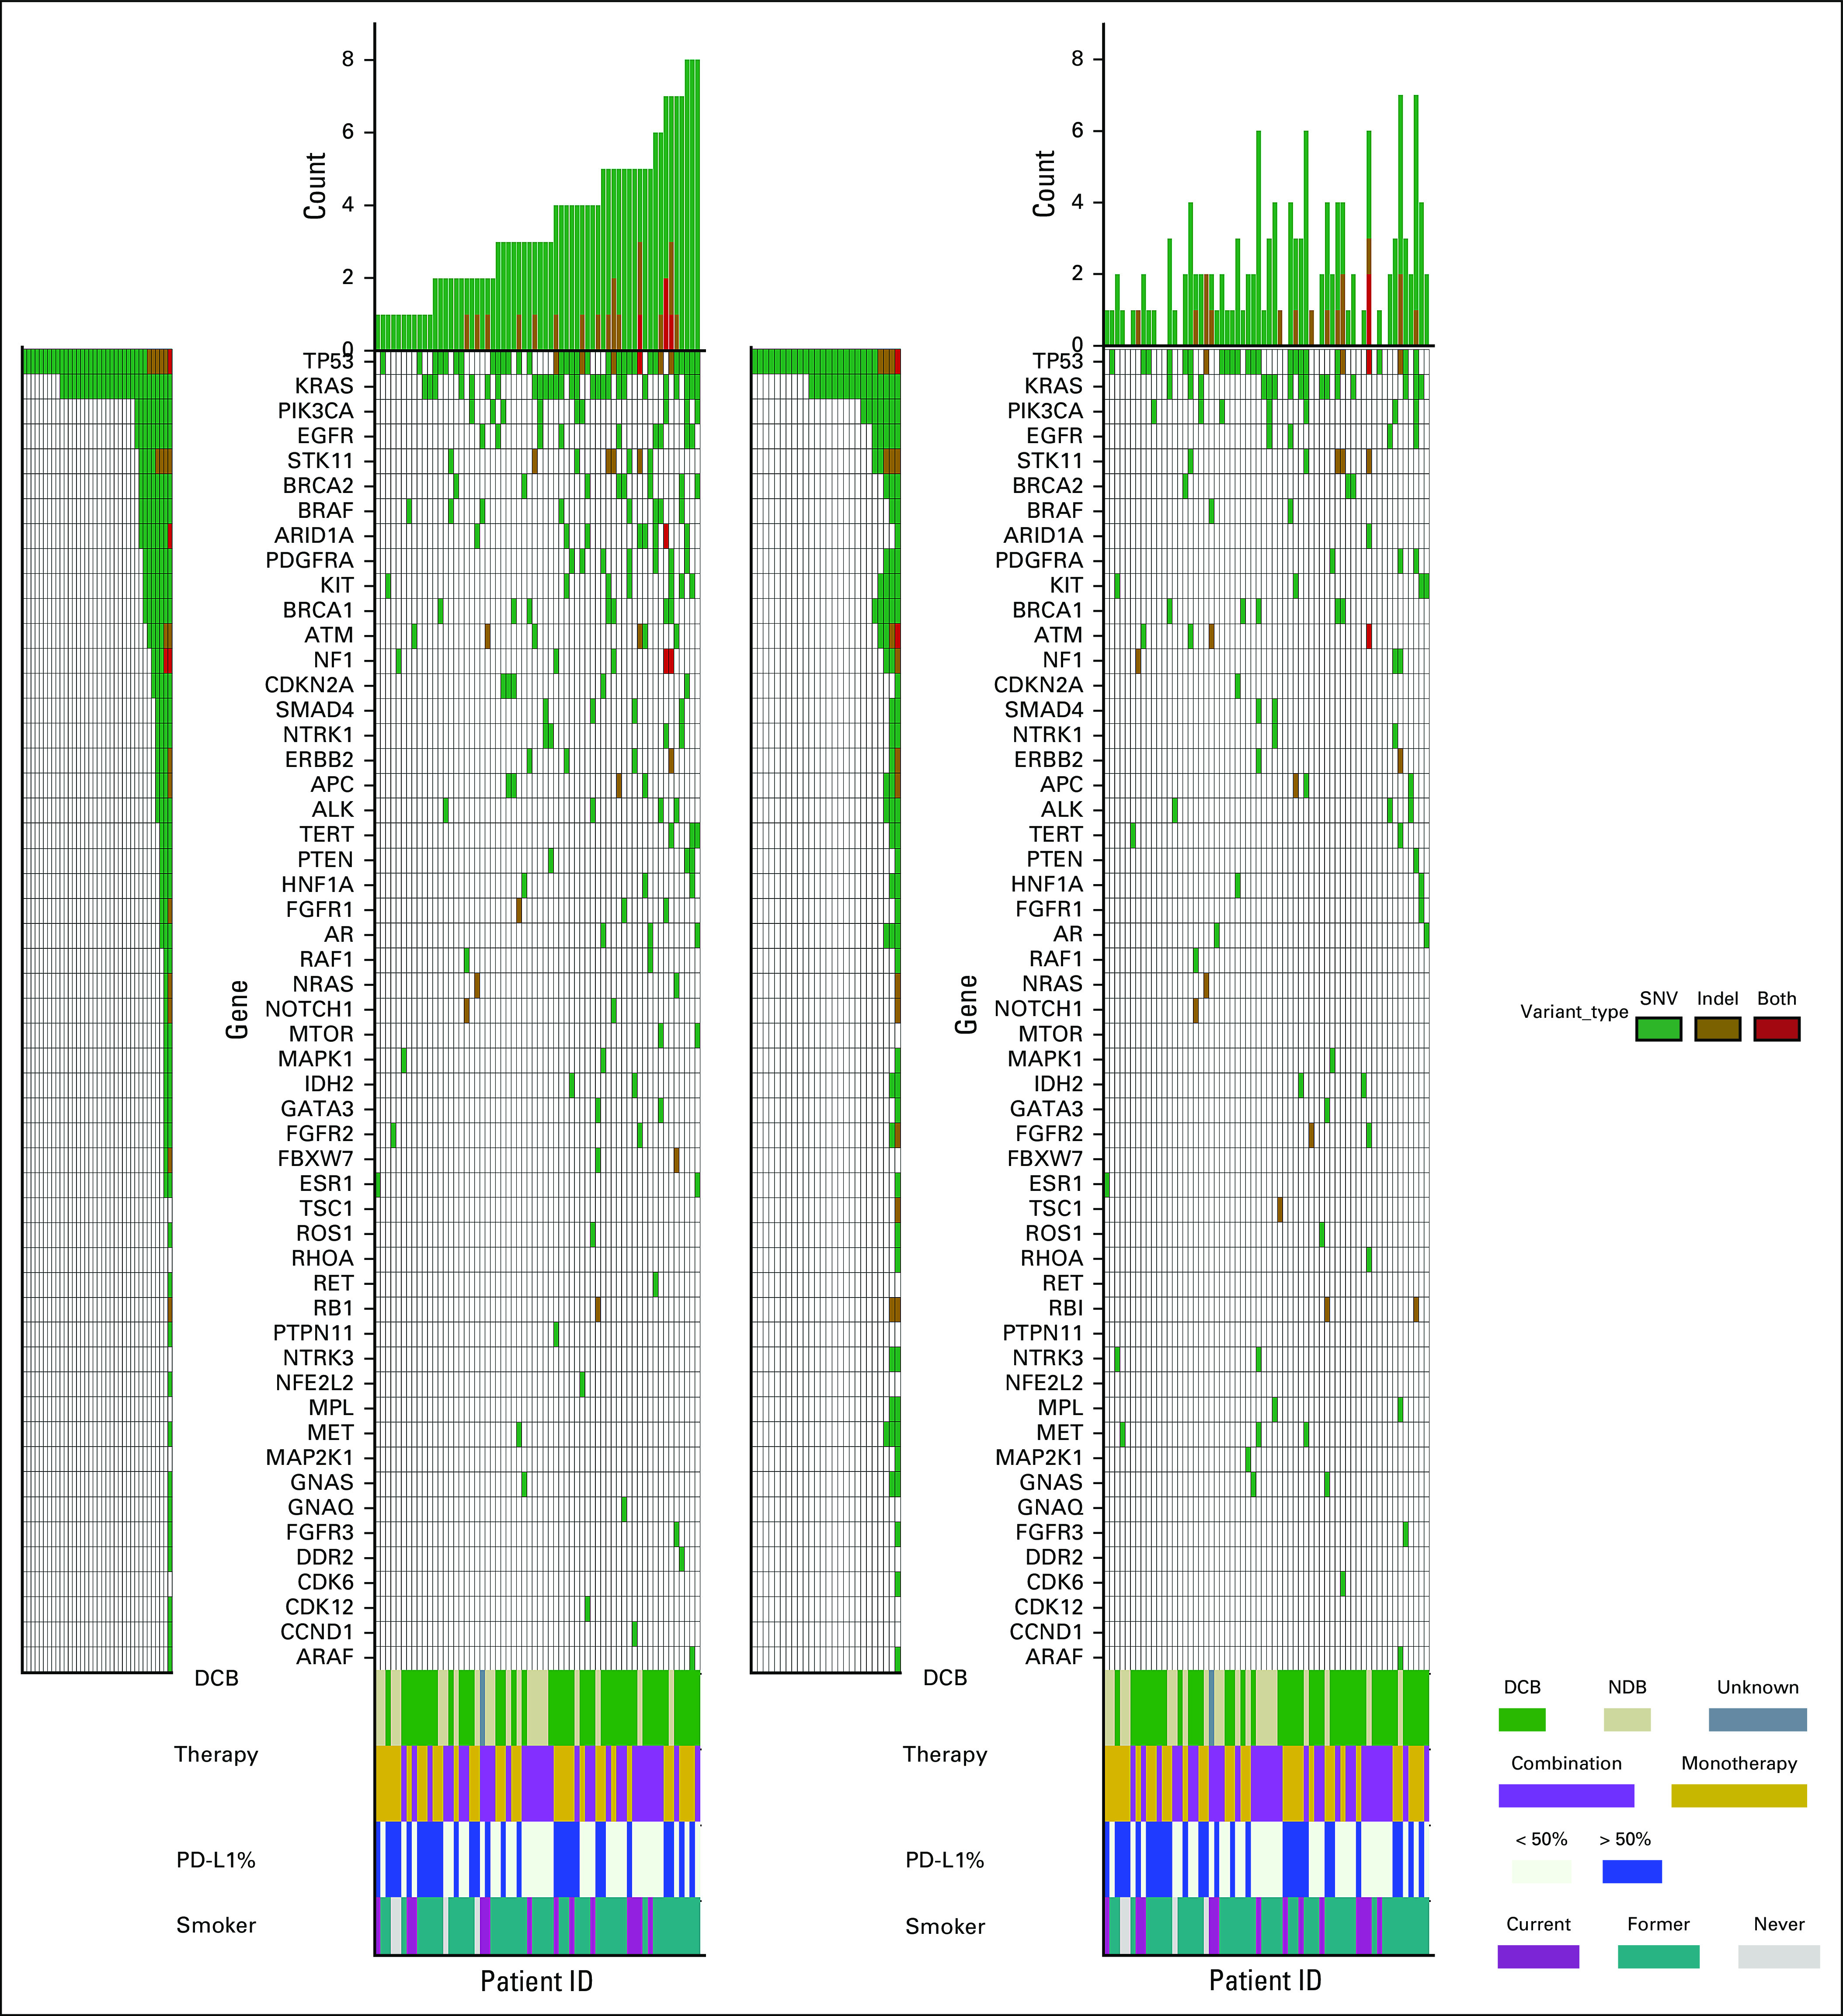
Somatic variant landscape at baseline and 9 weeks. Pretreatment (left panel) and on-treatment (right panel) ctDNA analysis showing nonsynonymous variants (green), indels (golden brown), or both (red) detected in each gene for the 62 patients with at least one baseline mutation identified. Number of variants detected in each patient is represented by the height of the bars and patients are arranged in increasing order. Rows indicate assessment of response at 6 months with DCB (green), NDB (beige), and one patient without a 6-month assessment (dark gray); treatment with pembrolizumab monotherapy (gold) or pembrolizumab plus chemotherapy (light purple); smoking status with current (dark purple), former (teal), and never smokers (light gray); and PD-L1 status with PD-L1 > 50% (dark blue). DCB, durable clinical benefit; NDR, no durable benefit; PD-L1, programmed death ligand 1.
FIG A2.
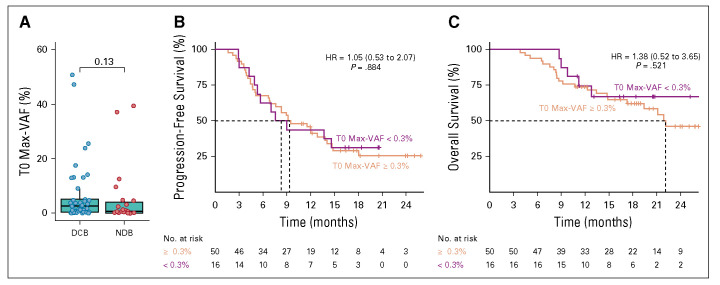
Comparison between molecular response evaluable and unevaluable cohorts. Response and outcomes for the 50 patients with a molecular response evaluable cohort (baseline Max-VAF > 0.3%) compared to the 16 patients in the unevaluable cohort (baseline Max-VAF < 0.3%). One patient in the evaluable cohort was lost to follow-up. (A) Baseline Max-VAF detected and RECIST response at 6 months. Kaplan-Meier survival curves using a cutoff baseline Max-VAF of > 0.3% for (B) progression-free survival and (C) overall survival. HR, hazard ratio; VAF, variant allele fraction.
FIG A3.

Assessment of differing methods to calculate molecular response to predict response and outcome. Comparison of different molecular response calculations to predict 9-week RECIST response and outcome. ROC curves using the different molecular response calculations to predict 6-month RECIST response. Three previously published molecular response calculations were assessed for correlation with response and outcome. Delta mean VAF (blue) = mean VAF on treatment − mean VAF at baseline.11 Relative delta (red) mean VAF = (mean VAF on treatment − mean VAF at baseline)/mean VAF at baseline.8 Ratio mean VAF Score (teal) = mVAF on-treatment/mVAF baseline.14 AUC, area under the curve; CR, complete response; HR, hazard ratio; OS, overall survival; PD, progressive disease; PFS, progression-free survival; PR, partial response; SD, stable disease; VAF, variant allele fraction.
FIG A4.
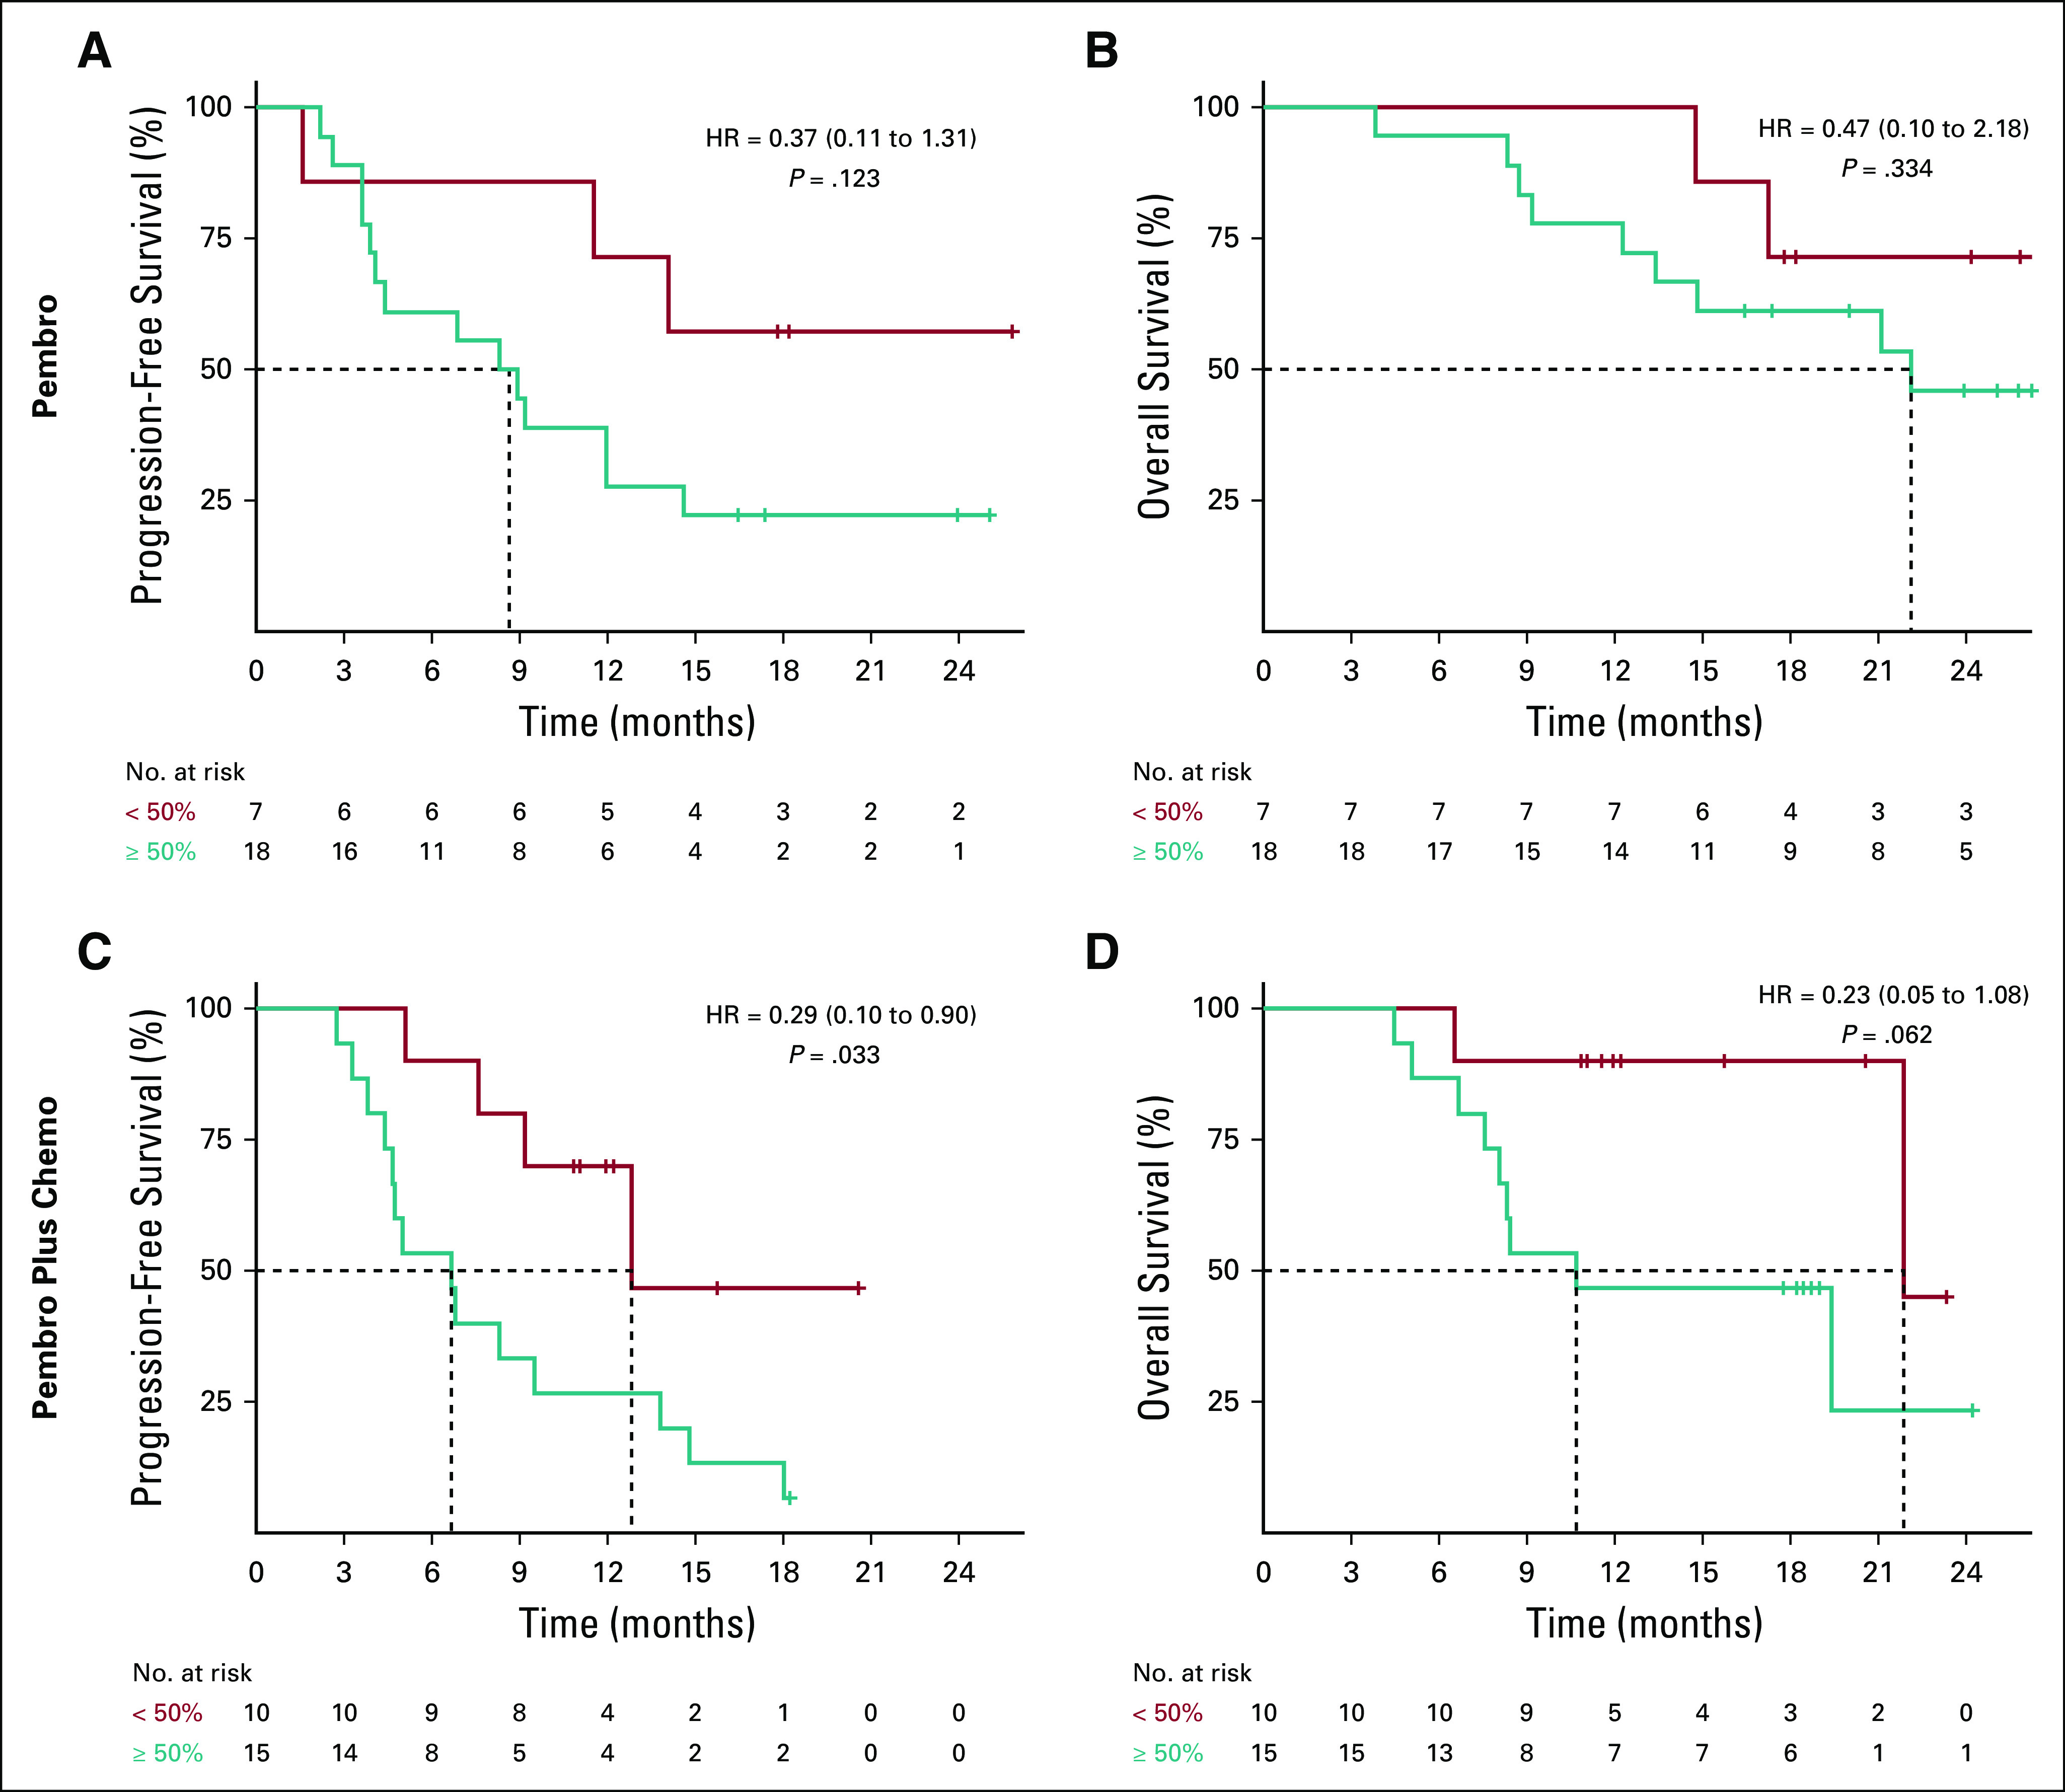
Association of molecular response with survival outcomes in treatment cohorts. Kaplan-Meier survival curves using a molecular response cutoff of 50% for (A) progression-free survival and (B) overall survival for patients treated with pembrolizumab monotherapy. Kaplan-Meier survival curves using a molecular response cutoff of 50% for (C) progression-free survival and (C) overall survival for patients treated with pembrolizumab plus chemotherapy. HR, hazard ratio.
SUPPORT
Supported in part by Merck & Co., the National Cancer Institute at the National Institutes of Health (CA234225-02), the LUNGevity Foundation, and the Penn Center for Precision Medicine Accelerator Fund.
J.C.T and E.L.C contributed equally to this work.
AUTHOR CONTRIBUTIONS
Conception and design: Jeffrey C. Thompson, Erica L. Carpenter, Jamie Rosenstein, Lesli A. Kiedrowski, Rebecca J. Nagy, Corey J. Langer, Charu Aggarwal
Financial support: Jeffrey C. Thompson, Charu Aggarwal
Administrative support: Jeffrey C. Thompson, Stephanie S. Yee, Taylor A. Black, Charu Aggarwal
Provision of study materials or patients: Jeffrey C. Thompson, Erica L. Carpenter, Aditi P. Singh, Joshua M. Bauml, Roger B. Cohen, Corey J. Langer, Charu Aggarwal
Collection and assembly of data: Jeffrey C. Thompson, Erica L. Carpenter, Benjamin A. Silva, Jamie Rosenstein, Martina Lefterova, Rebecca J. Nagy, Sharyn I. Katz, Stephanie S. Yee, Taylor A. Black, Corey J. Langer, Charu Aggarwal
Data analysis and interpretation: All authors
Manuscript writing: All authors
Final approval of manuscript: All authors
Accountable for all aspects of the work: All authors
AUTHORS' DISCLOSURES OF POTENTIAL CONFLICTS OF INTEREST
The following represents disclosure information provided by authors of this manuscript. All relationships are considered compensated unless otherwise noted. Relationships are self-held unless noted. I = Immediate Family Member, Inst = My Institution. Relationships may not relate to the subject matter of this manuscript. For more information about ASCO's conflict of interest policy, please refer to www.asco.org/rwc or ascopubs.org/po/author-center.
Open Payments is a public database containing information reported by companies about payments made to US-licensed physicians (Open Payments).
Jeffrey C. Thompson
Consulting or Advisory Role: OncoCyte, AstraZeneca, Guardant Health
Erica L. Carpenter
Honoraria: AstraZeneca
Consulting or Advisory Role: Bristol-Myers Squibb
Research Funding: Merck, Janssen, Becton Dickinson, United Health Group
Patents, Royalties, Other Intellectual Property: Invention disclosure titled "Methods and Compositions for Treating Neuroblastoma", and invention disclosure titled "Methods and Compositions for Identifying, Diagnosing and Treating Neuroblastoma"
Travel, Accommodations, Expenses: AstraZeneca, Foundation Medicine,
Katie Quinn
Employment: Guardant Health
Stock and Other Ownership Interests: Guardant Health
Carin R. Espenschied
Employment: Guardant Health
Stock and Other Ownership Interests: Guardant Health
Allysia Mak
Employment: Guardant Health
Stock and Other Ownership Interests: Guardant Health
Lesli A. Kiedrowski
Employment: Guardant Health
Stock and Other Ownership Interests: Guardant Health
Martina Lefterova
Employment: Guardant Health
Stock and Other Ownership Interests: Guardant Health
Consulting or Advisory Role: Personalis
Rebecca J. Nagy
Employment: Guardant Health
Stock and Other Ownership Interests: Guardant Health
Sharyn I. Katz
Consulting or Advisory Role: Trizell
Research Funding: Novartis
Christine A. Ciunci
Honoraria: Imedex
Research Funding: Celgene, Merck, Bristol-Myers Squibb, MacroGenics
Joshua M. Bauml
Consulting or Advisory Role: Bristol-Myers Squibb, Merck, AstraZeneca, Genentech, Celgene, Boehringer Ingelheim, Guardant Health, Takeda, Novartis, Janssen, Ayala Pharmaceuticals, Regeneron, Inivata, Foundation Medicine
Research Funding: Merck, Carevive Systems, Novartis, Incyte, Bayer, Janssen, AstraZeneca, Takeda, Amgen, Pfizer, Mirati Therapeutics
Roger B. Cohen
Consulting or Advisory Role: Heat Biologics, Innate Pharma, Cantargia AB, Genocea Biosciences, AstraZeneca
Research Funding: Heat Biologics, Merck, Celldex, Innate Pharma, Kyn therapeutics, Xencor, Genocea Biosciences
Travel, Accommodations, Expenses: Heat Biologics, Innate Pharma, Genocea Biosciences
Corey J. Langer
Honoraria: Bristol-Myers Squibb, Genentech/Roche, Lilly/ImClone, AstraZeneca, Takeda Science Foundation, Merck
Consulting or Advisory Role: Genentech/Roche, Lilly/ImClone, Merck, Abbott Biotherapeutics, Bayer/Onyx, Clarient, Clovis Oncology, Celgene, Cancer Support Community, Bristol-Myers Squibb, ARIAD, Takeda, AstraZeneca, Pfizer, Novocure, Gilead Sciences
Research Funding: Merck, Advantagene, Clovis Oncology, Celgene, Inovio Pharmaceuticals, Ariad, GlaxoSmithKline, Genentech/Roche, Stem CentRx, Lilly, Trizell
Other Relationship: Lilly, Amgen, Peregrine Pharmaceuticals, Synta
Charu Aggarwal
Consulting or Advisory Role: Genentech, Lilly, Celgene, Merck, AstraZeneca
Speakers' Bureau: AstraZeneca, Roche/Genentech, An Immediate Family Member
Research Funding: Genentech/Roche, Incyte, Macrogenics, Merck Sharp & Dohme, AstraZeneca/MedImmune
No other potential conflicts of interest were reported.
REFERENCES
- 1.Mok TSK, Wu YL, Kudaba I, et al. : Pembrolizumab versus chemotherapy for previously untreated, PD-L1-expressing, locally advanced or metastatic non-small-cell lung cancer (KEYNOTE-042): A randomised, open-label, controlled, phase 3 trial. Lancet 393:1819-18302019 [DOI] [PubMed] [Google Scholar]
- 2.Gandhi L, Rodriguez-Abreu D, Gadgeel S, et al. : Pembrolizumab plus chemotherapy in metastatic non-small-cell lung cancer. N Engl J Med 378:2078-20922018 [DOI] [PubMed] [Google Scholar]
- 3.Reck M, Rodriguez-Abreu D, Robinson AG, et al. : Pembrolizumab versus chemotherapy for PD-L1-positive non-small-cell lung cancer. N Engl J Med 375:1823-18332016 [DOI] [PubMed] [Google Scholar]
- 4.Paz-Ares L, Luft A, Vicente D, et al. : Pembrolizumab plus chemotherapy for squamous non-small-cell lung cancer. N Engl J Med 379:2040-20512018 [DOI] [PubMed] [Google Scholar]
- 5.Hellmann MD, Nathanson T, Rizvi H, et al. : Genomic features of response to combination immunotherapy in patients with advanced non-small-cell lung cancer. Cancer Cell 33:843-852 e42018 [DOI] [PMC free article] [PubMed] [Google Scholar]
- 6.Ott PA, Bang YJ, Piha-Paul SA, et al. : T-cell-inflamed gene-expression profile, programmed death ligand 1 expression, and tumor mutational burden predict efficacy in patients treated with pembrolizumab across 20 cancers: KEYNOTE-028. J Clin Oncol 37:318-3272018 [DOI] [PubMed] [Google Scholar]
- 7.Aggarwal C, Thompson JC, Chien AL, et al. : Baseline plasma tumor mutation burden predicts response to pembrolizumab-based therapy in patients with metastatic non-small cell lung cancer. Clin Cancer Res 26:2354-23612020 [DOI] [PMC free article] [PubMed] [Google Scholar]
- 8.Kim ST, Cristescu R, Bass AJ, et al. : Comprehensive molecular characterization of clinical responses to PD-1 inhibition in metastatic gastric cancer. Nat Med 24:1449-14582018 [DOI] [PubMed] [Google Scholar]
- 9.Siravegna G, Lazzari L, Crisafulli G, et al. : Radiologic and genomic evolution of individual metastases during HER2 blockade in colorectal cancer. Cancer Cell 34:148-162 e72018 [DOI] [PubMed] [Google Scholar]
- 10.Phallen J, Leal A, Woodward BD, et al. : Early noninvasive detection of response to targeted therapy in non-small cell lung cancer. Cancer Res 79:1204-12132019 [DOI] [PMC free article] [PubMed] [Google Scholar]
- 11.Raja R, Kuziora M, Brohawn PZ, et al. : Early reduction in ctDNA predicts survival in patients with lung and bladder cancer treated with durvalumab. Clin Cancer Res 24:6212-62222018 [DOI] [PubMed] [Google Scholar]
- 12.Goldberg SB, Narayan A, Kole AJ, et al. : Early assessment of lung cancer immunotherapy response via circulating tumor DNA. Clin Cancer Res 24:1872-18802018 [DOI] [PMC free article] [PubMed] [Google Scholar]
- 13.Anagnostou V, Forde PM, White JR, et al. : Dynamics of tumor and immune responses during immune checkpoint blockade in non-small cell lung cancer. Cancer Res 79:1214-12252019 [DOI] [PMC free article] [PubMed] [Google Scholar]
- 14.Zhang Q, Luo J, Wu S, et al. : Prognostic and predictive impact of circulating tumor DNA in patients with advanced cancers treated with immune checkpoint blockade. Cancer Discov 10:1842-18532020 [DOI] [PMC free article] [PubMed] [Google Scholar]
- 15.Bratman SV, Yang SYC, Iafolla MAJ, et al. : Personalized circulating tumor DNA analysis as a predictive biomarker in solid tumor patients treated with pembrolizumab. Nat Cancer 1:873-8812020 [DOI] [PubMed] [Google Scholar]
- 16.Lanman RB, Mortimer SA, Zill OA, et al. : Analytical and clinical validation of a digital sequencing panel for quantitative, highly accurate evaluation of cell-free circulating tumor DNA. PLoS One 10:e0140712.2015 [DOI] [PMC free article] [PubMed] [Google Scholar]
- 17.Odegaard JI, Vincent JJ, Mortimer S, et al. : Validation of a plasma-based comprehensive cancer genotyping assay utilizing orthogonal tissue- and plasma-based methodologies. Clin Cancer Res 24:3539-35492018 [DOI] [PubMed] [Google Scholar]
- 18.Willis J, Lefterova MI, Artyomenko A, et al. : Validation of microsatellite instability detection using a comprehensive plasma-based genotyping panel. Clin Cancer Res 25:7035-70452019 [DOI] [PubMed] [Google Scholar]
- 19.Helman E, Artieri C, Vowles JV, et al. : Abstract 5603: Analytical validation of a comprehensive 500-gene ctDNA panel designed for immuno-oncology and DNA damage research. Cancer Res 78:5603.2018 [Google Scholar]
- 20.Quinn K, Helman E, Nance T, et al. : Development and analytical validation of a plasma-based tumor mutational burden (TMB) score from next-generation sequencing panels. Ann Oncol 29:viii-412018 [Google Scholar]
- 21.Nance T, Helman E, Artieri C, et al. : Abstract 4272: A novel approach to differentiation of somatic vs. germline variants in liquid biopsies using a betabinomial model. Cancer Res 78:4272.2018 [Google Scholar]
- 22.Cabel L, Riva F, Servois V, et al. : Circulating tumor DNA changes for early monitoring of anti-PD1 immunotherapy: A proof-of-concept study. Ann Oncol 28:1996-20012017 [DOI] [PubMed] [Google Scholar]
- 23.Skoulidis F, Goldberg ME, Greenawalt DM, et al. : STK11/LKB1 mutations and PD-1 inhibitor resistance in KRAS-mutant lung adenocarcinoma. Cancer Discov 8:822-8352018 [DOI] [PMC free article] [PubMed] [Google Scholar]
- 24.Rizvi NA, Mazieres J, Planchard D, et al. : Activity and safety of nivolumab, an anti-PD-1 immune checkpoint inhibitor, for patients with advanced, refractory squamous non-small-cell lung cancer (CheckMate 063): A phase 2, single-arm trial. Lancet Oncol 16:257-2652015 [DOI] [PMC free article] [PubMed] [Google Scholar]
- 25.Gandara DR, von Pawel J, Mazieres J, et al. : Atezolizumab treatment beyond progression in advanced NSCLC: Results from the randomized, phase III OAK study. J Thorac Oncol 13:1906-19182018 [DOI] [PubMed] [Google Scholar]
- 26.Tazdait M, Mezquita L, Lahmar J, et al. : Patterns of responses in metastatic NSCLC during PD-1 or PDL-1 inhibitor therapy: Comparison of RECIST 1.1, irRECIST and iRECIST criteria. Eur J Cancer 88:38-472018 [DOI] [PubMed] [Google Scholar]
- 27.Ferrara R, Caramella C, Besse B, et al. : Pseudoprogression in non-small cell lung cancer upon immunotherapy: Few drops in the ocean? J Thorac Oncol 14:328-3312019 [DOI] [PubMed] [Google Scholar]
- 28.Katz SI, Hammer M, Bagley SJ, et al. : Radiologic pseudoprogression during anti-PD-1 therapy for advanced non-small cell lung cancer. J Thorac Oncol 13:978-9862018 [DOI] [PubMed] [Google Scholar]
- 29.Ferrara R, Mezquita L, Texier M, et al. : Hyperprogressive disease in patients with advanced non-small cell lung cancer treated with PD-1/PD-L1 inhibitors or with single-agent chemotherapy. JAMA Oncol 4:1543-15522018 [DOI] [PMC free article] [PubMed] [Google Scholar]
- 30.Guibert N, Mazieres J, Delaunay M, et al. : Monitoring of KRAS-mutated ctDNA to discriminate pseudo-progression from true progression during anti-PD-1 treatment of lung adenocarcinoma. Oncotarget 8:38056-380602017 [DOI] [PMC free article] [PubMed] [Google Scholar]


