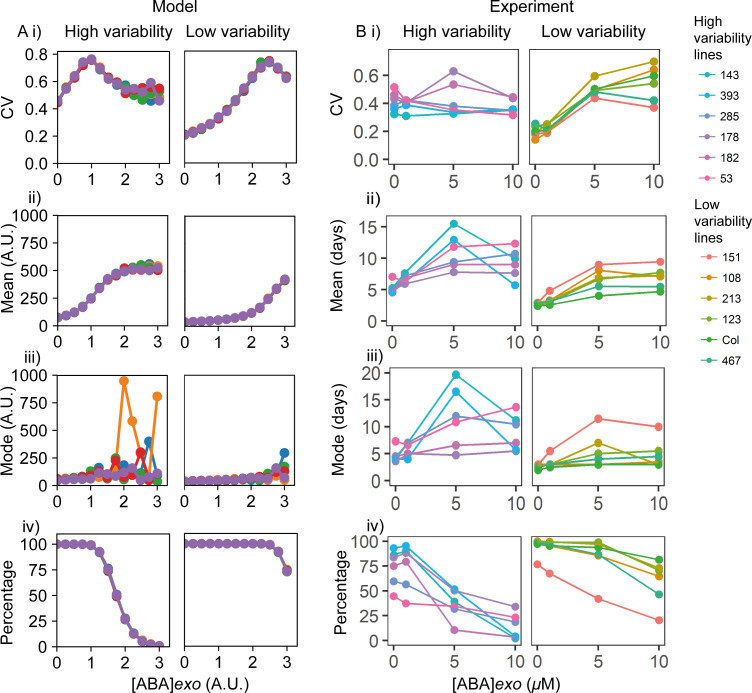
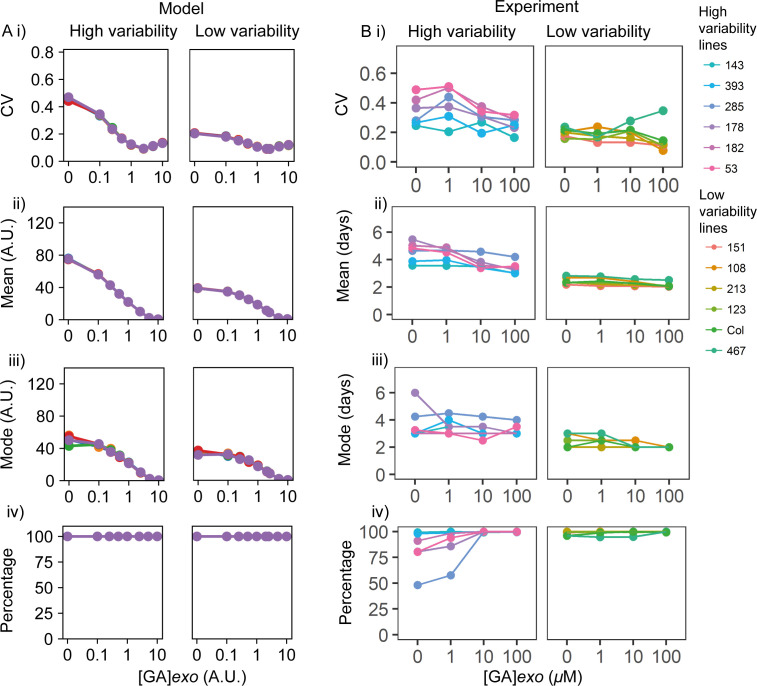
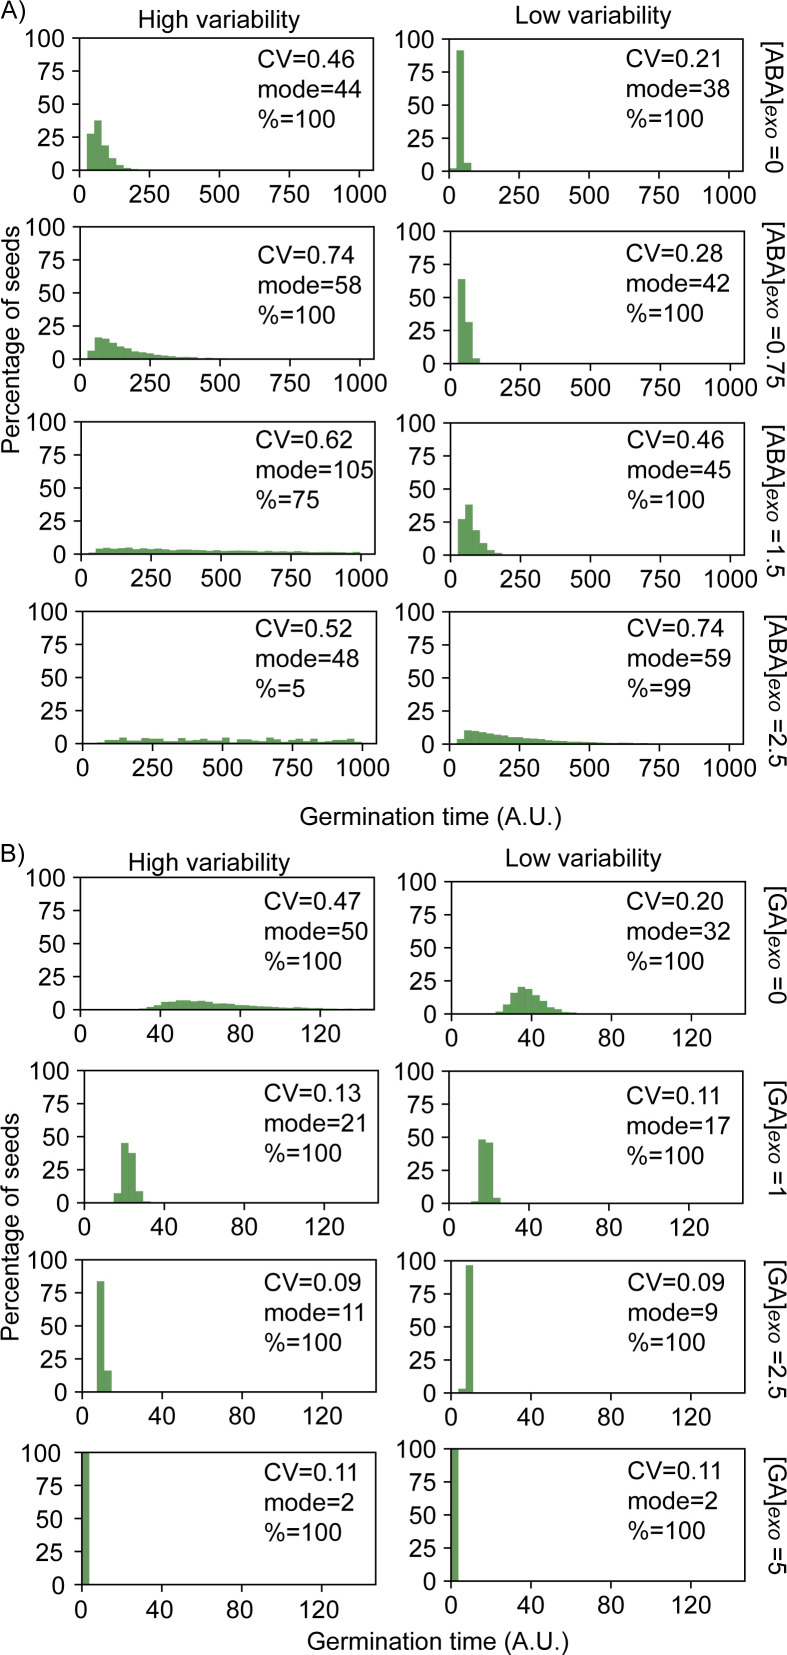
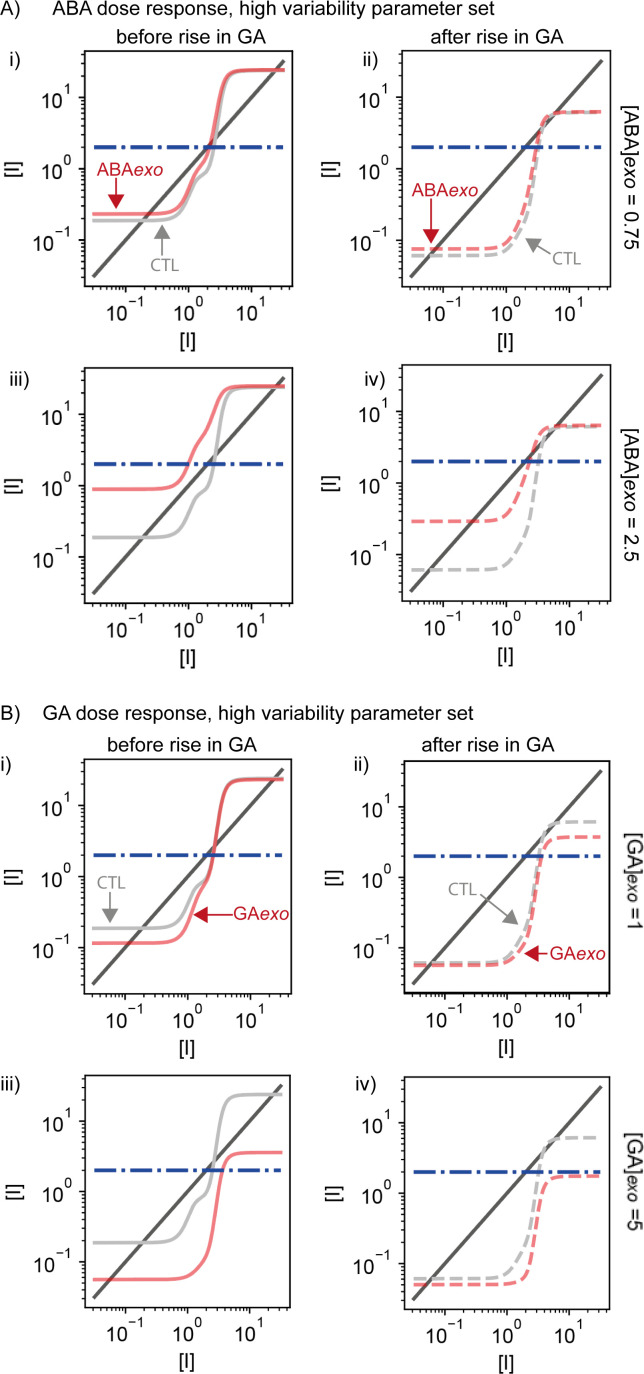
Figure 6. Exogenous addition of abscisic acid (ABA) to high and low variability lines.
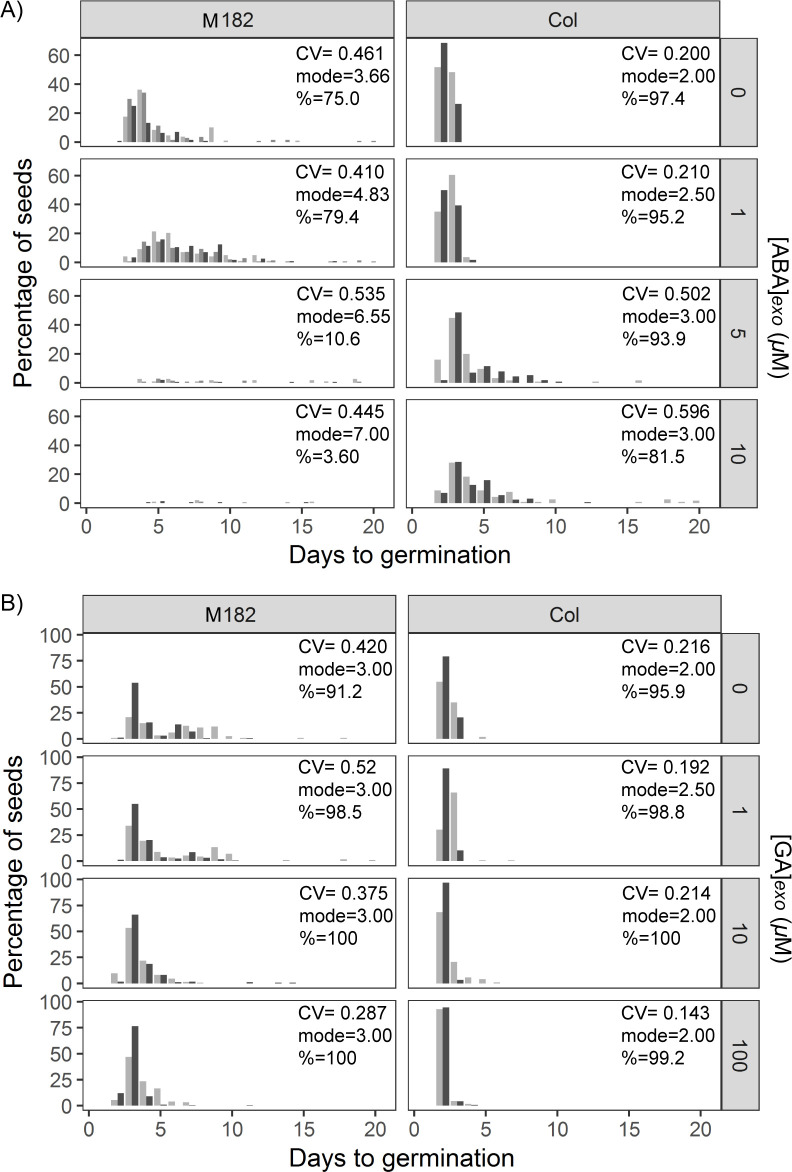
(A) Simulations of addition of increasing doses of exogenous ABA (x-axes), starting from a point in the parameter space that shows higher seed germination time variability (left) and lower variability (right) when no exogenous ABA is added. High variability in seed germination time is simulated with a lower value of the ABA threshold for I production (θI,ABA ) (i.e. higher ABA sensitivity) than low variability in seed germination time. Plots show the effects on the coefficient of variation (CV) (i), mean (ii), mode (iii) and percentage of seeds that germinated (iv) for the resulting germination time distributions. Each panel shows the result of five stochastic simulations for 4000 seeds, each plotted in a different colour. Parameter values for the high and low variability lines simulations are the same with the exception of the ABA threshold for I production (θI,ABA = 7 for the low variability lines and θI,ABA = 5.8 for the high variability lines). See Materials and methods for further simulation details and parameter values. (B) Experimental ABA dose response for six high variability MAGIC lines (left) and six low variability lines (five MAGIC lines plus Col-0) (right). (B) (i) shows mean CVs of individual lines for different exogenous ABA concentrations (means are of at least two independent experiments), (ii) as for (i) but for mean days to germination, (iii) mode days to germination and (iv) percentage germination. Treatments with ‘0’ μM are vehicle control treatments. Figure 6—figure supplement 1 shows exogenous addition of gibberellic acid (GA) in the model and experimentally to the high and low variability lines. Figure 6—figure supplement 2 shows simulated germination time distributions for selected concentrations of exogenous ABA and GA. Figure 6—figure supplement 3 shows the results of nullcline analysis in the presence of exogenous ABA and GA. Figure 6—figure supplement 4 shows the effects of exogenous ABA and GA on germination time distributions for example high and low variability lines. Figure 6—source data 1 contains source data for (B).

