Abstract
Aims
Since dietary sodium intake has been identified as a risk factor for cardiovascular disease and premature death, a high sodium intake can be expected to curtail life span. We tested this hypothesis by analysing the relationship between sodium intake and life expectancy as well as survival in 181 countries worldwide.
Methods and results
We correlated age-standardized estimates of country-specific average sodium consumption with healthy life expectancy at birth and at age of 60 years, death due to non-communicable diseases and all-cause mortality for the year of 2010, after adjusting for potential confounders such as gross domestic product per capita and body mass index. We considered global health estimates as provided by World Health Organization. Among the 181 countries included in this analysis, we found a positive correlation between sodium intake and healthy life expectancy at birth (β = 2.6 years/g of daily sodium intake, R 2 = 0.66, P < 0.001), as well as healthy life expectancy at age 60 (β = 0.3 years/g of daily sodium intake, R 2 = 0.60, P = 0.048) but not for death due to non-communicable diseases (β = 17 events/g of daily sodium intake, R 2 = 0.43, P = 0.100). Conversely, all-cause mortality correlated inversely with sodium intake (β = −131 events/g of daily sodium intake, R 2 = 0.60, P < 0.001). In a sensitivity analysis restricted to 46 countries in the highest income class, sodium intake continued to correlate positively with healthy life expectancy at birth (β = 3.4 years/g of daily sodium intake, R 2 = 0.53, P < 0.001) and inversely with all-cause mortality (β = −168 events/g of daily sodium intake, R 2 = 0.50, P < 0.001).
Conclusion
Our observation of sodium intake correlating positively with life expectancy and inversely with all-cause mortality worldwide and in high-income countries argues against dietary sodium intake being a culprit of curtailing life span or a risk factor for premature death. These data are observational and should not be used as a base for nutritional interventions.
Keywords: Sodium intake • Salt • Diet • Life expectancy • All-cause mortality • Cardiovascular disease • Hypertension • Blood Pressure
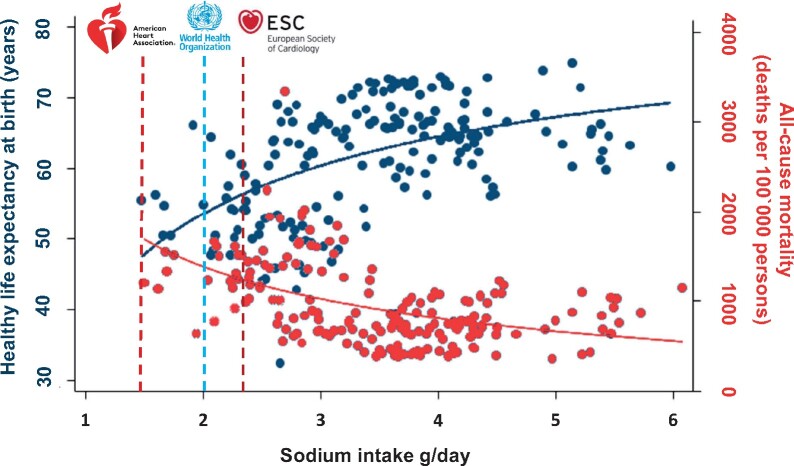
Graphical Abstract
See page 2113 for the editorial comment on this article (doi: 10.1093/eurheartj/ehaa1086)
See page 2116 for the editorial comment on this article (doi: 10.1093/eurheartj/ehaa1093)
Introduction
For more than a century, ever since the pioneering work of Ambard and Beaujart,1 the pathophysiological link between dietary salt intake and blood pressure has been scrutinized. Numerous publications claim to attest to the observation that a high sodium intake can trigger hypertensive cardiovascular disease de novo or accelerate pre-existing hypertension. For decades practicing physicians have warned their patients about an excessive salt intake. Organizations such as the World Health Organization (WHO), the American Heart Association, the European Society of Cardiology, and the Centers for Disease Control and Prevention (CDC) have published guidelines to reduce habitual salt intake not only for patients with hypertension but also for healthy normotensive subjects, commonly below 2 g of sodium (which corresponds to 5 g of salt). Previous publications informed the medical community that ‘Reducing dietary salt by 3 g per day is projected to reduce the annual number of new cases of coronary heart disease (CHD) by 60,000 to 120,000, stroke by 32,000 to 66,000, and myocardial infarction by 54,000 to 99,000 and to reduce the annual number of deaths from any cause by 44,000 to 92,000’ and that this intervention would ‘save $10 billion to $24 billion in health care costs annually’.2
If indeed salt has to be considered as a ‘cardiac nemesis’3 and must be held responsible for countless premature deaths, we can expect a high dietary sodium intake to curtail life span. We tested this hypothesis by analysing the relationship between sodium intake and life expectancy as well as all-cause and cause-specific mortality in 181 countries worldwide in an ecological study.
Methods
Study design and data collection
In an ecological study design, we evaluated any relationship of age-standardized estimates of country average sodium intake with outcome measures. We used several sources of data. In particular United Nations (UN) global health estimates (Supplementary material online, Table S1) were summarized, which include the WHO Global Health Observatory data repository for healthy life expectancy (http://apps.who.int/gho/data/view.main.HALEXv, last accessed 2 October 2018),4 the age-standardized body mass index (BMI) (http://apps.who.int/gho/data/node.main.A904?lang=en, last accessed 2 October 2018),5 the WHO global health estimates (http://www.who.int/healthinfo/global_burden_disease/estimates/en/, last accessed 11 July 2018),6 the UN data for gross domestic product (GDP) estimates (http://data.un.org, last accessed 8 July 2018),7 and the world bank analytic classifications for country-level classification in different income groups (gross national income per capita in US$) for 2010.8 For sodium intake, 2010 age-standardized estimated sodium intakes were taken from Powles et al.9
Outcomes
We considered the outcomes of healthy life expectancy at birth (years), healthy life expectancy at 60 years (years), death due to non-communicable diseases, and all-cause mortality for the year of 2010. For death due to non-communicable diseases and all-cause mortality, we used the age-standardized death rates (ASDR), which correspond to a weighted average of the age-specific mortality rates per 100 000 persons, where the weights are the proportions of persons in the corresponding age groups of the WHO standard population.10 The calculation of healthy life expectancy and healthy life expectancy at 60 years has been described in detail elsewhere.11 , 12 In short, healthy life expectancy is the average number of years that a person can expect to live in ‘full health’ at a given age by taking into account years lived in less than full health due to disease and/or injury. This calculation is based on estimates of years lost to disability adjusted for comorbidity, age, and sex. Thus, in contrast to ASDR, healthy life expectancy also reflects disability caused by cardiovascular disease, e.g. stroke. We divided the GDP by the WHO population counts per thousand and omitted all data from Haiti because of the excessive death toll following the earthquake on 12 January 2010. To test the validity of our findings we used a falsification hypothesis, i.e. a claim that is distinct from the one being tested that is highly unlikely to be causally related to the intervention in question.13 Our falsification hypothesis consisted in possibility that sodium intake could also be associated with the increased risk of death from non-communicable diseases.
Statistical analysis
We initially used linear regression analyses to assess the association of sodium intake and the above-mentioned outcomes. However, we found a non-linear relationship between daily sodium intake in country level and the outcomes of interest. Therefore, we also applied quantile regression analyses to investigate the robustness of our initial findings and evaluate whether the influence of sodium intake is different for countries with lower life expectancy or mortality rates from those with average or higher ends of our outcomes distribution. The quantile regression parameter estimates the change in a specified quantile of the outcome of interest produced by one unit change in the sodium intake. This approach allows comparing how some percentiles of the outcome may be more affected by sodium intake than other percentiles. This is reflected in the change in the size of the regression coefficient. In addition, because quantile regression models the median rather than the mean, quantile regression generally yields more accurate coefficients for skewed datasets, with fewer covariates emerging as significant. Since life expectancy has been previously shown to correlate with the GDP14 and sodium intake correlates with BMI,15 we adjusted our analyses for both and their interaction term. We considered GDP in 2010 US dollars and the age-standardized BMI as a surrogate for calorie intake to control for country-level socio-economic development. For each explanatory variable tested, we used data from the same year (2010) that the information on sodium intake and outcomes was undertaken.
To further account for unadjusted confounders due to inequality between high- and low-income countries and since communicable, maternal, perinatal, and nutritional conditions and injuries are more prevalent causes of death in low-income countries, we performed a sensitivity analysis restricted to high-income countries (gross national income per capita) as defined by the World Bank.8 Out of 181 countries, 46 with the highest gross national income per capita were included in this sensitivity analysis (Supplementary material online, Table S1). All analyses were performed using Stata 15.0 (StataCorp. 2017. Stata Statistical Software: Release 15. College Station, TX: StataCorp LLC).
Results
Distribution of sodium consumption and life expectancy
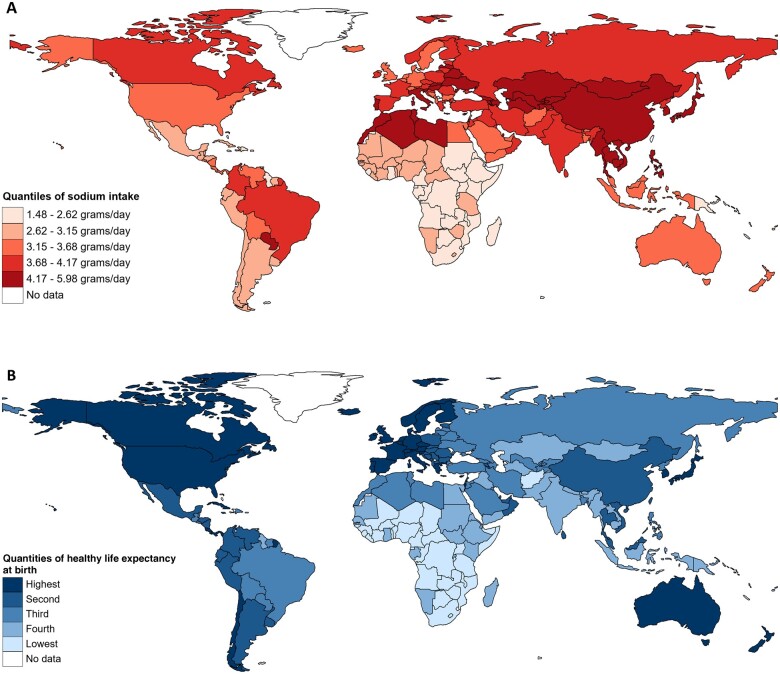
Figure 1A delineates the distribution of quintiles of sodium consumption across the 181 countries worldwide. Overall, sodium consumption varied from a high of 5.98 g in Kazakhstan to a low of 1.48 g in Kenya (Supplementary material online, Table S1). Figure 1B shows the distribution of quintiles of life expectancy across the 181 countries worldwide. Overall, healthy life expectancy at birth varied from a high of 74.8 years in Singapore to a low of 42.7 years in Central African Republic and healthy life expectancy at age 60 varied from a high of 20.3 years in Japan to a low of 9.8 years in Sierra Leone (Supplementary material online, Table S1).
Figure 1.
Distribution of quintiles of sodium intake (g/day) (A) and healthy life expectancy at birth (B) for the year of 2010 in 181 countries worldwide.
Sodium consumption and outcomes
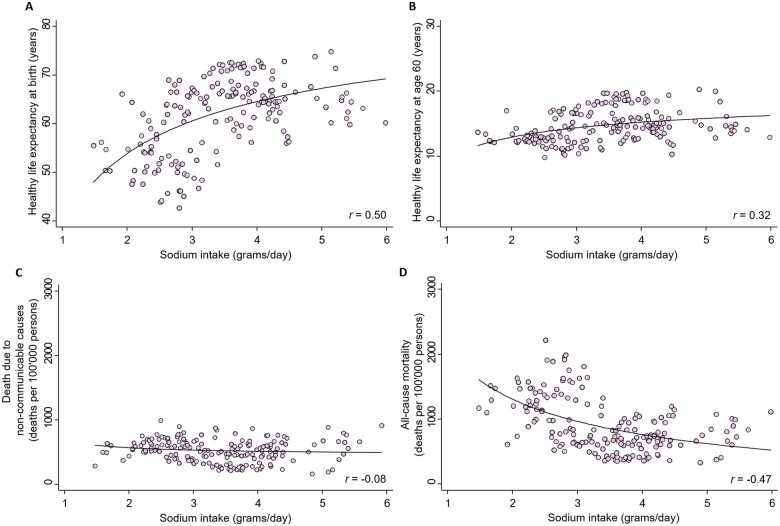
In the unadjusted analysis (Supplementary material online, Tables S2 and S3), we found a positive correlation between sodium intake and life expectancy at birth as well as life expectancy at age 60 (Figure 2). A non-linear exponential model provided a better fit16 indicating that life expectancy increased up to a sodium intake of 4–5 g/day (corresponding to a salt intake of 10–12.5 g/day), flattened out, and slightly decreased with higher values. We found no correlation between sodium intake and death due to non-communicable diseases. In contrast, all-cause mortality was negatively correlated with sodium intake (Figures 2 and 3).
Figure 2.
Scatterplots of sodium intake (g/day) for the year of 2010 and healthy life expectancy at birth, healthy life expectancy at age 60, age-standardized death rates of death due to non-communicable diseases and all-cause mortality in 181 countries worldwide (A–D, respectively).
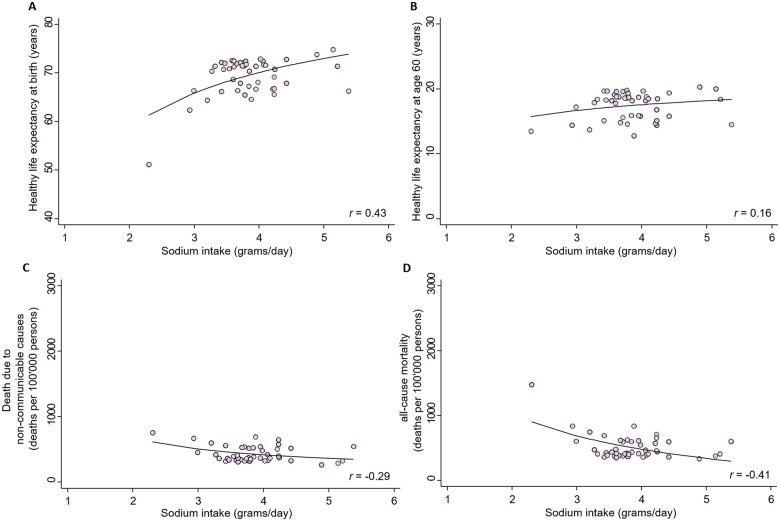
Figure 3.
Scatterplots of sodium intake (g/day) for the year of 2010 and healthy life expectancy at birth, healthy life expectancy at age 60, age-standardized death rates of death due to non-communicable diseases and all-cause mortality in 46 high-income countries (A–D, respectively).
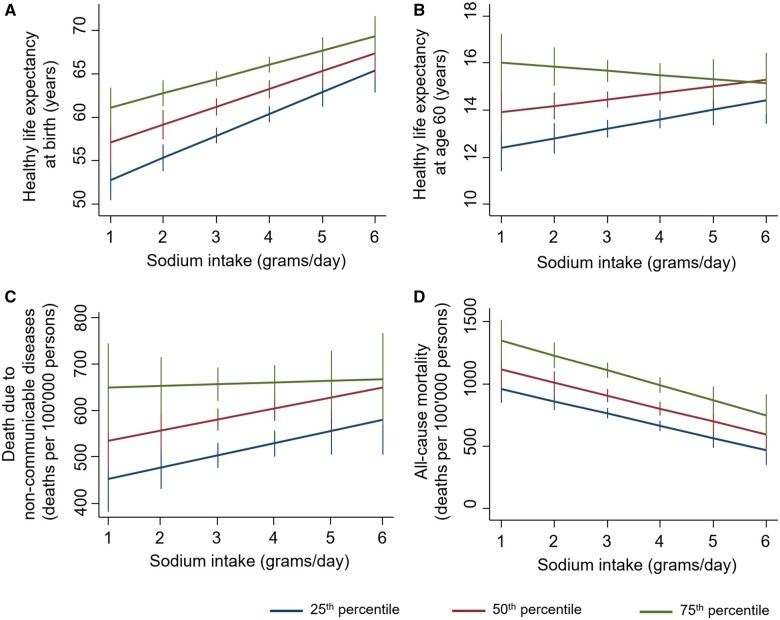
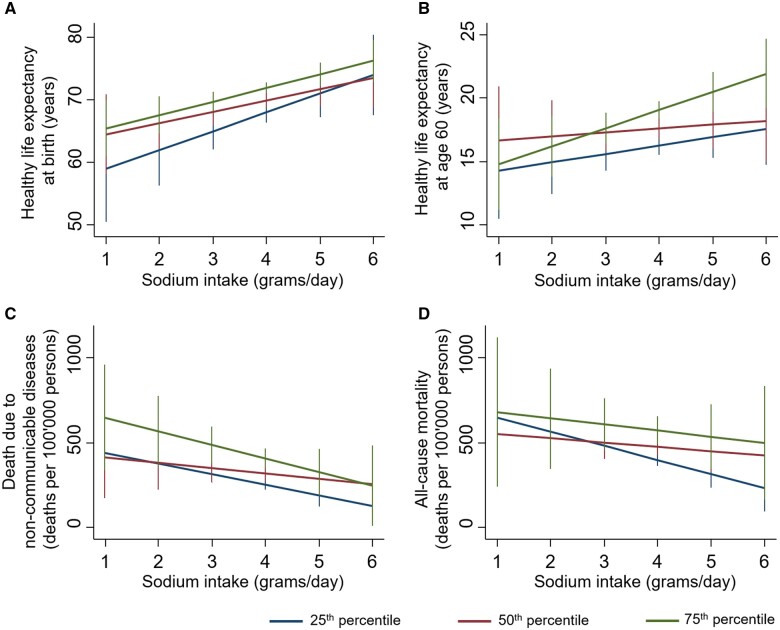
In the multivariable regression models after adjustment for GDP and BMI, correlations between sodium intake and life expectancy at birth, life expectancy at age 60, and all-cause mortality remained strong, consistent, and significant (Figure 4 and Table 1). In a sensitivity analysis, we focused on the 46 countries with the highest gross national income per capita (according to the World Bank8) only. Sodium intake, adjusted for GDP and BMI continued to correlate positively with life expectancy at birth (R 2 = 0.53, P < 0.001) and negatively with all-cause mortality (R 2 = 0.50, P < 0.001), but the correlation with life expectancy at age 60 was no longer significant (Figure 5 and Table 2). Similarly, sodium intake, adjusted for GDP and BMI, was correlated with life expectancy at birth in high, lower-middle, and low-income countries (correlation coefficients of 0.43, 0.47, and 0.42 respectively) but not in upper-middle-income countries (correlation coefficient of 0.07) according to the World Bank Classification. Sodium intake was found not to be correlated with death due to non-communicable diseases neither in the main nor in the sensitivity adjusted analysis (Tables 1 and 2).
Figure 4.
Quantile regression of sodium intake (g/day) in 181 countries worldwide for the year of 2010 and healthy life expectancy at birth (A), healthy life expectancy at age 60 (B), age-standardized death rates of death due to non-communicable diseases (C) and all-cause mortality (D) adjusted for gross domestic product per capita and age-standardized body mass index.
Table 1.
Multivariable regression for sodium intake for the year of 2010 adjusted for gross domestic product per capita and age-standardized body mass index for 181 countries worldwide
| Sodium intake (g/day) | 181 countries worldwide |
|||
|---|---|---|---|---|
| Healthy life expectancy at birth | Healthy life expectancy at age 60 | Death due to non-communicable diseases | All-cause mortality | |
| Linear regression | ||||
| β-Coefficient (95% CI) | 2.57 (1.82 to 3.33) | 0.27 (0.01 to 0.54) | 17 (−3.13 to 37) | −131 (−176 to −87) |
| P-value | <0.001 | 0.048 | 0.100 | <0.001 |
| R 2 | 0.66 | 0.60 | 0.43 | 0.60 |
| Quantile regression | ||||
| 25th percentile | ||||
| β-Coefficient (95% CI) | 2.51 (1.58 to 3.44) | 0.41 (0.03 to 0.79) | 25 (−2.21 to 52) | −99 (−142 to −56) |
| P-value | <0.001 | 0.035 | 0.071 | <0.001 |
| R 2 | 0.48 | 0.34 | 0.32 | 0.37 |
| 50th percentile | ||||
| β-Coefficient (95% CI) | 2.05 (1.04 to 3.06) | 0.27 (−0.07 to 0.62) | 23 (−1.29 to 47) | −104 (−157 to −52) |
| P-value | <0.001 | 0.120 | 0.063 | <0.001 |
| R 2 | 0.43 | 0.40 | 0.28 | 0.39 |
| 75th percentile | ||||
| β-Coefficient (95% CI) | 1.64 (0.76 to 2.52) | −0.17 (−0.65 to 0.30) | 3.72 (−33 to 40) | −121 (−184 to −58) |
| P-value | <0.001 | 0.470 | 0.842 | <0.001 |
| R 2 | 0.40 | 0.42 | 0.20 | 0.41 |
CI, confidence interval.
Figure 5.
Quantile regression of sodium intake (g/day) in 46 high-income countries for the year of 2010 and healthy life expectancy at birth (A), healthy life expectancy at age 60 (B), age-standardized death rates of death due to non-communicable diseases (C), and all-cause mortality (D) adjusted for gross domestic product per capita and age-standardized body mass index.
Table 2.
Multivariable regression for sodium intake for the year of 2010 adjusted for gross domestic product per capita and age-standardized body mass index for 46 countries classified as high-income countries by the World Bank
| Sodium intake (g/day) | 46 countries of high income |
|||
|---|---|---|---|---|
| Healthy life expectancy at birth | Healthy life expectancy at age 60 | Death due to non- communicable diseases | All-cause mortality | |
| Linear regression | ||||
| β-Coefficient (95% CI) | 3.41 (1.79 to 5.02) | 0.34 (−0.64 to 1.31) | −52 (−106 to 1.17) | −168 (−251 to −86) |
| P-value | <0.001 | 0.488 | 0.055 | <0.001 |
| R 2 | 0.53 | 0.38 | 0.43 | 0.50 |
| Quantile regression | ||||
| 25th percentile | ||||
| β-Coefficient (95% CI) | 3.02 (0.01 to 6.03) | 0.66 (−0.67 to 2.0) | −51 (−94 to −7.78) | −83 (−148 to −19) |
| P-value | 0.050 | 0.321 | 0.020 | 0.013 |
| R 2 | 0.28 | 0.32 | 0.17 | 0.11 |
| 50th percentile | ||||
| β-Coefficient (95% CI) | 1.79 (−0.45 to 4.04) | 0.31 (−1.20 to 1.82) | −26 (−94 to 44) | − 26 (−123 to 71) |
| P-value | 0.115 | 0.681 | 0.460 | 0.600 |
| R 2 | 0.23 | 0.21 | 0.22 | 0.18 |
| 75th percentile | ||||
| β-Coefficient (95% CI) | 2.17 (0.58 to 3.75) | 1.43 (0.15 to 2.72) | −66 (−156 to 25) | −36 (−193 to 121) |
| P-value | 0.009 | 0.029 | 0.150 | 0.640 |
| R 2 | 0.15 | 0.14 | 0.29 | 0.24 |
CI, confidence interval.
Discussion
The principal findings of the present analysis are daily sodium intake correlates positively with healthy life expectancy at birth as well as healthy life expectancy after age 60 and inversely with all-cause mortality in 181 countries worldwide. With regard to life expectancy, a better fitting non-linear exponential model16 documented a progressive increase up to a peak sodium intake of 4–5 g/day (corresponding to a salt intake of 10–12.5 g/day) and a slight decrease with higher values. Since healthy life expectancy, whether at birth or at age 60, by definition covers a much longer time span than does estimated daily sodium intake, we also related daily sodium consumption to age-standardized all-cause mortality and found a significant inverse correlation. Adjustment of these correlations for possible confounders such as GDP and BMI as a surrogate for calorie intake did only minimally change their significance. Only in the subgroup with the highest life expectancy after age 60 (75th percentile) there was no statistical significance with sodium intake. Similarly, the adjusted correlations between sodium intake and life expectancy at birth and all-cause mortality remained significant in the subgroup of countries with the highest per capita income. As can be seen on the graphical abstract current recommendations of sodium intake by AHA, WHO and ESC are associated with rather low life expectancy and high mortality. Attesting to the specificity and validity of the above findings is the tested falsification analysis,13 which failed to document a correlation between sodium intake and death due to non-communicable disease.
The present findings are startling in view of the numerous studies showing a direct association between dietary sodium intake and blood pressure. However, in most studies, the slope of the correlation between sodium intake and blood pressure is rather shallow.17 In a recent comprehensive Cochrane meta-analysis,18 sodium reduction from an average high usual intake (203 mmol/day) to an average level of 65 mmol/day resulted in a decrease in the systolic/diastolic blood pressure of 1.1/0 and 5.7/2.9 mmHg in participants with normotension and hypertension, respectively. Weak evidence indicated that these effects may be a little greater in black and Asian subjects.
In this context, we should mention that blood pressure merely remains a surrogate endpoint that not consistently parallels outcome endpoints of death, heart attack, and stroke. Attesting to this is the documents19–22 showing that too low sodium intake may increase morbidity and mortality despite the fact that blood pressure continues to decline. Graudal et al. 18 recently reported a significant increase in renin, aldosterone, noradrenaline, cholesterol, and triglyceride with low sodium intake as compared with high sodium intake. In addition, a reduced dietary sodium intake has been shown to increase resting heart rate, a well-known cardiovascular risk factor, as it decreases blood pressure.23 Not surprisingly, as reported in a meta-analysis, a U-shape curve seems to best describe the relationship between sodium intake and health outcomes.24 Thus, for sodium as for any other nutrient, such U-shape curve simply reflects that both an excessively low and an excessively high intake may prove to be harmful. However, what increasingly becomes clear in the sodium saga is that, although blood pressure correlates to some extent with sodium intake, there may be a paradoxical discrepancy between blood pressure and hard endpoints such as life expectancy and death. As the present data document, life expectancy increases (up to a point) and mortality decreases with sodium intake.
A recent review25 encompassing a total of 277 trials, 24 interventions, and 992 129 participants purported moderate-certainty evidence that reduced salt intake decreased the risk for all-cause mortality in normotensive participants and cardiovascular mortality in hypertensive participants. However, after a pointed letter to the editor,26 the effect of low salt intake had to be changed from being protective to non-significant.27 Whereas the benefits of a low salt diet were prominently displayed in the original article, their absence is hardly mentioned in the corrected version. Such unexpected vanishing of benefits due to statistical manipulations further attest to the muddiness of the waters regarding outcomes with sodium restriction.
How to optimally estimate sodium intake has been a matter of hot debate for years. Urine collections however done are prone to random measurement error, which give rise to dilution bias. Such dilution bias will tend to lessen statistical significance of the results.28 The mere fact that our sodium–life expectancy/mortality correlations remain significant, despite possible dilution bias because of urinary sodium values attests to their strength.
Current evidence, despite methodological limitations, suggests that most of the world's population consume a moderate range of dietary sodium (2.3-4.6 g/day; 1-2 teaspoons of salt) that is not associated with increased cardiovascular risk, and that the risk of cardiovascular disease only increases when sodium intakes exceed 5 g/day.29
Of note however, our data are strictly observational and should not be used as a base for nutritional interventions. We therefore purposefully refrain from making any projections or dietary recommendations as time and again were inappropriately made2 , 25 with regard to reducing sodium intake despite the lack of evidence of hard endpoints. Whether changing sodium intake ultimately will affect life expectancy or all-cause mortality, individually or at country level remains unknown and cannot be inferred from the present data.
Limitations
Our study has several limitations inherent to ecological studies. In an ecological analysis, there is a significant risk of committing the ‘Simpson’s paradox’, i.e. the risk that the overall association is the opposite of the association in the individual countries or groups of countries, the extent of which in this analysis cannot be quantified. Estimation of sodium intake based on one 24-h urine collection may not represent the average sodium consumption during lifetime and Powles et al.9 reported a larger statistical uncertainty around the estimated intakes for the individual countries, especially for estimates for countries without primary data. Restricting the analysis to high-income countries where primary data sources were available for 70% of the countries minimizes this potential confounder. The limitations of calculating healthy life expectancy have been described in detail elsewhere.30 Furthermore, the estimation of healthy life expectancy at birth is, in part, determined by dietary variables and, thus, potentially by sodium intake. Thus, the variables of the correlation between sodium intake and healthy life expectancy may not be entirely independent. Although our sensitivity analysis restricted to high-income countries showed the same correlation, reverse causality underlying these results cannot entirely been ruled out. In lower-middle- and low-income countries, malnutrition will result in greater mortality and reduced lifespan associated but not caused by reduced sodium intake. In addition, determinants such as GDP and BMI are prone to fluctuate during lifetime. In our analysis, dietary sodium intake is estimated at a single time point whereas life expectancy and mortality potentially reflect the effects of sodium intake over many years and decades. However, it has been well documented that sodium intake is remarkably consistent over time.31 Finally, we used country-level aggregate data with correlation and regression analysis to investigate any associations, which is an over-simplification of a complex problem32 and our findings should not be considered to be representative at an individuals’ level. In our data set, the number of potential confounders is infinite, which is notable among the countries identified as ‘low sodium countries’ and ‘low life expectancy’, which are in sub-Saharan Africa where the causes for low life expectancy are manifold, a clustering of low sodium and high mortality countries, which accounts for the non-linear relationships observed in this study. However, as experimentally shown by the group of Folkow,33 too low a sodium intake may exert deleterious effects particularly when there is a risk of dehydration and volume depletion.
Conclusions
Our observation of sodium intake correlating positively with life expectancy at birth and at age 60, and inversely with all-cause mortality in 181 countries worldwide and in the 46 countries with the highest per capita income, argues against dietary sodium intake being a culprit of curtailing life span or being a risk factor for premature deaths. Our data are observational and should not be used as a base for nutritional interventions.
Supplementary material
Supplementary material is available at European Heart Journal online.
Authors’ contributions
F.H.M. wrote the manuscript, was involved with the interpretation of results, had full access to all the data in the study, and had final responsibility for the decision to submit for publication. L.H. had the primary responsibility for acquiring the data, was involved with the interpretation of results, reviewed and commented on drafts. L.S. did the analysis, interpreted the results, reviewed and commented on drafts. E.R. reviewed and commented on the data analysis and drafts. G.C.M.S. was involved in the data analysis, interpreted the results, reviewed, and commented on the drafts. C.S. reviewed and commented on the data analysis and drafts. S.B. reviewed and commented on the data analysis and drafts. All authors provided comments on the final version of the manuscript.
Conflict of interest: F.H.M. has served as a consultant or advisor for Pfizer, Medtronic, WebMD, Menarini, American College of Cardiology, and Sandoz. G.C.M.S. reports honoraria from Abbott outside the submitted work. S.B. is on the advisory board of Abbott Vascular, Amgen, Reata, Biotronik, and Pfizer; has received research grants from Abbott Vascular and the National Heart, Lung, and Blood Institute (U01HL117905); and has received honoraria from Abbott, Abbott Vascular, Biotronik, Amgen, and Pfizer. All other authors declare no competing interests.
Supplementary Material
Contributor Information
Franz H Messerli, Swiss Cardiovascular Center, Bern University Hospital, University of Bern, Freiburgstr. 18, Bern 3010, Switzerland; Jagiellonian University, Krakow, Poland; Division of Cardiology, Mount Sinai Health Medical Center, Icahn School of Medicine, New York, NY, USA.
Louis Hofstetter, Swiss Cardiovascular Center, Bern University Hospital, University of Bern, Freiburgstr. 18, Bern 3010, Switzerland.
Lamprini Syrogiannouli, Institute of Primary Health Care (BIHAM), University of Bern, Bern, Switzerland.
Emrush Rexhaj, Swiss Cardiovascular Center, Bern University Hospital, University of Bern, Freiburgstr. 18, Bern 3010, Switzerland.
George C M Siontis, Swiss Cardiovascular Center, Bern University Hospital, University of Bern, Freiburgstr. 18, Bern 3010, Switzerland.
Christian Seiler, Swiss Cardiovascular Center, Bern University Hospital, University of Bern, Freiburgstr. 18, Bern 3010, Switzerland.
Sripal Bangalore, The Leon H. Charney Division of Cardiology, New York University School of Medicine, New York, NY, USA.
References
- 1. Ambard LB, Beaujart E. Hypertension artérielle et rétention chlorurée. Société de Biologie; 1904.
- 2. Bibbins-Domingo K, Chertow GM, Coxson PG, Moran A, Lightwood JM, Pletcher MJ, Goldman L. Projected effect of dietary salt reductions on future cardiovascular disease. N Engl J Med 2010;362:590–599. [DOI] [PMC free article] [PubMed] [Google Scholar]
- 3. Dennison AD Jr., Salt; the cardiac's nemesis. J Med Soc N J 1949;46:139–141. [PubMed] [Google Scholar]
- 4.WHO. Healthy life expectancy (HALE). Data by country. http://apps.who.int/gho/data/view.main.HALEXv (2 October 2018).
- 5.WHO. Mean body mass index trends among adults, age-standardized (kg/m2). Estimates by country. http://apps.who.int/gho/data/node.main.A904?lang=en (2 October 2018).
- 6.WHO. Health statistics and information systems. Disease burden and mortality estimates. Cause-specific mortality, 2000–2016. http://www.who.int/healthinfo/global_burden_disease/estimates/en/ (11 July 2018).
- 7.UN. Popular statistical tables, country (area) and regional profiles. data.un.org/ (2 October 2018).
- 8.World Bank. World Bank Analytical Classifications. siteresources.worldbank.org/DATASTATISTICS/Resources/OGHIST.xls (24 February 2019).
- 9. Powles J, Fahimi S, Micha R, Khatibzadeh S, Shi P, Ezzati M, Engell RE, Lim SS, Danaei G, Mozaffarian D; on behalf of the Global Burden of Diseases Nutrition and Chronic Diseases Expert Group (NutriCoDE). Global, regional and national sodium intakes in 1990 and 2010: a systematic analysis of 24 h urinary sodium excretion and dietary surveys worldwide. BMJ Open 2013;3:e003733. [DOI] [PMC free article] [PubMed] [Google Scholar]
- 10. Ahmad O, Boschi-Pinto C, Lopez AD, Murray JL, Lozano R, Inoue M. Age standardization of rates: a new who standard. GPE Discussion Paper Series No 31; 2001.
- 11.WHO. WHO methods for life expectancy and healthy life expectancy. https://www.who.int/healthinfo/statistics/LT_method_1990_2012.pdf (2 October 2018).
- 12.WHO. Healthy life expectancy (HALE) at birth. http://apps.who.int/gho/data/node.wrapper.imr?x-id=66 (2 October 2018).
- 13. Prasad V, Jena AB. Prespecified falsification end points: can they validate true observational associations? JAMA 2013;309:241–242. [DOI] [PubMed] [Google Scholar]
- 14. Preston S. The changing relation between mortality and level of economic development. Popul Stud 1975;29:231–248. [PubMed] [Google Scholar]
- 15. Zhao L, Cogswell ME, Yang Q, Zhang Z, Onufrak S, Jackson SL, Chen T-C, Loria CM, Wang C-Y, Wright JD, Terry AL, Merritt R, Ogden CL. Association of usual 24-h sodium excretion with measures of adiposity among adults in the United States: NHANES, 2014. Am J Clin Nutr 2019;109:139–147. [DOI] [PMC free article] [PubMed] [Google Scholar]
- 16. Messerli FH, Hofstetter L, Bangalore S. Salt and heart disease: a second round of “bad science”? Lancet 2018;392:456–458. [DOI] [PubMed] [Google Scholar]
- 17. Yusuf S, Rangarajan S, Teo K, Islam S, Li W, Liu L, Bo J, Lou Q, Lu F, Liu T, Yu L, Zhang S, Mony P, Swaminathan S, Mohan V, Gupta R, Kumar R, Vijayakumar K, Lear S, Anand S, Wielgosz A, Diaz R, Avezum A, Lopez-Jaramillo P, Lanas F, Yusoff K, Ismail N, Iqbal R, Rahman O, Rosengren A, Yusufali A, Kelishadi R, Kruger A, Puoane T, Szuba A, Chifamba J, Oguz A, McQueen M, McKee M, Dagenais G. Cardiovascular risk and events in 17 low-, middle-, and high-income countries. N Engl J Med 2014;371:818–827. [DOI] [PubMed] [Google Scholar]
- 18. Graudal NA, Hubeck-Graudal T, Jurgens G. Effects of low sodium diet versus high sodium diet on blood pressure, renin, aldosterone, catecholamines, cholesterol, and triglyceride. Cochrane Database Syst Rev 2020;12:CD004022. [DOI] [PMC free article] [PubMed] [Google Scholar]
- 19. O'Donnell MJ, Yusuf S, Mente A, Gao P, Mann JF, Teo K, McQueen M, Sleight P, Sharma AM, Dans A, Probstfield J, Schmieder RE. Urinary sodium and potassium excretion and risk of cardiovascular events. JAMA 2011;306:2229–2238. [DOI] [PubMed] [Google Scholar]
- 20. Stolarz-Skrzypek K, Kuznetsova T, Thijs L, Tikhonoff V, Seidlerová J, Richart T, Jin Y, Olszanecka A, Malyutina S, Casiglia E, Filipovský J, Kawecka-Jaszcz K, Nikitin Y, Staessen JA Fatal and nonfatal outcomes, incidence of hypertension, and blood pressure changes in relation to urinary sodium excretion. JAMA 2011;305:1777–1785. [DOI] [PubMed] [Google Scholar]
- 21. Mente A, O'Donnell M, Rangarajan S, McQueen M, Dagenais G, Wielgosz A, Lear S, Ah STL, Wei L, Diaz R, Avezum A, Lopez-Jaramillo P, Lanas F, Mony P, Szuba A, Iqbal R, Yusuf R, Mohammadifard N, Khatib R, Yusoff K, Ismail N, Gulec S, Rosengren A, Yusufali A, Kruger L, Tsolekile LP, Chifamba J, Dans A, Alhabib KF, Yeates K, Teo K, Yusuf S. Urinary sodium excretion, blood pressure, cardiovascular disease, and mortality: a community-level prospective epidemiological cohort study. Lancet 2018;392:496–506. [DOI] [PubMed] [Google Scholar]
- 22. Williams B, Mancia G, Spiering W, Agabiti Rosei E, Azizi M, Burnier M, Clement DL, Coca A, de Simone G, Dominiczak A, Kahan T, Mahfoud F, Redon J, Ruilope L, Zanchetti A, Kerins M, Kjeldsen SE, Kreutz R, Laurent S, Lip GYH, McManus R, Narkiewicz K, Ruschitzka F, Schmieder RE, Shlyakhto E, Tsioufis C, Aboyans V, Desormais I, De Backer G, Heagerty AM, Agewall S, Bochud M, Borghi C, Boutouyrie P, Brguljan J, Bueno H, Caiani EG, Carlberg B, Chapman N, Cífková R, Cleland JGF, Collet J-P, Coman IM, de Leeuw PW, Delgado V, Dendale P, Diener H-C, Dorobantu M, Fagard R, Farsang C, Ferrini M, Graham IM, Grassi G, Haller H, Hobbs FDR, Jelakovic B, Jennings C, Katus HA, Kroon AA, Leclercq C, Lovic D, Lurbe E, Manolis AJ, McDonagh TA, Messerli F, Muiesan ML, Nixdorff U, Olsen MH, Parati G, Perk J, Piepoli MF, Polonia J, Ponikowski P, Richter DJ, Rimoldi SF, Roffi M, Sattar N, Seferovic PM, Simpson IA, Sousa-Uva M, Stanton AV, van de Borne P, Vardas P, Volpe M, Wassmann S, Windecker S, Zamorano JL, Windecker S, Aboyans V, Agewall S, Barbato E, Bueno H, Coca A, Collet J-P, Coman IM, Dean V, Delgado V, Fitzsimons D, Gaemperli O, Hindricks G, Iung B, Jüni P, Katus HA, Knuuti J, Lancellotti P, Leclercq C, McDonagh TA, Piepoli MF, Ponikowski P, Richter DJ, Roffi M, Shlyakhto E, Simpson IA, Sousa-Uva M, Zamorano JL, Tsioufis C, Lurbe E, Kreutz R, Bochud M, Rosei EA, Jelakovic B, Azizi M, Januszewics A, Kahan T, Polonia J, van de Borne P, Williams B, Borghi C, Mancia G, Parati G, Clement DL, Coca A, Manolis A, Lovic D, Benkhedda S, Zelveian P, Siostrzonek P, Najafov R, Pavlova O, De Pauw M, Dizdarevic-Hudic L, Raev D, Karpettas N, Linhart A, Olsen MH, Shaker AF, Viigimaa M, Metsärinne K, Vavlukis M, Halimi J-M, Pagava Z, Schunkert H, Thomopoulos C, Páll D, Andersen K, Shechter M, Mercuro G, Bajraktari G, Romanova T, Trušinskis K, Saade GA, Sakalyte G, Noppe S, DeMarco DC, Caraus A, Wittekoek J, Aksnes TA, Jankowski P, Polonia J, Vinereanu D, Baranova EI, Foscoli M, Dikic AD, Filipova S, Fras Z, Bertomeu-Martínez V, Carlberg B, Burkard T, Sdiri W, Aydogdu S, Sirenko Y, Brady A, Weber T, Lazareva I, Backer TD, Sokolovic S, Jelakovic B, Widimsky J, Viigimaa M, Pörsti I, Denolle T, Krämer BK, Stergiou GS, Parati G, Trušinskis K, Miglinas M, Gerdts E, Tykarski A, de Carvalho Rodrigues M, Dorobantu M, Chazova I, Lovic D, Filipova S, Brguljan J, Segura J, Gottsäter A, Pechère-Bertschi A, Erdine S, Sirenko Y, Brady A; ESC Scientific Document Group. 2018 ESC/ESH Guidelines for the management of arterial hypertension. Eur Heart J 2018;39:3021–3104. [DOI] [PubMed] [Google Scholar]
- 23. Graudal NA, Hubeck-Graudal T, Jurgens G. Reduced dietary sodium intake increases heart rate. A meta-analysis of 63 randomized controlled trials including 72 study populations. Front Physiol 2016;7:111. [DOI] [PMC free article] [PubMed] [Google Scholar]
- 24. Graudal N, Jürgens G, Baslund B, Alderman MH. Compared with usual sodium intake, low- and excessive-sodium diets are associated with increased mortality: a meta-analysis. Am J Hypertens 2014;27:1129–1137. [DOI] [PubMed] [Google Scholar]
- 25. Khan SU, Khan MU, Riaz H, Valavoor S, Zhao D, Vaughan L, Okunrintemi V, Riaz IB, Khan MS, Kaluski E, Murad MH, Blaha MJ, Guallar E, Michos ED. Effects of nutritional supplements and dietary interventions on cardiovascular outcomes: an umbrella review and evidence map. Ann Intern Med 2019;171:190–198. [DOI] [PMC free article] [PubMed] [Google Scholar]
- 26. Pandey AC, Topol EJ. Dispense with supplements for improving heart outcomes. Ann Intern Med 2019;171:216–217. [DOI] [PMC free article] [PubMed] [Google Scholar]
- 27. Correction: effects of nutritional supplements and dietary interventions on cardiovascular outcomes. Ann Intern Med 2019. doi:10.7326/L19-0721. [DOI] [PMC free article] [PubMed] [Google Scholar]
- 28. Hutcheon JA, Chiolero A, Hanley JA. Random measurement error and regression dilution bias. BMJ 2010;340:c2289–c2289. [DOI] [PubMed] [Google Scholar]
- 29. O’donnell M, Mente A, Alderman MH, Brady AJB, Diaz R, Gupta R, López-Jaramillo P, Luft FC, Lüscher TF, Mancia G, Mann JFE, McCarron D, McKee M, Messerli FH, Moore LL, Narula J, Oparil S, Packer M, Prabhakaran D, Schutte A, Sliwa K, Staessen JA, Yancy C, Yusuf S. Salt and cardiovascular disease: insufficient evidence to recommend low sodium intake. Eur Heart J 2020;41:3363–3373. [DOI] [PubMed] [Google Scholar]
- 30. Salomon JA, Wang H, Freeman MK, Vos T, Flaxman AD, Lopez AD, Murray CJ. Healthy life expectancy for 187 countries, 1990–2010: a systematic analysis for the Global Burden Disease Study 2010. Lancet 2012;380:2144–2162. [DOI] [PubMed] [Google Scholar]
- 31. Meyer KA, Harnack LJ, Luepker RV, Zhou X, Jacobs DR, Steffen LM. Twenty-two-year population trends in sodium and potassium consumption: the Minnesota Heart Survey. J Am Heart Assoc 2013;2:e000478. [DOI] [PMC free article] [PubMed] [Google Scholar]
- 32. McCarron DA, Geerling JC, Alderman MH. Urinary sodium excretion measures and health outcomes. Lancet 2019;393:1294–1295. [DOI] [PubMed] [Google Scholar]
- 33. Ely DL, Folkow B, Paradise NF. Risks associated with dietary sodium reduction in the spontaneous hypertensive rat model of hypertension. Am J Hypertens 1990;3:650–660. [DOI] [PubMed] [Google Scholar]
Associated Data
This section collects any data citations, data availability statements, or supplementary materials included in this article.


